 Oleg Lobachev
 Moritz Berthold
 Henriette Pfeffer5
- 1Visual Computing, Angewandte Informatik V - Graphische Datenverarbeitung, Fakultät für Mathematik, Physik und Informatik, University of Bayreuth, Bayreuth, Germany
- 2Institute of Functional and Applied Anatomy, Hannover Medical School, Hannover, Germany
- 3Fachbereich Technik, Leibniz-Fachhochschule School of Business, Hannover, Germany
- 4BCM Solutions GmbH, Stuttgart, Germany
- 5Anatomy and Cell Biology, Medical Faculty, Philipps-University Marburg, Marburg, Germany
3D reconstruction is a challenging current topic in medical research. We perform 3D reconstructions from serial sections stained by immunohistological methods. This paper presents an immersive visualization solution to quality control (QC), inspect, and analyze such reconstructions. QC is essential to establish correct digital processing methodologies. Visual analytics, such as annotation placement, mesh painting, and classification utility, facilitates medical research insights. We propose a visualization in virtual reality (VR) for these purposes. In this manner, we advance the microanatomical research of human bone marrow and spleen. Both 3D reconstructions and original data are available in VR. Data inspection is streamlined by subtle implementation details and general immersion in VR.
1. Introduction
Visualization is a significant part of modern research. It is important not only to obtain images for visualization, but to be able to grasp and correctly interpret data. The perpetual question of visualization is whether the obtained model is close enough to reality. Further, the question arises how to discern important components and derive conclusions from the model. The method we present in this paper takes on this very generic problem statement, but our method is quite novel in the details. We use virtual reality for quality control (QC) and visual analytics (VA) of our 3D reconstructions in medical research. Figure 1A positions our tool in the visual computing methodology.
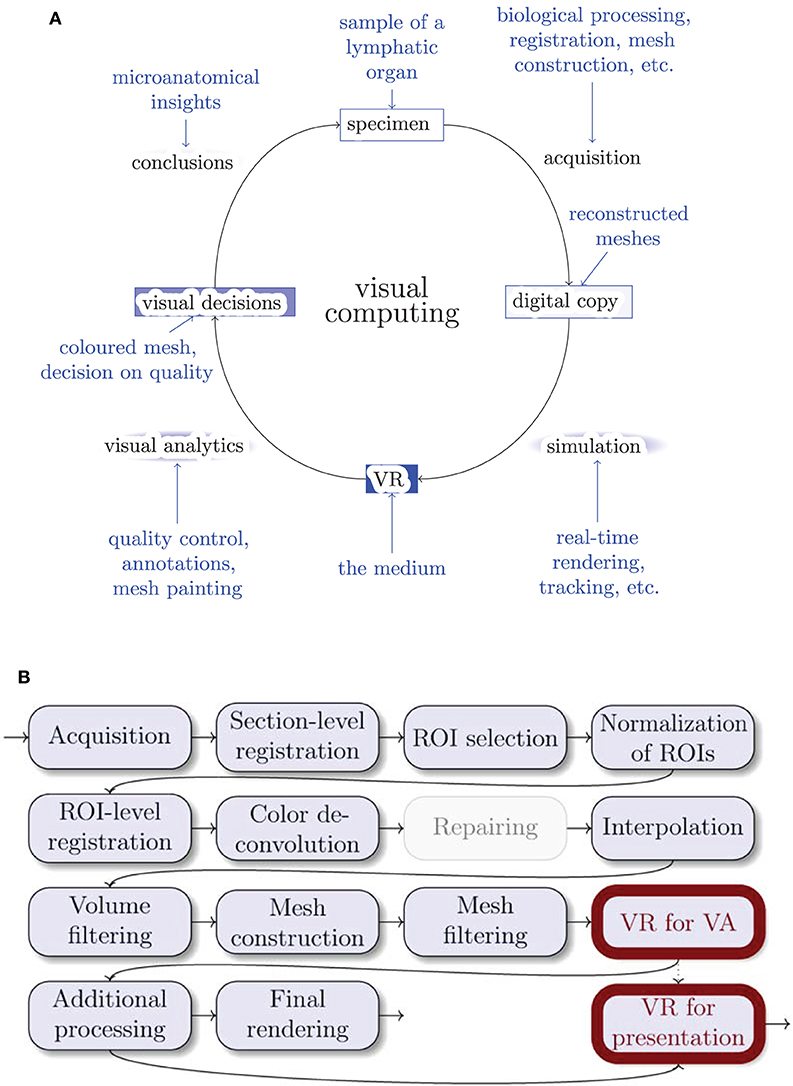
Figure 1. Where do we stand? (A) The general life cycle of visual computing (black) and our specific case (blue). The intensity of blue shading of the blocks highlights their importance for this paper. Blue arrows show facets of our implementation. (B) The outline of our 3D reconstruction pipeline. Gray nodes are not always used. ROI stands for “region of interest,” VA means “visual analytics.” Thick outlines are the major focus of this work.
3D reconstruction from histological serial sections closes a gap in medical research methodology. Conventional MRI, CT, and ultrasound methods do not have the desired resolution. This is also true for micro-CT and similar methods. Even worse, there is no way to identify the structures of interest in human specimens under non-invasive imaging techniques. In contrast, immunohistological staining provides a reliable method to mark specific kinds of molecules in the cells as long as these molecules can be adequately fixed after specimen removal. It is possible to unequivocally identify, e.g., the cells forming the walls of small blood vessels, the so-termed endothelial cells. Only a thin section of the specimen—typically about 7 μm thick—is immunostained to improve recognition in transmitted light microscopy. If larger structures, such as microvessel networks, are to be observed, multiple sections in a series (“serial sections”) need to be produced. These series are necessary, because paraffin sections cannot be cut at more than about 30 μm thickness due to mechanical restrictions. The staining solution can penetrate more than 30 μm of tissue. It is not possible up to now to generate focused z-stacks from immunostained thick sections in transmitted light. Hence, the information gathered from single sections is limited. Thus, registration is a must.
For 3D reconstruction, serial sections are digitally processed after obtaining large images of each section with a special optical scanning microscope. The resolution is typically in the range 0.11–0.5 μm/pixel, the probe may cover up to 1 cm2. With a our registration method (Lobachev et al., 2017b) we produce stacks of serial sections that are spatially correct. After some post-processing (e.g., morphological operations, but also an interpolation Lobachev et al., 2017a), a surface polygon structure (a mesh) is obtained from volume data with the marching cubes algorithm (Lorensen and Cline, 1987; Ulrich et al., 2014). Both the actual mesh construction and the post-processing operations feature some subjective decisions, most prominently, choice of an iso-value for mesh construction. Thus, it is necessary to demonstrate that the 3D reconstruction is correct.
We now present a method for controlling that 3D reconstructions tightly correspond to the original immunostained sections by directly comparing the reconstructions to the original serial sections. This method accelerates QC and mesh coloring. QC is facilitated by showing single sections in the visualized mesh, without volume rendering. We inspect, annotate, and color 3D models (directly compared to original data, the serial sections) in virtual reality (VR). Figure 2 documents a QC session from “outside.” The presented method has been extensively used in microanatomical research (Lobachev, 2018; Steiniger et al., 2018a,b, 2021; Lobachev et al., 2019).
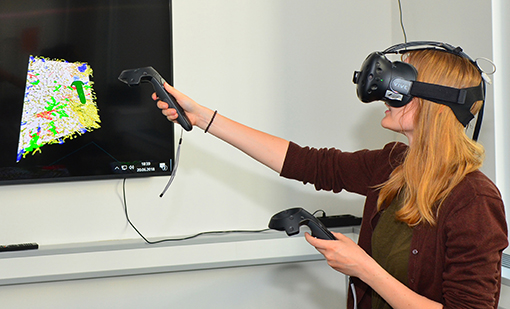
Figure 2. A user in VR. The large display mirrors the headset image.
Our domain experts are much better trained in distinguishing and analyzing details in stained histological sections than in reconstructed meshes. However, only 3D reconstructions provide an overview of continuous structures spanning multiple sections, e.g., blood vessels.
Further, the reconstructed mesh permits novel findings. In our prior experience, domain experts often encounter problems when trying to understand 3D arrangements using conventional mesh viewers. For this reason, we previously showed pre-rendered videos to the experts to communicate the reconstruction results and to enable detailed inspection. Videos are, however, limited by the fixed direction of movement and the fixed camera angle. Our experience with non-immersive interactive tools has been negative, both with standard (Cignoni et al., 2008) and with custom (Supplementary Figure 1) software. Further, our data suffer from a high degree of self-occlusion. In VR the user can move freely and thus intuitively control the angle of view and the movement through the model. In our experience, immersion allows for much easier and more thorough inspection of visualized data. Occlusion of decisive structures in the reconstruction does no longer pose a problem.
1.1. Contributions
We present a modern, immersive VR approach for inspection, QC, and VA of histological 3D reconstructions. Some of the reconstructed meshes are highly self-occluding, we are able to cope with this problem. For QC, the original data is simultaneously displayed with the reconstruction. User annotations and mesh painting facilitate VA. With our application, novel research results concerning the microanatomy of human spleens became viable for the first time; our findings have been established and published in a series of papers (Steiniger et al., 2018a,b, 2021).
2. Related Work
2.1. Immersive Visualization
Immersive visualization is not at all a new idea, Brooks (1999) quotes a vision of Sutherland (1965, 1968, 1970). However, an immersive scientific visualization was quite hard to obtain in earlier years, if a multi-million-dollar training simulation was to be avoided (van Dam et al., 2000). The availability of inexpensive hardware such as Oculus Rift or HTC Vive head-mounted displays (HMD) has massively changed the game recently. This fact (and the progress in GPU performance) allows for good VR experiences on commodity hardware. Immersive visualization has been previously suggested for molecular visualization (Stone et al., 2010), for medical volumetric data (Shen et al., 2008; Scholl et al., 2018), for dentistry (Shimabukuro and Minghim, 1998; Xia et al., 2013), and for computational fluid dynamics (Quam et al., 2015). More relevant to our approach are the visualizations of the inside of large arterial blood vessels (Forsberg et al., 2000; Egger et al., 2020). There is a trend is to utilize VR in medical education and training (Walsh et al., 2012; Chan et al., 2013; Mathur, 2015; Moro et al., 2017; Bouaoud et al., 2020; López Chávez et al., 2020; Pieterse et al., 2020); Uruthiralingam and Rea (2020) and Duarte et al. (2020) provide an overview. The availability of head-mounted displays has sparked some new research (Chen et al., 2015; Choi et al., 2016; Inoue et al., 2016) in addition to already covered fields. Mann et al. (2018) present a taxonomy of various related approaches (virtual reality, augmented reality, etc.). Checa and Bustillo (2020) review VR applications in the area of serious games.
A radically different approach is to bypass mesh generation altogether and to render the volumes directly. Scholl et al. (2018) do so in VR, although with quite small volumes (with largest side of 256 or 512 voxels). Faludi et al. (2019) also use direct volume rendering and add haptics. In this case the largest volume side was 512 voxels. The key issue in such direct volume renderings is the VR-capable frame rate, which is severely limited in volume rendering of larger volumes.
Pinter et al. (2020) extend 3D Slicer with functionality for VR. Those functions can cope with both mesh- and volume-based representations. Williams (2019) reports on recent experiments with volume-based VR. There, 55–90 fps were achieved when the viewer was very far away from the volume. But with viewer inside the volume the frame rates went down to 25 fps.
Zoller et al. (2020) use volume rendering for haptic feedback in VR. Their goal was to simulate pedicle screw tract palpation. Wißmann et al. (2020) use reprojection to improve binocular ray tracing. The idea is to use the image from one eye to create the image for the other eye faster.
In the next section we discuss additional modern medical applications of VR, however, VR visualization is a much broader topic (Berg and Vance, 2017; Misiak et al., 2018; Rizvic et al., 2019; Slater et al., 2020).
2.2. Virtual Reality in Medical Research
Although there have been precursors long before the “VR boom,” e.g., Tomikawa et al. (2010), most relevant publications on the use of VR in medical research, training, and in clinical applications appeared after 2017. This section focuses on medical research.
Stets et al. (2017) work with a point cloud from Microsoft Kinect. Esfahlani et al. (2018) reported on non-immersive VR in rehab. Uppot et al. (2019) describe VR and AR for radiology. Knodel et al. (2018) discuss the possibilities of VR in medical imaging. Stefani et al. (2018) show confocal microscopy images in VR. Calì et al. (2019) visualize glial and neuronal cells in VR.
El Beheiry et al. (2019) analyze the consequences of VR for research. In their opinion, VR means navigation, but also allows for better education and provides options for machine learning. They can place annotations in their program, but focus on (immersed) measurements between the selected points. El Beheiry et al. perform some segmentations in VR, but primarily work with image stacks.
Daly (2018, 2019a,b) has similar goals to this work, however he uses a radically different tool pipeline, relying more on off-the-shelf software—which alleviates a larger part of software development, but is also a limitation in the amount of features. Daly (and also others, e.g., Preim and Saalfeld, 2018) also focus a lot on teaching. Dorweiler et al. (2019) discusses the implications of VR, AR, and further technologies in blood vessel surgery.
The work by Liimatainen et al. (2020) allows the user to inspect 3D reconstructions from histological sections (created in a radically different manner from how we section, they skip a lot of tissue in an effort to cover a larger volume). The user can view the sections and “interact with single areas of interest.” This is elaborated to be a multi-scale selection of the details and allowing the user to zoom in. They put histological sections of tumors in their correct location in the visualization, which was, however, also one of the first requirements to our tool, as section 3.1 details.
2.3. Comparing to Our Method
The volumes we used for the mesh generation had 2,000 pixels or more at the largest side, they are much larger as currently used for any kind of volume rendering with VR-grade frame rates. Especially low frame rates were reported by Williams (2019) for the volume rendering from inside the volumes. Our users often work from inside of the reconstruction, we find such low frame rates as 25 fps insufferable in a VR session of any productive duration.
A visualization support for HTC Vive in popular medical imaging toolkits has been presented before (Egger et al., 2017). Unlike our approach, this method is tied into existing visualization libraries. Our method is a stand-alone application, even if easily usable in our tool pipeline. Further, visualizing both reconstructed meshes and original input data was a must in our use case. We also implemented a customized mesh painting module for visual analytics. Both our approach and the works of Egger et al. (2017, 2020) generate meshes prior to the visualization. We discuss the differences between Egger et al. (2020) and our approach on page 22.
Contrasting our work with VR-enhanced 3D Slicer (Pinter et al., 2020), our work focuses on mesh-based data and initial sections, represented as separate slices, not as their combination to a volume. Our approach features tools, specially designed for VR. We are not aware of other implementations of advanced VR- and mesh-based interactions, such as our mesh paining that follows blood vessels (section 5.7). To our knowledge, annotations have never before been implemented in the manner we use them. The markers are preserved after the VR session and can be used in a mesh space for later analysis. This paper presents both those features. In general, most VR-based visualizations focus on presentation and exploration of the data. We do not stop there, but also perform a lot of visual analytics.
We do not use ray tracing in this paper, our visualizations are conventional OpenGL-based rasterizations in VR. However, future improvements to our work both in the visuals and in rendering times, might base on the results by Wißmann et al. (2020).
To further highlight the differences between this paper and the literature, our work is not concerned with haptics; we work with surface meshes, not with point clouds or volumetric meshes; we use immersive VR in medical research; and our input data are histological sections, stained with immunohistochemistry. We currently do not use MRI or radiology as a data source, however, our approach is extendable to further modalities, such as SBF-SEM in animal models (Schneider et al., 2021). Our data currently originate from transmitted light microscopy. Our representations stay mostly at a single detail level, but allow for more in-depth analysis. We visualize blood vessels and accompanying cell types in lymphatic organs, mostly in the spleen, as opposed to, e.g., Calì et al. (2019). We use our system at the moment mostly for research purposes. We are concerned with analysis of microscopic blood vessels in removed probes, which differs from surgery usages, e.g., Dorweiler et al. (2019). Our mesh painting in VR can be seen as a form of segmentation, but we perform it on the 3D models, not on image data (viz. El Beheiry et al., 2019).
2.4. Why Non-VR Tools Do Not Suffice
While enough non-VR tools for medical visualization exist, such as 3D Slicer (Pieper et al., 2004; Kikinis et al., 2014), ParaView (Ahrens et al., 2005; Ayachit, 2015), or MeVisLab (Silva et al., 2009; Ritter et al., 2011), we are proponents of VR-based visualization. Rudimentary tasks in QC can be done, e.g., in 3D Slicer or using our previous work, a custom non-VR tool (detailed below on page 22), but in our experience, our VR-based QC was much faster and also easier for the user (Bouaoud et al., 2020 and López Chávez et al., 2020 report similar experiences). The navigation and generation of insights are a larger problem with non-VR tools. The navigation in VR is highly intuitive. A lot of insight can be gathered by simply looking at the model from various views.
The relation of implementation efforts to the usability impact was favorable for our VR tool. The complexity of software development of large standard components also plays a role here. We base our VR application heavily on available components, such as Steam VR and VCG mesh processing library, as section 4.1 details. However, our tool is not an amalgamation of multiple existing utilities (e.g., using Python or shell as a glue), but a stand-alone application, written in C++. It is also not based on a game engine, such as Unity or Unreal Engine.
Merely paging through the registered stack of serial sections does not convey a proper 3D perception. Single entities in individual sections (e.g., capillaries) have a highly complex shape and are entangled among similar objects. While it is possible to trace a single entity through a series, gaining a full 3D perception is impossible without a full-fledged 3D reconstruction. An inspection of our reconstructions in VR (Steiniger et al., 2018a,b, 2021) was much faster than a typical inspection of 3D data without VR (Steiniger et al., 2016), as section 6 details.
Our VR tool is a novel combination of methods in visualization and computer graphics. Our tool is geared toward inspection, qualitative QC, and visual analytics in the challenging domain of microanatomical research. It features two different approaches to VR-based classification of parts of 3D reconstructions, based on geodesic distances.
3. Background
3.1. VR Visualization: Requirements
Our domain experts provided feedback on the earlier versions of the software in order to shape our application. The following features were deemed necessary by medical researchers:
• Load multiple meshes corresponding to parts of the model and to switch between them. This allows for the analysis of multiple “channels” from different stainings. Representing different stainings as different meshes allows to remove any of the meshes at will, which is important to the in-depths study of the various aspects of the reconstruction. Such removal also reduces visual clutter.
• Load the original data as a texture on a plane and blend it in VR at will at the correct position. The experts need to discriminate all details in the original stained sections. Comparison to the original data allows for QC and also provides additional information to the experts: even unstained tissue in the original data conveys some further information.
• Remove the reconstructed mesh to see the original section underneath. This is needed to better see the tissue that contributed to the mesh.
• Provide a possibility to annotate a 3D position in VR. Such annotations are crucial for communication and analysis. Without annotations is very hard to convey exact information on location of various issues. Saving annotations allows for a permanent storage (and hence: the re-inspection) of the issues. Thus, evaluation of the improvements on the issue is also possible.
• Adjust the perceived roles of parts of the meshes by changing their color. Color changes form the foundation of visual analytics. With this technique, e.g., two different kinds of capillary sheaths can be discerned.
• Cope with very complex, self-occluding reconstructions. Otherwise it is impossible to analyze the microvasculature in thicker reconstructions (from about 200 μm in z axis onward). Without this extension it is impossible to “pierce” through ticker reconstructions.
• Free user movement. This issue is essential for long VR sessions. Basically, no movement control (e.g., flight) is imposed on the user. In our experience, free user movement drastically decreases the chances of motion sickness.
• Provide a possibility for voice recording in annotations (work in progress).
• Design a method for sharing the view point and current highlight with partners outside VR (trivial with Steam VR and its display mirroring), and for communicating the findings from live VR sessions as non-moving 2D images in research papers (an open question).
3.2. A 3D Reconstruction Pipeline for Serial Sections
Figure 1B gives an overview of the pipeline. Figure 3 showcases some important steps. The biological processing includes tissue acquisition, fixation, embedding, sectioning, staining, coverslipping. The selection of ROIs is the consequence of the conventions and limitations in volume processing. Our goal was also to show different regions from the series. It is easier for the viewer to inspect a smaller region. However, our VR-based visualization can also deal with larger reconstructions. The limits here are rather technical: (a) the number of triangles such that the rasterization can still produce VR-capable frame rates, and (b) the available graphics memory (VRAM), such that the mesh data and the section images would still fit there. Both are rather non-issues in the productive use.
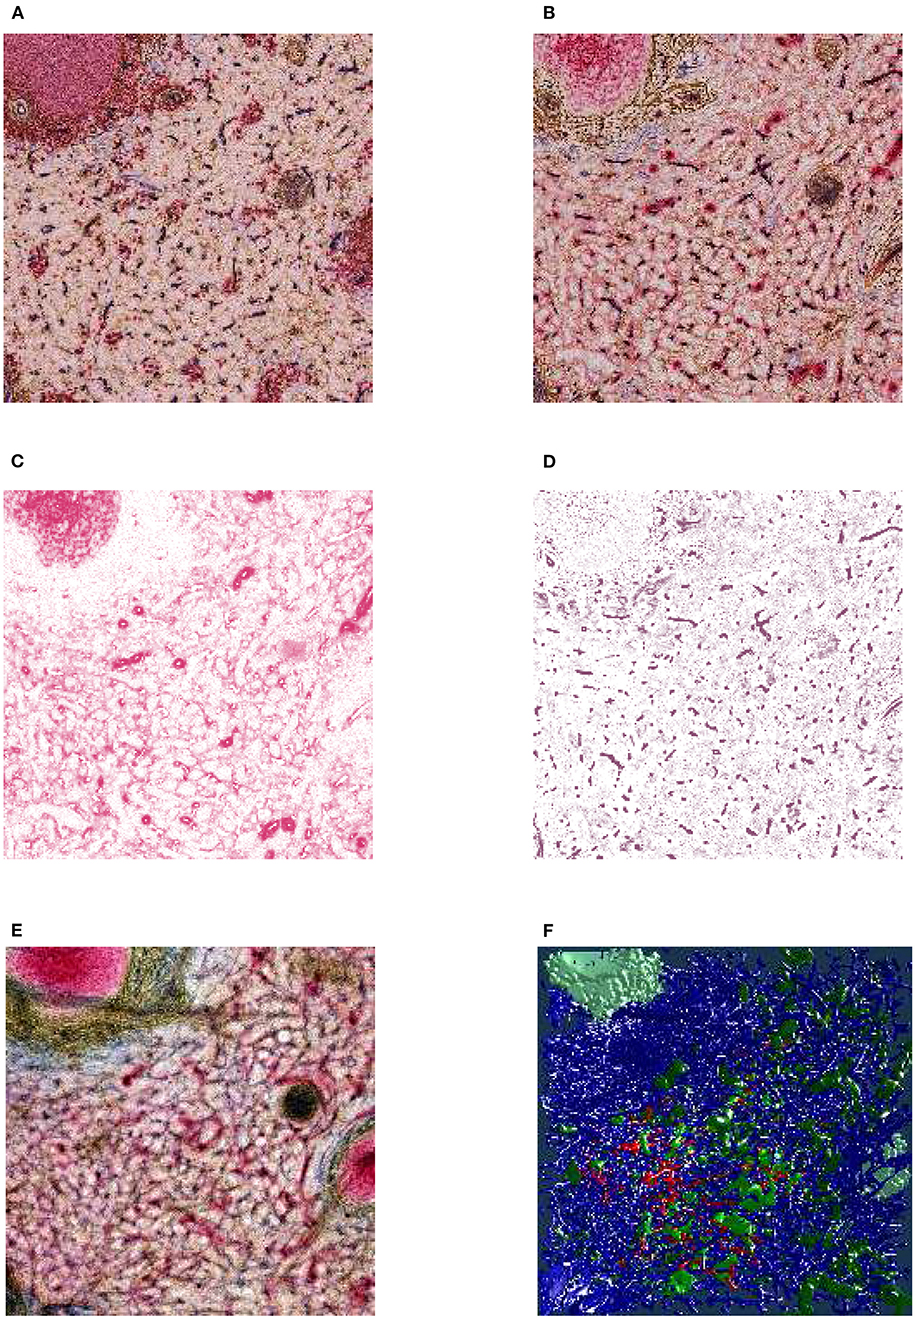
Figure 3. From section images to final results: A human spleen section is stained for SMA (brown), CD34 (blue), and either CD271 (red) or CD20 (red), this is the “Sheaths alternating” data set. (A) The region of interest (ROI), staining of B-lymphocytes (CD20) in red. (B) The ROI, staining of capillary sheaths (CD271) in red. (C) Result of color deconvolution for CD271 of (B), a single image. (D) Same, but for CD34. (E) A volume rendering of the first 30 sheath-depicting sections of the ROI. (F) Final meshes. The colors highlight the different functions. The arterial blood vessels are in blue and red. The red color is highlighting a specific tree of blood vessels. The sheaths related to this tree are green, the unrelated sheaths are dark green. The follicular dendritic cells (that are also weakly CD271+) are depicted in light green. The SMA mesh was used for a heuristics to find arterioles among blood vessels. SMA and B-lymphocytes are not shown in the rendering.
The fine-grain registration (Lobachev et al., 2017b) is the decisive step for maintaining the connectivity of capillaries. The healing of damaged regions (Lobachev, 2020) is an optional step. The step “mesh coloring” involves, e.g., coloring of selected components (Steiniger et al., 2018a,b, 2021) or visualization of shape diameter function (Steiniger et al., 2016). QC is used as initial visual analytics. If the reconstruction, e.g., interrupts microvessels or includes non-informative components, we identify the cause and repeat from there.
Table 1 details on the distributions on the molecules that were used in the visualization. We also list there the papers that present the corresponding medical research results.
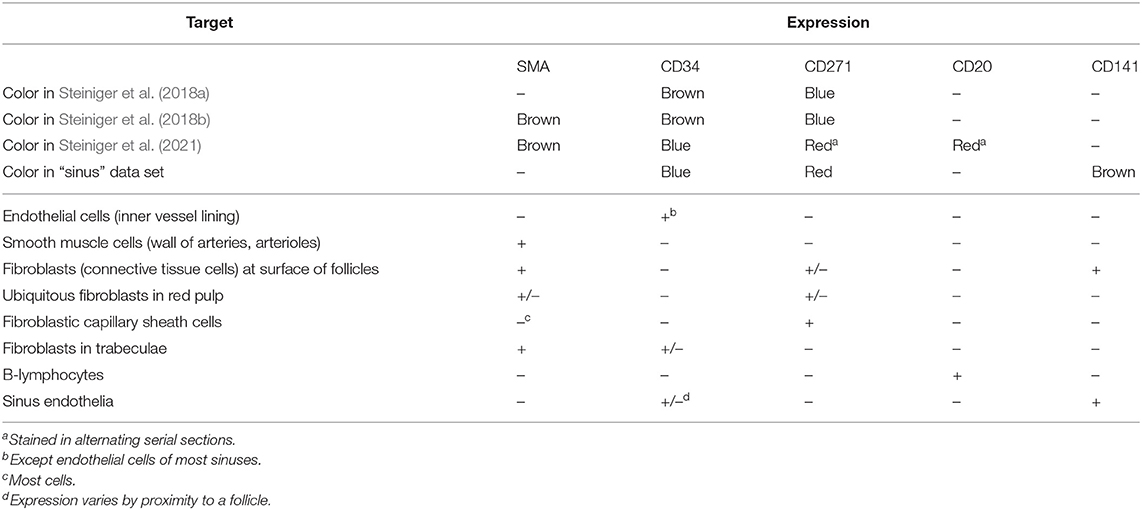
Table 1. Cell distribution of the molecules detected in human spleens.
3.3. Input Data
The input data consists out of following data sets. More details on the acquisition and histological background are given in the Appendix.
1. “Bone marrow”: stained with anti-CD34 plus anti-CD141 (both brown), 4 ROI 3, 500 × 3, 500 pixel at 0.5 μm/pixel, 21 serial sections (Steiniger et al., 2016; Figure 4, Supplementary Figure 1).
2. “Follicle-double”: spleen sections stained with anti-CD34 (brown) followed by anti-CD271 (blue), ROI 2, 300 ×2, 300 pixel at 0.416 μm/pixel, 24 serial sections (Steiniger et al., 2018a; Figure 7);
3. “Follicle-single”: spleen sections stained with anti-CD34 (brown), a ROI 4k × 4k pixel, 0.3 μm/pixel, 24 serial sections (Steiniger et al., 2018a; Figure 8);
4. “Red pulp”: spleen sections stained with anti-CD34 plus anti-SMA (both brown), followed by anti-CD271 (violet-blue, different pigment than above), 11 ROI 2k × 2k pixel at 0.5 μm/pixel, 24 serial sections (Steiniger et al., 2018b; Figures 9, 13);
5. “Sheaths alternating”: 148 immunostained sections plus 2 HE sections stained with anti-SMA, anti-CD34 and anti-CD271. In every other section CD271 was replaced by CD20. We processed 4 ROI at 2k × 2k pixel at 0.5 μm/pixel, of which from 82 to 148 sections were used (Lobachev et al., 2019; Lobachev, 2020; Steiniger et al., 2021), see also Figures 3, 5, 10, 13.
6. “Sinus”: 21 spleen sections immunostained with anti-CD141 (brown, not shown here), anti-CD34 (blue), anti-CD271 (red), work in progress with currently two ROI 2k × 2k pixel at 0.44 μm/pixel, shown in Figures 11, 12. A phenotypical investigation was performed in Steiniger et al. (2007), but without serial sections and capillary sheaths.
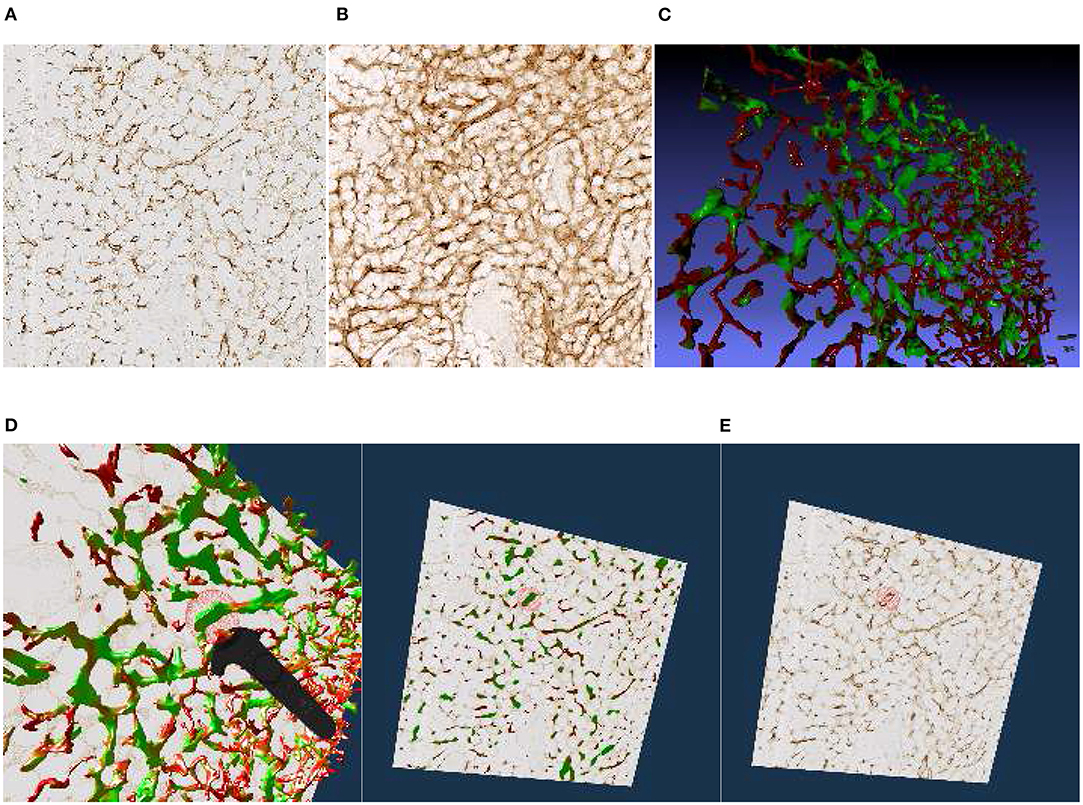
Figure 4. Images, renderings, and VR screenshots showing mesh reconstructions of blood vessels in a human bone marrow specimen, stained with anti-CD34 plus anti-CD141. (A) A single section. The staining color is brown for both molecules in the original data. (B) A volume rendering of 21 consecutive serial sections. (C) The reconstructed mesh. It shows shape diameter function values, color-coded from red to green. (D) We annotate a position of interest in the mesh in VR. An original section is seen in the background. (E) We have found the section containing the annotation, the mesh is still visible. (F) Only the section with the annotation is shown in VR. Domain experts can now reason on the stained tissue at the marked position.
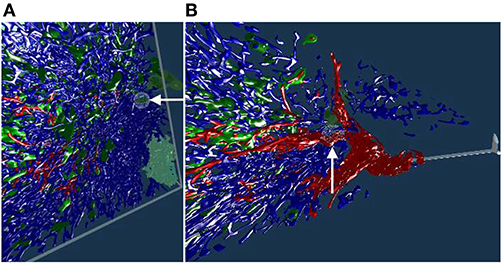
Figure 5. Working with our annotation tool. We show VR screenshots of our application, in a human spleen “sheaths alternating” data set (Steiniger et al., 2021). (A) Overview. In (B) the front plane clipping is evident, viz. Figure 10. Notice the Valve Index controller with an annotation marker, showing an anatomical structure. In this manner, the VR user can clarify some morphological details or demonstrate an issue to an audience outside VR. The annotation marker in this case is a white ball, painted with thin mesh lines. All images are produced with our VR tool. Similar illustrations can be found in Steiniger et al. (2021).
4. System Architecture and Features
4.1. Components
Our application makes use of existing software libraries. We load meshes with the VCG library. Multiple meshes with vertex colors are supported. We utilize Open GL 4.2. We enable back face culling, multisampling, and mipmaps. The section textures are loaded with the FreeImage library. The Steam VR library is used for interaction with Vive controllers and the headset.
With respect to hardware, the system consists of a desktop computer with a Steam VR-capable GPU and a Steam VR-compatible headset with controllers.
4.2. Controls
For control, a simple keyboard and mouse interface (for debugging outside VR), XBox One controller, and Steam VR-compatible controllers can all be used. Our initial idea was to use an XBox 360 or an XBox One controller, as such controllers provide a simple control metaphor. However, the expert users were not acquainted to gaming controllers and could not see the XBox One controller in VR. Thus, initial error rates were high when they, e.g., tried to simultaneously use an “X” key and a “D-Pad” in blind.
Hence, a more intuitive approach with the native Vive controllers was targeted. We have kept the keyboard-and-mouse and the XBox controller options, but duplicated required input actions with Vive controllers. Native HTC Vive controllers proved their benefits. Although the metaphors were much more complicated, the intuitive control payed off immediately. Further, the visibility of the tracked controllers in VR helped a lot. Later on, we extended the application support to Valve Index knuckle controllers.
Further spectators can follow the domain expert from “outside” of the immersion, as the HMD feed is mirrored on a monitor. Further, annotations significantly improve communication (Figures 7–9). The main controller actions of the domain expert are:
• Blending the original data (the stained sections) in or out;
• Blending the mesh(es) in or out;
• Advancing the currently displayed section of original data;
• Placing an annotation;
• Mesh painting.
The most significant user interaction happens with intuitive movements of the immersed user around (and through) the displayed entities in VR.
4.3. Communication
Without a beacon visible in VR it is almost impossible to understand what the expert tries to show. With a VR controller and our annotation tool, interesting areas in the visualization can be shown to the outside spectators in real time.
4.4. Annotation Markers
We designed a spherical selection tool for marking points in space (Figure 5). The sphere is located at the top front of a Vive or Index controller and can be seen in the virtual space (and, by proxy, also in the mirrored display, Figure 2). We need to note, however, that the annotation sphere appears much more vivid to the VR user than it appears on screenshots. User's movement and live feedback are in our opinion a major reason for such a difference in perception. Figures 4D–F, 5, 7B, 8, show our annotation tool in images captured from VR sessions.
The annotations and mesh modifications are saved for further analysis. For example, after the domain expert has marked suspicious areas, the 3D reconstruction expert can inspect them in a later VR session. Reconstruction improvements can be deduced from this information.
4.5. Anti-Aliasing
If a “direct” rendering approach is used, there is a very dominant aliasing effect at certain points. We used multisampling (MSAA) on meshes and mipmaps on textures to alleviate this problem.
4.6. Front Face Culling
Consider the interplay between the model and original serial sections. A section is not an infinitely thin plane. We show the original data as an opaque cuboid that is one section thick in the z direction and spans over the full surface in the xy plane. The actual data points of the mesh, corresponding to the displayed section, are inside the opaque block. Decisive parts of the mesh are occluded by the front face of the cuboid. On the one hand, this is, of course, not desired, and requires correction. On the other hand, the behavior of the model spanning for multiple sections in front of the current section is best studied when it ends at the front face of the cuboid. The solution is to enable or disable front face culling of the original data display at will.
With front face culling enabled, the user can look inside the opaque block with original section texture. This is well-suited for the inspection of lesser details and small artifacts (Figures 9D,E features a real-life example, observe the edge of the section shown). The general behavior of the model across multiple sections can be tracked more easily with front faces of the original section on display. The presence of both representations accelerates QC.
4.7. Geodesic Distances for Mesh Painting
We also implemented a VR-based mesh painting facility, mostly based on MeshLab code base (Cignoni et al., 2008). In this mode the color spheres, which our user can place with the controller, produce a geodesically colored region on the mesh instead of an annotation. These two functions, annotations and mesh painting, are conveyed to be clearly different to the user.
The selected color is imposed on all vertices inside the geodesic radius from the center of the sphere. We would like to paint on, for example, a part of a blood vessel that has a specific property. At the same time, we would like not to color other blood vessels that might be inside the painting sphere, but are not immediately related to the selected blood vessel. This is facilitated with geodesic distances, as Figure 6 shows.
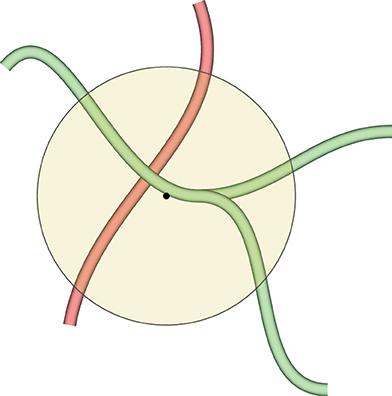
Figure 6. This figure demonstrates why we need geodesic distances for mesh painting in our VR application. The yellow circle is the painting tool. We would like to mark the green blood vessels inside the circle, but do not want to co-mark the red blood vessel, even if it is also inside the circle. Red and green blood vessels might even be connected somewhere outside the circle, but the geodesic distance from the center of the circle (the black dot) to any vertex of the red blood vessel is too large, even if they are reachable. Conversely, a part of the green blood vessel is selected, as a vertex of the green mesh is closest to the center of the circle. As many vertices are selected as the geodesic distance (corresponding to the radius of the circle with some heuristics) allows for.
The markings from mesh painting lead to the final separation of the entities (such as blood vessel types, kinds of capillary sheaths, etc.) in the visualization.
4.8. Front Plane Clipping
The classic view frustum in computer graphics consists of six planes, four “display edges” building the frustum sides, a back plane (the farthest visible boundary) and the front plane, the closest boundary. The clipping planes are recomputed when the camera (i.e., the user) is moving. In the cases when there are too many self-occluding objects in the scene, the observer cannot “pierce through” further than few closest objects. In other words, the observer can only see the closest objects (This fact motivates occlusion culling).
Such an occlusion was the case with our denser data sets. With a simple change in the code, we moved the front plane of the view frustum further away, in an adjustable manner. Basically, the user “cuts” parts of the reconstruction in front of their eyes, allowing for the detailed inspection of the inside of the reconstruction. A throughout inspection of a “denser” model, such as the “sheaths alternating” data set, would have been impossible without this feature.
This adjustment is very minor from the computer graphics point of view, but it was very much welcomed by our actual users, the medical experts. With appropriate front plane clipping set at about 60 cm from the camera, it becomes possible to inspect very dense medical data sets from “inside” (Figures 5, 10, 13B–D demonstrate this effect). The user “cuts away” the currently unneeded layers with their movements.
5. Results
5.1. Hardware
We conducted most of our investigations on a 64-bit Intel machine with i7-6700K CPU at 4 GHz, 16 GB RAM, and Windows 10. We used NVidia GTX 1070 with 8 GB VRAM, and HTC Vive.
Our VR application was initially developed with HTC Vive in mind; it performed well on other headsets, such as HTC Vive Pro Eye and Valve Index. We observed convincing performance on Intel i7-9750H at 2.6 GHz, 64 GB RAM (MacBook Pro 16″) and NVidia RTX 2080 Ti with 11 GB VRAM in Razor Core X eGPU with HTC Vive Pro Eye, as well as on AMD Ryzen 2700X, 32 GB RAM, NVidia RTX 2070 Super with 8 GB VRAM with Valve Index. Our application also should perform well with further headsets, such as Oculus Rift. It was possible to use previous-generation GPUs, we also tested our application with NVidia GTX 960. Overall, it is possible to work with our application using an inexpensive setup.
The largest limitation factor seems to be the VRAM used by the uncompressed original image stack. The second largest limitation is the number of vertices of the visualized meshes and the rasterizer performance in case of very large, undecimated reconstructions.
5.2. “Bone Marrow” Data Set
We have reconstructed the 3D shape of smaller and larger microvessels in hard, undecalcified, methacylate-embedded human bone serial sections (Steiniger et al., 2016). Shape diameter function on the reconstructed mesh allows to distinguish capillaries from sinuses. Figure 4 shows (a) a single section (part of the input data to reconstruction), (b) a volume rendering of all 21 sections, and (c) our 3D reconstruction. In Steiniger et al. (2016) we did not use VR. Here, we use the same data set to showcase some features of our VR-based method. It took us much more manpower and time to validate the reconstructions then, without VR, as section 6 details (Supplementary Figure 1).
The process of annotation is demonstrated in Figure 4D. The next subfigures show further investigation of the annotated area in VR either in combined mesh-section view (e), or showing the corresponding section only (f). To discriminate between capillaries (smaller, colored red) and sinuses (larger, colored green), we computed shape diameter function on the reconstructed meshes and color-coded resulting values on the mesh, as shown in (c)–(e). The handling of the reconstruction and serial section data in VR showcases the annotation process.
5.3. “Follicle-Double” Data Set
The human spleen contains accumulations of special migratory lymphocytes, the so-termed follicles. We reconstructed the capillaries inside and outside the follicles (Steiniger et al., 2018a). We show some results from this work in this section and in the next. Figure 7 presents one of three ROIs that were quality controlled.
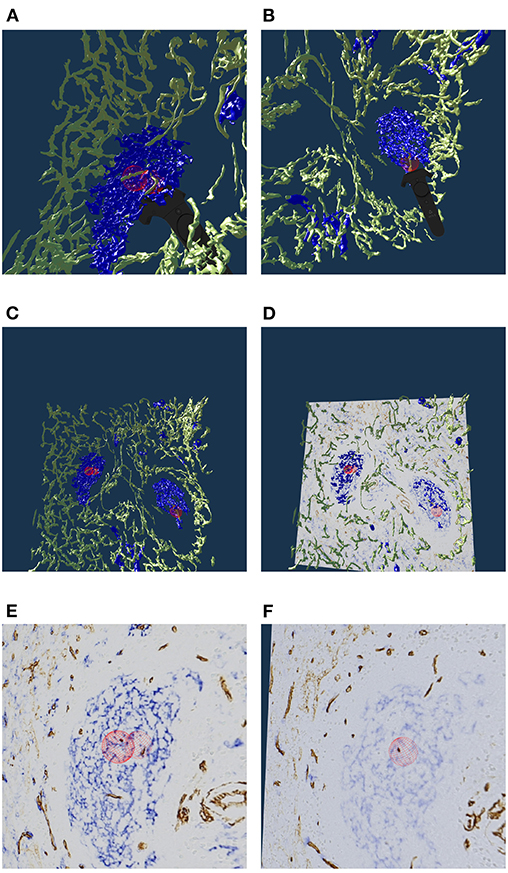
Figure 7. Real or artifact? The models are derived from human spleen sections from the “follicle-double” data set. These sections were stained for CD34 (brown in staining, yellow in the reconstruction) and for CD271 (blue). In VR we spotted and annotated putative capillaries inside follicles (large blue structures, A,B). We can look at the meshes only (C) or also show the original data (D). A closer view (E,F) confirms: the reconstruction is correct, these structures are CD34+ objects inside the follicle. As the structures in question continue through multiple sections, they do not represent single CD34+ cells. Hence the objects in question must be blood vessels. The reconstruction is correct, the brown structures are real. All images in this figure are screenshots from our application. Similar results can be found in Steiniger et al. (2018a).
Our 3D reconstruction demonstrates that follicles are embedded in a superficial capillary meshwork resembling a basketball basket. Figure 7 shows that our VR tool enables easy annotation and projection of the original data leading to further results (Steiniger et al., 2018a). In Figure 7E, some brown dots have been marked inside a follicle. The 3D model shows, that the dots indeed represent capillaries cut orthogonally to their long axis. Thus, we additionally find that infrequent capillaries also occur inside the follicles. The superficial capillary network of the follicles is thus connected to very few internal capillaries and to an external network of capillaries in the red pulp. We observed the latter two networks to have a shape which is totally different from the superficial follicular network. The external network is partially covered by capillary sheaths stained in blue color. In total, we examined three “follicle-double” data sets in VR.
5.4. “Follicle-Single” Data Set
To continue the investigation of capillaries inside and outside the follicles, Figure 8 shows that the annotated elongated structures in the follicles and in the T-cell zone at least partially belong to long capillaries, which accompany the outside of larger arteries, so-termed vasa vasorum. With our VR-based method, we investigated this 4k × 4k ROI at 0.3 μm/pixel and three further ROIs (not shown) with 1, 600 × 1, 600 pixels at 0.6 μm/pixel (Steiniger et al., 2018a). Figure 8 also shows a Vive controller tracing one of the longer capillaries with the annotation ball as a form of communication of the findings to spectators outside VR.
Figure 8. A VR screenshot showing mesh reconstructions of blood vessels in a human spleen specimen, anti-CD34 staining, “follicle-single” data set (Steiniger et al., 2018a). Unconnected mesh components were set to distinct colors. The user is highlighting a smaller blood vessel that follows larger ones with the HTC Vive controller.
5.5. “Red Pulp” Data Set
The location of capillary sheaths in human spleens has not been clarified in detail until recently (Steiniger et al., 2018b). Our 3D reconstructions indicate that sheaths primarily occur in a post-arteriolar position in the part of the organ, which does not contain lymphocyte accumulations (so-termed red pulp), although length and diameter of the sheaths are variable. Many sheaths are interrupted by the boundaries of the ROI (The remedy was a longer series of sections, as presented in section 5.6). For this reason it makes sense to collect only sheaths which are completely included in the reconstruction. Such a selection was done with our VR classification tool.
Figure 9A shows an overview of the annotations. In Figures 9B–D it becomes clear, that the sheaths indeed end at the marked positions. Notice the enabled front face culling on the section cuboid in the closeups. Figure 9E additionally shows the reconstructed meshes for the sheaths. We show a single ROI at 2k × 2k pixels. We have inspected 11 such ROIs in VR.
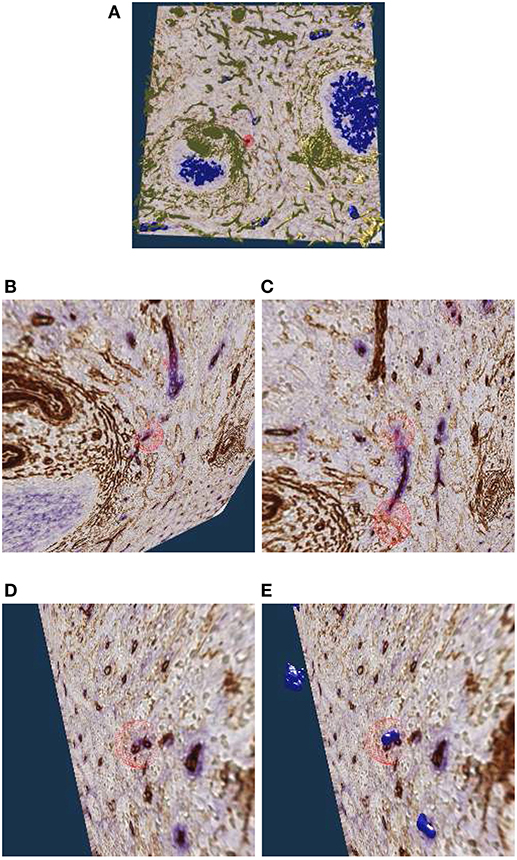
Figure 9. Investigating the annotated regions, VR screenshots of our application.The human spleen “red pulp” data set is used (Steiniger et al., 2018b); we have annotated some ends of capillary sheaths in meshes reconstructed from human spleen data. (A) Overview. (B–D) Original data and an annotation. Experts can more easily reason on such visualizations because of 3D perception and intuitive navigation. (E) The same annotation as in (D), showing additionally the mesh for sheaths.
5.6. “Sheaths Alternating” Data Set and Clipping
The “sheaths alternating” data set with up to 150 sections was created to further investigate the morphology and (to some extent) the function of capillary sheaths (Steiniger et al., 2021). The resulting 3D data set was extremely dense. The increased amount of “channels” and the nature of the study (tracking the blood vessels) was a big challenge. The amount of the reconstructed blood vessels and their self-occlusion prohibited any possible insight when viewing them from the outside. Here we utilized front plane clipping (section 4.8). Figures 5B, 10, 13 (and also Figure 11 for “sinus” data set) showcase this minor, but important adjustment. Figure 13 further demonstrates the complexity of the “sheaths alternating” data set.
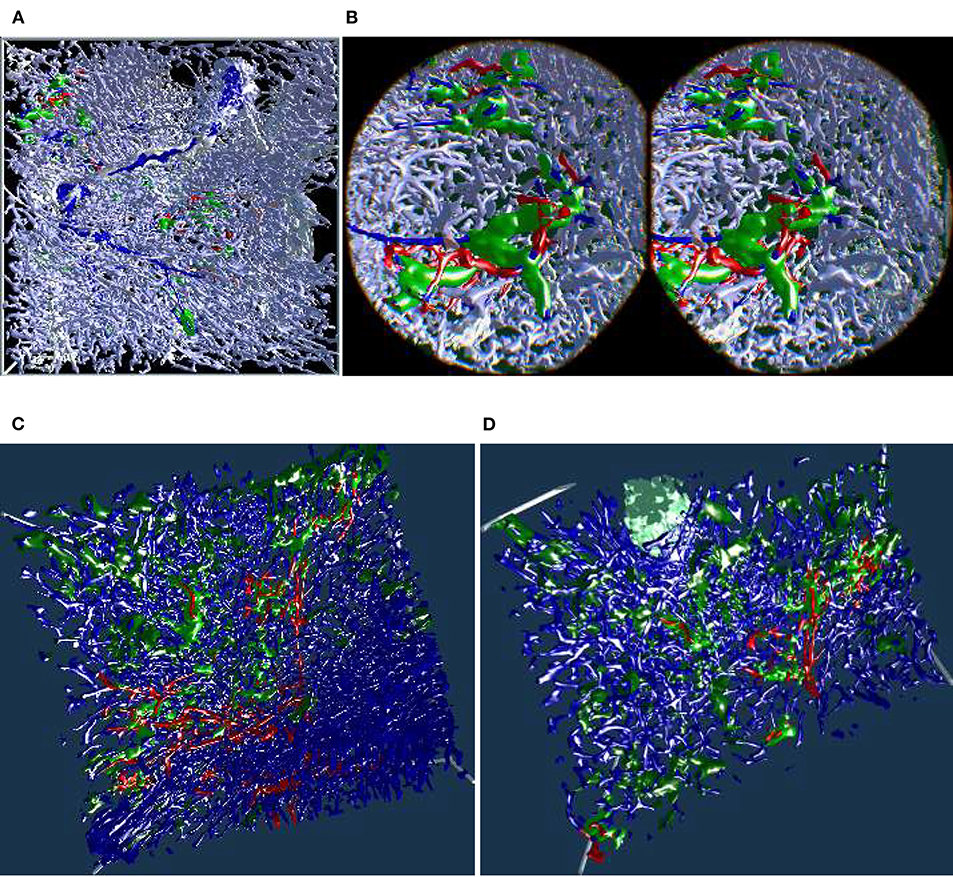
Figure 10. Showcasing front plane clipping on “sheaths alternating” data sets (Steiniger et al., 2021). (A) A complete data set in a frontal visualization. (B) The user cuts into objects of interest using clipping. (C,D) Utilization of clipping during the exploration of the data set. All images are produced with our VR tool either directly or with Steam VR interface. (A,B) were featured in a poster (Lobachev et al., 2019). (A,C,D) Similar illustrations can be found in Steiniger et al. (2021).
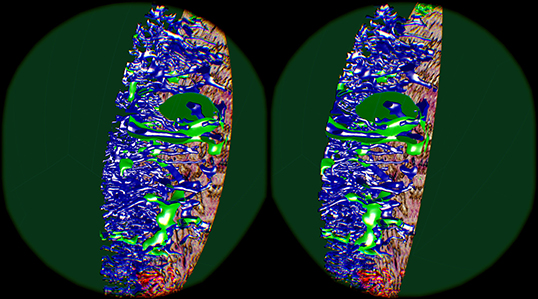
Figure 11. Cutting structures open with front clipping plane, using the “sinus” data set. Capillaries are blue, capillary sheaths are green in the reconstruction. An original section is visible on the right.
5.7. Mesh Painting and Obtaining Insights
As already seen in Figures 5, 7A,B, 8, we can point to anatomical structures with the Valve Index controller. Similarly, annotations can be placed and mesh fragments can be painted in different colors. An example of real-life mesh painting with geodesic distances is in Figure 12. The arrows show a part of a structure already painted by user in red in (A). It is painted back to blue in (B).
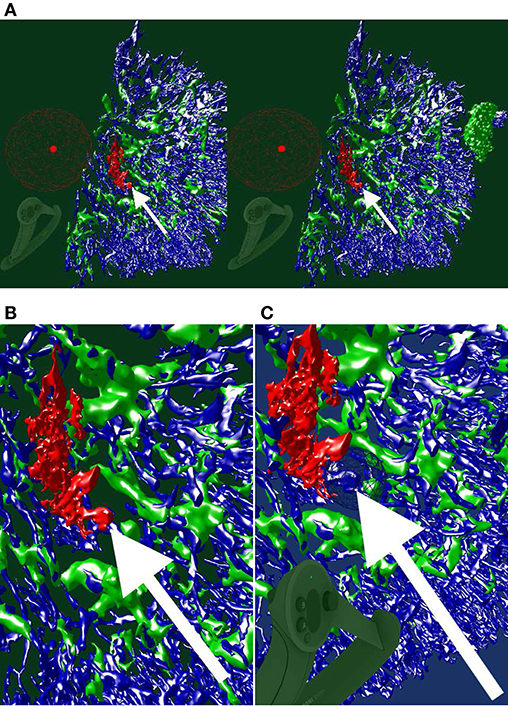
Figure 12. An ongoing session of mesh painting with geodesic distances as VR screenshots. We use the “sinus” data set. (A) Notice the huge annotation ball on the controller, the bright red dot is its center. This center is the starting point of the geodesic computation, initiated by the trigger on the controller. The large radius of the marking tool is bounded by the connectivity: the vertices which are within the radius, but are not connected to the starting point or are “too far” geodesically, are not painted. (B) For better visibility, we show a crop from the left eye view of (A). The white arrow shows a point of interest. (C) An excessive marking (white arrow), is removed with a repeated painting operation. On the bottom left in (A,C), a Valve Index controller is visible. The background color in this figure signifies the highlighting mode used.
In this manner we have refined an automatic heuristics for arterioles (larger blood vessels, red in Figure 13A) to be always correct and to lead up to the capillary sheaths.
Figure 13. Mesh annotation and painting. (A) “Red pulp” data set, final result (Steiniger et al., 2018b). Blood vessels and some support structures are yellow. While some capillaries are red, some other capillaries (white), while coming from the same arteriole (also red), do not have a sheath at all. The sheaths are either green or blue, depending on the connections of their capillaries. A similar, but different image appeared in Steiniger et al. (2018b) under CC-BY 4.0 license. (B,C) The natural complexity of the “sheaths alternating” data set (Steiniger et al., 2021) is very high. With mesh annotation, painting, and removal of irrelevant details we were able to keep the complexity at a tolerable level. (B) An arteriole (red) is entering from left, transitioning into capillaries (still red), a capillary sheath (green) is is cut open, showing the capillary inside. Other capillaries are blue. (C) This figure shows a single system, starting with an arteriole. Front plane clipping opens the capillary sheath. (D) Final result of mesh annotation, painting, and removal of irrelevant details. The complexity is now greatly reduced. The meshes are cut open by the front clipping plane. An arteriole (red) is entering from left in the proximity of a follicle, this arteriole is splitting up into capillaries (still red). Those enter capillary sheaths, one is shown (in green), curving around the follicle. This sheath is cut open, showing the capillary inside. Similar, but different figures can be found in Steiniger et al. (2021).
With a similar tool, working on unconnected components, we changed the color of the sheaths in the “red pulp” and “sheaths alternating” data sets. The color change effected the classification of the sheaths. The sheaths were initially all blue in our visualizations of the “red pulp” data set. Sheaths around capillaries, following known arterioles, were then colored green. We also annotated very few capillaries that should have a sheath, but did not (white). Figure 13A shows one of the final results, a connected vascular component with accompanying sheaths, follicle structures, and smooth muscle actin. In this panel, the blood vessels are yellow. Certain support structures in the spleen that feature smooth muscle actin are also reconstructed and displayed in yellow (A trained histologist can discern these structures from various kinds of blood vessels though). Some of the blood vessels (red) lead from larger blood vessels (arterioles) to capillary sheaths (green). Some sheaths are fed by arterioles not traced in the reconstruction. These sheaths are marked blue. Finally, while some capillaries are red (having green sheaths), some other capillaries, coming from the same arteriole, do not have a sheath at all. Such capillaries are colored in white. The background is black to better discern the white color.
Figures 13B,C underlines the complexity of the “sheaths alternating” data set. Both panels (B) and (C) in this figure show the final results of mesh painting, the actual work is already done. Still, they convey how interwoven and obscure the original situation is. CD271+ cells, mostly present in capillary sheaths, are in various shades of green in this figure. Panels (B) and (C) are highly complex; the fact that something can be seen in still images is the merit of applied annotations and mesh painting, of an active front plane clipping, and of a proper choice of a view point. A viewer in VR has no problem navigating such data sets because of the active control of view direction and of movement dynamics. The latter also means a control of the front plane clipping dynamics.
Panel (B) shows the capillary network of the splenic red pulp in blue. Arterioles have been highlighted in red. Capillary sheaths are green and dark green, depending on whether they belong to the red vessels. Special supportive cells in a follicle are light green. An arteriole (red) is entering from left, one of the branches is splitting up into capillaries (still red) that immediately enter capillary sheaths. One such sheath (green) is is cut open, showing the capillary inside.
Panel (C) presents arterioles and sheathed capillaries in light blue; capillary sheaths are green. The open-ended side branches of sheathed capillaries are red. This panel shows a single system, starting with an arteriole. It has been separated from other arterial vessel systems in the surroundings. Front plane clipping opens the capillary sheath and shows the blue capillary inside. We see some open green capillary sheaths with light blue “main line” blood vessels inside.
Figure 13D shows a further development: a separated arteriole with its further capillary branches and capillary sheaths (Steiniger et al., 2021). The sheath in the figure was cut open by front plane clipping. This “separation” was generated from user inputs in VR, similar to the previous figure. Now, however, the complexity is reduced to a degree, that allows showing the still image in a medical research publication. Panel (d) is the final result of mesh annotation, painting, and removal of irrelevant details. The meshes are cut open by the front clipping plane. Blood vessels are red, capillary sheaths are green, cells in follicle are light green. An arteriole (red) is entering from left in the proximity of a follicle, this arteriole splits further, one of the branches is splitting up into capillaries (still red) that immediately enter capillary sheaths. One such sheath (green) is curved around the follicle. The sheath is cut open, showing the capillary inside.
Summarizing, our visualizations in VR were used to obtain insights (Steiniger et al., 2018b, 2021) on the position of the capillary sheaths—a problem that was initially discussed (Schweigger-Seidel, 1862) more than 150 years ago!
5.8. Quantitative Results
To quantify our finds we evaluate the mesh painting results on “red pulp” and “sheath alternating” data sets. The meshes of capillary walls in both data sets were painted in VR using our mesh painting tool, basically “set this part of the capillary to red”. The capillary sheaths in “red pulp” data set were classified using mesh classification tool (“set it either green or blue”) in VR. The meshes of capillary sheaths in “sheaths alternating” data set were classified offline using the capillary wall paintings and then verified in VR. The results are summarized in Table 2.
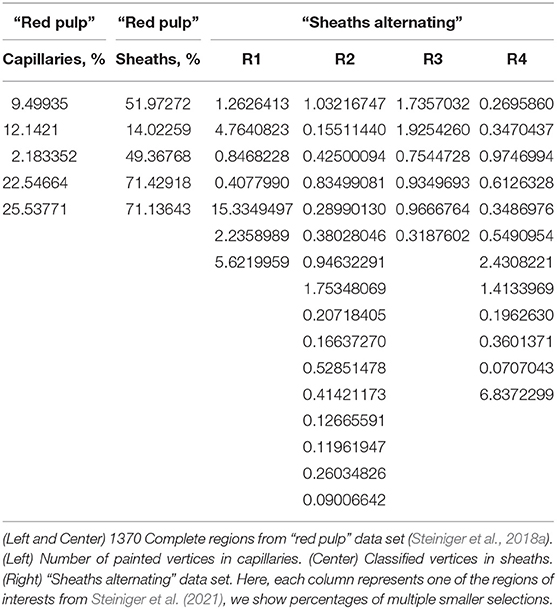
Table 2. Percentage of the vertices highlighted in VR.
In both tables concerning the “red pulp” data set, we see a quite varying number of “red” capillaries (i.e., ones, directly connected to an arteriole) and, corresponding, a varying number of sheaths. We quantify the percentage of vertices marked, but as their placement is quite regular, those are indirect statements on the surface of capillary walls and sheaths. For the goals of this paper, however, it demonstrates how much work our users invested into the mesh painting and classification using our tools. For the regions shown, our users marked 2.2–26% of the vertices in capillary network. From 14 to 71% of the sheaths' vertices were classified as belonging to the marked capillaries.
Next, we regard the selection of multiple “blood vessel trees” from a single region. The 3D reconstruction of capillaries in “sheaths alternating” data set in region 1 consists of 586,073 vertices. With mesh painting, 0.41–15% vertices were highlighted in different “trees.” In region 2, from 639,528 vertices 0.090–1.8% were highlighted in a certain VR-session. In region 3, from 769,544 vertices 0.32–1.9% were highlighted. Finally, in region 4, from 725,557 vertices, 0.071–6.8% were marked in VR. Notice that various sessions had various tasks, so the lower percentage does not an indicate poor performance, but just a smaller “tree.”
Further, the low percentage is not a characteristics of a failure, as the user had to find those few special parts of the reconstruction. Higher percentages indicate a larger connected systems (i.e., “trees”) that were rather of interest for the medical research. Marking a larger system is more work for the user, but our users managed well. The main difficulty during highlighting lies in the other capillaries, as multiple branches are intervened in the specimens (compare Figures 10, 13B). The ability to cope with such large occlusions and to discern both larger and smaller capillary systems is an implicit evidence of the design qualities of our VR-based approach.
6. Discussion
The novelty of this work stems from how VR streamlines and facilitates better QC and VA of our reconstructions. The presented VR-based tool plays an important role in our pipeline. “Usual” 3D reconstructions from serial histological sections are known, but are quite rare, because they involve cumbersome tasks. The reasons for this are 3-fold: technical difficulties to create them; struggles to QC the reconstructions; investigation and comprehension problems in dense, self-occluding reconstructions. A proper registration, correct reconstruction options, and possibly also inter-slice interpolation are necessary for creating a satisfying reconstruction. For QC we need to visually ensure the correctness of processing, identify what the reconstruction actually shows, keep artifacts at bay by creating a better reconstruction if needed. Finding a good reconstruction from previously unexplored data with a new staining is an iterative process. While we create the reconstructions quite efficiently, QC was a lot of work in the past. With an immersive VR application, QC is much easier and faster, in our experience.
Annotations and mesh coloring provide for visual analytics abilities and these facilitate better distinction between various aspects of the reconstruction. To give some example, capillary sheaths, surely following arterioles, can be separated from capillary sheaths, the origins or ends of which lie outside of the ROI. Such distinctions allow for better understanding in microanatomical research.
Our experience emphasizes the importance of VR-based QC. Our older 3D reconstruction study (Steiniger et al., 2016) featured 3, 500 × 3, 500 × 21 voxels in four regions. From each reconstruction a further version was derived. They did not need to be quality controlled again, but their inspection was crucial to produce a diagnosis for medical research. We used both a non-VR visualization tool for QC and pre-rendered videos for inspection. It took a group of 3–5 experts multiple day-long meetings to QC these reconstructions with the non-VR tool (Supplementary Figure 1). Deducing the anatomical findings from pre-rendered videos was also not easy for the domain experts.
We found free user movement essential for long-term usability of our application—our users spend hours immersed in consecutive sessions. Basically, the model is not otherwise translated, rotated, or scaled in the productive use, but only in response to tracking and reacting to user's own movements. Such free user movement allows the immersed user to utilize their brain's systems for spatial orientation and spatial memory. In their turn, the recognition and annotation of structures become easier. Free user movement also distinguishes our application from Egger et al. (2020): they used a VR flight mode on 3D models from CT.
We first found the benefits of VR-based visualization during the preparation of Steiniger et al. (2018a). Unlike the bone marrow data set (Steiniger et al., 2016), in our next work (Steiniger et al., 2018b), the total number of voxels was slightly larger, and QC was much faster with the new method. Our domain expert alone quality controlled with our VR-based method 11 regions with 2, 000 × 2, 000 × 24 voxels per day in one instance (Steiniger et al., 2018b) and 2–4 ≈ 2, 000 × 2, 000 × 84 regions per day in another instance (Steiniger et al., 2021). These sum up to slightly more than 109 voxels per day in the first case and up to 1.36·109 voxels per day in the second case. We would like to highlight, that these amounts of data were routinely quality controlled by a single person in a single day. Thus, VR immersion saved an order of magnitude of man-hours for QC of our medical research 3D reconstructions (Steiniger et al., 2018a,b, 2021).
Our immersive application also enabled VA of the same reconstructions. Without immersive VA and (later on) interactive “cutting” into the reconstructions with front plane clipping in VR, it would be exorbitantly harder or even impossible for us to obtain the research results, summarized in Figure 13 (Steiniger et al., 2018b, 2021).
With our application, the users can inspect 3D reconstructions, compare them to series of raster images, classify parts of the reconstructions (both unconnected components and some parts of a mesh). Our application can, therefore, be used in any 3D area from macroanatomy to civil engineering. However, the UI, the details of the use case implementations, and their motivations originate from 3D histology.
When the size of the mesh is too large for fast enough rasterization, the frame rate suffers, inducing bad VR experiences (The exact data depend on the mesh size, on shaders, and the GPU used, but is typically well into tenths of millions of vertices). Mesh painting depends on geodesic distances on the mesh, hence it has the same limitations. We have tested our VR application on at least 21 sections. Naturally, if only a handful sections is available, the 3D impression would degrade. The maximal number of sections is limited only by the VRAM size and data availability. We have productively used our application with 148 sections, with potential for much more.
7. Conclusions
3D reconstructions from histological serial sections require quality control (QC) and further investigations. Domain experts were not satisfied by previously existing QC methods. We present a VR-based solution to explore mesh data. Our application also allows to superimpose the original serial sections. Such display is essential for QC. In our experience, immersion accelerates QC by an order of magnitude. Our users can annotate areas of interest and communicate the annotations. VR-powered VA allowed for a more exact and fast distinction and classification of various microanatomical entities, such as post-arteriolar capillaries and other kinds of capillaries. The classification of arterial blood vessels in its turn facilitated the classification of capillary sheaths. Summarizing, our VR tool greatly enhances productivity and allows for more precise reconstructions that enable new insights (Steiniger et al., 2018a,b, 2021) in microanatomical research.
7.1. Future Work
Making our application an even a better visual analytics tool is always viable. Minor improvements at user input handling include more input combinations and gestures. A planned feature is to record spoken annotations for every annotation marker. Recorded memos would facilitate better explanation of markings at their revision. The application has a potential to evolve in the direction of a non-medical 3D sculpting utility. A better maintainability of the code base through an excessive use of software product lines (Apel et al., 2016) is an important goal. Not all builds need all features and software product lines can accommodate this point.
Improvements of the rendering performance are both important and viable. Possible points of interest are better occlusion culling (e.g., Mattausch et al., 2008; Hasselgren et al., 2016) and progressive meshes (e.g., Derzapf and Guthe, 2012). There are further ways to improve the anti-aliasing and thus even further improve the immersive user experience. A possibility to consider is an advanced interpolation for higher internal frame rates.
A promising idea is to learn better view angles (similar to Burns et al., 2007) from the transformation matrices saved as parts of annotations. Better pre-rendered videos might be produced in this manner (Gutiérrez et al., 2018 have a similar motivation). Texture compression in general and volume compression techniques in particular, (e.g., Guthe et al., 2002; Guthe and Goesele, 2016; Guarda et al., 2017), would help to reduce the GPU memory consumption caused by data for original slices.
VR might be the pivotal instrument for better understanding in teaching complex 3D structures (Philippe et al., 2020), e.g., in medicine or in machine engineering. An effect of VR in training and education in such professions (and also in other areas, e.g., Calvert and Abadia, 2020) might need a more detailed assessment.
A carefully designed user study would allow for a more exact quantification of the gains from using VR in our visualization context. While such a study is beyond the scope of current work, it would be definitely of interest in the future. The evaluation methodology from Gsaxner et al. (2021) is an interesting starting point to the design of such user study.
Of course, viable future work includes applications of our visualizations to reconstructions of further organs and tissues (e.g., future bone marrow, lung, heart, or tonsil probes) and expansion to further modalities of medical (such as MRI or CT) or non-medical data. Recently, we experimented with VR presentation of serial block face electron microscopy data. Multi-modality is an interesting topic, too (Tang et al., 2020). Possible examples of further applications include materials science, computational fluid dynamics, and, most surely, computer graphics.
Data Availability Statement
The datasets analyzed in this study can be found in the Zenodo repositories https://zenodo.org/record/1039241, https://zenodo.org/record/1229434, https://zenodo.org/record/4059595. These data sets include our VR viewer application; they can be inspected in virtual reality. The supplementary videos for this paper are available under https://zenodo.org/record/4587222. They shows the details of our visualizations in dynamics. The videos also showcase various approaches towards visual analytics. All imagery in the videos is a real-time feed from VR headset. The videos show different sessions (but roughtly the same behaviour), once as a binocular feed from the Steam VR mirroring window, once as a monocular feed.
Ethics Statement
The studies involving human participants were reviewed and approved by Marburg University Hospital. Imaging data from old probes was used. Acquisition of the specimens complied with the ethical regulations of Marburg University Hospital at the time of the biological processing. Written informed consent for participation was not required for this study in accordance with the national legislation and the institutional requirements. Written informed consent was obtained from the individual(s), and minor(s)' legal guardian/next of kin, for the publication of any potentially identifiable images or data included in this article.
Author Contributions
OL: conceptualization. OL and BS: data curation. OL and MB: formal analysis, software, visualization, and writing—original draft. MG and BS: funding acquisition. OL, MB, and BS: investigation and methodology. OL: project administration. MG, BS, HP, and OL: resources. OL, MG, and BS: supervision. BS and HP: validation. OL, BS, MG, HP, and MB: writing—review and editing. All authors contributed to the article and approved the submitted version.
Funding
This work was partially supported by DFG grant MU 3118/8-1. Open Access publication was funded by a joint programme of of DFG and Philipps-University Marburg.
Conflict of Interest
MB is now employed by the company BCM Solutions GmbH.
The remaining authors declare that the research was conducted in the absence of any commercial or financial relationships that could be construed as a potential conflict of interest.
Acknowledgments
Most of this work was done when the first two authors were members of University of Bayreuth. We would like to thank Vitus Stachniss, Verena Wilhelmi, and Christine Ulrich (Philipps-University of Marburg) for their efforts with non-VR QC tool. We thank Christian Mühlfeld (Hannover Medical School) for the possibility to test our application on a MacBook Pro 16″. Paul Schmiedel (then: University of Bayreuth) worked on the codebase of the VR tool in Bayreuth. Figure 2 depicts Lena Voß, we would like to thank her for the permission to use this image.
Supplementary Material
The Supplementary Material for this article can be found online at: https://www.frontiersin.org/articles/10.3389/frvir.2021.628449/full#supplementary-material
Supplementary Figure 1. Showcasing our non-VR volume renderer. Endothelia of blood vessels are stained brown in “bone marrow” data set. The blended-in mesh is blue. The volume renderer played an important role in data verification for our publication (Steiniger et al., 2016). (A) Shows volume data representation, (B) presents the visualization of the final, filtered mesh vs. corresponding single section.
References
Ahrens, J., Geveci, B., and Law, C. (2005). “ParaView: an end-user tool for large data visualization,” in The Visualization Handbook, eds C. D. Hansen, and C. R. Johnson (Los Alamos National Laboratory), 717–731. Available online at: https://permalink.lanl.gov/object/tr?what=info:lanl-repo/lareport/LA-UR-03-1560
Apel, S., Batory, D., Kästner, C., and Saake, G. (2016). Feature-Oriented Software Product Lines. Berlin: Springer. doi: 10.1007/978-3-642-37521-7
Ayachit, U. (2015). The ParaView Guide: A Parallel Visualization Application. Clifton Park, NY: Kitware, Inc.
Berg, L. P., and Vance, J. M. (2017). Industry use of virtual reality in product design and manufacturing: a survey. Virtual Real. 21, 1–17. doi: 10.1007/s10055-016-0293-9
Bouaoud, J., El Beheiry, M., Jablon, E., Schouman, T., Bertolus, C., Picard, A., et al. (2020). DIVA, a 3D virtual reality platform, improves undergraduate craniofacial trauma education. J. Stomatol. Oral Maxillofac. Surg. doi: 10.1016/j.jormas.2020.09.009. [Epub ahead of print].
Brooks, F. P. Jr. (1999). What's real about virtual reality? IEEE Comput. Graph. 19, 16–27. doi: 10.1109/38.799723
Burns, M., Haidacher, M., Wein, W., Viola, I., and Gröller, M. E. (2007). “Feature emphasis and contextual cutaways for multimodal medical visualization,” in Proceedings of the 9th Joint Eurographics/IEEE VGTC Conference on Visualization (EG), EUROVIS '07 (Geneva: Eurographics), 275–282. doi: 10.2312/VisSym/EuroVis07/275-282
Calì, C., Kare, K., Agus, M., Veloz Castillo, M. F., Boges, D., Hadwiger, M., et al. (2019). A method for 3D reconstruction and virtual reality analysis of glial and neuronal cells. J. Vis. Exp. 151:e59444. doi: 10.3791/59444
Calvert, J., and Abadia, R. (2020). Impact of immersing university and high school students in educational linear narratives using virtual reality technology. Comput. Educ. 159:104005. doi: 10.1016/j.compedu.2020.104005
Chan, S., Conti, F., Salisbury, K., and Blevins, N. H. (2013). Virtual reality simulation in neurosurgery: technologies and evolution. Neurosurgery 72, A154–A164. doi: 10.1227/NEU.0b013e3182750d26
Checa, D., and Bustillo, A. (2020). A review of immersive virtual reality serious games to enhance learning and training. Multimed. Tools Appl. 79, 5501–5527. doi: 10.1007/s11042-019-08348-9
Chen, X., Xu, L., Wang, Y., Wang, H., Wang, F., Zeng, X., et al. (2015). Development of a surgical navigation system based on augmented reality using an optical see-through head-mounted display. J. Biomed. Inform. 55, 124–131. doi: 10.1016/j.jbi.2015.04.003
Choi, K. S., Chan, S. T., Leung, C. H. M., and Chui, Y. P. (2016). “Stereoscopic three-dimensional visualization for immersive and intuitive anatomy learning,” in IEEE 8th International Conference on Technology for Education, T4E '16 (Mumbai: IEEE), 184–187. doi: 10.1109/T4E.2016.046
Cignoni, P., Callieri, M., Corsini, M., Dellepiane, M., Ganovelli, F., and Ranzuglia, G. (2008). “Meshlab: an open-source mesh processing tool,” in Eurographics Italian Chapter Conference (Geneva), Vol. 2008, 129–136.
Daly, C. J. (2018). The future of education? Using 3D animation and virtual reality in teaching physiology. Physiol. News 111:43. doi: 10.36866/pn.111.43
Daly, C. J. (2019a). From confocal microscope to virtual reality and computer games; technical and educational considerations. Infocus Mag. 54, 51–59. doi: 10.22443/rms.inf.1
Daly, C. J. (2019b). “Imaging the vascular wall: from microscope to virtual reality,” in Textbook of Vascular Medicine, eds R. M. Touyz and C. Delles (Cham: Springer), 59–66. doi: 10.1007/978-3-030-16481-2_6
Derzapf, E., and Guthe, M. (2012). Dependency-free parallel progressive meshes. Comput. Graph. Forum 31, 2288–2302. doi: 10.1111/j.1467-8659.2012.03154.x
Dorweiler, B., Vahl, C. F., and Ghazy, A. (2019). Zukunftsperspektiven digitaler Visualisierungstechnologien in der Gefäβchirurgie. Gefässchirurgie 24, 531–538. doi: 10.1007/s00772-019-00570-x
Duarte, M. L., Santos, L. R., Guimarães Júnior, J. B., and Peccin, M. S. (2020). Learning anatomy by virtual reality and augmented reality. A scope review. Morphologie 104, 254–266. doi: 10.1016/j.morpho.2020.08.004
Egger, J., Gall, M., Wallner, J., Boechat, P., Hann, A., Li, X., et al. (2017). HTC Vive MeVisLab integration via OpenVR for medical applications. PLoS ONE 12:e0173972. doi: 10.1371/journal.pone.0173972
Egger, J., Gunacker, S., Pepe, A., Melito, G. M., Gsaxner, C., Li, J., et al. (2020). “A comprehensive workflow and framework for immersive virtual endoscopy of dissected aortae from CTA data,” in Medical Imaging 2020: Image-Guided Procedures, Robotic Interventions, and Modeling, eds B. Fei and C. A. Linte, Vol. 11315 (Bellingham; Washington, DC: SPIE), 774–779. doi: 10.1117/12.2559239
El Beheiry, M., Doutreligne, S., Caporal, C., Ostertag, C., Dahan, M., and Masson, J. B. (2019). Virtual reality: beyond visualization. J. Mol. Biol. 431, 1315–1321. doi: 10.1016/j.jmb.2019.01.033
Esfahlani, S. S., Thompson, T., Parsa, A. D., Brown, I., and Cirstea, S. (2018). ReHabgame: a non-immersive virtual reality rehabilitation system with applications in neuroscience. Heliyon 4:e00526. doi: 10.1016/j.heliyon.2018.e00526
Faludi, B., Zoller, E. I., Gerig, N., Zam, A., Rauter, G., and Cattin, P. C. (2019). “Direct visual and haptic volume rendering of medical data sets for an immersive exploration in virtual reality,” in Medical Image Computing and Computer Assisted Intervention–MICCAI 2019, LNCS, eds D. Shen, T. Liu, T. M. Peters, L. H. Staib, C. Essert, S. Zhou, et al. (Cham: Springer), 29–37. doi: 10.1007/978-3-030-32254-0_4
Forsberg, A. S., Laidlaw, D. H., van Dam, A., Kirby, R. M., Karniadakis, G. E., and Elion, J. L. (2000). “Immersive virtual reality for visualizing flow through an artery,” in Visualization, VIS '00 (Washington, DC; Salt Lake City, UT: IEEE Computer Society Press), 457–460. Available online at: https://dl.acm.org/doi/proceedings/10.5555/375213
Gsaxner, C., Pepe, A., Li, J., Ibrahimpasic, U., Wallner, J., Schmalstieg, D., et al. (2021). Augmented reality for head and neck carcinoma imaging: Description and feasibility of an instant calibration, markerless approach. Comput. Meth. Prog. Bio. 200:105854. doi: 10.1016/j.cmpb.2020.105854
Guarda, A. F. R., Santos, J. M., da Silva Cruz, L. A., Assunção, P. A. A., Rodrigues, N. M. M., and de Faria, S. M. M. (2017). A method to improve HEVC lossless coding of volumetric medical images. Signal Process. Image 59, 96–104. doi: 10.1016/j.image.2017.02.002
Guthe, S., and Goesele, M. (2016). “Variable length coding for GPU-based direct volume rendering,” in Vision, Modeling & Visualization (EG), VMV '16 (Bayreuth), 77–84. doi: 10.2312/vmv.20161345
Guthe, S., Wand, M., Gonser, J., and Strasser, W. (2002). “Interactive rendering of large volume data sets,” in IEEE Visualization, VIS '02 (Boston, MA), 53–60. doi: 10.1109/VISUAL.2002.1183757
Gutiérrez, J., David, E., Rai, Y., and Callet, P. L. (2018). Toolbox and dataset for the development of saliency and scanpath models for omnidirectional/360° still images. Signal Process. Image 69, 35–42. doi: 10.1016/j.image.2018.05.003
Hasselgren, J., Andersson, M., and Akenine-Möller, T. (2016). “Masked software occlusion culling,” in Proceedings of High Performance Graphics (EG), HPG '16 (Dublin), 23–31.
Inoue, A., Ikeda, Y., Yatabe, K., and Oikawa, Y. (2016). Three-dimensional sound-field visualization system using head mounted display and stereo camera. Proc. Meetings Acoust. 29, 025001-1–025001-13. doi: 10.1121/2.000038100381
Kikinis, R., Pieper, S. D., and Vosburgh, K. G. (2014). “3D slicer: a platform for subject-specific image analysis, visualization, and clinical support,” in Intraoperative Imaging and Image-Guided Therapy, ed F. A. Jolesz (New York, NY: Springer), 277–289. doi: 10.1007/978-1-4614-7657-3_19
Knodel, M. M., Lemke, B., Lampe, M., Hoffer, M., Gillmann, C., Uder, M., et al. (2018). Virtual reality in advanced medical immersive imaging: a workflow for introducing virtual reality as a supporting tool in medical imaging. Comput. Visual Sci. 18, 203–212. doi: 10.1007/s00791-018-0292-3
Liimatainen, K., Latonen, L., Valkonen, M., Kartasalo, K., and Ruusuvuori, P. (2020). Virtual reality for 3D histology: multi-scale visualization of organs with interactive feature exploration. arXiv 2003.11148.
Lobachev, O. (2018). On three-dimensional reconstruction (Habilitation thesis), University of Bayreuth, Bayreuth, Germany.
Lobachev, O. (2020). The tempest in a cubic millimeter: image-based refinements necessitate the reconstruction of 3D microvasculature from a large series of damaged alternately-stained histological sections. IEEE Access 8, 13489–13506. doi: 10.1109/ACCESS.2020.2965885
Lobachev, O., Pfeffer, H., Guthe, M., and Steiniger, B. S. (2019). “Inspecting human 3D histology in virtual reality. Mesoscopic models of the splenic red pulp microvasculature computed from immunostained serial sections,” in 114th Annual Meeting (Würzburg: Institut für Anatomie und Zellbiologie der Universität Würzburg: Anatomische Gesellschaft).
Lobachev, O., Steiniger, B. S., and Guthe, M. (2017a). “Compensating anisotropy in histological serial sections with optical flow-based interpolation,” in Proceedings of the 33rd Spring Conference on Computer Graphics, SCCG '17 (New York, NY: ACM), 14:1–14:11. doi: 10.1145/3154353.3154366
Lobachev, O., Ulrich, C., Steiniger, B. S., Wilhelmi, V., Stachniss, V., and Guthe, M. (2017b). Feature-based multi-resolution registration of immunostained serial sections. Med. Image Anal. 35, 288–302. doi: 10.1016/j.media.2016.07.010
López Chávez, O., Rodríguez, L. F., and Gutierrez-Garcia, J. O. (2020). A comparative case study of 2D, 3D and immersive-virtual-reality applications for healthcare education. Int. J. Med. Inform. 141:104226. doi: 10.1016/j.ijmedinf.2020.104226
Lorensen, W. E., and Cline, H. E. (1987). Marching cubes: a high resolution 3D surface construction algorithm. ACM SIGGRAPH Comput. Graph. 21, 163–169. doi: 10.1145/37402.37422
Mann, S., Furness, T., Yuan, Y., Iorio, J., and Wang, Z. (2018). All reality: virtual, augmented, mixed (x), mediated (x, y), and multimediated reality. arXiv.
Mathur, A. S. (2015). “Low cost virtual reality for medical training,” in 2015 IEEE Virtual Reality (VR), VR '15 (Arles), 345–346. doi: 10.1109/VR.2015.7223437
Mattausch, O., Bittner, J., and Wimmer, M. (2008). CHC++: coherent hierarchical culling revisited. Comput. Graph. Forum 27, 221–230. doi: 10.1111/j.1467-8659.2008.01119.x
Misiak, M., Schreiber, A., Fuhrmann, A., Zur, S., Seider, D., and Nafeie, L. (2018). “IslandViz: a tool for visualizing modular software systems in virtual reality,” in 2018 IEEE Working Conference on Software Visualization (VISSOFT) (Madrid: IEEE), 112–116. doi: 10.1109/VISSOFT.2018.00020
Moro, C., Štromberga, Z., Raikos, A., and Stirling, A. (2017). The effectiveness of virtual and augmented reality in health sciences and medical anatomy. Anat. Sci. Educ. 10, 549–559. doi: 10.1002/ase.1696
Philippe, S., Souchet, A. D., Lameras, P., Petridis, P., Caporal, J., Coldeboeuf, G., et al. (2020). Multimodal teaching, learning and training in virtual reality: a review and case study. Virtual Real. Intell. Hardw. 2, 421–442. doi: 10.1016/j.vrih.2020.07.008
Pieper, S., Halle, M., and Kikinis, R. (2004). “3D slicer,” in IEEE International Symposium on Biomedical Imaging: Nano to Macro (Arlington, VA), Vol. 1, 632–635. doi: 10.1109/ISBI.2004.1398617
Pieterse, A. D., Hierck, B. P., de Jong, P. G. M., Kroese, J., Willems, L. N. A., and Reinders, M. E. J. (2020). Design and implementation of “AugMedicine: lung cases,” an augmented reality application for the medical curriculum on the presentation of dyspnea. Front. Virtual Real. 1:577534. doi: 10.3389/frvir.2020.577534. Publisher: Frontiers
Pinter, C., Lasso, A., Choueib, S., Asselin, M., Fillion-Robin, J. C., Vimort, B., et al. (2020). SlicerVR for Medical Intervention Training and Planning in Immersive Virtual Reality. IEEE. Available online at: https://ieeexplore.ieee.org/abstract/document/9047949
Preim, B., and Saalfeld, P. (2018). A survey of virtual human anatomy education systems. Comput. Graph. 71, 132–153. doi: 10.1016/j.cag.2018.01.005
Quam, D. J., Gundert, T. J., Ellwein, L., Larkee, C. E., Hayden, P., Migrino, R. Q., et al. (2015). Immersive visualization for enhanced computational fluid dynamics analysis. J. Biomech. Eng. Trans. ASME 137, 031004-1–031004-12. doi: 10.1115/1.4029017
Ritter, F., Boskamp, T., Homeyer, A., Laue, H., Schwier, M., Link, F., et al. (2011). Medical image analysis. IEEE Pulse 2, 60–70. doi: 10.1109/MPUL.2011.942929
Rizvic, S., Boskovic, D., Okanovic, V., Kihic, I. I., and Sljivo, S. (2019). “Virtual reality experience of Sarajevo war heritage,” in Eurographics Workshop on Graphics and Cultural Heritage, eds S. Rizvic and K. Rodriguez Echavarria (Sarajevo; Bosnia; Herzegovina: Eurographics), 1–6. doi: 10.2312/gch.20191340
Schneider, J. P., Hegermann, J., and Wrede, C. (2021). Volume electron microscopy: analyzing the lung. Histochem. Cell. Biol. 155, 241–260. doi: 10.1007/s00418-020-01916-3
Scholl, I., Suder, S., and Schiffer, S. (2018). “Direct volume rendering in virtual reality,” in Bildverarbeitung für die Medizin 2018, eds A. Maier, T. M. Deserno, H. Handels, K. H. Maier-Hein, C. Palm, and T. Tolxdorff (Berlin; Heidelberg: Springer), Informatik Aktuell, 297–302. doi: 10.1007/978-3-662-56537-7_79
Schweigger-Seidel, F. (1862). Untersuchungen über die Milz. Arch. Pathol. Anat. Ph. 23, 526–570. doi: 10.1007/BF01939038
Shen, R., Boulanger, P., and Noga, M. (2008). “MedVis: a real-time immersive visualization environment for the exploration of medical volumetric data,” in Information Visualization in Medical and Biomedical Informatics, MEDIVIS '08 (London), 63–68. doi: 10.1109/MediVis.2008.10
Shimabukuro, M. H., and Minghim, R. (1998). “Visualisation and reconstruction in dentistry,” in Information Visualization (London), 25–31. doi: 10.1109/IV.1998.694195
Silva, S., Santos, B. S., Madeira, J., and Silva, A. (2009). “Processing, visualization and analysis of medical images of the heart: an example of fast prototyping using MeVisLab,” in 2009 2nd International Conference in Visualisation (Barcelona), 165–170. doi: 10.1109/VIZ.2009.40
Slater, M., Gonzalez-Liencres, C., Haggard, P., Vinkers, C., Gregory-Clarke, R., Jelley, S., et al. (2020). The ethics of realism in virtual and augmented reality. Front. Virtual Real. 1:1. doi: 10.3389/frvir.2020.00001
Stefani, C., Lacy-Hulbert, A., and Skillman, T. (2018). ConfocalVR: immersive visualization for confocal microscopy. J. Mol. Biol. 430, 4028–4035. doi: 10.1016/j.jmb.2018.06.035
Steiniger, B., Stachniss, V., Schwarzbach, H., and Barth, P. J. (2007). Phenotypic differences between red pulp capillary and sinusoidal endothelia help localizing the open splenic circulation in humans. Histochem. Cell. Biol. 128, 391–398. doi: 10.1007/s00418-007-0320-8
Steiniger, B. S., Pfeffer, H., Guthe, M., and Lobachev, O. (2021). Exploring human splenic red pulp vasculature in virtual reality. Details of sheathed capillaries and the open capillary network. Histochem. Cell Biol. 155, 341–354. doi: 10.1007/s00418-020-01924-3
Steiniger, B. S., Stachniss, V., Wilhelmi, V., Seiler, A., Lampp, K., Neff, A., et al. (2016). Three-dimensional arrangement of human bone marrow microvessels revealed by immunohistology in undecalcified sections. PLoS ONE 11:e0168173. doi: 10.1371/journal.pone.0168173
Steiniger, B. S., Ulrich, C., Berthold, M., Guthe, M., and Lobachev, O. (2018a). Capillary networks and follicular marginal zones in human spleens. Three-dimensional models based on immunostained serial sections. PLoS ONE 13:e0191019. doi: 10.1371/journal.pone.0191019
Steiniger, B. S., Wilhelmi, V., Berthold, M., Guthe, M., and Lobachev, O. (2018b). Locating human splenic capillary sheaths in virtual reality. Sci. Rep. 8:15720. doi: 10.1038/s41598-018-34105-3
Stets, J. D., Sun, Y., Corning, W., and Greenwald, S. W. (2017). “Visualization and labeling of point clouds in virtual reality,” in SIGGRAPH Asia 2017 Posters—SA '17 (Bangkok: ACM), 1–2. doi: 10.1145/3145690.3145729
Stone, J. E., Kohlmeyer, A., Vandivort, K. L., and Schulten, K. (2010). “Immersive molecular visualization and interactive modeling with commodity hardware,” in Advances in Visual Computing, ISVC '10, eds G. Bebis, R. Boyle, B. Parvin, D. Koracin, R. Chung, R. Hammound, et al. (Berlin; Heidelberg: Springer), 382–393. doi: 10.1007/978-3-642-17274-8_38
Sutherland, I. E. (1965). “The ultimate display,” in Proceedings of IFIP Congress, ed W. A. Kalenich (New York City), 506–508.
Sutherland, I. E. (1968). “A head-mounted three dimensional display,” in Proceedings of the December 9-11, 1968, Fall Joint Computer Conference, part I, AFIPS '68 (Fall, Part I) (New York, NY: ACM), 757–764. doi: 10.1145/1476589.1476686
Tang, L., Tian, C., Li, L., Hu, B., Yu, W., and Xu, K. (2020). Perceptual quality assessment for multimodal medical image fusion. Signal Process. Image 85:115852. doi: 10.1016/j.image.2020.115852
Tomikawa, M., Hong, J., Shiotani, S., Tokunaga, E., Konishi, K., Ieiri, S., et al. (2010). Real-time 3-dimensional virtual reality navigation system with open MRI for breast-conserving surgery. J. Am. Coll. Surg. 210, 927–933. doi: 10.1016/j.jamcollsurg.2010.01.032
Ulrich, C., Grund, N., Derzapf, E., Lobachev, O., and Guthe, M. (2014). “Parallel iso-surface extraction and simplification,” in WSCG Communications Proceedings, WSCG '14, ed V. Skala (Pilzen).
Uppot, R. N., Laguna, B., McCarthy, C. J., De Novi, G., Phelps, A., Siegel, E., et al. (2019). Implementing virtual and augmented reality tools for radiology education and training, communication, and clinical care. Radiology 291, 570–580. doi: 10.1148/radiol.2019182210
Uruthiralingam, U., and Rea, P. M. (2020). “Augmented and virtual reality in anatomical education—a systematic review,” in Biomedical Visualisation, Vol. 1235 of Advances in Experimental Medicine and Biology, ed P. M. Rea (Cham: Springer), 89–101. doi: 10.1007/978-3-030-37639-0_5
van Dam, A., Forsberg, A. S., Laidlaw, D. H., LaViola, J. J., and Simpson, R. M. (2000). Immersive VR for scientific visualization: a progress report. IEEE Comput. Graph. 20, 26–52. doi: 10.1109/38.888006
Walsh, C. M., Sherlock, M. E., Ling, S. C., and Carnahan, H. (2012). Virtual reality simulation training for health professions trainees in gastrointestinal endoscopy. Cochrane Database Syst. Rev. 8:CD008237. doi: 10.1002/14651858.CD008237.pub2
Williams, J. K. (2019). A method for viewing and interacting with medical volumes in virtual reality (Master's thesis), Iowa State University, Ames, IA, United States.
Wißmann, N., Mišiak, M., Fuhrmann, A., and Latoschik, M. E. (2020). “Accelerated stereo rendering with hybrid reprojection-based rasterization and adaptive ray-tracing,” in 2020 IEEE Conference on Virtual Reality and 3D User Interfaces (VR) (Atlanta, GA: IEEE), 828–835. doi: 10.1109/VR46266.2020.00107 ISSN: 2642-5254
Xia, P., Lopes, A. M., and Restivo, M. T. (2013). Virtual reality and haptics for dental surgery: a personal review. Vis. Comput. 29, 433–447. doi: 10.1007/s00371-012-0748-2
Keywords: anatomy, scientific visualization, 3D reconstruction, virtual reality, histological serial sections
Citation: Lobachev O, Berthold M, Pfeffer H, Guthe M and Steiniger BS (2021) Inspection of Histological 3D Reconstructions in Virtual Reality. Front. Virtual Real. 2:628449. doi: 10.3389/frvir.2021.628449
Received: 17 November 2020; Accepted: 18 March 2021;
Published: 03 May 2021.
Edited by:
Manos Kamarianakis, University of Crete, GreeceReviewed by:
Pekka Ruusuvuori, University of Tampere, FinlandJan Egger, Graz University of Technology, Austria
Jean-Baptiste Masson, Institut Pasteur, France
Copyright © 2021 Lobachev, Berthold, Pfeffer, Guthe and Steiniger. This is an open-access article distributed under the terms of the Creative Commons Attribution License (CC BY). The use, distribution or reproduction in other forums is permitted, provided the original author(s) and the copyright owner(s) are credited and that the original publication in this journal is cited, in accordance with accepted academic practice. No use, distribution or reproduction is permitted which does not comply with these terms.
*Correspondence: Oleg Lobachev, b2xlZy5sb2JhY2hldkBsZWlibml6LWZoLmRl