 Nozomi Takahashi1*
 Tomohiro Amemiya1,2
 Takuji Narumi1
 Hideaki Kuzuoka1,2
 Michitaka Hirose3
 Kazuma Aoyama2,3*
- 1The Graduate School of Information Science and Technology, The University of Tokyo, Bunkyo, Japan
- 2Virtual Reality Educational Research Center, The University of Tokyo, Tokyo, Japan
- 3Research Center for Advanced Science and Technology, The University of Tokyo, Tokyo, Japan
While virtual reality technology enables users to walk on surfaces of various shapes in virtual environments, these experiences are often on a flat floor, and any discordance between visual and somatosensory information hampers the immersive experience. To resolve this issue, we have focused on the ankle joint angle as an essential cue in detecting the surface shape of the ground. To modulate the sensation of the ankle joint angle, we propose novel percutaneous electrical stimulation methods that stimulate four targeted ankle tendons: the tibialis anterior muscle tendon, the Achilles tendon, the peroneus longus muscle tendon, and the flexor digitorum longus tendon. Since electrically stimulating the elbow tendon is known to evoke reflexive hand movement, electrically stimulating the ankle tendon is expected to evoke a body tilt due to illusory changes in the ankle joint angle. In this study, we designed electrode configurations to stimulate the above four ankle tendons using a finite element analysis and investigated the effect of electrically stimulating the ankle tendons on the subjective sensation of body tilt and actual body sway through psychophysical experiments. The results revealed that applying this stimulation with our novel electrode configurations can induce a subjective sensation of body tilt and actual body sway in a direction opposite to the stimulated part.
Introduction
Owing to their recent price reduction, head-mounted displays (HMDs) are now more accessible to the public, subsequently increasing the popularity of virtual reality (VR) experiences. An HMD can simulate an enormous virtual environment. To take advantage of this feature, methods that help navigation through a virtual environment have been proposed (Boletsis, 2017). For example, a method that synchronizes body position provides an immersive experience by allowing users to move intuitively on their feet (Bruder and Steinicke, 2014). However, this method provides only visual information. When standing on sloped ground in the real world, ankle joint angles vary with ground tilt and induce somatosensory sensations. In comparison, VR activities are typically experienced on flat indoor floor, in which case the somatosensory and visual sensations may be inconsistent.
Such an inconsistency hampers the immersive experience. To resolve this issue, many studies have been conducted to present somatosensory sensations induced by the surface shape of the ground in a virtual environment. A popular approach is to use mechanical devices that deform shapes in a real environment with actuators to reproduce the surface shape of the ground in a virtual environment. For example, Schmidt et al. (2015) developed level-ups, a boot-shaped device whose height from the floor can be controlled by actuators. With this device, a discrete change in the ground height in a virtual environment can be replicated. In addition, Je et al. (2021) proposed Elevate, a deformable platform that users can walk on, that reproduces the continuous changes in the shape of the ground in the virtual environment using a pin array. Although these devices present an accurate ground surface shape by controlling the actuators, they are typically expensive, large, and heavy because they require complex structures. In addition, physically changing the shape of the ground around the feet during the use of HMDs can be dangerous.
In contrast to methods that modulate the physical environment using actuators, there is another approach that can induce a sensation in the ankle joint that corresponds to a standing on a sloped terrain in a virtual environment. While standing on a slope in a physical environment, the angle of the ankle joint changes by the same amount as the tilt of the ground to keep the body parallel to gravity (Sasagawa et al., 2009). Considering this fact, presenting a virtual sensation of the angle of the ankle joint may change users’ perception of ground tilt without modulating the physical environment.
For presentation of a virtual sensation of an angle in the ankle joint, the illusory sensation of motion induced by tendon vibration is widely acknowledged. Goodwin et al. (1972) found that applying a vibration of 100 Hz to the tendons of the biceps or triceps increases the error of the estimated angle of the elbow joint. This phenomenon is presumed to be due to the activation of the muscle spindle (Seki et al., 2011). In some recent studies, tendon vibration has been utilised in VR experiences to present a sensation of body movement, with only small motion or even without any actual motion occurring (Hagimori et al., 2019; Tanaka et al., 2020). However, if tendon vibration is applied to ankle joints, the mechanical vibrators must be fixed to the tendons around the ankle, making it difficult for users to move smoothly in a standing posture. In addition, to strongly stimulate the tendon using vibration, large and heavy vibrators are required. To present a virtual sensation of an angle in the ankle joint without having to install a bulky physical device around the feet, we focused on transcutaneous electrical stimulation, which can induce various sensations by applying a weak current through surface electrodes attached to the skin. This technique has recently been utilised in the field of human–computer interaction and VR as a more inexpensive and simpler way of inducing sensation with a lighter and smaller device (Tamaki et al., 2016; Aoyama et al., 2017). Moreover, the extent of the sensation can be controlled by the intensity of applied current.
To present joint sensation, Kajimoto (2013) applied tendon electrical stimulation (TES) to the outside of the elbow joint and noted an illusory inward movement of the forearm. The author also suggested that the Golgi tendon organ (GTO), which detects muscle tension (Moore, 1984), was involved in this illusory movement. Based on this result, we hypothesise that applying TES to the tendons around the ankle (ankle TES) could induce an illusory sensation of an angle in the ankle joint, leading to a change in the perception of ground tilt. Moreover, the GTO is known to cause a Golgi tendon reflex, which relaxes the agonistic muscle and contracts the antagonistic muscle when it detects continuous muscle tension (Moore, 1984). This suggests that ankle TES would also induce the Golgi tendon reflex and cause an actual postural change while standing.
To investigate whether applying a current on the tendons around the ankle can stimulate the tendons, we previously conducted a psychophysical experiment that investigated the subjective intensity and direction of force sensation around the ankle and recorded the temporal pattern of the centre of pressure (CoP) (Takahashi et al., 2021). Note that the other research group has reported that the force sensation can be induced by TES (Takahashi et al., 2016). While the result showed that applying a current on the tibialis anterior muscle tendon and Achilles tendon can induce force sensation in a direction opposite to the stimulated part, which indicates that these tendons were stimulated by the current, the experiment had some limitations. First, we simply placed the electrodes on the targeted tendons; however, whether these electrodes stimulated the targeted tendons independently was unclear. Second, only limited tendons were selected as the target. Both the tibialis anterior muscle tendon and the Achilles tendon are responsible for the anteroposterior movement of the ankle, while the ankle can also be moved in a lateral direction by other tendons. Third, the result of the CoP was unreliable because of the inadequate process of recording the CoP; the measurement under a specific condition was conducted only once, and a baseline correction of obtained data was conducted based on the single data obtained at the beginning of the measurement.
In this study, we selected four targeted tendons according to the classification of ankle joint movement and developed novel stimulation configurations, based on the simulation of current density, to stimulate the targeted tendon under the electrodes most strongly among four targeted tendons. With these stimulation configurations, we evaluated the effect of ankle TES on the sensation of the angle of the ankle joint and the actual body by conducting psychophysical experiments with more elaborated methods.
Stimulation Design and Simulation
Electrode Configuration Design
There are six main types of ankle joint movements: dorsiflexion, plantarflexion, inversion, eversion, internal rotation, and external rotation (Saltzman, 1997). Among these movements, dorsiflexion, plantarflexion, inversion, and eversion, which are movements in the sagittal and coronal planes, are considered to be involved in the detection of ground tilt. Therefore, ankle TES should be applied to tendons that are responsible for these movements to present a sensation of ground tilt in all directions. In our study, we selected the tibialis anterior muscle tendon (TA), Achilles tendon (AC), flexor digitorum longus muscle tendon (FDL), and peroneus longus muscle tendon (PL) as the stimulation targets. Figure 1 shows the anatomical positions of the tendons. The TA is at the front side of the ankle and is responsible for dorsiflexion of the foot. The AC is at the back side of the ankle and is responsible for plantarflexion of the foot. The FDL is inside the ankle and is responsible for foot inversion. The PL is outside the ankle and is responsible for foot eversion.
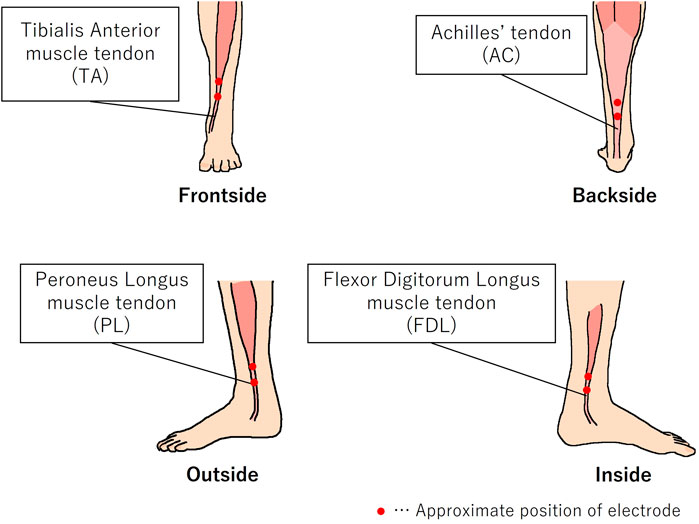
FIGURE 1. Anatomical positions of the targeted tendons in the left leg. The red dots show the approximate positions of the electrodes placed for electrical stimulation.
To stimulate these tendons, electrodes were placed above them (red dots in Figure 1). Though it is desirable that these tendons are stimulated independently to control the direction of the presented sensation of ground tilt, these tendons are located close to each other. Hence, it is expected that the current applied on a targeted tendon also affects other tendons. However, if the tendon under the electrodes is stimulated most strongly among the four targeted tendons, the stimulation of the tendon under the electrodes is expected to have the largest effect on the sensation of an ankle joint angle. To confirm that each electrode configuration can stimulate the targeted tendon most strongly among the four targeted tendons, the current density distributions of the tendons, produced by the current applied by each electrode configuration, were simulated using the finite element method with a 3D model of the human leg.
Pre-Processing of 3D Model
A solid 3D male model (Zygote Media Group Inc.) was used for the simulation. This model was constructed based on magnetic resonance imaging and computed tomography and was consistent with anatomical knowledge. The model was imported into Scan IP (Simpleware, SYNOPSYS Inc.), and all parts of the model, except for the left leg, were cut out. Subsequently, the elements of the model were classified into six groups: bone, cartilage, nerve, vessel, skin, and muscle. In this process, the tendon was classified as muscle because the tendon and muscle are inseparable in the model. Since their conductivities are almost the same (tendon: 0.30 S/m, muscle: 0.35 S/m) (Laakso and Hirata, 2013), the integration is expected to have little effect on the result of the simulation of the distribution of current density. Moreover, there are some unnatural gaps in the model because the model does not contain blood or inner tissue. These gaps do not exist in the actual human body and could possibly make the result of the simulation inaccurate by preventing the propagation of the simulated current. Hence, these gaps were filled by the Boolean operation function of Scan IP. Thereafter, the filled regions inside the vessels were classified as blood, and the remaining regions were classified as inner tissue. Four pairs of electrodes were manually attached to the skin model (eight electrodes in total). On each targeted tendon, the upper and lower electrodes were treated as the anode and cathode, respectively. Figure 2 shows an overview of the processed model and the position of the attached electrodes in the model.
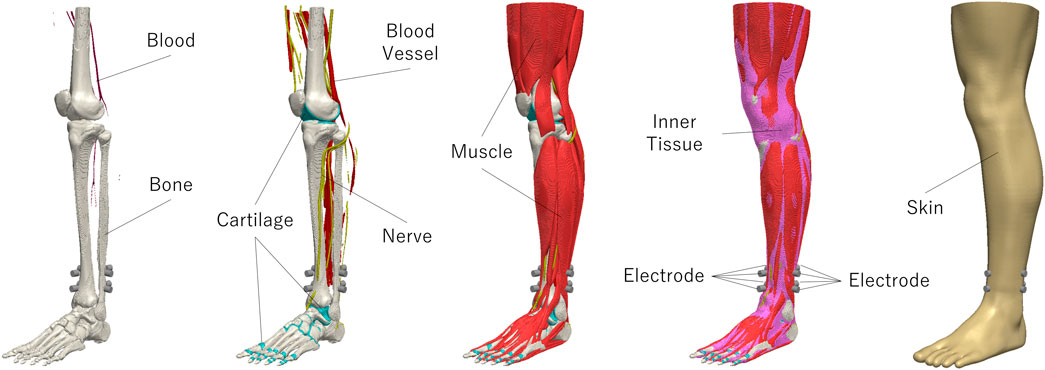
FIGURE 2. Overview of the processed model of the left leg and position of electrodes.
Simulation of Current Density
The processed model was converted into NASTRAN format and imported into COMSOL Multiphysics 5.6 (COMSOL Inc.). Before the simulation, the conductivity values for each tissue were set, as listed in Table 1. These values were defined based on a previous study conducted by Laakso and Hirata (2013). The Laplace equation ∇ · (σ∇V) = 0 (where V is the electrical potential, and σ is the conductivity) was solved by applying the following boundary conditions:
1) The inward current density, Jn, was applied to the exposed surface of the anode (upper electrode).
2) A ground was applied to the exposed surface of the cathode (lower electrode).
3) All other external surfaces were treated as insulated.
4) The inward current density (Jn) for each anode was defined to adjust the value of the current to 4.0 mA, considering the superficial size of each electrode.
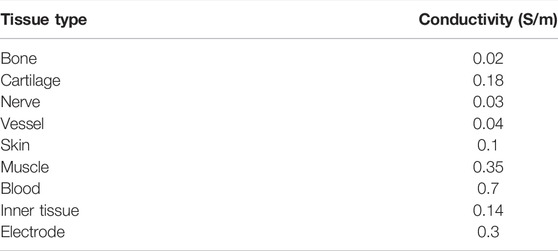
TABLE 1. Conductivity of each tissue in the model. S (siemens) is the SI derived unit of electric conductance.
The simulation was repeated for the four target tendons: TA, AC, PL, and FDL.
Simulation Result
Figure 3 shows the simulated current density distribution of the muscles in each simulation, where red indicates a high current density (higher than 10 A/m2), while blue indicates a low current density. Table 2 shows the maximum current density distribution of the four targeted tendons in each simulation. As we expected, the table shows that each stimulation changes the current density distribution not only of the tendon under the electrodes but also of the other targeted tendons. However, the maximum current density distribution of the tendons under the electrodes is at least three times higher, and 14 times higher on average, than that of the other targeted tendons. Whether the extent of the effect of stimulation of targeted tendons other than that under the electrodes is unclear, these results indicate that the four proposed types of ankle TES configurations can stimulate the targeted tendon under the electrodes most strongly and the stimulation of the tendon is considered to have the largest effect on the sensation of an ankle joint angle. Hence, we adopted these electrode configurations to apply current in the following experiment.
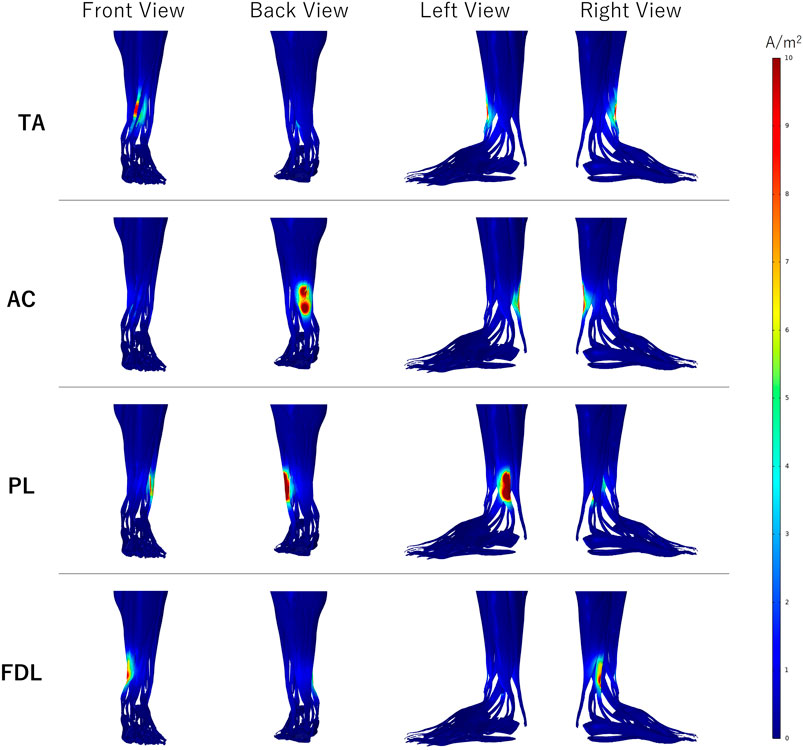
FIGURE 3. Distributions of the current density in the simulations.
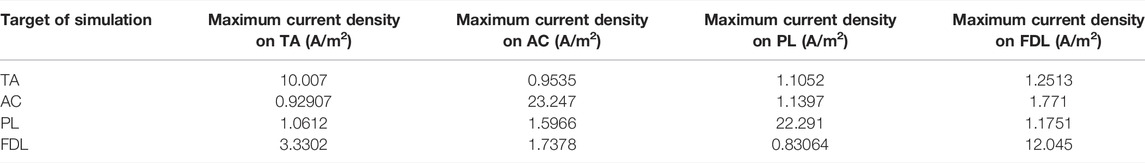
TABLE 2. Maximum current density distribution on each targeted tendon in each simulation.
Material and Methods for Psychophysical Experiment
The purpose of this study was to demonstrate the effect of the simulated ankle TES configurations on the sensation of an ankle joint angle. A psychophysical experiment was conducted to achieve this purpose. For the psychophysical experiment, we recruited participants on whom five experimental conditions were applied, and a subjective sensation of body tilt and objective body sway were measured. The experimental protocol was approved by the local ethics research committee of the Graduate School of Information Science and Technology, University of Tokyo. Twelve healthy adults (11 males and 1 female) participated in the experiment, with an average age of 23.1 years.
Hypothesis
Kajimoto (2013) reported that applying TES to the outside of the elbow induces an illusory inward movement of the forearm, suggesting that TES induces illusory movement in a direction opposite to the stimulated part. In addition, if the GTO is assumed to be stimulated by TES, the Golgi tendon reflex, which relaxes the agonistic muscle and contracts the antagonistic muscle, might be induced, making participants unconsciously lean in the opposite direction to the stimulated body part owing to the reflex. Therefore, we have formulated the following hypotheses regarding the effect of our novel ankle TES configuration:
H1. Ankle TES induces a subjective sensation of body tilt solely in the direction opposite to the stimulated part.
H2. Ankle TES evokes body sway solely in the direction opposite to the stimulated part.
Experimental Conditions
Five experimental conditions were used in the experiment (Table 3). The front side (FS) condition stimulates the TA of both feet. The back side (BS) condition stimulates the AC of both feet. The left side (LS) condition stimulates the PL of the left foot and the FDL of the right foot. The right side (RS) condition stimulates the FDL of the left foot and PL of the right foot. The no-stimulation (NS) condition is a baseline condition in which no tendon is stimulated. Each experimental condition was repeated 10 times. Figure 4 shows the position of the electrodes used under all conditions where current was applied. These electrodes were manually placed on each targeted tendon referring to the simulated electrodes configurations to stimulate each targeted tendon as independently as possible. Under all conditions, except for the NS condition, a bipolar square wave was used as the waveform of the current, and the frequency of the current was set to 80 Hz based on previous research that investigated the relationship between the current frequency and the intensity of force sensation induced by TES (Takahashi et al., 2016). The amplitude of the current wave was adjusted to the maximum value within the participant’s uncomfortable sensation threshold for each stimulus position to make the effect of the stimulation clearer. At the beginning of the adjustment, the participant was asked to remove their shoes and socks and stand with their feet together, which was the same posture as that during experiment. Thereafter, 80 Hz square wave current was applied to the stimulus position. The amplitude of the current wave was increased in steps of 0.5 mA from 0 mA until the participant reported any uncomfortable sensations such as strong tactile sensation or vibration. Thereafter, the amplitude of the current wave was decreased in steps of 0.1 mA. When the participant reported that the uncomfortable sensation disappeared, the amplitude of the current wave at that time was decided as the value used in the experiment. The adjustment was repeated for each stimulus position. If the threshold of uncomfortable sensation exceeded 4 mA, the amplitude of the current was selected as 4 mA because the electrical stimulator used in the experiment could not generate larger than 4 mA of current. The value was determined by our pilot study that investigated the threshold of uncomfortable sensation with the same adjustment procedure as stated above.
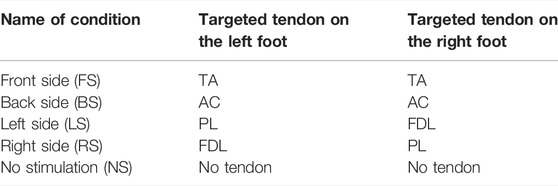
TABLE 3. Experimental conditions.
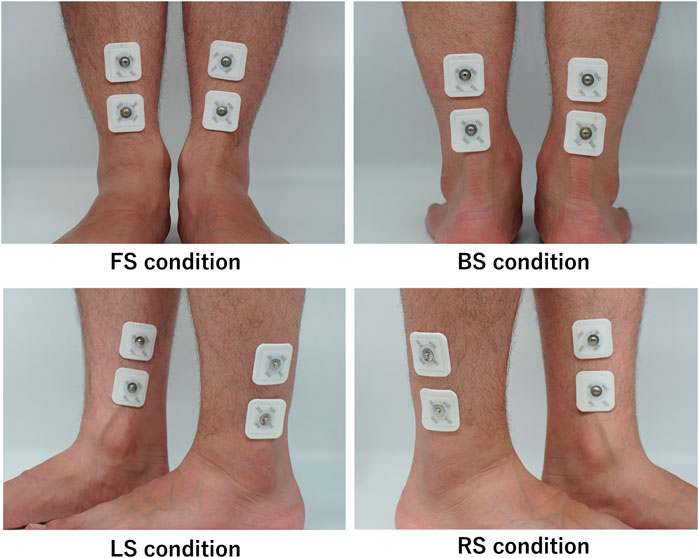
FIGURE 4. Position of electrodes.
Data Collection and Analysis for Subjective Sensation
To evaluate the effect of ankle TES on the sensation of the ankle joint angle, participants were asked to fill in a questionnaire regarding their subjective sensation of body tilt during stimulation. The following questions were posed:
Q1. Did you feel a sensation of lateral body tilt? (1: strong sensation of leftward body tilt, 4: no sensation of lateral body tilt, 7: strong sensation of rightward body tilt).
Q2. Did you feel a sensation of anteroposterior body tilt? (1: strong sensation of forward body tilt, 4: no sensation of anteroposterior body tilt, 7: strong sensation of backward body tilt).
Each question was answered by choosing a number from one to seven. For each question, 10 answers under the same experimental condition were averaged and treated as a representative score for each condition.
Data Collection and Analysis for Actual Body Sway
Based on the role of the GTO, actual body sway was expected to be induced by ankle TES. However, it was difficult to measure body sway because the movement of every body part was involved. Therefore, we measured the CoP and head position as representative values of body sway. The Wii Balance Board (Nintendo Co., Ltd.) was used to measure the 2D position of the CoP, and Polhemus G4 (Polhemus, Inc.) was used to measure the 3D position of the head by attaching a sensor on top of the participant’s head. In both devices, the rightward, forward, and upward directions of the participants were set as the positive direction of the lateral, anteroposterior, and vertical axes, respectively. In addition, these values were measured for 15 s at a frequency of 10 Hz. Therefore, 150 data points for the CoP and head position were obtained in a single measurement. In very rare cases, the data could not be stored on the PC correctly. In such cases, the broken data was replaced by the average of the data before and after the damaged data.
In each measurement, the initial position of the CoP was calculated by averaging 50 CoP data points from the first 5s of measurement. Baseline correction was then applied by subtracting the initial position from the entire CoP dataset. Thereafter, 10 corrected trial data under the same experimental condition were averaged and treated as representative data for that condition. The same process was applied to the head-position data. We estimated a latency of stimulus onset (offset) from the earliest (latest) time when the displacement of CoP kept exceeding the mean ± SD of the CoP under the NS condition.
Procedure
The experiment involved 50 trials in total (five experimental conditions × 10 repetitions). At the beginning of the experiment, the amplitude of the current applied in each experimental condition was adjusted according to the procedure described in Experimental Conditions. After the adjustment, these trials were conducted in a randomised order. In each trial, the CoP and head position were measured for 15 s, as shown in Figure 5. During the measurement, participants were asked to remove their shoes and socks and stand on the Wii Balance Board with their feet together, known as the Romberg’s erect posture, with their eyes closed (Rogers, 1980). The ankle TES under one of the experimental conditions was applied for 5 s at a time of 5 s after the start of the trial. After the measurement, the participants were allowed to open their eyes and answer the questionnaire on a tablet (Surface Pro 7, Microsoft Corp.). To eliminate the influence of fatigue, the participants could rest at any time.
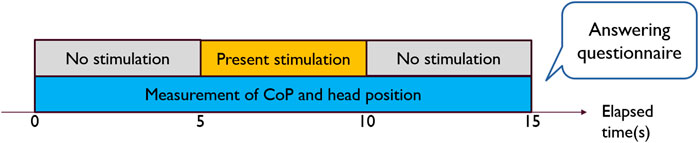
FIGURE 5. Time sequence of tendon electrical stimulation and measurement of the centre of pressure (CoP) and head position.
Statistical Analysis
The results of the questionnaire regarding the intensity of the subjective sensation of body tilt, the largest displacement of CoP, and the largest displacement of the head position were analysed by a many-to-one multiple comparison test, which compares a control condition (baseline, i.e., NS condition) with other conditions (FS, BS, LS, and RS conditions). We did not conduct a comparison of all possible pairs of conditions because our hypotheses mainly focus on the effect of ankle TES compared with a control condition (NS condition). To decide the method of a many-to-one multiple comparison test, the Shapiro-Wilk normality test was initially conducted to determine whether the data don’t follow a normal distribution. If the assumption of normality was not violated in each condition, Dunnett’s method, a parametric method of multiple comparison test, was conducted. Otherwise, Steel’s method, a nonparametric version of Dunnett’s method (Steel, 1959), was conducted. We did not conduct ANOVA F-test before either method of multiple comparison, following previous research (Hothorn, 2016).
Result of Psychophysical Experiment
The Amplitude of the Current Wave
The amplitude of the current wave of TES was determined for each foot and participant. The averaged amplitudes on a left foot in the FS, BS, LS, and RS conditions across participants were 3.17 ± 0.83, 2.82 ± 0.90, 3.00 ± 1.08, and 2.79 ± 0.87 mA, respectively. In contrast, the averaged amplitudes on a right foot in the FS, BS, LS, and RS conditions were 3.24 ± 0.99, 2.83 ± 1.08, 2.95 ± 1.13, and 3.04 ± 1.12 mA, respectively. Two-factor ANOVA was conducted on the amplitude of the current wave, with foot type (left and right) and experimental condition (FS, BS, LS, and RS) used as the independent factors. The result of ANOVA did not show any significant effect or interaction effect.
Questionnaire
Figure 6 shows the average questionnaire scores regarding the intensity of the subjective sensation of body tilt. The result of the Shapiro-Wilk normality test showed that the result of Q1in the NS, FS, and BS conditions and the result of Q2 in the NS, LS, and RS conditions do not follow a normal distribution (p < 0.05). Therefore, statistical analysis was performed using Steel’s method for nonparametric multiple comparison, with the NS condition as the control. The results showed that the average score for Q1 was significantly higher under the LS condition and lower under the RS condition than under the NS condition (LS vs. NS: p = 0.0075, RS vs. NS: p = 0.0089) (Figure 6A). Moreover, the average score for Q2 was significantly higher under the FS condition and lower under the BS condition than under the NS condition (FS vs. NS: p = 0.0011, BS vs. NS: p = 0.0029) (Figure 6B).
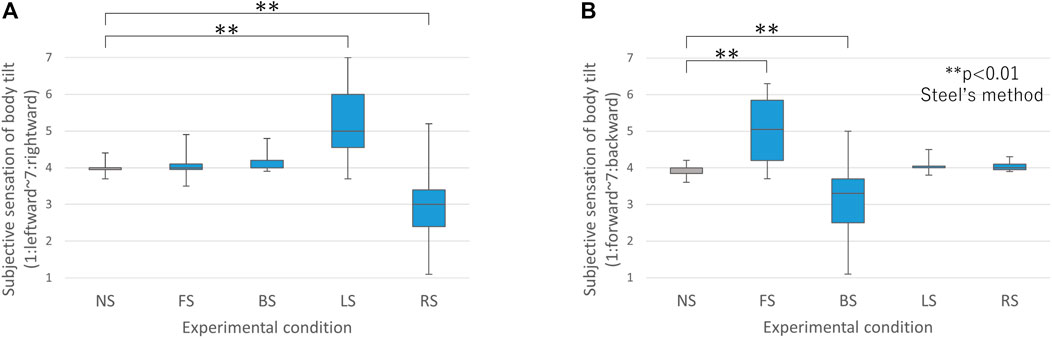
FIGURE 6. Average of participants’ answers on the questionnaire: (A) Result of the intensity of subjective sensation of lateral body tilt. 1 Indicates a strong sensation of leftward body tilt. 4 Indicates no sensation of lateral body tilt. 7 Indicates a strong sensation of rightward body tilt. (B) Result of the intensity of subjective sensation of anteroposterior body tilt. 1 Indicates a strong sensation of forward body tilt. 4 Indicates no sensation of anteroposterior body tilt. 7 Indicates a strong sensation of backward body tilt. (NS: No stimulation, FS: front side, BS: back side, LS: left side, or RS: right side).
CoP
Figure 7 shows the average temporal pattern of the CoP for each stimulation condition. In addition, the largest displacement of the CoP from the initial position during the presentation of stimulation in four directions (forward, backward, leftward, and rightward) was averaged among the participants (Figure 8). These figures show that the LS, RS, FS, and BS conditions evoked the largest rightward, leftward, backward, and forward CoP changes, respectively. Additionally, Figure 8 shows the largest displacement of the CoP. The result of the Shapiro-Wilk normality test showed that the data of the largest forward displacement in the NS, FS, RS conditions, the largest leftward displacement in the FS and RS conditions and the largest rightward displacement in the NS, LS, and RS conditions do not follow a normal distribution (p < 0.05). Although the result did not show that the data of the largest backward displacement did not follow a normal distribution in each condition (p > 0.05), Steel’s method was adopted in all directions to unify the method across all directions of CoP data. The results of the multiple comparison tests with Steel’s method showed that the largest backward displacement of the CoP from the initial position was significantly greater under the FS and LS conditions than under the NS condition (FS vs. NS: p = 0.0059, LS vs. NS: p = 0.035) (Figure 8B). Moreover, marginally significant differences were found between the NS and BS conditions in the forward displacement, the NS and RS conditions in the leftward displacement, and the NS and LS conditions in the rightward displacement (BS vs. NS: p = 0.0684, RS vs. NS: p = 0.0529, LS vs. NS: p = 0.0982) (Figures 8A,C,D).
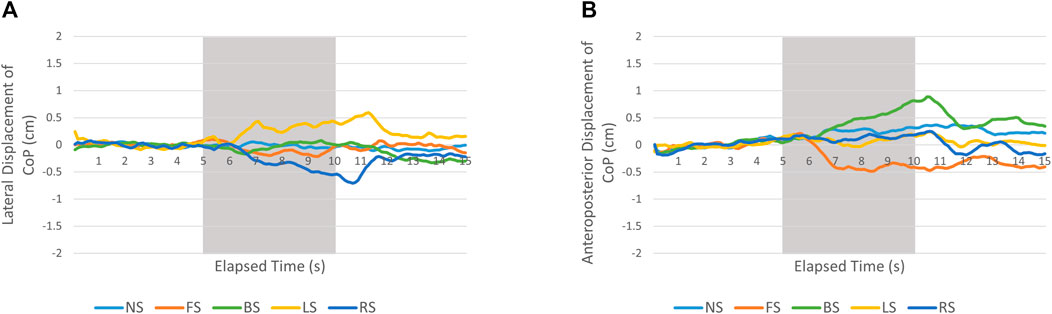
FIGURE 7. Change in the CoP in the lateral direction (A) and anteroposterior direction (B) over time. The grey area indicates the interval in which electrical stimulation is applied. A positive lateral (anteroposterior) displacement indicates rightward (forward) motion. (NS: No stimulation, FS: front side, BS: back side, LS: left side, or RS: right side).
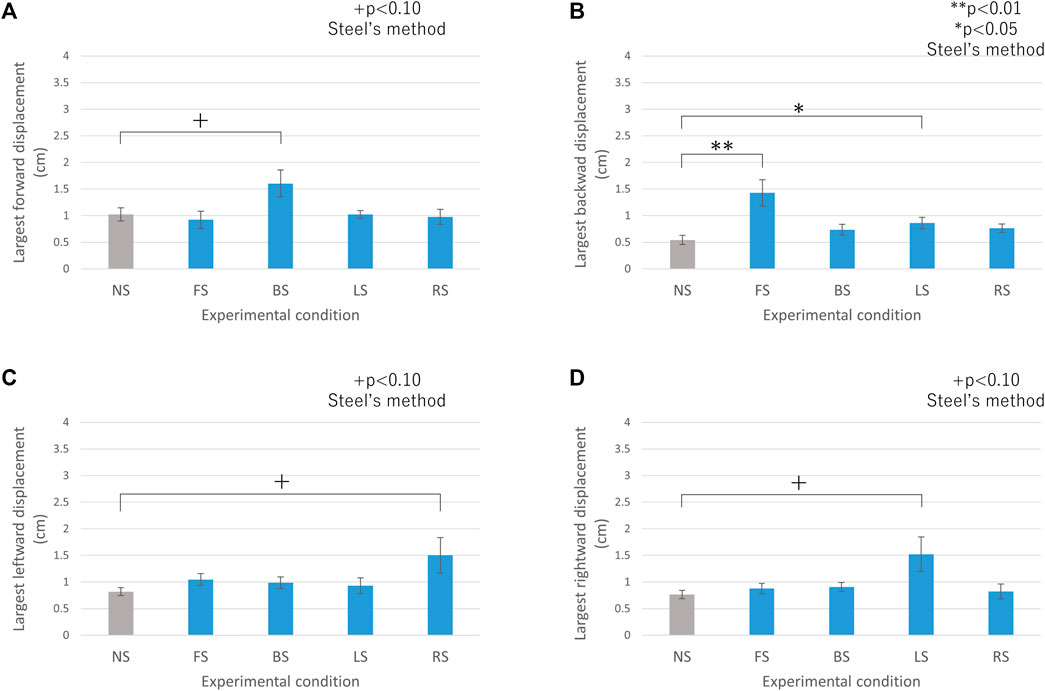
FIGURE 8. Largest displacement of CoP from the initial position: (A) Forward displacement, (B) Backward displacement, (C) Leftward displacement, (D) Rightward displacement. (NS: No stimulation, FS: front side, BS: back side, LS: left side, or RS: right side).
In addition, the latencies of the stimulus onset and offset were calculated (Table 4). The former was defined as the earliest time during the stimulation when, afterwards, the displacement of the CoP exceeded the mean ± SD of the CoP in the NS condition for a duration of 1.3 s. The latter was defined as the earliest time after the stimulation when the displacement of the CoP became smaller than the mean ± SD of the CoP in the NS condition. The threshold of 1.3 s is half of the general period of body sway, which was calculated from the primary frequency peak of body sway reported in a previous study (Soames and Atha, 1982).
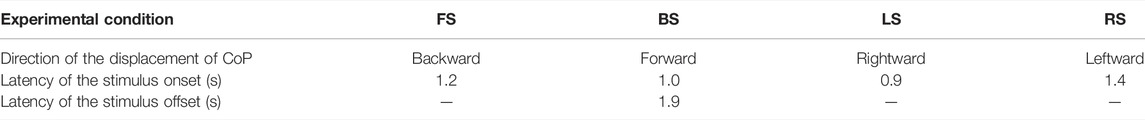
TABLE 4. Latency of the stimulus onset and offset of the displacement of CoP. “-” means that the latency is more than 5s.
Head Position
The change in head position was averaged among the participants over time (Figure 9). In addition, the largest displacement of the head from its initial position during stimulation presentation in the four directions (forward, backward, leftward, and rightward) was averaged among the participants (Figure 10). These figures show that the LS and RS conditions evoked the largest rightward and leftward head position changes, respectively. The results of the Shapiro-Wilk normality test showed that the data of the largest forward displacement in the NS, FS, LS, and RS conditions, the largest backward displacement in the FS and LS conditions, the largest leftward displacement in the RS condition and the largest rightward displacement in the NS, LS, and RS conditions do not follow a normal distribution (p < 0.05). Therefore, statistical analysis was performed using Steel’s method for a nonparametric multiple comparison with a control of the NS condition. The result showed that only the largest rightward displacement of the head from its initial position had a marginally significant difference between the NS and LS conditions (p = 0.0774) (Figure 10D).

FIGURE 9. Change in the head position in the lateral direction (A) and anteroposterior direction (B) over time. The grey area indicates the interval in which electrical stimulation is applied. (NS: No stimulation, FS: front side, BS: back side, LS: left side, or RS: right side).
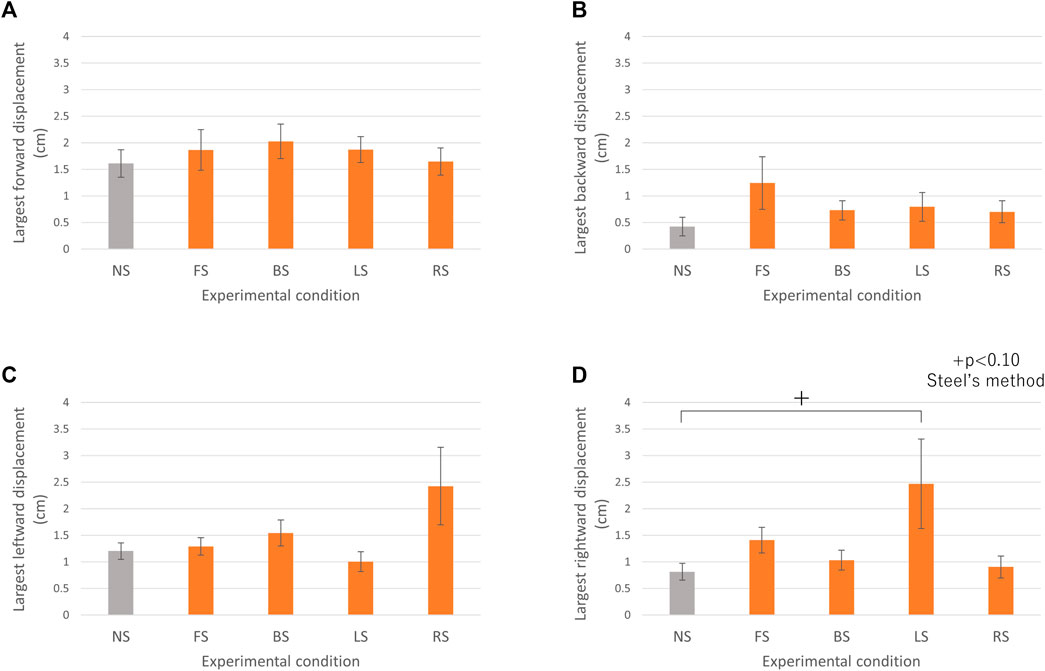
FIGURE 10. Largest displacement of head position from the initial position: (A) Forward displacement, (B) Backward displacement, (C) Leftward displacement, (D) Rightward displacement (NS: No stimulation, FS: front side, BS: back side, LS: left side, or RS: right side).
Discussion
The purpose of the experiment was to investigate the effect of a novel ankle TES configuration on the subjective sensation of body tilt and objective body sway. Before the experiment, we hypothesised that ankle TES induces a subjective sensation of body tilt and an objective body sway in a direction opposite to the stimulated part. In the experiment, the participants reported that they felt a sensation of body tilt when the ankle TES was applied to the four targeted tendons (TA, AC, PL, and FDL). In addition, we observed an exclusive body sway in the backward, forward, leftward, and rightward directions when applying ankle TES to the targeted tendons. These results clearly confirm our hypothesis. In the following section, we will have a detailed discussion on the interpretation of these results.
Subjective Sensation of Ankle Joint Angle Induced by Ankle TES
The results of the questionnaire indicate that the LS condition induced a subjective sensation of rightward body tilt, while the RS condition induced a subjective sensation of leftward body tilt (Figure 6A). Moreover, the FS condition induced a subjective sensation of backward body tilt, while the BS condition induced a subjective sensation of forward body tilt (Figure 6B). Overall, these results indicate that ankle TES can induce a subjective sensation of body tilt in a direction opposite to the stimulated part, and H1 is proven to be appropriate.
For the induced sensation of body tilt, we have considered two possible mechanisms. The first possible mechanism is related to the prediction of movement based on the force sensation. Our previous research revealed that ankle TES can induce force sensation at the ankle in a direction opposite to the stimulated part (Takahashi et al., 2021). If the actual force is applied on the ankle, the body will tilt in the same direction as the applied force. It is possible that participants predicted their body movement based on the sensation of force induced by ankle TES, inducing the subjective sensation of body tilt. The second possible mechanism is that the body sway was actually induced by the ankle TES, and participants simply answered based on this sway.
Relationship Between Simulation Results and Sensation of Body Tilt
We selected four muscle tendons, TA, AC, FDL, and PL, which were anatomically responsible for dorsiflexion, plantarflexion, foot inversion, and eversion, respectively, as the stimulation targets by ankle TES, and placed the electrodes on the targeted tendons. Our simulation results, using the finite element method (Simulation Result), confirmed that each electrode configuration stimulated the target tendon under the electrodes most strongly among the four targeted tendons. However, it also observed that the current density distributions of the other targeted tendons could be affected; e.g., for the case of current application on the FDL, Table 2 shows that the maximum current density on the TA is approximately 28% of that on the FDL.
However, as discussed in Subjective Sensation of Ankle Joint Angle Induced by Ankle TES, four experimental conditions with stimulation (FS, BS, LS, and RS) induced a subjective sensation of body tilt only in each of the four directions that were significantly stronger in the experiment as shown in Figure 6. This result indicates that a sensation of body tilt was dominated by the targeted tendon under the electrodes which were thought to be most strongly stimulated even when some tendons were stimulated together. We assume that the effect of the amplitude of the current wave, which was determined to be the maximum within the uncomfortable sensation threshold of the participant, on the targeted tendons other than that under the electrodes would not be strong enough to induce a sensation of body tilt in four cardinal directions. In addition, even when a combination of stimulation on the FDL of one foot and the PL of the other for the lateral directions was used, it seems that the participants could categorise the direction of the sensation of body tilt (i.e., leftward or rightward tilt). Therefore, our proposed electrode configuration could selectively induce a sensation of body tilt in one of four directions.
Body Sway Induced by Ankle TES
The results of the multiple comparison tests showed that the largest displacement of the CoP tends to increase toward the backward, forward, rightward, and leftward directions under the FS, BS, LS, and RS conditions, respectively. In addition, Figure 8 shows that the largest backward displacement of the CoP under the LS condition is significantly larger than that under the NS condition. Table 2 shows that the maximum current density on TA, which is revealed to increase the backward displacement of the CoP, is the second largest when the current is applied on FDL. Hence, we assume that this is a result of the subtle stimulation of TA on the right foot under the LS condition. Furthermore, we assume that the reason why only the LS condition, and not the RS condition, increases backward displacement is the difference of dominant foot among participants. Based on previous research, suggesting that a non-dominant foot has a more essential role in balance control than a dominant foot (Shigaki et al., 2013), stimulation to the non-dominant foot is expected to have a greater effect on the displacement of the CoP compared with the dominant foot. To investigate the influence of the dominant foot, we additionally asked participants which foot they perceived to be their dominant foot and divided them into two groups according to their dominant foot. The average of the maximum displacement of the CoP in all experimental conditions and directions in the left-footed group (five participants, 1.12 cm) is larger than that in the right-footed group (seven participants, 0.92 cm); this difference might make the effect of the LS condition more dominant.
In the case of head position, Figure 10 shows that the largest displacement of head position in a specific direction is greatest when the stimulation is applied to the opposite side of the ankle, which is the same trend as the CoP. However, the result of multiple comparison tests did not show a clear effect of ankle TES on the largest displacement of head position. We assume that the larger variance of head position compared with CoP is a leading cause of this result. Table 5 shows that the average standard error of the largest displacement of head position in each direction is nearly or more than two times larger than that of the CoP. If the soles of the feet are regarded as the centre of body sway when standing, the head position is influenced by the angle change of every joint in the lower limbs, which is assumed to increase the variance in the head position.
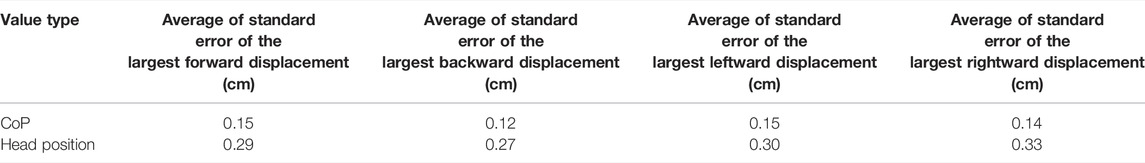
TABLE 5. Average of standard error of the largest displacement of CoP and head position in each direction.
Overall, although the effect of ankle TES on head position is unclear, the result of the CoP indicates that ankle TES induces body sway in the direction opposite to the stimulated part and it is rational to consider that H2 is appropriate.
Moreover, the results include temporal characteristics of the effect of ankle TES on body sway. Table 4 shows that the displacement of the CoP begins to increase in a direction opposite to the stimulated part about 1 s after starting the stimulation, and tends to maintain this displacement after the stopping of the stimulation. From these results, we can assume that the body sway caused by ankle TES has latencies of the stimulus onset and offset on the order of seconds. This is potentially due to the inertia of the human body. According to Newton’s laws of motion, it takes a certain amount of time to cause body sway from a static upright position by the torque generated in the ankle joint. In addition, the motor response to the ankle TES does not appear to differ greatly across stimulation directions.
Illusory Sensation of Ankle Joint Angle Induced by Ankle TES
While the body sway is considered to be caused by the stimulation of GTO, as described in Hypothesis, we noted two possible mechanisms of the subjective sensation of body tilt: the result of the movement prediction based on the force sensation or the result of initially induced body sway. It is impossible to determine which mechanism is correct from the results of this experiment. In either case, however, the result of body sway indicates that the targeted tendons are stimulated by ankle TES and the illusory sensation of the ankle joint angle is induced.
Limitations and Future Work
Multiple Stimulations of Different Tendons
Our experiment showed that ankle TES can induce a subjective sensation of body tilt in the direction opposite to the stimulated part. In this experiment, however, only one tendon in each leg was stimulated at a time. In addition, the direction of the sensation was limited to the four cardinal directions: leftward, rightward, forward, and backward. By stimulating multiple tendons in each leg simultaneously, we expect that the effects of ankle TES could be combined, and a sensation of body tilt in various directions can be induced.
Effect of Ankle TES on Perception of Ground Tilt
As mentioned above, the expected use of our proposed method is to change the perception of ground tilt by applying ankle TES. However, participants were asked about their subjective sensation of body tilt in the experiment, rather than their perception of ground tilt. Since this is a basic study to demonstrate the effectiveness of our novel ankle TES configuration on the sensation of the ankle joint angle, we wanted to clearly investigate the effect on the perception of ankle joint angle. We assumed that the perception of ground tilt was affected by the preconception that the angle of the ground does not change, since the experiment was conducted on a static floor, without any visual information. Therefore, we selected the subjective sensation of body tilt as a reliable parameter to evaluate the sensation of the ankle joint angle.
The experimental results showed that ankle TES induces a subjective sensation of body tilt, indicating that the illusory sensation of the ankle joint angle, which is essential for changing the perception of ground tilt, can be induced. Therefore, in the next experiment, we will apply the same stimulation on a floor that can change the angle of tilt and investigate whether the illusory sensation of the ankle joint angle can change the perception of ground tilt.
Temporal Characteristics of the Sensation Induced by Ankle TES
To make the effect of ankle TES consistent with visual information provided by an HMD, it is desirable that the sensation of the ankle joint angle be induced after applying ankle TES with minimum time delay and disappear immediately after stopping the stimulation. As discussed in Relationship Between Simulation Results and Sensation of Body Tilt, the body tilt caused by ankle TES appears to have a few seconds of onset and offset latencies. However, we did not investigate a temporal change in the subjective sensation of body tilt. Therefore, further research is required to make sure that the sensation is induced without inconsistency with visual stimuli.
Relationship Between Stimulus Intensity and Effect of Ankle TES
In the experiment, the amplitude of the current wave was adjusted at first and was not changed during the experiment. When presenting the sensation of ankle joint angle that is, consistent with a virtual environment, however, the extent of the effect of ankle TES should be controlled. Takahashi et al. (2016) showed that the amount of force sensation induced by electrically stimulating a wrist tendon can be controlled by the pulse height of the current. This result suggests that the extent of the effect of ankle TES can also be controlled by stimulus intensity. In order to make our proposed method more suitable for VR experiences, the relationship between stimulus intensity and the extent of the effect of ankle TES on the illusory sensation of ankle joint angle has to be investigated.
Application of Ankle TES to VR Experiences
During the application of ankle TES, some participants reported the sensation of their foot soles vibrating, which could be caused by stimulating nerves that dominate the haptic sensation. When we apply our proposed method to VR experiments, this sensation could make users uncomfortable and disturb their immersive experiences. Since we did not conduct a subjective evaluation of feelings of discomfort during the stimulation, it should be investigated in the future. Additionally, the safety of ankle TES is essential. As the result of our experiment shows, ankle TES causes actual body movements. These movements might reduce the stability of a user’s body and increase the risk of falling over. To confirm the safety of ankle TES, the stability of body during the stimulation should also be investigated by conducting balance assessments such as Berg Balance Scale (BBS) or the Single-Leg Stance (SLS) (Flansbjer et al., 2012).
Conclusion
In this study, we developed a novel method that possibly induces a sensation of standing on a slope by applying ankle TES, and investigated the effect of ankle TES on the subjective sensation of body tilt and actual postural change. The experimental results revealed that ankle TES induces both a sensation of body tilt and actual body tilt in a direction opposite to the stimulated part, in the lateral and anteroposterior directions. In the future, we will investigate the effect of ankle TES on the perception of ground tilt instead of body tilt and implement a method that can induce a sensation of standing on a slope. By utilising our method in virtual environments that have rugged terrain, such as mountains or hills, and controlling the extent and direction of the illusory sensation of ground tilt according to the position of a user in a virtual environment, a much more immersive VR experience can be realised.
Data Availability Statement
The raw data supporting the conclusion of this article will be made available by the authors, without undue reservation.
Ethics Statement
The studies involving human participants were reviewed and approved by the ethics research committee of the Graduate School of Information Science and Technology, The University of Tokyo. The patients/participants provided their written informed consent to participate in this study.
Author Contributions
NT, KA and TA proposed the method, and TA and TN designed the experiment. NT conducted the experiments and collected the data. KA, MH and HK conducted the simulations. NT, KA and TN analysed the data. NT, KA and TA wrote the manuscript. All the authors discussed the results and commented on the manuscript.
Funding
This study was supported by the JST, PRESTO (JPMJPR19J1), and JSPS KAKENHI (JP21H04883).
Conflict of Interest
The authors declare that the research was conducted in the absence of any commercial or financial relationships that could be construed as a potential conflict of interest.
Publisher’s Note
All claims expressed in this article are solely those of the authors and do not necessarily represent those of their affiliated organizations, or those of the publisher, the editors and the reviewers. Any product that may be evaluated in this article, or claim that may be made by its manufacturer, is not guaranteed or endorsed by the publisher.
References
Aoyama, K., Higuchi, D., Sakurai, K., Maeda, T., and Ando, H. (2017). “GVS RIDE: Providing a Novel Experience Using a Head Mounted Display and Four-Pole Galvanic Vestibular Stimulation,” in ACM SIGGRAPH 2017 Emerging Technologies, Los Angeles, CA, July 30–August 3, 2017, 1–2.
Boletsis, C. (2017). The New era of Virtual Reality Locomotion: A Systematic Literature Review of Techniques and a Proposed Typology. Multimodal Tech. Interaction 1 (4), 24. doi:10.3390/mti1040024
Bruder, G., and Steinicke, F. (2014). “Threefolded Motion Perception during Immersive Walkthroughs,” in Proceedings of the 20th ACM Symposium on Virtual Reality Software and Technology, Edinburgh, Scotland, November 11–13, 2014, 177–185.
Flansbjer, U.-B., Blom, J., and Brogårdh, C. (2012). The Reproducibility of Berg Balance Scale and the Single-Leg Stance in Chronic Stroke and the Relationship between the Two Tests. PM&R 4 (3), 165–170. doi:10.1016/j.pmrj.2011.11.004
Goodwin, G. M., McCloskey, D. I., and Matthews, P. B. C. (1972). Proprioceptive Illusions Induced by Muscle Vibration: Contribution by Muscle Spindles to Perception? Science 175 (4028), 1382–1384. doi:10.1126/science.175.4028.1382
Hagimori, D., Yoshimoto, S., Sakata, N., and Kiyokawa, K. (2019). “Tendon Vibration Increases Vision-Induced Kinesthetic Illusions in a Virtual Environment,” in 2019 IEEE Conference on Virtual Reality and 3D User Interfaces (VR), Osaka, Japan, March 23–27, 2019 (IEEE), 952–953.
Hothorn, L. A. (2016). The Two-Step Approach-A Significant ANOVA F-Test before Dunnett's Comparisons against a Control-Is Not Recommended. Commun. Stat. - Theor. Methods 45 (11), 3332–3343. doi:10.1080/03610926.2014.902225
Je, S., Lim, H., Moon, K., Teng, S. Y., Brooks, J., Lopes, P., et al. (2021). “Elevate: A Walkable Pin-Array for Large Shape-Changing Terrains,” in Proceedings of the 2021 CHI Conference on Human Factors in Computing Systems, Yokohama, Japan, May 8–13, 2021, 1–11.
Kajimoto, H. (2013). “Illusion of Motion Induced by Tendon Electrical Stimulation,” in 2013 World Haptics Conference (WHC), Daejeon, Republic of Korea, April 14–17, 2013 (IEEE), 555–558.
Laakso, I., and Hirata, A. (2013). Computational Analysis Shows Why Transcranial Alternating Current Stimulation Induces Retinal Phosphenes. J. Neural Eng. 10 (4), 046009. doi:10.1088/1741-2560/10/4/046009
Moore, J. C. (1984). The Golgi Tendon Organ: A Review and Update. Am. J. Occup. Ther. 38 (4), 227–236. doi:10.5014/ajot.38.4.227
Rogers, J. H. (1980). Romberg and His Test. J. Laryngol. Otol. 94 (12), 1401–1404. doi:10.1017/s002221510009023x
Saltzman, C. (1997). Orthopaedic Foot and Ankle Society Ad Hoc Committee Report, January 1996. Foot Ankle Int. 18, 310–311.
Sasagawa, S., Ushiyama, J., Masani, K., Kouzaki, M., and Kanehisa, H. (2009). Balance Control under Different Passive Contributions of the Ankle Extensors: Quiet Standing on Inclined Surfaces. Exp. Brain Res. 196 (4), 537–544. doi:10.1007/s00221-009-1876-4
Schmidt, D., Kovacs, R., Mehta, V., Umapathi, U., Köhler, S., Cheng, L. P., et al. (2015). “Level-ups: Motorized Stilts that Simulate Stair Steps in Virtual Reality,” in Proceedings of the 33rd Annual ACM Conference on Human Factors in Computing Systems, Seoul, Republic of Korea, April 18–23, 2015, 2157–2160.
Seki, H., Yona, M., Naito, Y., and Muro, M. (2011). Effects of Vibration Applied on Forearm and Upper Limb Muscles on Human Voluntary Multi-Wrist and Elbow Movements. Jpn. J. Phys. Fit. Sports Med. 60 (2), 229–237. doi:10.7600/jspfsm.60.229
Shigaki, L., Rabello, L. M., Camargo, M. Z., Santos, V. B. D. C., Gil, A. W. D. O., Oliveira, M. R. D., et al. (2013). Comparative Analysis of One-Foot Balance in Rhythmic Gymnastics Athletes. Rev. Bras Med. Esporte 19, 104–107. doi:10.1590/s1517-86922013000200006
Soames, R. W., and Atha, J. (1982). The Spectral Characteristics of Postural Sway Behaviour. Europ. J. Appl. Physiol. 49 (2), 169–177. doi:10.1007/bf02334065
Steel, R. G. D. (1959). A Multiple Comparison Rank Sum Test: Treatments Versus Control. Biometrics 15 (4), 560–572. doi:10.2307/2527654
Takahashi, A., Tanabe, K., and Kajimoto, H. (2016). “Relationship between Force Sensation and Stimulation Parameters in Tendon Electrical Stimulation,” in International AsiaHaptics Conference, Chiba, Japan, November 29–December 1, 2016 (Singapore: Springer), 233–238.
Takahashi, N., Amemiya, T., Narumi, T., Kuzuoka, H., Hirose, M., and Aoyama, K. (2021). “Perception of Illusory Body Tilt Induced by Electrical Tendon Stimulation,” in International Conference on Human-Computer Interaction, July 24–29, 2021 (Cham: Springer). [Online], 357–368. doi:10.1007/978-3-030-78321-1_27
Tamaki, E., Chan, T., and Iwasaki, K. (2016). “UnlimitedHand: Input and Output Hand Gestures with Less Calibration Time,” in Proceedings of the 29th Annual Symposium on User Interface Software and Technology, 163–165.
Tanaka, S., Ushiyama, K., Takahashi, A., and Kajimoto, H. (2020). “Movement-Free Virtual Reality Interface Using Kinesthetic Illusion Induced by Tendon Vibration,” in International Conference on Human Haptic Sensing and Touch Enabled Computer Applications, Leiden, Netherlands, September 6–9, 2020 (Cham: Springer), 316–324. doi:10.1007/978-3-030-58147-3_35
Keywords: new haptic and tactile interaction, tendon electrical stimulation, proprioceptive sensation, golgi tendon organ, illusory movement
Citation: Takahashi N, Amemiya T, Narumi T, Kuzuoka H, Hirose M and Aoyama K (2022) Sensation of Anteroposterior and Lateral Body Tilt Induced by Electrical Stimulation of Ankle Tendons. Front. Virtual Real. 3:800884. doi: 10.3389/frvir.2022.800884
Received: 24 October 2021; Accepted: 10 March 2022;
Published: 05 April 2022.
Edited by:
Thierry Duval, IMT Atlantique Bretagne-Pays de la Loire, FranceReviewed by:
Vincent Levesque, École de Technologie Supérieure (ÉTS), CanadaHojin Lee, Electronics and Telecommunications Research Institute (ETRI), South Korea
Copyright © 2022 Takahashi, Amemiya, Narumi, Kuzuoka, Hirose and Aoyama. This is an open-access article distributed under the terms of the Creative Commons Attribution License (CC BY). The use, distribution or reproduction in other forums is permitted, provided the original author(s) and the copyright owner(s) are credited and that the original publication in this journal is cited, in accordance with accepted academic practice. No use, distribution or reproduction is permitted which does not comply with these terms.
*Correspondence: Nozomi Takahashi, bm96b21pQGN5YmVyLnQudS10b2t5by5hYy5qcA==; Kazuma Aoyama, YW95YW1hQHZyLnUtdG9reW8uYWMuanA=