 Ian Lochhead
 Nick Hedley
 Arzu Çöltekin
 Brian Fisher
- 1Spatial Interface Research Lab, Department of Geography, Simon Fraser University, Burnaby, BC, Canada
- 2University of Applied Sciences and Arts Northwestern Switzerland FHNW, Institute of Interactive Technologies (IIT), Brugg-Windisch, Switzerland
- 3Integrated Science Lab, Simon Fraser University, School of Interactive Arts and Technology, Surrey, BC, Canada
Advancements in extended reality (XR) have inspired new uses and users of advanced visualization interfaces, transforming geospatial data visualization and consumption by enabling interactive 3D geospatial data experiences in 3D. Conventional metrics (e.g., mental rotations test (MRT)) are often used to assess and predict the appropriateness of these visualizations without accounting for the effect the interface has on those metrics. We developed the Immersive MRT (IMRT) to evaluate the impact that virtual reality (VR) based visualizations and 3D virtual environments have on mental rotation performance. Consistent with previous work, the results of our pilot study suggest that mental rotation tasks are performed more accurately and rapidly with stereo 3D stimuli than with 2D images of those stimuli.
1 Introduction
Recent advances in extended reality (XR) technology have sparked renewed interest in, and new opportunities for, visualizing three-dimensional (3D) spatial data with virtual reality (VR), mixed reality (MR), and augmented reality (AR) interfaces. Concurrently, access to and the production of 3D spatial data has undergone a significant transformation, empowering those with common consumer electronics (e.g., smartphones and computers) with an ability to generate what once required significant capital expenditures and highly specialized equipment. In the realm of geographic visualization (or geovisualization) these advancements have led to new forms of data exploration and interaction, allowing users to immerse themselves within spatial data for the purposes of visualization, analysis, collaboration, and communication (e.g., Devaux et al., 2018; Lochhead and Hedley, 2018; Hruby et al., 2019; Zhao et al., 2019; Filho et al., 2020; Pulver et al., 2020; Çöltekin et al., 2020; Rydvanskiy and Hedley, 2021).
Geovisualizations such as these will become more numerous as the popularity of XR technology and 3D geospatial content creation continues to evolve. As new technologies and methods emerge, new geovisual analytical capabilities and experiences also emerge, raising questions regarding accuracy, utility, and the optimal interface, data, application, user, and venue combination(s). While there is no guarantee that any given combination is ideal, future advancements in artificial intelligence and information science may deliver software-based solutions that optimize these combinations for geospatial knowledge transfer (Çöltekin et al., 2017). However, the success of such solutions ultimately hinges on our ability, as a research community, to answer some of the persistent challenges that have plagued geovisualization (see MacEachren and Kraak, 1997; Slocum et al., 2001; Laramee and Kosara, 2006; Çöltekin et al., 2017), including: a need to better understand geovisualization’s place in the broader research community, an actionable set of guidelines that match geovisualization type with use and user, and a greater understanding of the human factors which dictate cognitive processes and geospatial knowledge transfer.
In this paper we address spatial ability—one of the many human factors challenges faced by the geovisualization community—and the role it plays in an era of 3D data and XR technology. While spatial ability has long been recognized as an important component of geovisualization use, impacting the degree to which one is able to generate knowledge from different types of geovisualizations, there has yet to be a consensus as to whether those with low or high spatial ability are better positioned to benefit from (3D) geovisualizations (Çöltekin et al., 2016). On one hand, it is argued that low spatial ability learners benefit more from graphical presentations—the ability-as-compensator hypothesis (Hegarty and Sims, 1994; Hays, 1996; Huk, 2006)—and on the other, that high spatial learners stand to benefit more—the ability-as-enhancer hypothesis (Mayer and Sims, 1994; Huk, 2006). Part of the challenge in determining which hypothesis holds true is that spatial ability itself is a general construct encapsulating a variety of skills and processes (Hinze et al., 2014) that themselves are malleable (i.e., our spatial abilities can change over time) (Uttal et al., 2013; Newcombe, 2014).
Built on one of the most popular measures of spatial ability called the Mental Rotations Test (MRT) (Shepard and Metzler, 1971; Vandenberg and Kuse, 1978), here we introduce the Immersive Mental Rotations Test (IMRT), a modified version of the MRT adapted to explore the effect that immersive technologies (i.e., VR) have on our ability to mentally rotate assemblages of cubes presented as 2D images and as 3D objects (Figure 1). While the works of Shepard and Metzler (1971), Vandenberg and Kuse (1978), and Peters et al. (1995) have been fundamental in spatial ability (specifically, mental rotations) studies, arguably, the ability to mentally rotate 2D images of hypothetical 3D objects to quantify spatial abilities seems to be a poor fit for modern immersive display technologies—which do not require the same cognitive operations as 2D representations. Given the lack of spatial ability tests that are specifically developed for XR displays, here we explore an adaptation of the MRT that we hope will help translate the bedrock methods of existing MRT work into the contexts of contemporary and emerging 3D interfaces. Furthermore, we explore whether solving the MRT tasks in stereo 3D vs 2D will lead to new knowledge in this domain by answering the question of how important is the ‘imagining 3D shapes from 2D projections’ vs actual mental rotations in the MRT.
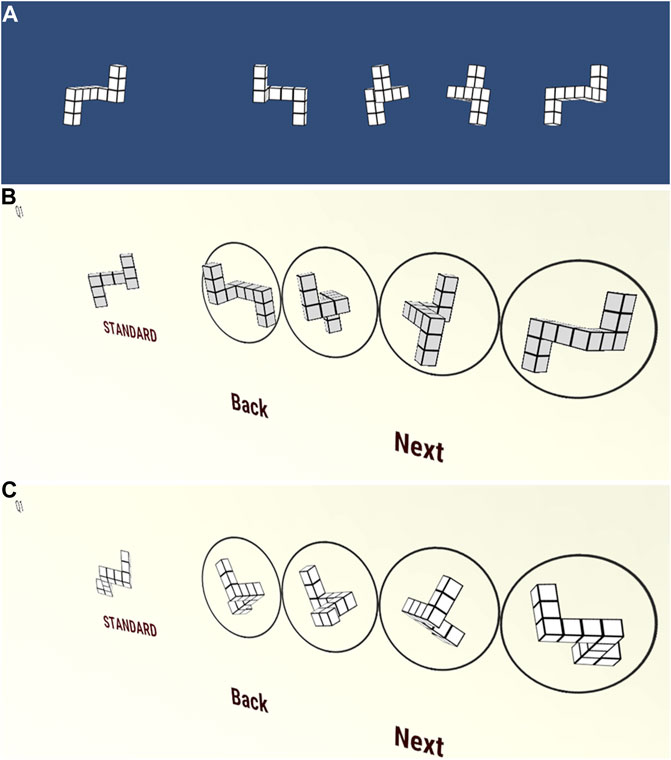
FIGURE 1. (A) A screenshot from the IMRT question development in Unity. Each question contains a standard stimulus (left) and four reference stimuli (right). These stimuli became the 3D stimuli in Room A (B) and the 2D stimuli in Room B (C). Perspective view provided here to highlight the difference between the 3D and 2D stimuli (i.e., this is not how the stimuli were shown to participants, they always had the same perspective).
While some may argue that this 3D adaptation of the MRT subverts the objective of the long established MRT—and we do not object to this discussion—that is precisely the point of this test. The classic MRT implicitly measures two things: 1) can people imagine the 3D shapes from 2D drawings, and 2) can people mentally rotate these imagined objects and tell the difference among apparently similar options. We tease apart the two here. From an applied perspective, especially in the domain of geovisualization, classical MRT has many conceptual links to map reading (from printed or digital 2D maps). However, modern data formats and display technologies have changed the way that we represent, visualize, and experience geospatial phenomena. Thus, our objectives with this initial IMRT study are to examine whether MRT performance (score and time) is impacted by 1) the spatial dimensionality of the MRT stimuli (2D vs stereo 3D) in an immersive virtual environment (VE), and 2) the background complexity of the VE (simple vs complex). Furthermore, we conduct additional exploratory analyses to examine the relationship between MRT/IMRT performance and participant movement and the angular difference between stimuli (difficulty).
2 Background
Spatial ability is an important component of our general intelligence, relied upon for everyday spatial reasoning, and is strongly correlated with success across several STEM (science, technology, engineering, and math) majors and professions (Johnson and Bouchard, 2005; Casey, 2013). STEM disciplines commonly use visualizations to communicate the complex concepts and relationships behind imperceptible or abstract phenomena and accurate interpretations of these visualizations are therefore critical (Hinze et al., 2014). However, despite our reliance on visualizations, questions concerning for whom and when visualizations prove most effective remain unanswered (Hinze et al., 2014) due to the complex relationship between spatial ability and learning from visualizations.
While evidence supports both the ability-as-compensator hypothesis and the ability-as-enhancer hypothesis, these two hypotheses contradict each other. Hinze et al. (2014) posit that learning from visualizations is a function of visualization design, task demands, prior knowledge, and processing strategy—not simply the learner’s spatial ability, which includes a variety of separable spatial skills that are each indicative of a unique cognitive process best suited for specific spatial tasks (Casey, 2013; Newcombe, 2014). Therefore, for any given visualization, learners with a deficiency in one spatial skill may not realize a negative learning outcome, as non-spatial skills may be relied upon to overcome those limitations. Nevertheless, formal taxonomies of spatial skills have been developed to help connect the task demands of the visualization with the spatial skills of the learner (Hinze et al., 2014).
Research on individual and group differences in spatial abilities commonly addresses the object-based spatial skills (Casey, 2013). Linn and Petersen (1985) categorized these skills as spatial perception, spatial visualization, and mental rotation. Spatial perception tasks involve determining spatial relationships relative to one’s own body (e.g., Rod-and-Frame test or Water Levels test), spatial visualization tasks require complex, multistage manipulation of spatial information (e.g., Embedded Figures or mazes), and mental rotation tasks involve the ability to observe an object, or picture of an object, and imagine how it may appear when rotated in 3D space (e.g., Mental Rotation Test or Card Rotation Test) (Linn and Petersen, 1985; Casey, 2013; Uttal et al., 2013). Of all the object-based tests, mental rotations tests, and in particular the Vandenberg and Kuse (1978), are the most common—in part because of the strong performance difference between sexes that are absent with other tests (Casey, 2013).
2.1 The MRT
The Vandenberg and Kuse (1978) MRT is a paper-and-pencil test based on the computer generated 2D images of 3D objects developed by Shepard and Metzler (1971). Shepard and Metzler (1971) presented 1,600 paired stimuli to eight adult subjects, asking them to determine whether each pair contained the same, albeit rotated, stimuli. The Vandenberg and Kuse (1978) is a 20-question test, wherein each question contains one standard stimulus and four rotated alternatives (two of which are the same as the standard and two which are not), in which respondents must select the two stimuli that are rotated versions of the standard (Figure 1). As the physical quality of the Vandenberg MRT deteriorated over time, Peters et al. (1995) developed a 24-question, redrawn version of the MRT.
Shepard and Metzler (1971) found a near perfect correlation between the angular disparity of pairs of stimuli and the amount of time required for respondents to identify matching pairs, and Vandenberg and Kuse (1978) as well as Peters et al. (1995) observed clear and replicable performance differences between sexes, where males outperform females. This performance difference has made the MRT one of the more popular tests of spatial skill and it has been argued that these types of image rotation tasks are a critical component of our general intelligence and STEM achievements (Johnson and Bouchard, 2005; Wai et al., 2009; Casey, 2013).
2.2 Applied Use of the MRT
The connection between spatial ability and visualization comprehension is apparent, yet the exact nature of that connection remains unclear (i.e., whether different types of visualization better assist those with low or high spatial ability remains unestablished). Spatial ability tests, such as the MRT, are commonly incorporated in visualization research as researchers attempt to connect spatial ability with performance metrics relevant to their visualization and its objective. Examples include: the relationship between spatial abilities (including MRT performance), mental model formation, and a sense of presence in an immersive VE (IVE) (Coxon et al., 2016), the importance of spatial ability (measured through MRT performance) for spatial knowledge acquisition through AR interface use (Hedley, 2003), the role that mental rotation skills play in real-world wayfinding (Malinowski, 2001) and map-based route learning (Çöltekin et al., 2018), the importance of spatial ability (mental rotation) and visuospatial memory in virtual navigation (Lokka and Arzu, 2019), and the impact that spatial abilities (including MRT performance) have on map learning (Sanchez and Branaghan, 2009). Outside the realm of geovisualization, the MRT has been applied in a similar fashion to: evaluate the role of spatial thinking in STEM fields (Hegarty et al., 2014), to study the importance of spatial ability in learning from 3D cell biology models (Huk, 2006), and to explore the relationship between biological sex and mental rotation ability (Casey and Brabeck, 1989; Collins and Kimura, 1997; Hoyek et al., 2012; Moè, 2012; Debelak et al., 2014).
2.3 Beyond the MRT
The Vandenberg MRT has inspired further studies, employing the original MRT stimuli and others, that explore the idiosyncrasies of mental rotation performance. Some have altered how the test was administered: Parsons et al. (2004) developed the Virtual Reality Spatial Rotation (VRSR) test for the ImmersaDesk, Monahan et al. (2008) built a computerized, touchscreen version of the MRT, and McWilliams et al. (1997) constructed tangible 3D models of the MRT stimuli out of balsa wood. Others have altered the difficulty of the test: Datta and Roy (2016) used fewer, colored and shaded stimuli, in each question. While others recognized the MRT as a tool to develop spatial skill: Marusan et al. (2006) built a web application for visuospatial rehabilitation following traumatic brain injury, and Alqahtani et al. (2017) used a semi-immersive Virtual Mental Rotation Training (VMRT) system to develop mental rotation skills in engineering students. Additionally, the Dynamic Spatial Test in Augmented Reality (DSTAR)—effectively non-immersive VR (not AR) since the see-through functionality of the HMD was disabled—tested participants’ ability to mentally rotate, remember, and then reconstruct 3D objects in a 4 × 4 grid (Kaufmann et al., 2008).
2.4 The Importance of Mental Rotation Ability
These studies reported mental rotation ability to have varying levels of importance and an in-depth review of the results is beyond the scope of this manuscript. This is not to suggest that the results from each study are not interesting or important (they are), but rather that when these results are considered individually they must be interpreted carefully; the results from one test may argue that spatial abilities are highly important for visualization, while the next may suggest the alternative if the prescribed task does not require the spatial ability being tested. When considered collectively, mental rotation ability (and spatial ability in general) is highly dependent on the idiosyncrasies of the prescribed task, and everyone may draw upon several abilities (spatial and otherwise) to perform that task. In other words: is spatial ability important? Many would argue that it depends.
The ability to mentally transform and manipulate images is an important skill for many disciplines. However, the MRT may not measure one’s ‘mental rotation’ ability as such, but rather a process of figure perception, identification, and comparison—something that is significantly more difficult to accomplish when the objects in the MRT are homogenous rather than heterogenous and the individual segments of those objects cannot be counted to discern their orientation (Caissie et al., 2009). Regardless of which strategy is employed, the ability to perform these “mental rotations” is very important in an academic or professional environment that requires visual analyses and comprehension of 2D images representing 3D phenomena.
Studies employing the MRT have consistently produced results replicating the significant sex effect noted by Vandenberg and Kuse (1978). The performance difference between males and females has been central to much MRT research (e.g., Collins and Kimura, 1997; Moè, 2012; Debelak et al., 2014) and it was found that the average effect size was 0.94 (using Cohen’s d = (M1—M2)/σ)—or that on average males outperform females by almost one standard deviation (Voyer et al., 1995). Contrary to these findings are those of McWilliams et al. (1997), Parsons et al. (2004), and Monahan et al. (2008) who reported no significant gender effect when MRTs were conducted using real 3D models, an ImmersaDesk, or a touchscreen device respectively. These results support the notion that the sex effect is not a function of mental rotation ability per se but of how the stimuli in the MRT are represented.
2.5 Technology, Geovisualization, and Spatial Ability
Representation has played a critical role in discussions outlining the geovisualization research agenda, from the cartographic visualization agenda of MacEachren and Kraak (1997) to the research communities perspective on persistent challenges within the field (Çöltekin et al., 2017) 3 decades later. As the objective of any geovisualization is to “facilitate(s) knowledge construction through visual exploration and analysis of geospatial data” (MacEachren and Kraak, 2001), the way geospatial data are represented plays an influential role in the transfer of knowledge through geovisualization use. Representation is therefore a fundamental issue within the field of geovisualization, as both the data representing the geospatial phenomena and the display technology through which they are presented must be considered concurrently during the geovisualization design process.
As powerful XR display technologies have advanced into the realm of consumer level electronics, discussions about the use of 3D and VR (or XR) are no longer predicated on their potential to change how we consume geospatial data. Digital cartography transformed cartography by changing what is visible, how we think, and how maps work (MacEachren and Kraak, 1997) and now XR technologies are changing how we consume geospatial data, how we think about geospatial data, and how geovisualizations work. While there is tremendous potential for XR technology within geovisualization, change in and of itself is not inherently positive and many questions about the design and use of XR-based geovisualizations must be answered. For example: how do immersion, interactivity, information intensity, and object intelligencer (MacEachren et al., 1999), both individually and collectively, impact knowledge construction? How does this differ for each use, user, and venue? While XR enables immersive experiences in information rich VEs, there is a risk that the complexity and richness of these VEs could overwhelm the working memory capacity of the user, thereby negatively impacting the effectiveness of the geovisualization itself.
XR technologies are redefining what is possible for geovisualization and may also redefine our understanding of effective geovisualization use and the role that human factors, such as spatial ability, serve in defining geovisualization effectiveness. This research presents a pilot study of the IMRT as a contemporary measure of mental rotation ability commensurate with modern spatial data representation. Here we explore the relationship between 3D data, spatial ability (specifically mental rotation ability), and VR—examining the impact that stimuli dimensionality and VE complexity have on metal rotation task performance.
3 Materials and Methods
3.1 Participants
Participants were recruited through followers of the distributed-VR3DUI Slack channel1 to take part in a one-time study of spatial abilities. Participants were advised that the study would be conducted remotely—mediated over Skype (or similar)—and that they must have access to an Oculus Quest. These prerequisites were necessitated by the ongoing COVID-19 pandemic and restrictions surrounding in-person research. Participants were not offered any incentive for their participation. In total, 29 participants (12 female), ranging in age from 22 to 64 years (M = 33 years, SD = 10.13 years), participated in the study.
3.2 Materials
The IMRT is a 54-question (30 stereo 3D questions and 24 2D questions) MRT designed exclusively for VR. The test is conducted within one of two unique VEs, both of which contain questions with the same set of 2D and 3D stimuli. The development of this test is outlined in the following subsections.
3.2.1 3D Stimuli Development
The stimuli utilized in the IMRT are based on the 2D line drawings of 3D cubes used by Peters et al. (1995) in their redrawn version of the Vandenberg and Kuse (1978). We reconstructed the 3D structure of the standard stimuli from the original MRT in Autodesk Maya 2019, and each of the reconstructed stimuli were assigned an X, Y, and Z rotation value (0–359°) defined by a random number generator (Microsoft Excel–RANDBETWEEN). The resultant stimuli were exported as 3D models in the OBJ file format.
The 3D models were then imported into Unity (Version 2019.2.13f1), a popular game engine for 2D and 3D multiplatform game and interactive experience development2, where 30 MRT questions were designed using the developed 3D stimuli. Each question, like the original MRT, consists of a standard stimulus (i.e., criterion figure or target) and four reference stimuli (i.e., alternatives or samples)—two of which match the standard and two which are isomers (mirror-images) of the standard (see Figure 1). However, unlike the original MRT, the reference stimuli in each question are homogenous and not heterogenous (i.e., distractor stimuli were not included); while this deviates from the traditional MRT (Vandenberg and Kuse, 1978; Peters et al., 1995), distractor stimuli were omitted so as to encourage mental rotation rather than the pursuit of distinct features across the stimuli (Shepard and Metzler, 1971).
The rotation of the stimuli around the vertical axis was defined by a random number generator. For each question, the order in which the stimuli were presented, and which two reference stimuli were to be the mirror-images of the standard stimulus, was determined by sorting numbers randomly assigned to each of the stimuli. Additionally, a rotation around the horizontal axis, defined using the random number generator, was applied to six of the 30 3D stimuli. These six (dual rotation) extra stimuli were included in the 3D IMRT (questions 25–30), in accordance with the very difficult MRT(C) administered by Peters et al. (1995), but are not included in the performance analyses presented in this manuscript, as our analyses focus only on the 24 single rotation 2D and 3D questions. Nevertheless, the set of 30 questions were exported as a Unity Package to be imported during VR test development.
3.2.2 2D Stimuli Development
The 2D stimuli are orthographic images (as per Peters and Battista, 2008), generated from within Unity, of the 24 single rotation 3D stimuli in the developed set of 30 MRT questions (i.e., excluding the 6 very difficult stimuli introduced in the previous section). Orthogonal images were captured of the 3D stimuli that were rotated around the vertical axis only, and each image was captured from the perspective of an orthographic camera positioned directly in-front of each stimulus. All images were saved as PNG files to be imported during VR test development.
3.2.3 IMRT Development
The IMRT was developed for the Oculus Quest3, a standalone VR system developed by Facebook that operates on the Android OS, using Unity (Version 2019.2.13f1). Several assets from the Unity Asset Store were installed during development - including the Oculus Integration, Virtual Reality Tool Kit (VRTK) (Version 3.3), and Photon Unity Networking (PUN 2) packages.
A graphical user interface (GUI) was designed to resemble the MRT layout of Peters et al. (1995) and Vandenberg and Kuse (1978) (see Figure 1). The standard stimulus was clearly labeled, to the left of the four reference stimuli, and each reference stimulus was encircled by a black border that functioned to both create separation between the stimuli and served as a button allowing users to submit their answers. Users progress through each of the MRT questions using the Back and Next buttons located below the stimuli, which also serve as the stop and start buttons recording the amount of time users spend on each question. The reference stimuli are enclosed within a circular border, as in Shepard and Metzler (1971) and Vandenberg and Kuse (1978), rather than the square border used by Peters et al. (1995), to avoid hard points of reference from which users could anchor their rotation of each reference stimulus.
As explained above, the 54-question IMRT is comprised of two separate tests; a 30-question test containing the 3D stimuli (we refer to this as Room A in the VR application) and a 24-question test containing 2D images of the 3D stimuli (Room B in the VR application) (Figure 1). While the stimuli in Room B are the same as those contained within the first 24-questions in Room A, following standard experimental procedures, both the order in which the stimuli appear within each question, and the order of the questions themselves, were randomized during development to counter for possible learning and fatigue effects. As such, participants completing all questions in Room A and Room B would effectively answer the same question twice—once in 3D and once in 2D.
Furthermore, because it has been shown that information processing in “clean” vs cluttered (i.e., simple vs complex) environments may lead to differences in participant performance (e.g., Schnürer et al., 2020), and most, if not all MRT studies have been conducted with a ‘clean’ background, we generated two unique VEs for the IMRT (Figure 2) to examine the possible effect of background complexity. The first VE surrounds the user with a perceptually limitless, off-white sphere (simple VE)—developed with the original paper and pencil version of the MRT in mind. The second VE places the user in a furnished, virtual living room (complex VE)—affording visual cues absent from the original MRT and increasing the information intensity of the VE. The scale and design of the virtual living room are a generic representation of a space in which VR may be used, but more importantly, as a space containing objects of varying size, depth, color, light, and shadow that creates visual complexity contrasting the simple VE. The more complex background represents the information intensity of the VE, a defining feature of VEs according to MacEachren et al. (1999). In both VEs, the user remains seated at the centre of the VE, with the GUI appearing directly in front of them at a distance of 1.75 m (Figure 3).
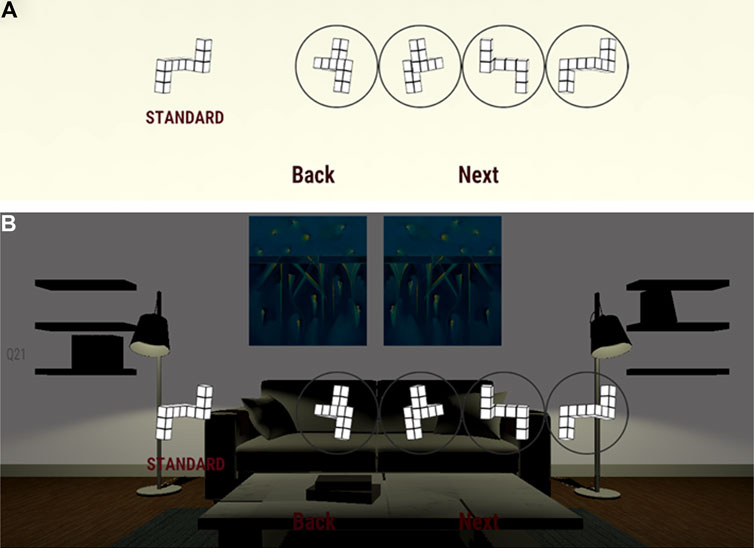
FIGURE 2. Two unique VEs were developed for the IMRT: (A) a simple, off-white space devoid of visual cues (Test 1); (B) a more complex virtual room providing several visual cues (Test 2). Both Test 1 and Test 2 (simple vs complex backgrounds) are conducted in Room A and Room B (2D vs 3D stimuli) shown in Figure 1.
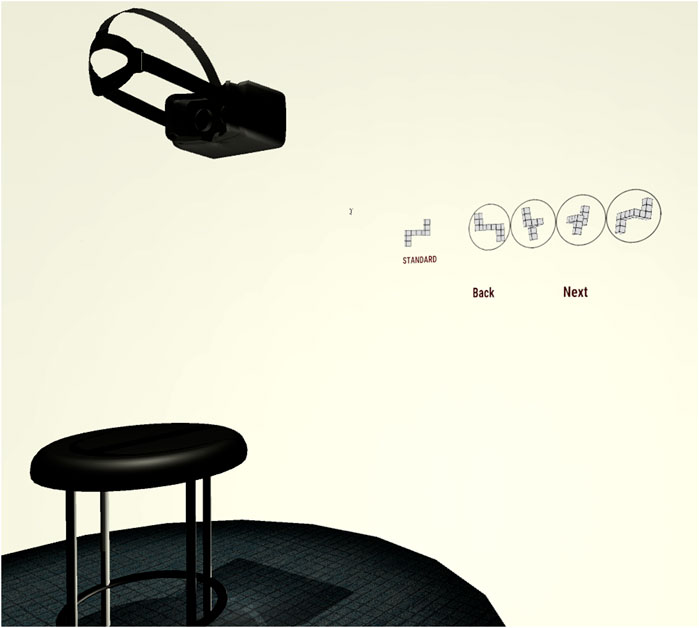
FIGURE 3. A third-person perspective of an IMRT participant (illustrated by the HMD) seated at the centre of the VE with the test stimuli appearing directly in front of them.
Two separate Android Packages (APKs), or Android Apps, were developed for the Oculus Quest using the questions and VEs discussed above. The first, referred to as Test 1, contains 54-questions located within the simple VE; and the second, known as Test 2, consists of the same set of 54-questions, this time situated within the more complex VE (Table 1). These APK files were distributed to each of the study participants as assigned.
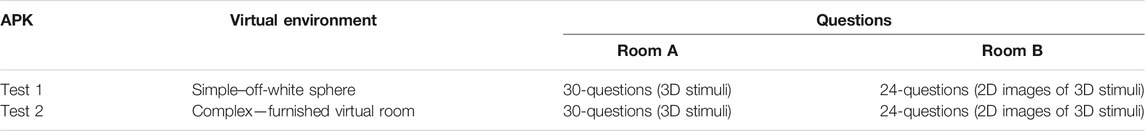
TABLE 1. Summary of IMRT APKs.
3.3 Experimental Design
The IMRT experiment was designed to explore the effect that stimuli dimensionality (2D vs 3D) and VE (background) complexity (simple vs complex) have on IMRT performance (score and time). The dependent variables (score and time) are evaluated in a repeated measures experiment, with participants as a random factor and dimensionality, VE complexity, biological sex, and start room as fixed factors. Further exploratory analyses evaluated the relationship between IMRT performance and participant movement and the angular difference between MRT stimuli (difficulty).
Based on the research cited above, we propose the IMRT as a contemporary test of mental rotation ability. We hypothesize that:
• Participants’ IMRT performance (score and time) will be greater with 3D stimuli than with 2D pictures of those 3D stimuli
• Participants’ IMRT performance (score and time) will be greater when the IMRT is completed in the simple VE than in the complex VE.
The 3D IMRT alleviates the cognitive burden imposed by dimensionality crossing, thereby allowing participants to focus on the mental rotation task rather than on imagining 3D shapes from 2D pictures. While it is possible that the peripheral visual cues of the complex VE could allow participants to anchor their mental rotations, the absence of peripheral visuals in the simple VE reduces the overall mental load placed on participants, thereby allowing them to focus solely on the IMRT stimuli.
This Study Was Approved by the Institutional Research Ethics Board (20200129)
3.4 Procedure
Participants were emailed a link to the appropriate APK file, as well as instructions for installing the APK through SideQuest,4 the day before their study date. While all 29 participants solved all tasks with 2D and 3D conditions in rotated order (Rooms A vs B), they were split into groups for the simple vs complex backgrounds (Test 1 vs Test 2) to keep the experiment duration reasonable (i.e., under 1 hour). Thus, they were randomly assigned to either Test 1 (11 male and 3 female) or Test 2 (6 male and 9 female), within which the order was counterbalanced so that they started with either Room A (Test 1: 7 participants, Test 2: 7 participants) or Room B (Test 1: 7 participants, Test 2: 8 participants).
On the day of the experiment, each participant was contacted via private video conference, consent to participate was confirmed, and they were asked to complete two online surveys: a personality type survey (Locus of Control) and a demographics survey (Pre-Experiment Questionnaire) that included questions about their color and stereo vision. Participants were then asked about their level of familiarity with the Oculus Quest and, if required, were given a brief introduction to the device. They were then asked to put their HMD on and launch the version of the IMRT they were assigned (i.e., Test 1 or Test 2). In either case, participants first enter a virtual lobby where they are introduced to the controls, are asked to confirm their connection to the internet, and are reminded to remain seated throughout the test.
After selecting the designated room and submitting their participant ID number, we provided the participants with an introduction to the IMRT. Onscreen text, as well as verbal instructions delivered by the moderator, provided an overview of the controls and a detailed explanation of the objective. In short, for each question, they were instructed to select the two reference objects that they believed are rotated versions of the standard. Participants then completed five sample questions, allowing them to familiarize themselves with both the GUI and their objective. Finally, an overview of the procedure for each test room (outlined below) was provided before participants began the test.
Following the procedure by Peters et al. (1995), in Room A (stereo 3D stimuli), participants had up to seven-and-a-half minutes to answer as many questions as possible from a total of 30-questions. The questions were arranged into two sets of 12-questions and one set of six-questions, with a 1-min break in between each set. Participants had up to 3-min to answer each set of 12-questions and one-and-a-half minutes for the remaining six-questions. In Room B (2D stimuli), participants had up to 6-min to answer 24-questions, arranged as two sets of 12-questions with a 1-min break in between each set. Again, participants had up to 3-min to complete each 12-question set. Participants were then informed that a pop-up message would appear should they exceed any of the allotted time limits, thereby ending that round of questions and advancing them to the next stage of the test.
As a final step prior to beginning the test, the moderator reiterated the objective, asked the participants if they understood the objective, and asked if they had any questions. The participants were then advised that they could begin the test when ready and the moderator initiated a recording of the video conference to document the participants as they completed the IMRT. Upon reaching the conclusion of a test room, participants submitted their answers and proceeded to the next test room (i.e., Room A if they started with Room B, and vice versa). Participants then proceeded through the examples and the test procedure overview before completing the second test room. At the conclusion of both test rooms, participants were asked to remove the HMD and complete a third online survey, the Post-Experiment Questionnaire. Participants were then thanked for their time and were asked if they had any questions, comments, or concerns with the test procedure. Each study sessions required approximately 45–60 min, of which 15–20 min were necessary for the IMRT itself. Participants were not offered any compensation.
3.5 Data Analysis
Each completed IMRT generated a dataset documenting the participants’ response to each of the 2D and 3D IMRT questions and the amount of time required to provide that response. The test number, test room, responses, and time data were compiled within the IMRT application, and upon the completion of each test, were automatically submitted online. Each submitted dataset was then recorded and scored in Microsoft Excel. Time is reported as the mean time per question (mean time per question = sum of time per question/the number of questions answered) for each participant.
As an additional post-hoc analysis, we analyzed each video documenting study participants as they completed the IMRT and quantified participants’ head and body movements. While participants were instructed to remain seated, they were not limited in their ability to change their perspective by moving their head or body in any direction. For this analysis, movement was defined as “purposeful head or body movements—beyond simply looking back and forth—performed to modify the user’s perspective in an effort to collect additional information about the reference objects.” Movements in the left-right, forward-back, and up-down directions were subjectively interpreted and recorded, and the sum of all recorded movements provided an overall movement score for each participant. Movement was only documented for the 3D IMRT, as movement during the 2D IMRT would not yield additional information about the structure of the objects.
4 Results and Discussion
The 2D and 3D IMRTs were each scored out of 24 points, following the 1-point for two correct answers scoring methodology (see Peters, 2005); the six difficult dual rotation questions in the 3D IMRT (i.e., questions 25-30 in Room A) were not included in the participants’ 3D IMRT scores for a balanced and fair comparison between 2D and 3D versions of the test. Participant performance was evaluated using a mixed model analysis of variance with either score or time (average time per question) as the dependent variable, participants as a random factor, and biological sex, VE complexity (Test 1 or Test 2), start room (2D or 3D first), and dimensionality as fixed factors. Additional exploratory analyses examined how participant’s movements and the angular difference between stimuli (difficulty) interact with IMRT performance. The effect size for each of these analyses was calculated as either Cohen’s d (d = M1—M2/SDpooled) or Hedges’ g (g = M1—M2/SD*pooled) according to sample size, and a correction factor was applied for samples < 50. The results of these analyses are presented in the following subsections and an overview is presented in Figure 4.
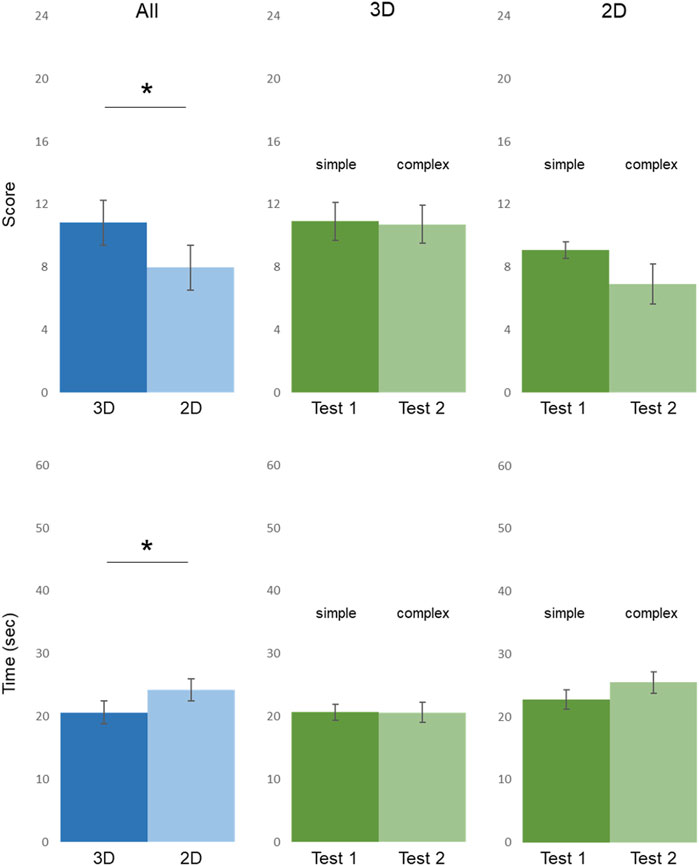
FIGURE 4. Main effects of dimensionality for test score (A) and time (D) for all participants, and main effects of VE complexity (3D: (B,E); 2D: (C,F)) on IMRT performance (score and average time per question). *p < .05. Error bars: SEM.
4.1 Main Effects and Interactions
The IMRT score analysis revealed a significant main effect of dimensionality, F (1,21) = 13.54, p < .01, d = 0.58, indicating that 3D IMRT score (M = 10.83, SE 0.90) was significantly greater than 2D IMRT score (M = 7.96, SE = 0.88). There was not a statistically significant effect of biological sex, VE complexity, or start room on IMRT score, nor were there statistically significant interactions between effects. The results of the fixed effect tests are presented in Table 2. The REML variance component estimates indicate that the variance component associated with participants accounts for 71.57% of the variation in the IMRT score data (Table 3).

TABLE 2. IMRT score fixed effect tests.

TABLE 3. IMRT score REML variance component estimates.
The IMRT time analysis also revealed a significant main effect of dimensionality, F (1,21) = 4.95, p < .05, d = 0.52, indicating that 3D IMRT time (M = 20.65, SE 1.08) was significantly less than 2D IMRT time (M = 24.20, SE = 1.36). There was not a statistically significant effect of biological sex, VE complexity, or start room on IMRT score; however, there was a significant interaction between biological sex and VE complexity, F (1,21) = 4.36, p < .05. There were no other statistically significant interactions between effects. The results of the fixed effect tests are presented in Table 4. The REML variance component estimates indicate that the variance component associated with participants accounts for 61.17% of the variation in the IMRT time data (Table 5).
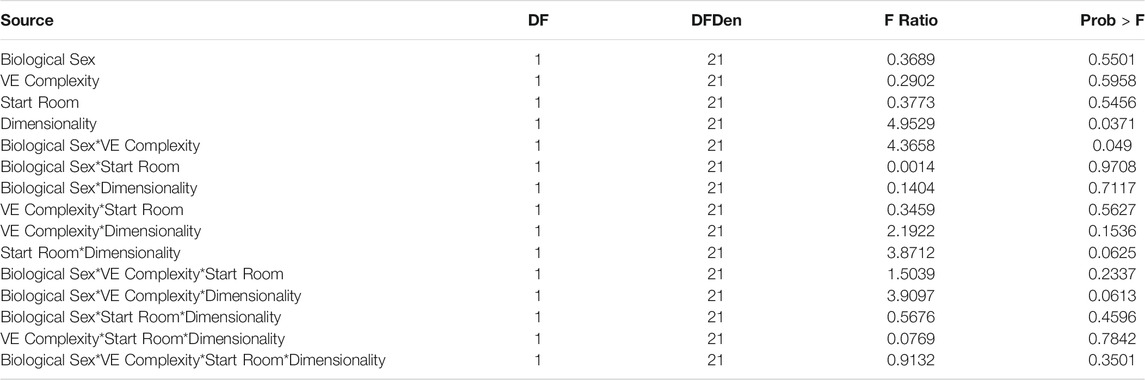
TABLE 4. IMRT time fixed effect tests.

TABLE 5. IMRT time REML variance component estimates.
4.1.1 Dimensionality
As shown in Figure 4 and Figure 5, participants’ average IMRT scores are higher overall with the 3D version and participants took less time to complete the mental rotation tasks. These results clearly demonstrate that mental rotation task performance (score and average time per question) is affected by the dimensionality of the stimuli, thus our main working hypothesis is retained. The size of the dimensionality effect was medium for both score (d = 0.60) and time (d = 0.54).
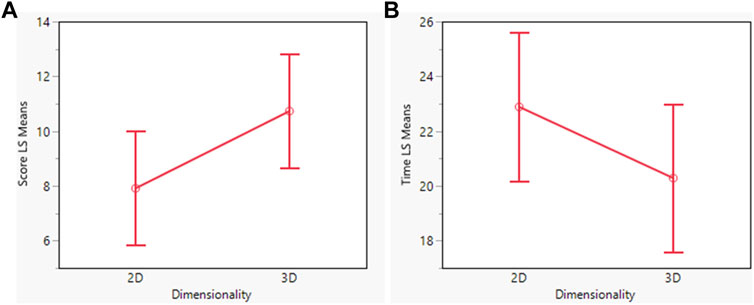
FIGURE 5. LS means plots of score (A) and time (B) for the 2D and 3D IMRT.
The inclusion of 3D objects rather than 2D images of those objects in the IMRT resulted in higher mean scores and lower average time per question; however, this does not necessarily prove that mental rotations are performed more accurately or more rapidly with 3D objects, but that our ability (spatial or otherwise) to comprehend the overall 3D structure of the 3D object is greater when it is perceived as a 3D object rather than as a 2D image of a 3D object. As the 3D IMRT alleviates the need for dimensionality crossing, or the mental processing required to transform a spatial problem presented in 2D into a 3D solution (Voyer et al., 1995), this improved performance was expected.
4.1.2 VE Complexity
The complexity of the background (i.e., varying visual cues and information intensity) on which the cubes were displayed did not have a statistically significant effect on IMRT score or time (see Figure 4). However, the interaction between VE complexity and biological sex did have a statistically significant effect on IMRT time; female participants required more time per question in the complex VE (Test 2) than the simple VE (Test 1) and the opposite interaction was noted for male participants (Figure 6). While the three-way interaction between VE complexity, biological sex, and dimensionality was not statistically significant, F (1,21) = 3.91, p = .06, male and female participants’ 3D IMRT time was less than their 2D IMRT time in the complex VE (Test 2) but not in the simple VE (Test 1), where female and not male participants required more time for the 3D IMRT than the 2D IMRT (Figure 6). These interactions suggest VE complexity has a differential impact on males and females completing mental rotations tasks and that more data should be collected to verify that this pattern is stable.
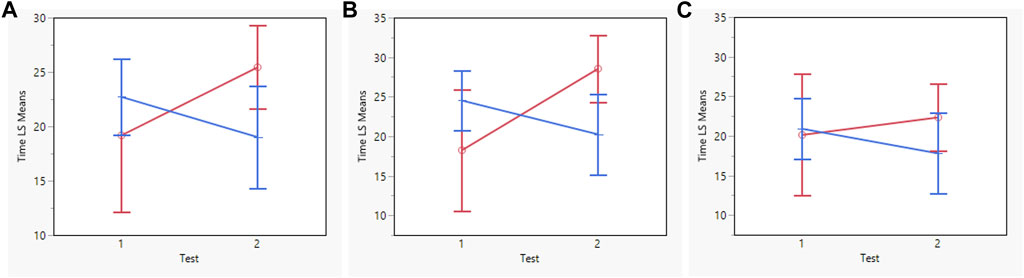
FIGURE 6. LS means plots of overall (A), 2D (B), and 3D (C) IMRT time for male (blue) and female (red) participants completing Test 1 (simple VE) and Test 2 (complex VE).
The VE complexity effect size was greater for 2D IMRT score (g = 0.43) and time (g = 0.34) than 3D IMRT score (g = 0.04) and time (g = 0.004). This difference is notable and suggests that background does affect mental rotation task performance when those mental rotations are performed with 2D images. While Peters and Battista (2008) offer a library of MRT figures with both black and white backgrounds—suggesting that this choice of backgrounds is inconsequential—they provide no guidance regarding the geometry of the shape surrounding each MRT stimuli, although Peters et al. (1995) opted for a square rather than a circle as per Shepard and Metzler (1971) and Vandenberg and Kuse (1978). Despite the apparent fastidiousness, small details such as these, and by extension the details of a 3D VE, might be important to consider and further research on the design of VR visualization environments is necessary to better understand the implications of the context in which mental rotations must be conducted.
4.1.3 Biological Sex
The study was not designed to examine sex differences in the sense that we did not control for all possible confounding factors between our male and female participants. However, since many previous MRT studies have reported differences based on biological sex, and it has been shown in one study that the stereoscopic versions of the MRT might reduce gender differences, we present an exploratory analysis here. Biological sex did not have a statistically significant effect on IMRT score or time. On average, males (M3D = 19.85, M2D = 22.79, g = 0.21) and females (M3D = 21.79, M2D = 26.20, g = 0.21) required less time per question for the 3D IMRT than the 2D IMRT, and males (M3D = 11.88, M2D = 9.35, g = 0.47) and females (M3D = 9.33, M2D = 6.00, g = 0.79) scored higher on the 3D IMRT than the 2D IMRT.
The results of the 2D IMRT nearly replicate the sex effect reported throughout the conventional MRT literature (see Peters et al., 1995; McWilliams et al., 1997; Parsons et al., 2004), where the corrected effect size recorded here (g = 0.70) falls just below the expected range (0.75—1.12) for MRTs scored using the one point for both correct answers rubric (Linn and Petersen, 1985; Voyer et al., 1995). However, the corrected sex effect was smaller (g = 0.50) for the 3D IMRT, supporting the notion that the sex effect can be reduced by eliminating the processing demands of dimensionality crossing (McWilliams et al., 1997). While this effect size is not negligible, and is greater than the d = 0.05 reported by Parsons et al. (2004) in their VRSR study, it is clear that the 3D IMRT does not produce the same sex effect as the traditional MRT and that female participants realized greater performance gains when the test was performed with 3D objects.
4.1.4 Start Room
To counterbalance against a possible learning effect, we presented the 2D and 3D stimuli in rotated order; those that started in Room A (9 male and 5 female) completed the 3D IMRT first, while those that started in Room B (8 male and 7 female) completed the 2D IMRT first. According to our analysis, start room did not have a statistically significant effect on IMRT score or time, nor were there statistically significant interactions. However, the mean 3D IMRT scores (MRoomA = 11.21, MRoomB = 10.47, g = 0.14) and 2D IMRT scores (MRoomA = 9.14, MRoomB = 6.87, g = 0.46) were higher for those starting in Room A (3D) than those starting in Room B (2D). While the effect sizes are small, the start room effect was three times greater when participants started in Room A (3D) than Room B (2D).
The learning effect, or the element of practice, is well documented in the MRT literature. In a 4 week long study in which the MRT was administered weekly, Peters et al. (1995) found that the mean MRT performance (score) of both male and female participants increased with each successive test, with the largest performance gain occurring between weeks one and two. Casey and Brabeck (1989) reported a similar effect when administering the MRT twice, with only a 5-min break between each test. In the IMRT, in which the tests were administered with less than 5-min between each test, the learning effect did not play a significant role, as there was not a statistically significant difference between 2D or 3D IMRT results based on test order. This could be a function of the different order in which the questions were presented and arranged (i.e., while the questions are identical between 2D and 3D conditions, the question order within each test is randomized), but it is more likely a function of the dimensionality difference between the two tests. The IMRT results show a greater effect size for those participants starting with the 3D objects than those that started with the 2D images. This would suggest that by first working with 3D objects, participants were better equipped to work with 2D images of those 3D objects, perhaps by improving their ability to visualize 3D structures and perform dimensionality crossing tasks.
4.2 Exploratory Analyses
4.2.1 Participant Movement
When presented in stereo 3D, head and body movements made by the participants during the 3D IMRT offer an opportunity to gather additional information about the structure of the 3D objects in the 3D IMRT, which might have a potentially confounding effect. While participants were seated during the experiment, their ability to move was not restricted. We conducted a post-hoc analysis of their movements to better understand how often participants attempted to gather additional information about the cubes by looking at them from slightly different perspectives. A movement score was established for 23 of the 3D IMRT participants (μ = 22.5, σ = 18.7). A linear regression analysis revealed that movement did not have statistically significant effect on 3D IMRT score (F (1,21) = 0.005, p = .94) or time (F (1,21) = 2.67, p = .12), suggesting that the additional information gained, or that was at least sought out, did not translate to higher 3D IMRT performance.
4.2.2 Angular Difference
Similarly, as in the movement analysis presented above, how much the test cubes are rotated can affect their level of difficulty and it is interesting, and arguably necessary, to control for this. Our analysis (Figure 7) yielded that the near linear relationship that Shepard and Metzler (1971) observed between reaction time and the angular difference between pairs—calculated here as the net absolute value of the smallest angular difference between each reference object and the standard—was not present for the IMRT. The average time per question did increase as the total angular difference increased, but the relationship was not linear. The total angular difference also impacted the accuracy of responses, as the correct answer was provided less frequently as the total angular difference increased. A mixed model analysis of variance, with either accuracy of response or average time as the dependent variable, participants as a random factor, and total angular difference and dimensionality as fixed factors, revealed that total angular difference had a statistically significant effect on both time (p = .01) and the accuracy of responses (p = .0002), but that there was not a statistically significant difference between 2D and 3D time (p = .29) or accuracy of response (p = .32) based on these angular differences. Therefore, our findings confirm that those questions with a greater total angular difference were more difficult, as they required more time and were answered correctly less frequently in both 2D and 3D.
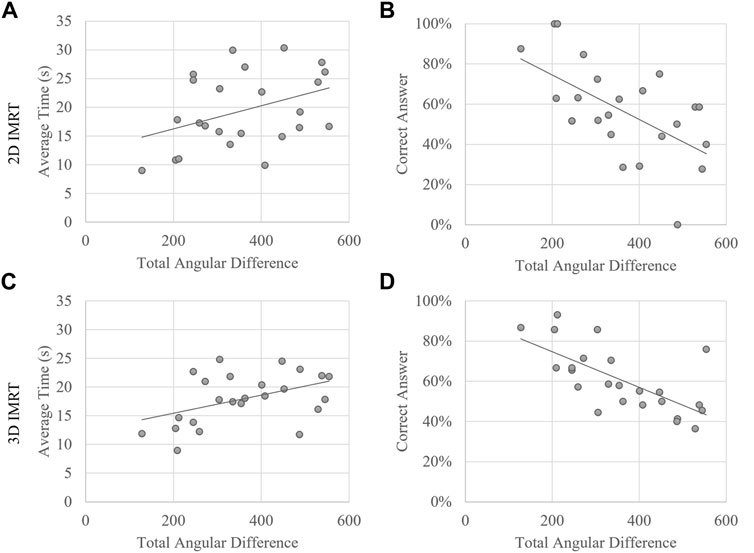
FIGURE 7. The total angular difference was calculated as the net absolute value of the smallest angular difference between each reference object and the standard. (A,C) The average time per question increased as the total angular difference increased. (B,D) The accuracy with which participants answered questions decreased as the total angular difference increased.
4.3 Meta Factors
4.3.1 Speed vs Accuracy
As explained in the Procedure section, participant performance was limited by the 3-min time constraint placed on each 12-question set and many participants expressed their frustration that time had expired prior to them answering all questions. Peters et al. (1995) note that their MRT may be performed with either a 3-min or 4-min time constraint (per 12-question set), and others have conducted the MRT without a time constraint. While removing the time constraint may reduce the established MRT sex effect, this adaptation challenges the ecological validity of the MRT as a test of spatial abilities, which have naturally evolved under the confines of time (Peters, 2005). The effect of the time constraint on IMRT performance is evident in Figure 8, where the percent of answered questions are shown for females and males. The 2D IMRT graphs in this figure resemble those of Peters (2005), indicating that males attempted more questions than females, and that both sexes saw an increase in attempted questions for the second set of 12-questions, which Peters attributed to a “mini practice effect”. However, for the 3D IMRT the male and female graphs are similar, with both sexes attempting a similar number of questions and the practice (learning) effect being less pronounced.
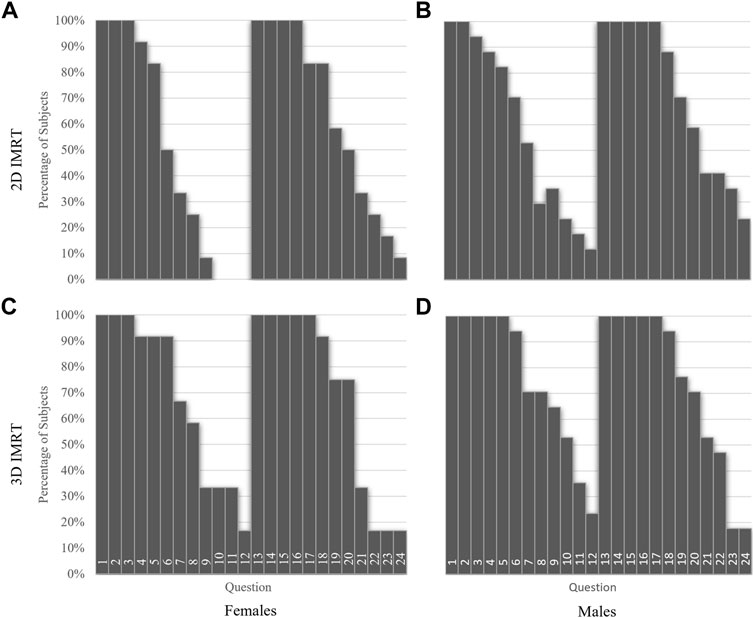
FIGURE 8. The percent of participants answering a question as a function of question order. 2D IMRT scores are presented for females (A) and males (B) and 3D IMRT scores are presented for females (C) and males (D).
While time constraints play a vital role in determining the number of questions that can be answered, IMRT performance is also a function of accuracy. With time constraints in place, the only path to obtaining a higher score is to decrease the amount of time spent on each question–at the risk of decreasing accuracy–or to increase accuracy–at the risk of decreasing overall speed. The speed (average time per question) and accuracy (score) of male and female participants are plotted against each other in Figure 9 to examine the possible speed-accuracy trade-off.
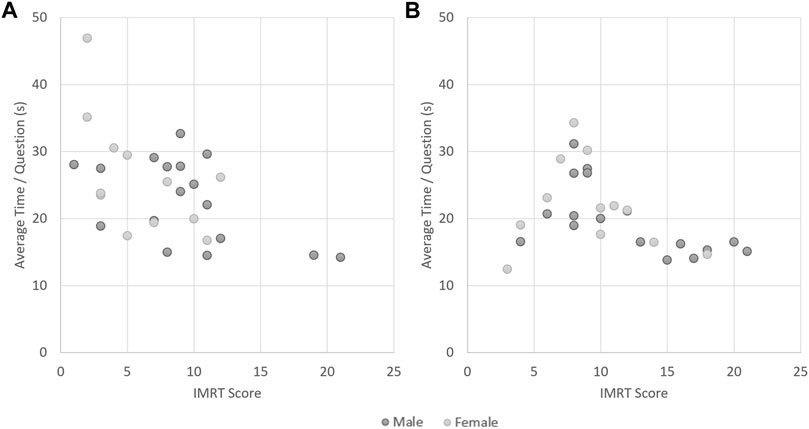
FIGURE 9. Comparing the relationship between speed (average time/question) and accuracy (score) for the (A) 2D IMRT and (B) 3D IMRT.
The two distributions in Figure 9 are quite dissimilar, with the 2D IMRT data points being more randomly distributed than the 3D IMRT data points. For the 3D IMRT, those that spent less time per question tended to achieve a higher score, whereas for the 2D IMRT, a relationship between speed and time was less apparent. This raises questions about the speed-accuracy trade-off and its relationship to mental rotation ability and IMRT performance in 2D and 3D. Scali et al. (2000) found that men outperformed women on the MRT only when scored in a particular manner and when explicit instructions were provided to focus on accuracy, and not when participants were explicitly instructed to focus on speed or were not given explicit instructions either way. IMRT participants were not given explicit instructions either way, nor was a relationship between speed and accuracy implied. Further research into the speed-accuracy trade-off for the IMRT may provide valuable insight into the mental rotation ability of males and females in 2D and 3D, as the observed performance differences are more likely the product of nurture differences than nature differences and warrant further evaluation.
4.3.2 An Element of Luck
As with any multiple-choice question, it is possible that respondents provide a correct answer based on a lucky guess. For the IMRT, the 1-point for two correct answers scoring method was selected, as it both discourages guessing and has proven to yield a larger sex-effect (Peters, 2005). While the probability of participants receiving one point based on two lucky guesses was minimal (8.3%), we felt it was pertinent to assess the IMRTs for unusual responses. This assessment was conducted using the Student-Problem (SP) chart originally created by Takahiro Sato (Mok et al., 2012).
The SP chart is a student-item response matrix—students in this case are the IMRT participants—where rows represent student responses and columns represent items (questions). One point is awarded for a correct response and no points for an incorrect response, and the row and column totals are then calculated. These totals are then used to sort the rows and columns in descending order and either a student curve (S-Curve) or item curve (P-Curve) can be constructed to reveal student performance or item responses that deviate from the expectation. From this, a student (participant) type and item type can be determined using a Modified Caution Index (MCI) calculation (see Mok et al., 2012) that identifies students and items that warrant careful consideration.
Figure 10 presents the participant type and item type charts, in which the MCI values are plotted against score (questions answered correctly/questions answered) for the 2D and 3D IMRT. A vertical line is drawn at an MCI value of 0.3 and a horizontal line is drawn at a score of 0.5, providing four quadrants distinguishing the student and item types. Ideally, all participant type data points would fall in the upper left quadrant (satisfactory performance) and few points in the lower right quadrant (unsatisfactory and unstable performance), and all item type data points in the upper left quadrant (fair question) with few points in the lower quadrants (unfair, too difficult).
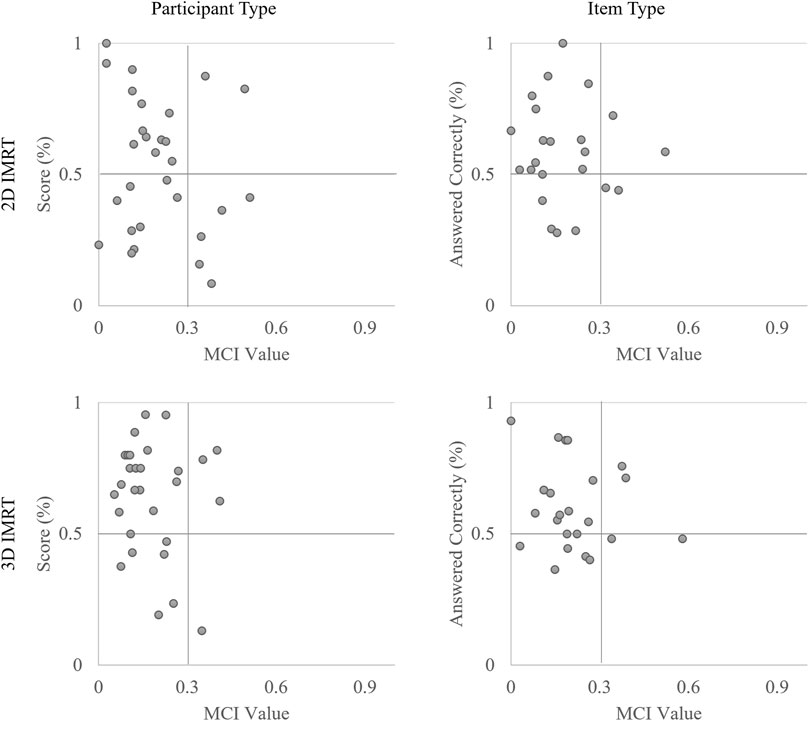
FIGURE 10. The Participant Type and Item Type charts plot score (questions answered correctly/questions answered) against MCI value to classify student (participant) performance and item (question) difficulty. A vertical line at MCI = 0.3 and a horizontal line at score = 0.5 divide the chart into four quadrants. Ideally, all data points should fall in the upper left quadrant.
Based on the SP analyses, more participant type data points fall in the upper left quadrant for the 3D IMRT (17) than the 2D IMRT (13) and fewer data points fall in the lower right quadrant for the 3D IMRT (1) than the 2D IMRT (5). Participant performance could therefore be interpreted as better overall on the 3D IMRT than the 2D IMRT. The item type data points tend to cluster between the upper left and lower right quadrant for the 3D IMRT and are more dispersed between these two quadrants for the 2D IMRT, indicating greater parity in question difficulty in 3D than in 2D. However, when score is a function of overall performance and not simply performance on the questions answered, the participant and item types are drastically different, where >50% of the participant and item type data points are in the lower left quadrant.
Overall, the SP chart and participant and item type analyses suggest that luck was not a factor in the IMRT scores, and that participant performance and item responses did not deviate from what would be expected. These analyses also suggest that 3D IMRT performance was less erratic than 2D IMRT performance and that there was greater parity between participants when IMRT questions were presented in 3D.
5 Overall Discussion
We developed the IMRT as a tool to explore the effect that emerging XR technologies have on mental rotation ability. While it may be true that the IMRT subverts the intended objective of the original MRT by offering 3D rather than 2D stimuli, thus alleviating the cognitive burden of dimensionality crossing, this is precisely what XR technology has done to geovisualization; XR has changed the way we perceive and process spatial data. With XR, we no longer read a 2D map, at least not always. If we are going to gauge the utility of XR-based geovisualizations based on users’ individual differences defined through traditional metrics (e.g., the MRT) which do not properly account for the impact XR technologies may have on those metrics, then we are going to misjudge the utility of those geovisualizations. By exploring how XR technologies change our ability to perceive or comprehend certain 3D phenomena, we can begin to purposefully apply these technologies to address the individual differences and limitations which impact our ability to perform certain visualization-based tasks.
The primary objectives of this study were to assess the differences in mental rotation ability based on dimensionality and VE complexity. Our data show that when mental rotation tests are performed in immersive VR there are significant differences in both score and time when those tests contain 3D versus 2D stimuli. The dimensionality effect was stronger for female participants, whose mean 3D score was 0.79 standard deviations above their mean 2D score. There were clear differences in 2D IMRT performance between males and females, and those differences (g = 0.70) aligned with the expected MRT sex-differences reported in the literature (d = 0.75—1.12) (Linn and Petersen, 1985; Voyer et al., 1995). However, the sex effect was reduced for the 3D IMRT (g = 0.50), suggesting that females benefited more than males in the transition from 2D to 3D. These findings, even though they are preliminary and biological sex did not have a statistically significant effect, are an interesting contribution to the debate regarding biological sex and MRT, as well as the nature of the MRT tasks themselves. The narrowing gap between the two sexes in the stereo 3D condition confirms the findings of Peters et al. (1995) and suggests that the different MRT scores between men and women are at least partially explained by the ability to visualize the 2D shapes in 3D in mind, and not only about the ability to rotate them. This 2D-3D transition also appears to have lessened the influence of VE complexity, which negatively impacted 2D IMRT performance, as the VE complexity effect size was greater for 2D IMRT scores (g = 0.43) than it was for 3D IMRT scores (g = 0.04).
In a series of secondary analyses, we explored various post-hoc hypotheses and controlled for possible confounding effects of participant movement and angular disparity (i.e., question difficulty), on IMRT performance. While each of these analyses provided interesting insights into their effect on mental rotation ability, they also raised some interesting questions concerning mental rotation ability, spatial abilities in general, and immersive geovisualizations that warrant further study, such as; how is learning impacted by dimensionality crossing (2D to 3D and 3D to 2D)? what are users looking at and looking for when they change their perspective in an immersive VE? and, does a low score reflect a lack of ability or a lack of time? These questions can be investigated as follow-up questions in future research to better establish our understanding of the IMRT and similar solutions.
Nonetheless, our study establishes the merit of the IMRT, the results of which suggest that the IMRT has a significant effect on the quantification (or classification) of mental rotation ability compared to conventional (on screen 2D) tests. It is our hope that this IMRT implementation lays the initial groundwork for others to expand upon it. It is important to note that we did not have the option to control for all possible variables (e.g., age, education, XR experience) in our sample population due to the limitations imposed by the global COVID-19 pandemic as well as due to the scope of the study. Natural next steps for future research could be to consider variables such as these, to further explore interactions between variables, and to explore mental rotation performance between traditional paper and pencil versions of the MRT and other XR implementations.
5.1 Limitations
While this research represents a step forward in the analysis of human factors and geovisualization, it is not without its limitations. The primary limitation of this study is the sample size (n = 29) and the population from which this sample was drawn. Restrictions addressing the COVID-19 pandemic prohibited in-person research, thereby forcing data collection from a population owning, or having access to, an Oculus Quest. This requirement both reduced the population from which our sample could be drawn and introduced a bias towards those with established 3D skills and VR experience. The small sample size also impacted our ability to explore interactions between variables.
Additionally, the remote method of data capture reduced our ability to control the study environment. Of the 29 IMRT participants, 11 participated from work or school and 18 participated from home. While participants were asked to ensure a quiet and disturbance free environment, and most did, there is inherent variability across the range of environments that may have influenced individual IMRT performance. Arguably, such variability is not as critical as in other studies given that the participants are wearing a headset that shuts any contact to the actual room they are in, however, it is nonetheless important to note as it might still have an impact in the way people feel when they are at home vs at the office.
5.2 Future Research
Future research expanding on this study should first address the sample and environment limitation to ensure the repeatability of the IMRT. Second, the IMRT only evaluates mental rotation performance in VR, leaving the impact of other XR display devices yet to be studied. However, the IMRT has been adapted for HoloLens2 and Android-based mobile devices and future research efforts will evaluate the impact that MR and AR have on mental rotation task performance. Additionally, future IMRT research should compare IMRT performance to conventional paper and pencil tests, as well as to performance on other spatial abilities tests (i.e., spatial memory or perspective taking tests, e.g., Astur et al., 2004) in their conventional 2D and immersive stereo 3D forms.
6 Conclusion
The results from this study suggest that MRT performance (score and average time per question) is greater when mental rotations are performed in VR with stereo 3D objects rather than 2D images of those 3D objects. Overall, the 3D IMRT scores were greater than the 2D IMRT scores and the average 3D IMRT time per question was less than the average 2D IMRT time per question. This does not confirm that mental rotations are performed more accurately or more rapidly with stereo 3D objects but suggests that our ability (spatial or otherwise) to understand and compare the 3D structure of 3D objects is greater when they are perceived in 3D, thereby alleviating the cognitively challenging task of dimensionality crossing imposed by 2D representations of 3D structures.
Our results suggest that this 3D performance advantage was greater for females (g = 0.79) than males (g = 0.47). The biological sex effect for the 2D IMRT (g = 0.70) falls just short of the expected gender effect values reported by Voyer et al. (1995) and others. However, the biological sex effect for the 3D IMRT (g = 0.50) was less than the expected effect range, but not as low as reported by those using real 3D objects and other immersive interfaces (McWilliams et al., 1997; Parsons et al., 2004). Our results also suggest that the physical characteristics of the VE (i.e., the visual complexity of the background when solving the MRT tasks) have a greater impact on mental rotation performance when those mental rotations are performed with 2D images rather than 3D objects. It is possible that the design of the peripheral elements of a VE have minimal impact on our ability to perceive and comprehend 3D data.
Our study contributes to the assessment of human factors and their impact on geovisualizations designed for VR interfaces. These results suggest that there is value in developing VR interfaces for visual analyses of 3D data, and that with the opportunity for natural data interaction, the performance advantage over conventional 2D mediums could be even greater. However, this study does not prove that visualizing 3D data in VR is superior to other interfaces (desktop, tablet, AR etc.) and further research comparing these interfaces is required. Overall, we hope that this study highlights the importance of performance metrics that account for the effect that emerging technologies have on those metrics, taking us one step closer to understanding the data, use, and user combinations that maximize the transfer of knowledge.
Data Availability Statement
The raw data supporting the conclusion of this article will be made available by the authors, without undue reservation.
Ethics Statement
The studies involving human participants were reviewed and approved by Simon Fraser University Research Ethics Board. Written informed consent was not provided because this study was conducted remotely during the COVID19 pandemic. Instead, consent was provided verbally (via Skype) in accordance with the research ethics approved study design.
Author Contributions
IL and NH designed the original IMRT concept. IL, NH, AC, and BF contributed to conception and design of the study. IL developed the IMRT and all assets, conducted data collection, performed statistical analyses, and wrote the first draft of the manuscript. AC helped coordinate research participants. NH, AC, and BF contributed to the statistical analysis. NH and AC wrote and edited sections of the manuscript. All authors contributed to manuscript revision, read, and approved the submitted version.
Funding
We acknowledge the support of the Natural Sciences and Engineering Research Council of Canada (NSERC), (PGSD3-518954-2018).
Conflict of Interest
The authors declare that the research was conducted in the absence of any commercial or financial relationships that could be construed as a potential conflict of interest.
Publisher’s Note
All claims expressed in this article are solely those of the authors and do not necessarily represent those of their affiliated organizations, or those of the publisher, the editors, and the reviewers. Any product that may be evaluated in this article, or claim that may be made by its manufacturer, is not guaranteed or endorsed by the publisher.
Acknowledgments
We thank Dr. Ortega, who piloted the Slack channel (distributed-VR3DUI) that allowed us to recruit participants remotely during the global pandemic, and all those who participated in this research.
Footnotes
1distributed-vr3dui.slack.com
4SideQuest is a third-party application allowing users to install VR content directly to their Oculus Quest via PC, Mac, or Linux (sidequestvr.com)
References
Alqahtani, A. S., Daghestani, L. F., Ibrahim, L. F., and Ibrahim, L. F. (2017). Semi-Immersive Virtual Reality for Improving the Mental Rotation Skill for Engineering Students: An Experimental Study. J. Comput. Eng. Inf. Technol. 06 (04), 1–9. doi:10.4172/2324-9307.1000180
Astur, R. S., Tropp, J., Sava, S., Constable, R. T., and Markus, E. J. (2004). Sex Differences and Correlations in a Virtual Morris Water Task, a Virtual Radial Arm Maze, and Mental Rotation☆. Behav. Brain Res. 151 (1–2), 103–115. doi:10.1016/j.bbr.2003.08.024
Caissie, A. F., Vigneau, F., and Bors, D. A. (2009). What Does the Mental Rotation Test Measure? an Analysis of Item Difficulty and Item Characteristics. Topsyj 2 (1), 94–102. doi:10.2174/1874350100902010094
Casey, B. M. (2013). “Handbook Of Spatial Cognition. Washington: American Psychological Association, 117–134. doi:10.1037/13936-007
Casey, M. B., and Brabeck, M. M. (1989). Exceptions to the Male Advantage on a Spatial Task: Family Handedness and College Major as Factors Identifying Women Who Excel. Neuropsychologia 27 (5), 689–696. doi:10.1016/0028-3932(89)90113-9
Collins, D. W., and Kimura., D. (1997). A Large Sex Difference on a Two-Dimensional Mental Rotation Task. Behav. Neurosci. 111 (4), 845–849. doi:10.1037/0735-7044.111.4.845
Çöltekin, A., Bleisch, S., Andrienko, G., and Dykes, J. (2017). Persistent Challenges in Geovisualization - a Community Perspective. Int. J. Cartography 3, 115–139. doi:10.1080/23729333.2017.1302910
Çöltekin, A., Francelet, R., Richter, K.-F., Thoresen, J., and Fabrikant, S. I. (2018). The Effects of Visual Realism, Spatial Abilities, and Competition on Performance in Map-Based Route Learning in Men. Cartography Geogr. Inf. Sci. 45 (4), 339–353. doi:10.1080/15230406.2017.1344569
Çöltekin, A., Griffin, A. L., Slingsby, A., Robinson, A. C., Christophe, S., Rautenbach, V., et al. (2020). Geospatial Information Visualization and Extended Reality Displays. Man. Digital Earth, 229–277. doi:10.1007/978-981-32-9915-3_7
Çöltekin, A., Lokka, I., and Zahner, M. (2016). On the Usability and Usefulness of 3d (Geo)Visualizations – A Focus on Virtual Reality Environments. Int. Arch. Photogramm. Remote Sens. Spat. Inf. Sci. XLI-B2, 387–392. doi:10.5194/isprsarchives-XLI-B2-387-2016
Coxon, M., Kelly, N., and Page, S. (2016). Individual Differences in Virtual Reality: Are Spatial Presence and Spatial Ability Linked? Virtual Reality 20 (4), 203–212. doi:10.1007/s10055-016-0292-x
Datta, S., and Roy, D. D. (2016). Construction of Test Measuring Mental Rotation Ability of Adolescent High School Students. Int. J. Indian Psychol. 3 (2), 91–100. doi:10.25215/0302.082
Debelak, R., Gittler, G., and Arendasy, M. (2014). On Gender Differences in Mental Rotation Processing Speed. Learn. Individual Differences 29, 8–17. doi:10.1016/j.lindif.2013.10.003
Devaux, A., Hoarau, C., Brédif, M., and Christophe, S. (2018). 3D Urban Geovisualization: In Situ Augmented and Mixed Reality Experiments. ISPRS Ann. Photogramm. Remote Sens. Spat. Inf. Sci. IV-4 (4), 41–48. doi:10.5194/isprs-annals-IV-4-41-2018
Filho, J. A. W., Stuerzlinger, W., and Nedel, L. (2020). Evaluating an Immersive Space-Time Cube Geovisualization for Intuitive Trajectory Data Exploration. IEEE Trans. Vis. Comput. Graphics 26 (1), 514–524. doi:10.1109/TVCG.2019.2934415
Hays, T. A. (1996). Spatial Abilities and the Effects of Computer Animation on Short-Term and Long-Term Comprehension. J. Educ. Comput. Res. 14 (2), 139–155. doi:10.2190/60Y9-BQG9-80HX-UEML
Hedley, N. R. (2003). “Empirical Evidence of Advanced Geographic Visualization Interface Use,”. no. August: 10–16 in 21st International Cartographic Conference Cartographic Renaissance. 10-16 August 2003, Durban South Africa. Available at: http://icaci.org/documents/ICC_proceedings/ICC2003/Papers/052.pdf.
Hegarty, M., and Sims, V. K. (1994). Individual Differences in Mental Animation during Mechanical Reasoning. Mem. Cogn. 22 (4), 411–430. doi:10.3758/BF03200867
Hegarty, M., Stieff, M., and Dixon, B. (2014). “4. Reasoning with Diagrams: Toward a Broad Ontology of Spatial Thinking Strategies,” in Space In Mind. Editors D. R. Montello, K. Grossner, and D. G. Janelle (London, England: The MIT Press), 75.98. doi:10.7551/mitpress/9811.003.0005
Hinze, S. R., Vickie, M. W., Shultz, M. J., Deslong-, G., Williamson, K. C., and Rapp, D. N. (2014). “Spatial Ability and Learning from Visualizations in STEM Disciplines,” in Space in Mind: Concepts for Spatial Learning and Education. Editors D. R. Montello, K. Grossner, and D. G. Janelle (London, England: MIT Press), 99–118.
Hoyek, N., Collet, C., Fargier, P., and Guillot, A. (2012). The Use of the Vandenberg and Kuse Mental Rotation Test in Children. J. Individual Differences 33 (1), 62–67. doi:10.1027/1614-0001/a000063
Hruby, F., Ressl, R., and de la Borbolla del Valle, G. (2019). Geovisualization with Immersive Virtual Environments in Theory and Practice. Int. J. Digital Earth 12 (2), 123–136. doi:10.1080/17538947.2018.1501106
Huk, T. (2006). Who Benefits from Learning with 3D Models? the Case of Spatial Ability. J. Comp. Assist. Learn. 22 (6), 392–404. doi:10.1111/j.1365-2729.2006.00180.x
Johnson, W., and Bouchardjr, T. (2005). The Structure of Human Intelligence: It Is Verbal, Perceptual, and Image Rotation (VPR), Not Fluid and Crystallized. Intelligence 33 (4), 393–416. doi:10.1016/j.intell.2004.12.002
Kaufmann, H., Csisinko, M., Strasser, I., Strauss, S., Koller, I., and Gluck, J. (2008). “Design of a Virtual Reality Supported Test for Spatial Abilities,” in Proceedings of the International Conference on Geometry and Graphics, 2008. 4-9 August 2008. Dresden Germany. Available at: https://publik.tuwien.ac.at/files/PubDat_170660.pdf.
Laramee, R. S., and Kosara., R. (2007). “Human-Centered Visualization Environments,” in Human-Centered Visualization Environments. Editors A Kerren, A Ebert, and J Meyer. 1st ed. (Berlin, Heidelberg: Springer-Verlag Berlin Heidelberg), 231–254. doi:10.1007/978-3-540-71949-6
Linn, M. C., and Petersen, A. C. (1985). Emergence and Characterization of Sex Differences in Spatial Ability: A Meta-Analysis, Published by : Wiley on Behalf of the Society for Research in Child Development Stable. Child. Dev. 56 (6), 1479. Available at: Http://Www.Jstor.Org/St. doi:10.2307/1130467
Lochhead, Ian., and Hedley, Nick. (2018). “Communicating Multilevel Evacuation Context Using Situated Augmented Reality,” in ISPRS Annals of the Photogrammetry, Remote Sensing and Spatial Information Sciences IV-4/W6 (13th 3D GeoInfo Conference). 1-2 October 2018. Delft Netherlands, 33–40. doi:10.5194/isprs-annals-iv-4-w6-33-2018
Lokka, I. E., and Çöltekin, A. (2019). Toward Optimizing the Design of Virtual Environments for Route Learning: Empirically Assessing the Effects of Changing Levels of Realism on Memory. Int. J. Digital Earth 12 (2), 137–155. doi:10.1080/17538947.2017.1349842
MacEachren, A. M., Edsall, R., Haug, D., Ryan, B., Otto, G., Masters, R., et al. (1999). “Virtual Environments for Geographic Visualization : Potential and Challenges,” in Proceedings of the 1999 Workshop on New Paradigms in Information Visualization and Manipulation in Conjunction with the Eighth ACM Internation Conference on Information and Knowledge Management, 35–40.
MacEachren, A. M., and Kraak, M.-J. (1997). Exploratory Cartographic Visualization: Advancing the Agenda. Comput. Geosciences 23 (4), 335–343. doi:10.1016/S0098-3004(97)00018-6
MacEachren, A. M., and Kraak, M.-J. (2001). Research Challenges in Geovisualization. Cartography Geogr. Inf. Sci. 28 (1), 3–12. doi:10.1559/152304001782173970
Malinowski, J. C. (2001). Mental Rotation and Real-World Wayfinding. Percept Mot. Skills 92 (1), 19–30. doi:10.2466/pms.2001.92.1.19
Marusan, M., Kulistak, P., and Zara, J. (2006). “Virtual Reality in Neurorehabilitation: Mental Rotation,” in Third Central European Multimedia and Virtual Reality Conference. 6-8 November 2006. Eger Hungary, 77–83. Available at: https://www.researchgate.net/profile/Jiri_Zara/publication/268355077_Virtual_Reality_in_Neurorehabilitation_Mental_Rotation/links/551a7a740cf244e9a4587832.pdf.
Mayer, R. E., and Sims, V. K. (1994). For Whom Is a Picture worth a Thousand Words? Extensions of a Dual-Coding Theory of Multimedia Learning. J. Educ. Psychol. 86 (3), 389–401. Available at: http://libproxy.library.unt.edu:2067/ehost/pdfviewer/pdfviewer?vid=1&sid=cacecf36-cd5b-4ffe-9996-9b0332df5fb7%40pdc-v-sessmgr05. doi:10.1037/0022-0663.86.3.389
McWilliams, W., Hamilton, C. J., and Muncer, S. J. (1997). On Mental Rotation in Three Dimensions. Percept Mot. Skills 85 (1), 297–298. doi:10.2466/pms.1997.85.1.297
Moè, A. (2012). Gender Difference Does Not Mean Genetic Difference: Externalizing Improves Performance in Mental Rotation. Learn. Individual Differences 22 (1), 20–24. doi:10.1016/j.lindif.2011.11.001
Mok, M. M. C., Lam, S. M., Ngan, M.-Y., Yao., J. J., Wong, M. Y. W., Xu, J. K., et al. (2012). “Student-Problem Chart: An Essential Tool for SLOA,” in ” in Self-Directed Learning Oriented Assessments In the Asia-Pacific. Editor M. C. Mok (Dordrecht: Springer Netherlands), 203203–203221. doi:10.1007/978-94-007-4507-0_11
Monahan, J. S., Harke, M. A., and Shelley, J. R. (2008). Computerizing the Mental Rotations Test: Are Gender Differences Maintained? Behav. Res. Methods 40 (2), 422–427. doi:10.3758/BRM.40.2.422
Newcombe, N. S. (2014). “Teaching Space: what, How, and when,” in Space in Mind: Concepts for Spatial Learning and Education. Editors D. R. Montello, K. Grossner, and D. G. Janelle (London, England: MIT Press), 323. Available at: http://ovidsp.ovid.com/ovidweb.cgi?T=JS&PAGE=reference&D=psyc11&NEWS=N&AN=2015-20750-016.
Parsons, T., Larson, P., Kratz, K., Marcus, T., Bluestein, B., Galen Buckwalter, J., et al. (2004). Sex Differences in Mental Rotation and Spatial Rotation in a Virtual Environment. Neuropsychologia 42 (4), 555–562. doi:10.1016/j.neuropsychologia.2003.08.014
Peters, M., and Battista, C. (2008). Applications of Mental Rotation Figures of the Shepard and Metzler Type and Description of a Mental Rotation Stimulus Library. Brain Cogn. 66 (3), 260–264. doi:10.1016/j.bandc.2007.09.003
Peters, M., Laeng, B., Latham, K., Jackson, M., Zaiyouna, R., and Richardson, C. (1995). A Redrawn Vandenberg and Kuse Mental Rotations Test - Different Versions and Factors that Affect Performance. Brain Cogn. 28, 39–58. doi:10.1006/brcg.1995.1032
Peters, M. (2005). Sex Differences and the Factor of Time in Solving Vandenberg and Kuse Mental Rotation Problems. Brain Cogn. 57 (2), 176–184. doi:10.1016/j.bandc.2004.08.052
Pulver, Y., Merz, C., Koebel, K., Scheidegger, J., and Çöltekin, A. (2020). Telling Engaging Interactive Stories with Extended Reality (Xr): Back to 1930S in Zurich's Main Train Station. ISPRS Ann. Photogramm. Remote Sens. Spat. Inf. Sci. V-4-2020 (4), 171–178. doi:10.5194/isprs-Annals-V-4-2020-171-2020
Rydvanskiy, R., and Hedley, N. (2021). Mixed Reality Flood Visualizations: Reflections on Development and Usability of Current Systems. Ijgi 10 (2), 82. doi:10.3390/ijgi10020082
Sanchez, C. A., and Branaghan, R. J. (2009). The Interaction of Map Resolution and Spatial Abilities on Map Learning. Int. J. Human-Computer Stud. 67 (5), 475–481. doi:10.1016/j.ijhcs.2008.12.003
Scali, R. M., Brownlow, S., and Hicks., J. L. (2000). Gender Differences in Spatial Task Performance as a Function of Speed or Accuracy Orientation. Sex Roles 43 (5–6), 359–376. doi:10.1023/A:1026699310308
Schnürer, R., Ritzi, M., Çöltekin, A., and Sieber, R. (2020). An Empirical Evaluation of Three-Dimensional Pie Charts with Individually Extruded Sectors in a Geovisualization Context. Inf. Visualization 19 (3), 183–206. doi:10.1177/1473871619896103
Shepard, R. N., and Metzler, J. (1971). Mental Rotation of Three-Dimensional Objects. Science 171 (3972), 701–703. doi:10.1126/science.171.3972.701
Slocum, T. A., Blok, C., Jiang, B., Koussoulakou, A., Montello, D. R., Fuhrmann, S., et al. (2001). Cognitive and Usability Issues in Geovisualization. Cartography Geogr. Inf. Sci. 28 (1), 61–75. doi:10.1559/152304001782173998
Uttal, D. H., Meadow, N. G., Tipton, E., Hand, L. L., Alden, A. R., Warren, C., et al. (2013). The Malleability of Spatial Skills: A Meta-Analysis of Training Studies. Psychol. Bull. 139 (2), 352–402. doi:10.1037/a0028446
Vandenberg, S. G., and Kuse, A. R. (1978). Mental Rotations, a Group Test of Three-Dimensional Spatial Visualization. Percept Mot. Skills 47 (2), 599–604. doi:10.2466/pms.1978.47.2.599
Voyer, D., Voyer, S., and Bryden, M. P. (1995). Magnitude of Sex Differences in Spatial Abilities: a Meta-Analysis and Consideration of Critical Variables. Psychol. Bull. 117 (March), 250–270. doi:10.1037/0033-2909.117.2.250
Wai, J., Lubinski, D., and Benbow, C. P. (2009). Spatial Ability for STEM Domains: Aligning over 50 Years of Cumulative Psychological Knowledge Solidifies its Importance. J. Educ. Psychol. 101 (4), 817–835. doi:10.1037/a0016127
Keywords: spatial ability, mental rotation, virtual reality, 3D geovisualization, spatial knowledge
Citation: Lochhead I, Hedley N, Çöltekin A and Fisher B (2022) The Immersive Mental Rotations Test: Evaluating Spatial Ability in Virtual Reality. Front. Virtual Real. 3:820237. doi: 10.3389/frvir.2022.820237
Received: 22 November 2021; Accepted: 11 January 2022;
Published: 31 January 2022.
Edited by:
Nadia Magnenat Thalmann, Université de Genève, SwitzerlandReviewed by:
George Papagiannakis, University of Crete, GreeceErwan David, Goethe University Frankfurt, Germany
Copyright © 2022 Lochhead, Hedley, Çöltekin and Fisher. This is an open-access article distributed under the terms of the Creative Commons Attribution License (CC BY). The use, distribution or reproduction in other forums is permitted, provided the original author(s) and the copyright owner(s) are credited and that the original publication in this journal is cited, in accordance with accepted academic practice. No use, distribution or reproduction is permitted which does not comply with these terms.
*Correspondence: Ian Lochhead, aWFuX2xvY2hoZWFkQHNmdS5jYQ==