 Jianyao Zhang
 Hiroyuki Kajimoto
- Department of Informatics, The University of Electro-Communications, Chofu, Japan
When reproducing realistic virtual textures for bare finger interaction, an accelerometer attached to a fingernail is commonly used. This measurement depends on the dynamic conditions during the exploration action, and slight differences in roughness are difficult to acquire accurately because of masking by shivering, low-pass filtering by the finger tissue, and sensor accuracy. We propose a simpler yet robust approach based on the 3D measurement of the surface and compare it with the conventional approach. The 3D surface images of sandpaper with different degrees of roughness were captured using a 3D microscope, and the line roughness curve was transformed into an acceleration curve by quadratic differential transformation. The real-time acceleration and frictional force were measured by an accelerometer and force sensor for comparison. A haptic device replaying acceleration-based vibrations by two audio speakers and producing tangential force by a motor-controlled liner slide was developed for reproduction. We conducted experiments with participants to evaluate the reproduction approach. Experimental results showed that the conventional approach obtained sufficient discriminability with the assistance of force, whereas the proposed approach achieved higher reproducibility and discriminability by sole vibration. Thus, our approach provides a new reference for studies of bare finger interaction with rough surfaces.
1 Introduction
With the rapid development of computer graphics technologies, it has become possible to construct 3D models in which virtual objects have texture details that are visually almost indistinguishable from those of real objects. This allows computers to build a virtual environment that can achieve a high degree of similarity with the real environment. However, in the field of virtual reality, interaction with virtual objects with haptic feedback is considered an integral part of immersion (Martel and Muldner, 2017). Although graphic rendering can achieve high precision for surface textures, the haptic sensation has not yet been reproduced to a degree close to the precision of visual reproduction. To achieve such high-quality haptic reproduction, a robust approach is needed to accurately capture the slight differences in the texture of a specific material and reproduce them as distinguishable.
The purpose of this research is to measure the roughness of the material surface precisely and reproduce the slightly different textures of a specific material. The reproduction objects are sandpapers with seven slightly different levels of roughness. To reproduce the haptic sensation when a finger directly contacts and explores them, we introduce a haptic rendering approach that measures the 3D surface height information under no-contact conditions. The acceleration-based vibration signal is obtained by quadratic differential transformation of the line roughness curve in the image and is then processed by an audio processing software to reproduce the textures of different sandpapers. To evaluate the proposed approach, the acceleration and frictional forces under dynamic conditions were also measured directly. Experiments were conducted to compare the reproducibility and discriminability under the combined vibration and force conditions. The device used in the experiment presents vibrations from audio speakers installed on the left and right sides. The knob of a linear slide at the top can be moved by a motor to present force to the fingers. Experimental results revealed that the conventional approach obtains sufficient discriminability with the assistance of force, whereas the proposed approach achieves higher reproducibility and discriminability by vibration only.
Our proposed approach is able to measure the roughness of the material surface more precisely and reproduce the fine differences between sandpapers. In addition, the measurement approach is easy to set up and the measurement results are stable, so it can be considered as a candidate approach to reproduce the haptic sensation of bare fingers on a flat plate. For example, showing different weave densities of the clothes in a shopping application, or showing the fine texture of an object in a game application using touch.
The remainder of this paper is organized as follows. We introduce the related work in Related Work Section, describe the details of the proposed reproduction approach, an overview of the conventional approach, and the setup of the haptic reproduction system in Materials and Methods Section. User experiments and results that reveal the reproducibility and discriminability of each approach are presented in User Study and Results Sections. The discussion of the experimental results, limitations, and future work are presented in Discussion Section.
2 Related Work
2.1 Use of Vibration in Haptic Reproduction
A series of extant studies have demonstrated excellent performance in reproducing different types of materials, such as wood, clothes, and sandpaper (Kuchenbecker et al., 2011; Ito et al., 2017; Strese and Steinbach, 2018). Mechanical vibration is a common method for haptic reproduction. Lee et al. (2019) built TORC, a rigid haptic controller that renders virtual textures and compliance by applying a trackpad on the region where users hold and squeeze using their thumb and two other fingers. Vibrotactile motors embedded in trackpads produce sensations on each finger that represent the haptic feel of squeezing, shearing, or turning an object. Ujitoko et al. (2020) created a transparent vibrator system that absorbs the difference in the frequency characteristics of the vibrator environments. Because vibrotactile signals with various frequency patterns can arouse different haptic sensations, processing the spectral feature of vibration to match the real one is an important process in haptic rendering. Preechayasomboon et al. (2020)’s “Chasm” reproduced rough and smooth textures using 25–40 Hz vibrations rendered from a broadband screw-based linear actuator; Hasegawa et al. (2020) attempted to reproduce the haptic sensation of 19 materials by the phase difference between normal and shear forces and obtained reproducibility with great accuracy. However, these studies all focused on reproducing the textures of completely different materials.
2.2 Augmented Reality of the Texture
In contrast to reproducing different materials, we focused on rendering and reproducing the roughness with a slight difference in a specific material, using sandpapers with different roughness as an example. This requires the reproduced virtual texture to reflect the components with changed texture in a way that is maximally and discriminatingly effective, without changing the basic haptic sensation of the material. Studies that attempted to prepare a “real object” and modulate its changed texture have been conducted; this can be regarded as augmented reality of the texture (Jeon et al., 2011). Asano et al. (2015) proposed a method to modulate the roughness of a material with characteristic textures by applying vibrations in the depth direction. Maeda et al. (2016) reported that vibrating a voice coil actuator attached to a fingertip changes the haptic perception of objects touched by the fingertip. For haptic modulation of flat surfaces, Poupyrev and Maruyama (2003) produced a click-like texture by vibrating a small touch panel. The texture of the real object itself does not change, but in terms of the haptic phenomenon that occurs, an augmented reality situation is established because the sensation of the texture of the real object has changed. This concept is considered useful for reproducing slightly different textures of specific materials (Takasaki et al., 2005; Bau et al., 2010).
2.3 Limitations and Countermeasures for Acceleration Measurement
Considering the sensory mechanoreceptors in the skin that are responsible for haptic perception, especially the Pacinian corpuscles that function in micro-textures and respond only to the accelerative vibration of skin deformation (Biswas et al., 2015), it is reasonable to replay acceleration as a vibration signal to reproduce textures with slight differences. To obtain different degrees of roughness data for modulation, it is common to use an accelerometer to measure the acceleration as the probe explores a surface. Culbertson et al. (2014) measured six types of surfaces, including rough plastic, canvas, floor tile, silk, vinyl, and wood, using a metal probe with an internally mounted accelerometer. Culbertson and Kuchenbecker (2017) restructured the recorded data for realistic rendering of textures on a SensAble Phantom Omni haptic interface augmented with a Tactile Labs Haptuator for vibration output. While these works achieved great reproducibility, there is a lack of discussion on the different textures of the same material based on bare fingers contact in these existing studies. In the case of contact with a bare finger, the fingertip needs to contact the material directly when measuring acceleration, so the accelerometer is usually attached to the fingernail. However, the accuracy of the measurement is easily affected by dynamic measurement conditions. It is difficult to accurately control the speed of finger movement and pressing force, and the finger tissue from the contact point to the sensor has a filtering effect on the transmission of vibration. These dynamic conditions may mask the slight differences in vibration due to changes in the roughness of the same material, even if the masking effect is smaller for macro differences in the haptic sensation of completely different materials. To extract more details of the material itself and improve the measurement accuracy, a more robust and condition-independent approach for haptic reproduction is required. Our study will focus on solving this problem.
3 Materials and Methods
The studies involving human participants were reviewed and approved by the ethics committee of the University of Electro-Communications (No. 19037). The patients/participants provided their written informed consent to participate in this study. Written informed consent was obtained from the individual(s) for the publication of any potentially identifiable images or data included in this article.
3.1 Surface Measurement
Seven pieces of sandpaper were used as samples for the texture reproduction. Their granularities were #100, #120, #150, #180, #240, #320, and #400. These numbers represent the approximate number of abrasive particles per unit area according to the ISO 6344 (2013) standard. The smaller the number, the higher the roughness. For example, the average particle size of #100 sandpaper was 162 μm, and that of #400 was 35 µm. We captured the surface images of the seven sandpaper samples with an area of 43 mm2 (with a length of 7.59 mm) using a 3D measurement microscope (VR-3100, Keyence) that uses laser scanning to obtain a 3D image of a certain area of the sample surface (Figure 1C). The principle of the measurement is to project the light of the stripe pattern onto the surface (Figure 1D) and observe the deformation of the stripe pattern (Figure 1A). The shape of the surface was obtained from the distortion of the stripe pattern using triangulation ranging. Figure 1B shows the measured surface image of sandpaper #100 as an example. The captured images were analyzed and processed using an accompanying software environment (VR-3000 G2 APPLICATION). The line roughness was obtained on the horizontal centerline, denoted by the red arrow in Figure 1B. These line roughness curves indicate the height at each position on the cross section based on this centerline.
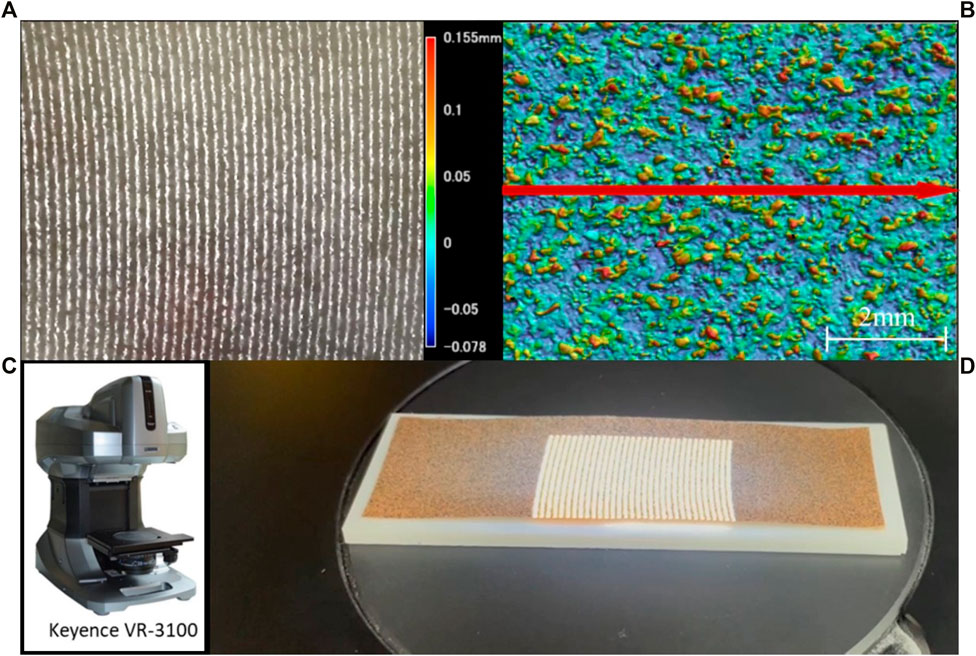
FIGURE 1. 3D measurement of sandpaper. (A) The deformation of the stripe pattern. (B) Height image measured by (C) 3D microscope. The red arrow indicates where the line roughness is acquired. (D) Microscope projects the light of the stripe pattern onto the surface.
3.2 Transformation From Displacement Curve to Acceleration Curve
Because the vibration for reproduction is based on acceleration, it is necessary to transform the obtained line roughness curves into acceleration curves. The line roughness curve indicates the height of the surface at each position on the selected line. If this curve is placed on the time axis with a length of approximately 0.2 s, it can be regarded as a vertical displacement curve when the point-like probe is scanned horizontally over a distance of 7.59 mm in 0.2 s. Here we present Figure 2 that shows the spectrums obtained from sandpaper #100 to introduce the process of vibration transformation. The blue curve in Figure 2 is the spectrum of the displacement curve obtained with the audio software Audacity v2.3.0 (https://www.audacityteam.org/), which shows the amplitude characteristics at each frequency.
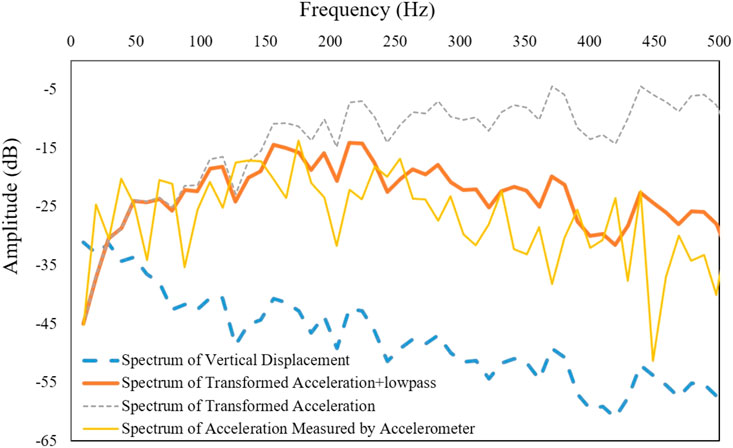
FIGURE 2. The spectrums obtained when processing the vibration of sandpaper #100. Blue: Spectrum of the 3D measured displacement curve; Grey: Spectrum of the transformed acceleration curve; Orange: Spectrum of the acceleration curve after low-pass filtering; Yellow: Spectrum of the acceleration measured directly by accelerometer.
Based on the Fourier transform, this displacement curve can be decomposed into
After applying this equalizer to the displacement curve, the acceleration curve was obtained, the spectrum of which is shown as the grey curve in Figure 2.
3.3 Direct Measurement of Acceleration and Force
The acceleration and friction measurement system consist of a 3-axis accelerometer (MMA7361, Cixi Borui Technology) and two 3-axis force sensors, as shown in Figure 3. The accelerometer was attached to the nail, and the fingertip was used to touch the sample to be measured on the acrylic plate. The acceleration, lateral friction, and downforce generated during exploration were measured simultaneously. For each piece of sandpaper, 10 testers (who were also participants in the experiment) were recruited to perform the test in seven pressure ranges: 0–0.25 N, 0.25–0.5 N, 0.5–0.75 N, 0.75–1 N, 1–1.25 N, 1.25–1.5 N, and 1.5–1.75 N. The testers were required to follow a metronome rhythm of 60 bpm to trace the sandpaper from left to right (or right to left) at a speed of approximately 80 mm/s. For rougher sandpaper, when the down pressure exceeds 0.75 N, the stick-slip phenomenon is likely to occur and the finger will have difficulty sliding steadily, so we chose the acceleration measured at a relatively stable down pressure of 0.25–0.5 N for reproduction. The spectrum of acceleration measured when tracing sandpaper #100 is shown as the yellow curve in Figure 2. For the same reason, we reproduced only the frictional force during stable sliding. The discarded data were used to simulate the stick-slip phenomenon (see Section 2.5.3). An example of frictional force measured when ten testers traced sandpaper #100 is shown as a box-and-whisker plot in Figure 4. The horizontal axis is the mean value of the downforce when it was controlled in the range of 0–0.25 N, 0.25–0.5 N, 0.5–0.75 N, and 0.75–1 N. When the downforce is strong, the frictional force in the ulnar direction is stronger than that in the radial direction. The same direction-dependent phenomenon occurred with the other sandpapers.
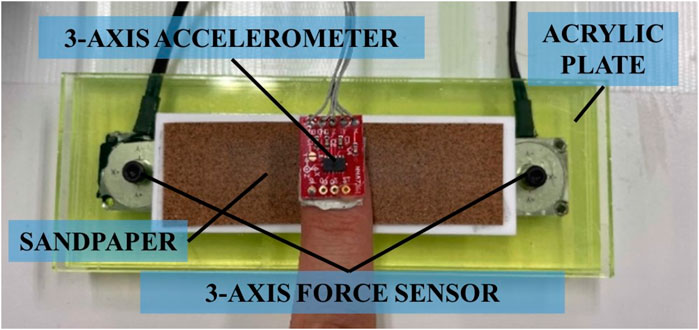
FIGURE 3. System for direct measurement of acceleration and frictional force.
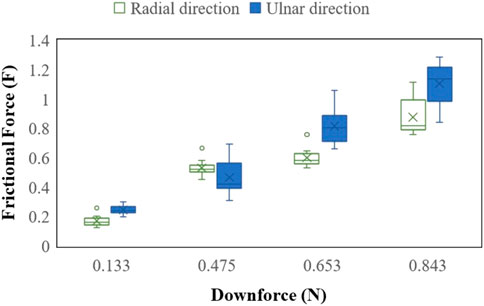
FIGURE 4. Relationship between downforce and frictional force obtained by the results of force measurement in the case of sandpaper #100. The frictional force displayed direction-dependent difference.
3.4 System Description
3.4.1 Configuration of Haptic Device
The haptic device used for reproduction was designed as an encounter-type haptic display to allow the user to freely experience the reproduced haptic sensation using a bare finger. An overview of this device is presented in Figure 5. Two audio speakers [NSW 12058 A (2), Aurasound] were fixed on the side of the main unit to present the tangential vibrations via audio signals and connected in series to an audio amplifier (M50, Muse). An acrylic plate with a thickness of 1 mm was connected to the speakers from the left and right so that the plate was suspended in air. A masking tape with a similar material feeling (Macroscopic perception of the material, including roughness, shape, hardness, and wetness, etc.) as the sandpaper was then pasted onto the acrylic plate. The length of the explored area was approximately 76 mm. A variable resistor with a DC motor (RSA0N11M9A0K, Alps Alpine) was set on top of the main unit, and its resistance value refers to the position of the knob on the liner slide. A support part was attached to the knob. When the user inserts the finger into the support part and moves it horizontally, the position of the finger is mapped to the resistance value. By controlling the motor, the handle can be actuated to move left or right with a settable velocity through pulse-width modulation (PWM) control. Different intensities of the resistance and propulsion forces (depending on the direction of rotation) can be provided. The downforce during the exploration can be monitored in real time by placing the device on the measuring device (described in Limitations and Countermeasures for Acceleration Measurement Section). Based on these data, the frictional force can be reproduced for different downforce conditions.
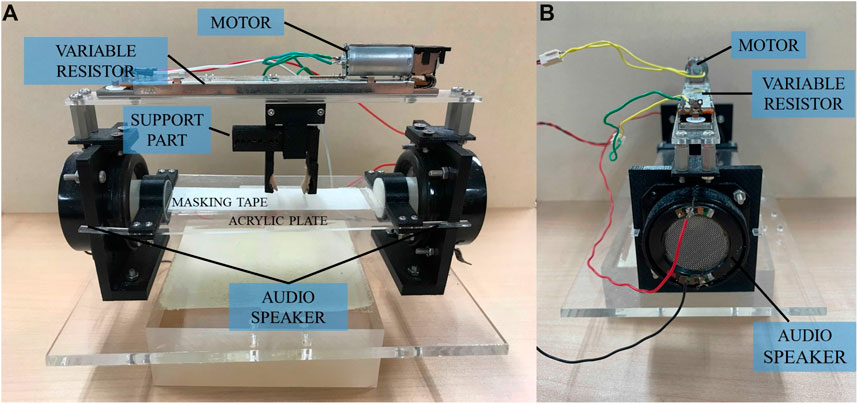
FIGURE 5. Overview of the reproduction device. (A) Front-view; (B) Side-view.
3.4.2 System Control Flow
The control unit consisted of a digital potentiometer (MCP4018, Microchip Technology), motor driver (BD6222HFP, Rohm), and microcontroller (ESP32, Espressif). The data flow of the entire system is shown in Figure 6. The vibration signal at a fixed amplitude was input to a digital potentiometer from a personal computer. The user places the index finger into the support part and moves it to the left and right. The position of the finger is mapped from the value of the variable resistor (
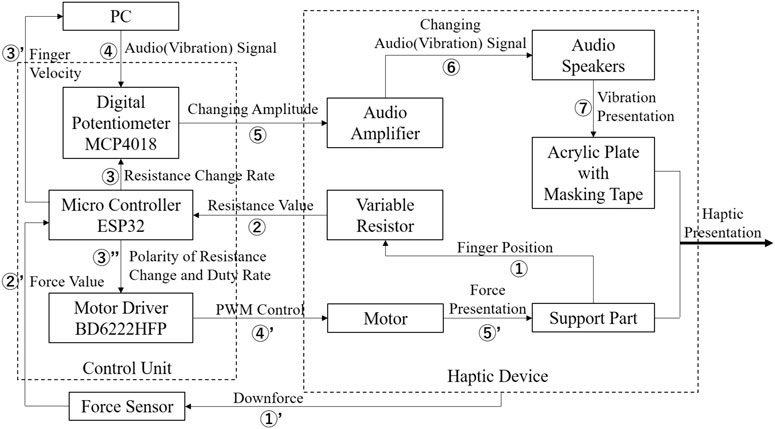
FIGURE 6. Dataflow of the reproduction device and control system.
3.5 Processing of the Reproduction Signal
3.5.1 Vibration Filters
The high frequency vibration of the transformed acceleration needs to be attenuated. In a contact action, the finger pad and sandpaper surface are in contact through a contact area rather than a point. The contact area of the finger allows the perceived roughness to be averaged by integrating multiple-line roughness. This means that the contact area acts as a low-pass filter. To confirm the effect of the low-pass filter on the contact surface, we referred to the spectrum of the directly measured acceleration. Taking the acceleration of #100 as an example, the frequency spectrum is represented by the yellow curve in Figure 2. The major difference compared to the grey curve is the decrease in amplitude above 150 Hz. To achieve the filtering effect of the contact area, we used the low-pass filter function of Audacity to reduce the amplitude of the vibration above 150 Hz by −12 dB, and finally obtained the spectrum indicated by the orange curve. It can be seen that the spectral characteristics of the orange curve are close to those of the yellow curve. The acceleration that transformed from line roughness (Figure 7A) is shown in Figure 7B. We applied the same filter to all vibration curves transformed from the seven displacement curves, and these processed vibrations were used as a result of the haptic rendering for the haptic reproduction.
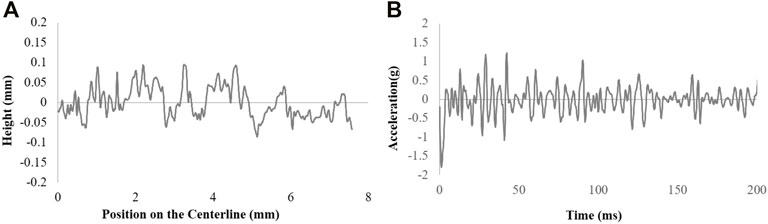
FIGURE 7. Transformation of displacement to acceleration: (A) original height (displacement) curve; and (B) acceleration transformed from displacement.
An inverse filter to supplement the difference between the input and output of the vibration is required. Owing to the filter feature within the entire system, such as the amplifier and audio speaker, and the skin tissue of the participant’s finger, the output and input vibration signals are different in some frequency ranges. To compensate for this discrepancy, we used an equalizer to create inverse filters. The flowchart for creating the inverse filter is shown in Figure 8. We measured the acceleration when exploring the sandpaper and obtained its spectrum 1 (
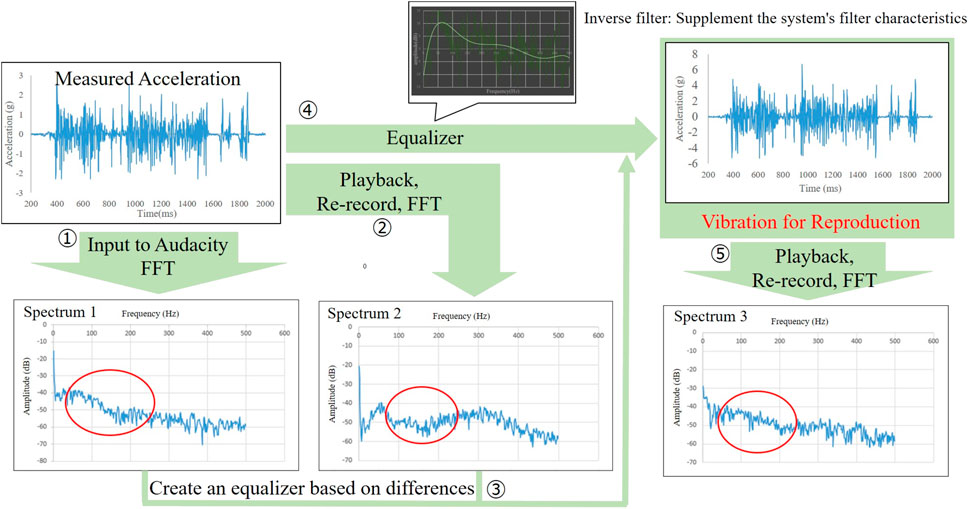
FIGURE 8. The flowchart for creating the inverse filter.
3.5.2 Playback Cycle Corresponding to Finger Velocity
The correspondence between the playback cycle of vibration and finger velocity is important for the realism of reproduction. When using the transformed acceleration, vibration signals of 0.2 s duration were looped during the texture reproduction using the reproduction device. In the process of transforming, we assumed that the user explores the sandpaper at a velocity of 38 mm/s and considered the line roughness curve as the vertical displacement curve of the skin deformation of the fingertip when the user tangentially explores the sandpaper of a length of 7.6 mm in 0.2 s. In fact, it is difficult for the user to always explore the sandpaper at the same velocity, and 38 mm/s is slow for the actual exploring action. It is considered that when the exploration velocity exceeds 38 mm/s, the playback speed of vibration should also be increased accordingly.
We used MAX7, a graphical integrated development environment for music and multimedia to obtain a simple correspondence between the playback speed of vibration and finger velocity. When the exploration velocity was lower than 15 mm/s, wherein the skin was primarily deformed by elasticity caused by the static friction between the fingers and the sandpaper, no significant vibration was felt. Therefore, the vibration was cycled slowly over a period of approximately 1 s. When the exploration velocity was between 15 and 35 mm/s, the period is cycled approximately 0.4 s for a stable low-frequency vibration. When it exceeds 35 mm/s, the period decreases proportionally to the exploration velocity starting from 0.2 s. The change at 35 mm/s was not perceived by the participants.
Similarly, the directly measured acceleration and duration of the vibration signal was 1 s during which the finger traced the sandpaper at a speed of 80 mm/s. When the exploring speed was lower than 20 mm/s, the playback cycle was 5 s. When the exploration velocity was between 20 and 80 mm/s, the period was cycled for approximately 2 s. When it exceeded 80 mm/s, the playback cycle decreased proportionally to the exploration velocity starting from 1 s.
To confirm the actual effect of this processing, we used a microcontroller to input dummy finger position and velocity data to MAX7, and the temporal relationship between the finger velocity and vibration playback speed is shown in Figure 9. The dummy data for the test were set to repeatedly output the position information of 0–8 mm at speeds of 0 mm/s, 20 mm/s, and 38 mm/s. There is a delay of approximately 80 ms between the timing of the change in the vibration playback speed and that in the exploration velocity. This delay does not appear to have a significant effect on texture perception at this time.
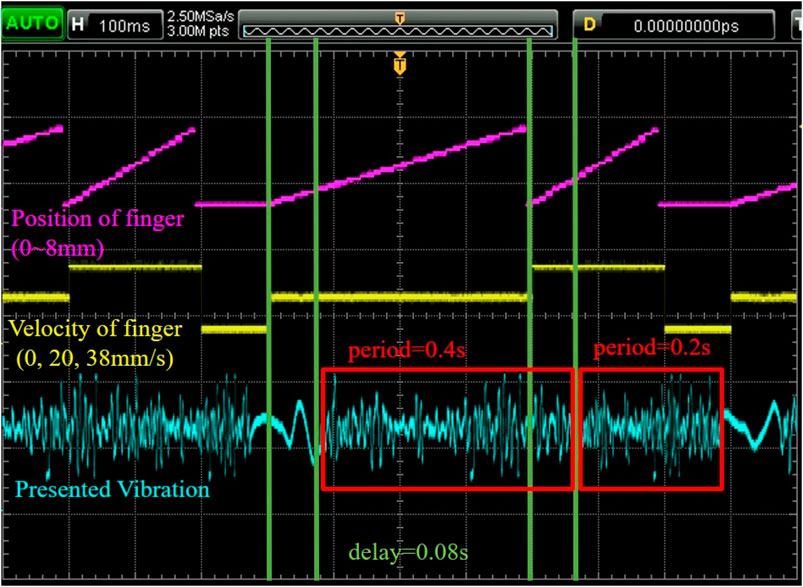
FIGURE 9. Time relative relationship with finger position, velocity, and vibration playback speed.
3.5.3 Frictional Force and Stick-Slip Simulation
We used a variable resistor in which the knob could be driven by the motor for force presentation. As shown in Figure 10, we tested the force intensity at −0.4 to 0.8, with a duty ratio of 0.05 increments and obtained the output vs. duty ratio curve. The symbol indicates the direction of the force. In the default condition (duty ratio is 0), there is a frictional force of about 0.5 N between the knob and the slide. Presenting the propulsive force in the same direction as the finger movement can eliminate intrinsic friction. In this case, the resistance force is counteracted to about 0 N when the duty ratio is 0.4 (−0.4 in Figure 10). Using this curve, the duty ratio required for reproducing the frictional force can be obtained. During reproduction, the downforce is constantly monitored. When the downforce increased, the resistance force increased in steps.
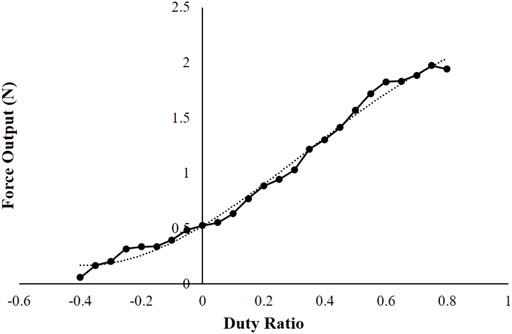
FIGURE 10. Relationship between the duty ratio of PWM control and force output of the motor.
As shown in Figure 11, in the acceleration profile where the stick-slip phenomenon occurs, the amplitude suddenly increases at several periods. We calculated the duration for which a large amplitude occurred. At a certain time point, if the average amplitude within 50 ms before and after this time point is greater than twice the average amplitude within 200 ms before and after this time point, this 50 ms period is considered to be larger than the amplitude during the surrounding period. By performing this operation during a 1 s vibration signal, we obtained the approximate occurrence rate of the stick-slip phenomenon. The maximum resistance force was output according to this occurrence rate to simulate the stick-slip phenomenon.
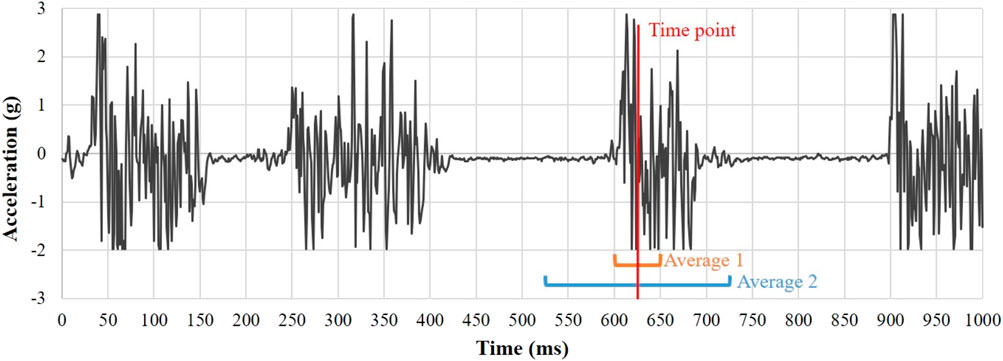
FIGURE 11. Acceleration profile where the stick-slip phenomenon occurs. At a certain time point, if the average amplitude within 50 ms (Average 1) is greater than twice the average amplitude within 200 ms (Average 2), it is considered that stick-slip phenomenon occurred.
4 User Study
The user study included two experiments to evaluate the reproducibility and discernibility of the rendered virtual texture. The participants were ten laboratory members (all males) of 25 ± 2 years of age, nine of which were right-handed. None of the participants had functional problems with haptic perception. Before the experiment, the experimenter adjusted the height of the chair so that each participant’s finger could move easily on the device.
4.1 Experiment 1
Our objective was to reproduce the texture of sandpaper while focusing on reproducing the slight differences in roughness among different types of sandpapers. Thus, the first experiment was focused on whether the differences between the reproduced textures of each roughness could be correctly perceived under the three reproduction approaches.
4.1.1 Practice
The participants were asked to keep their eyes closed and put on a headset playing pink noise to mask auditory cues. Before the experiment, a practice process was conducted to familiarize the participants with the use of the haptic device and the perception of the reproduced textures. The experimenter first played one of the reproduced textures and allowed the participant to put their fingers into the support part to explore horizontally at any velocity for 10 s. Then, the experimenter switched to another reproduced texture and repeated the same practice process until all the produced textures were presented. The basic procedure of the main experiment was as follows.
4.1.2 Procedure
Initially, the participants were provided with one of the seven real sandpapers and asked to explore the sandpaper freely for no more than 5 s. Thereafter, the experimenter randomly replayed one of the reproduced textures, and the participants explored the reproduced texture on the haptic device using the same exploration condition for no more than 10 s. The participants were allowed to go back to explore the sandpaper no more than twice during one trial. After the exploration, the degree of roughness of the real sandpaper was defined as benchmark 0. The relative degree of roughness was answered with a number from −1 to −5 in the case when the reproduced texture was smoother than real sandpaper, and with a number from 1 to 5 in the case when the reproduced texture was rougher than real sandpaper; a response of 0 was permitted. Therefore, if the replay “perfectly” matched, we expected an answer close to 0. Therefore, we expected an answer close to 0 when the real and reproduced samples were the same. Under the same benchmark, the response scores should show an increasing trend when the reproduced texture became rough, and a decreasing trend when the reproduced texture became smoother. This indicates that the change in each reproduced texture can be correctly perceived using the same benchmark. In addition, when changing the real sandpaper, the score of the same reproduced texture should show a decreasing trend when the sandpaper becomes rougher, and an increasing trend when the sandpaper becomes smoother. This indicates that the perception of the roughness of the same reproduced texture does not change despite the change in the benchmark. We evaluated the distinguishability and stability of the three approaches with these two pieces of evidence. The experiments were conducted in 3 days for each of the three reproduction approaches: acceleration transformed from 3D measurement (VD), directly measured acceleration (VA), and frictional force (F). There was no difference in texture reproduced using the transformed acceleration among all participants. The texture reproduced using the directly measured acceleration and frictional force were based on the data obtained from individual measurement of each participant (Limitations and Countermeasures for Acceleration Measurement Section), and the downward pressure was limited to 0.25–0.5 N. Under one reproduction approach, there were seven reproduced textures and seven real textures, yielding 49 combinations. Each combination was randomly presented three times, with 147 trials in total.
4.2 Experiment 2
Experiment 2 evaluated the reproducibility of the reproduced textures. The following reproduction approaches were tested: acceleration transformed from 3D measurements (VD), directly measured acceleration (VA), and frictional force (F). We also added a combination of acceleration that transformed from 3D measurement and frictional force (VD + F), and a combination of directly measured acceleration and frictional force (VA + F) as new approaches to confirm the auxiliary effect of frictional force on vibration.
4.2.1 Preparatory Experiment
Because the roughness of the seven types of sandpaper was similar, it was predicted that it was not easy to distinguish among the physical objects. First, we conducted a preparatory experiment with physical objects only. During one trial, the participants were required to explore one of the sandpapers randomly with eyes closed, while the auditory cue was masked by pink noise. The participant then freely explored the seven sandpapers. After finishing this trial, participants were required to answer which of the seven pieces of sandpaper was the first explored sandpaper. Each sandpaper was randomly presented five times, with 35 trials in total. The correct rates are shown in Figure 12. The two lowest correct rates were obtained for sandpaper with granularities of #120 and #180, which indicates that these two sandpapers are very easily confused with similar sandpapers and would affect the reproducibility experiment afterwards; therefore, these two sandpapers were excluded from the subsequent experiment.
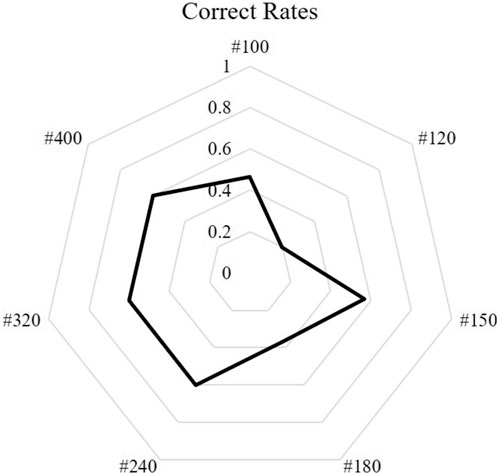
FIGURE 12. Correct rates from the discrimination experiment using real sandpaper.
4.2.2 Main Experiment
In the main experiment, we used a haptic device (introduced in Limitations and Countermeasures for Acceleration Measurement Section) to present the virtual texture reproduced by five approaches (VD, VA, F, VD + F, VA + F). During one trial, a reproduced texture was randomly presented. Then, the participants were allowed to explore the texture alternately with each sandpaper for 5–30 s at any speed and downforce. There was no limit to the number of times they could explore the virtual texture or sandpaper. After this trial, participants were required to identify the physical sandpaper that the device was reproducing. Participants were asked to keep their eyes closed, and their hearing was masked by pink noise. Five textures reproduced by five approaches were randomly presented three times, yielding 75 trials in total.
5 Results
5.1 Comparison of the Discriminability
Results of Experiment 1 is shown in Figure 13 which illustrates the distribution of responses. The data labels indicate the mean values. The Kruskal–Wallis test with independent samples was used to identify the differences among all responses. The significance level was set at 0.05 and the degree of freedom was 6. The adjusted probability of significance for multiple tests by Bonferroni correction showed that significant differences were found among several reproduced texture under the same benchmark sandpaper.
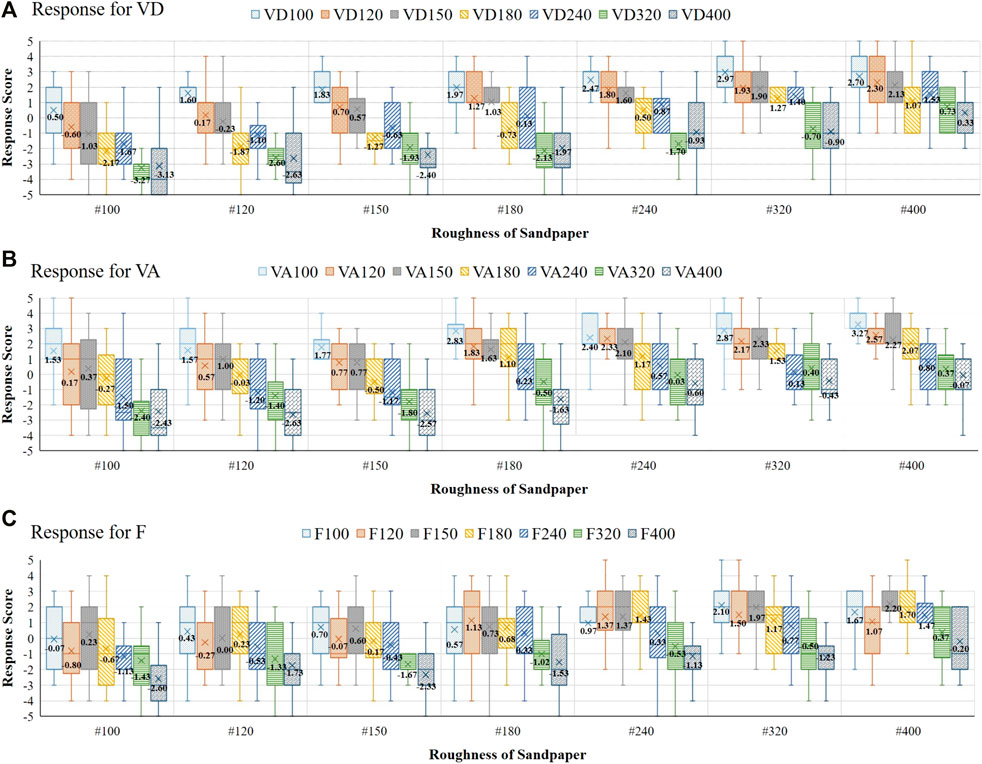
FIGURE 13. Comparison results of three approaches. (A) Transformed acceleration; (B) directly measured acceleration; and (C) frictional force.
Figure 13A shows the results obtained when using the transformed acceleration. The horizontal axis shows the roughness of each sandpaper as a benchmark. Under the same benchmark sandpaper, the response scores showed a decreasing trend when the reproduced texture became smoother, which indicates that the differences in each reproduced texture were correctly perceived. When the sandpaper became smoother, the score of the same reproduced texture showed an increasing trend, which indicates that the perception of the roughness of the same reproduced texture did not change despite the change in the benchmark. Furthermore, under all benchmarks, the score of the reproduced texture corresponding to the benchmark sandpaper was close to 0. For example, reproduced texture #100 had similar subjective roughness as sandpaper #100 and #120, and the above reproduced textures were finer than sandpaper #100. Therefore, we consider that the approach using the acceleration transformed from 3D measurement has good discriminability and stability.
Figure 13B shows the results obtained when using the directly measured acceleration. In contrast to the transformed acceleration, the scores of each reproduced texture were high under rougher sandpaper. For example, the score of reproduced texture VA100 was obviously higher than 0 and felt rougher than the benchmark sandpaper #100. There was no significant change in the score of VA100 among sandpapers #100, #120, and #150. This indicates that using directly measured acceleration can reproduce the different roughness of sandpaper, but the results are shifted to the rough side.
In summary, using acceleration transformed from displacement can reproduce the texture of different sandpaper as well as or better than using directly measured acceleration. When we tried using force cue alone, the results showed that the different sandpaper can be reproduced to some extent. We hypothesize that the reproduction effect may improve if the frictional force cue is combined with both transformed acceleration and directly measured acceleration. This hypothesis was verified in Experiment 2. In addition, whereas Experiment 1 focused on the differences of sandpapers, we focused on the realistic quality of the reproduced texture to compare the reproducibility of various approaches more clearly and specifically in Experiment 2.
5.2 Evaluation of the Reproducibility
Figure 14A shows the correct rates of the five approaches. VD achieved the highest correct rate. The Kruskal–Wallis test with independent samples was used to analyze the obtained data. The significance level was set at 0.05 and the degree of freedom was 4. The adjusted probability of significance for multiple tests by Bonferroni correction showed that significant differences were found in terms of reproduction approaches. The correct rate of VD was significantly better than that of VA, F, and VD + F. VA + F obtained a reproducibility comparable to that of VD, which indicated that the reproducibility of direct acceleration was improved by the assistance of frictional force simulation. While this analysis disregarded the variable of sandpaper roughness and used the average of correct rates for all sandpapers among each participant, Figure 14B shows a radar chart of the correct rates of each of the five approaches when reproducing each sandpaper. When using only VA or F approaches, the overall correct rate of each sandpaper was low and varied widely by roughness, with very poor correct rates for the rougher sandpaper. The reproduction of the texture using the VD approach had a higher correct rate, and the difference between the correct rates for the roughness was smaller, indicating a better balance. This result is consistent with that of Experiment 1: using transformed acceleration can make the differences of each reproduced texture be correctly perceived. When using the VA + F approach, the correct rate for each roughness is similar to that of the VD approach, but the overall correct rate is lower.
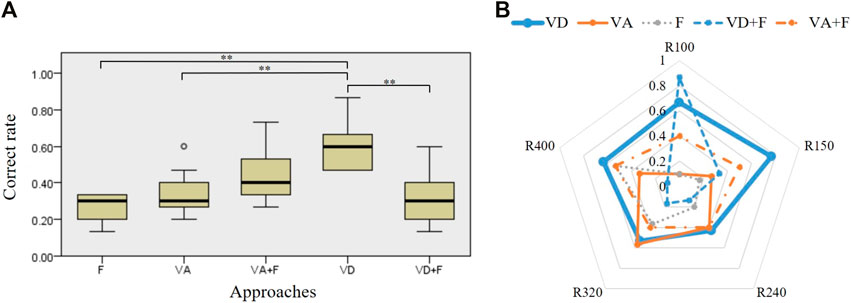
FIGURE 14. Correct rates of five approaches. (A) Average of correct rates for all sandpapers among each participant, **: p < 0.05; and (B) correct rates of each of the five approaches when reproducing each sandpaper.
It is worth noting that when VD + F was used, the force presentation seems to have greatly degraded the reproducibility. Whereas the correct rate for #100 was close to 1, the correct rates for the other roughness values were very low. Table 1 shows the confusion matrix of the responses. The distribution of responses for VD + F tended to be on the rougher side, which means that although the reproduction of #100 for VD + F was not good, the participants could only choose #100 because the reproduced texture was the roughest.
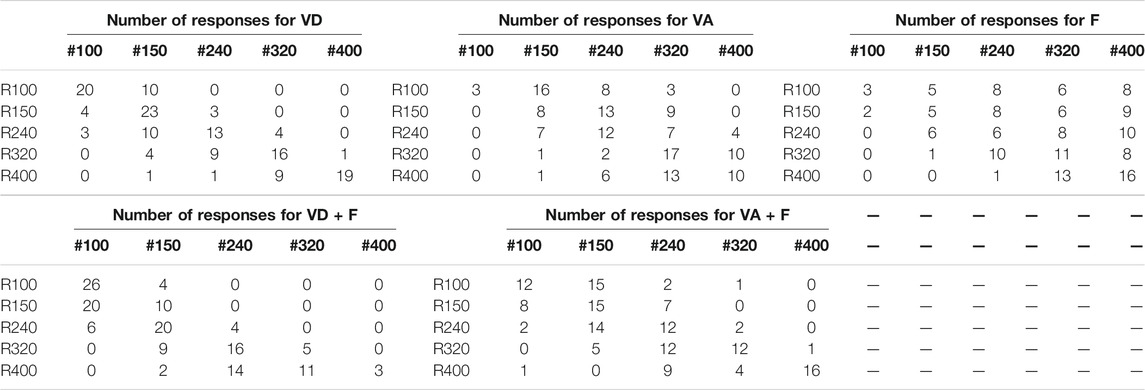
TABLE 1. Confusion matrices.
6 Discussion
6.1 Discussion and Limitations Based on Experimental Results
Throughout Experiments 1 and 2, we found that our proposed algorithm using 3D height measurement provided good reproducibility of roughness, compared with the acceleration- and force-based methods. Although we cannot conclude that the height-based method is better (as there are several limitations as discussed below), the height-based method is easier and more stable to setup, and we believe it is a candidate approach for bare finger texture reproduction.
6.1.1 Discussion of Reproduction Approaches
Experiment 1 revealed that rougher surfaces were more difficult to reproduce when reproducing with directly measured acceleration. Even though we used data measured in a relatively stable sliding condition, it remained difficult to avoid the occasional stick-slip phenomenon that occurred when the sandpaper was rough. When this phenomenon occurred, the measured acceleration profile contained small portions of strong amplitudes, and they were perceived as rougher when used as vibration cues. This may be the reason the performance was worse when reproducing rougher sandpaper. In contrast, when using frictional force, rougher surfaces tended to be perceived as smoother. As the masking tape on the device was very smooth, it was difficult to reproduce the feeling of unevenness on the sandpaper without vibration, and the lack of unevenness made the reproduced texture feel too smooth overall, which may be the reason the texture reproduced by the frictional force was evaluated as smoother.
This may partly explain the results of Experiment 2. In Experiment 2, VA + F yielded relatively better results than VA or F alone. As discussed above, the VA condition tends to make the rough surface rougher, and the F condition tends to make the rough surface smoother. The combination of these conditions might have compensated for the bias in each condition. In contrast, although the VD condition yielded the best scores, the addition of force cue (VD + F) degraded the results because the force cue made the virtual texture rougher.
6.1.2 Limitations of the Experimental Setup
A possible causes of reproducibility differences may be the exploration conditions. In Experiment 1, when using directly measured acceleration (VA) and frictional force (F), participants were required to monitor the real-time downforce values displayed on the screen to standardize the downforce and stay within a certain range. This type of visual information has been shown to affect the perception of macro roughness (Burns et al., 2021). As the texture of the rough sandpaper was close to macro roughness, it is possible that the interference of this visual information was one of the reasons for the worse results when reproducing rough sandpaper. In contrast, participants kept their eyes closed and were allowed to explore the reproduced texture freely in Experiment 2 to confirm the reproduction effect in the natural state. The unstandardized downforce and exploring speed may increase the variance of the response and decrease the correct rate. In addition, the pain generated by the concavity of the sandpaper caused the participants to unconsciously reduce the downforce when exploring, whereas the force was relatively stronger when using the smooth device. This may make the response for the reproduced texture be on the rough side when comparing the physical and reproduced haptic sensations, especially for the comparison of friction.
In measurement and both experiments, our participants were all from research laboratory that lacked female members, which led us to overlook possible changes in the evaluation by female participants. We will include female participants in future studies and investigate the effect of female’s soft skin on the reproducibility.
Our haptic device can provide haptic cues in the horizontal direction, but not in the vertical direction. This design is based on several state-of-the-art surface haptics devices that utilize tangential vibration to present realistic textures (Basdogan et al., 2020). In contrast, our 3D measurement and transformation are based on surface “height” data. Although it is not the scope of this study to determine how the height information is converted to finger normal/tangential vibration, the mechanism should be clarified and modeled in the future.
6.1.3 Limitations of the Proposed Approach
Our newly developed algorithm transforming 3D height information to vibration yielded good reproducibility in terms of surface roughness, but it has certain limitations. In the rendering process, we applied a low-pass filter to the acceleration curve, which required acceleration measurements. In fact, the high-frequency amplitude of VD is still higher and the low-frequency amplitude is lower than that of VA (Figure 2). Even if the same F was added, the discrepancy in the spectra may be the reason VA + F performed better, but VD + F performed worse than VD. If the spectra were a perfect match, VA + F and VD + F may be equally good. Therefore, instead of approximating the spectrum roughly, an ideal approach should be to study the filtering effect of the contact surface to obtain an accurate model, and thus eliminate the need to directly measure acceleration.
We cycled the audio signal during the vibration cue, but this cycling could be expected to be noticeable. Although the experimental results do not appear to be unduly affected, excessive vibration from cycling need to be considered as flaws that could potentially affect the reproduction effect. In our reproduction algorithm, the amplitude of the vibration and the loop cycle of the audio signal correspond to the exploring speed of the finger, but not to the variation of the downforce.
In addition, the frictional force corresponded only to the downforce but not to the velocity variation, which is consistent with a previous study on pen-holding type replay of textures (Culbertson, 2015). This study observed that the vibration generated during exploration was minimally affected by the downforce, while the frictional force was minimally affected by the exploring speed. However, the experiments used a Phantom Omni with a hard probe, and the variation in vibration due to downforce deserves to be investigated in bare finger contact. According to Hertzian contact theory (Hertz, 1882), in the contact between a hard and a soft object, the contact area varies with the conduct load (Fischer-Cripps, 1999), which means that the filtering effect on the contact surface varies, and the resulting vibration feature also changes.
6.1.4 Future Work
In this study, we only used relatively hard sandpaper as the reproduction object. For texture reproduction only, our proposed approach is considered to be applicable to a variety of materials such as cloth and human skin. In the future, we will use soft human skin as the next objective to verify the versatility of the discussed approaches. The skin has a similar softness to the finger, so the Hertzian contact model will be difficult to apply, and a new model for the contact between soft objects is required.
By the way, during the measurement of friction, we determined the dependence of the friction force on the direction of exploration. When exploring a rough surface with finger pad, the overall friction force is stronger and the stick-slip phenomenon is more likely to occur in ulnar direction than radial direction This direction dependence has been explored by several studies (Delhaye et al., 2014; Delhaye et al., 2016), and we will also need to study the mechanism for this phenomenon.
6.2 Conclusion
In this study, we proposed an approach for measuring surface height curves using a 3D microscope and transforming them into acceleration curves to reproduce the haptic sensation of sandpaper with slight differences in roughness when being explored by bare fingers. This approach has the advantage of not being affected by the accuracy of the sensor, skin properties, or dynamic state during acceleration measurement. This approach achieved comparable reproducibility and discriminability when compared with the usual approach that directly measures acceleration. After applying the simultaneous frictional force cueing, the reproducibility of the directly measured acceleration increased, but the transformed acceleration was reproduced with a bias toward roughness. We believe that the former is due to the complementary effect of directly measured acceleration and frictional force, whereas in the latter situation, the force cue made the surface too rough. In the future, we will investigate the variation of the filtering effect on the contact surface when the finger is in contact with the surface of different materials, while reproducing different objects such as human skin. We will also investigate the reasons for the directional dependence of frictional force. These researches result provide a reference for studies that also reproduce haptic sensations on a flat plate using a bare finger, and the technique for haptic rendering are expected to be applied to new controllers for virtual reality contents and haptic reproduction devices that can reproduce high quality haptic sensation.
Data Availability Statement
The raw data supporting the conclusions of this article will be made available by the authors, without undue reservation.
Ethics Statement
The studies involving human participants were reviewed and approved by The ethics committee of the University of Electro-Communications (No. 19037). The patients/participants provided their written informed consent to participate in this study.
Author Contributions
JZ developed the software/hardware setup, implemented the experiments, and analyzed the results. HK provided guidance on various aspects, such as the study design and development of the measurement system. All authors have made substantial direct and intellectual contributions to the article and have approved the submitted version.
Funding
This research was supported by JSPS KAKENHI (Grant Number JP20H05957).
Conflict of Interest
The authors declare that the research was conducted in the absence of any commercial or financial relationships that could be construed as a potential conflict of interest.
Publisher’s Note
All claims expressed in this article are solely those of the authors and do not necessarily represent those of their affiliated organizations, or those of the publisher, the editors and the reviewers. Any product that may be evaluated in this article, or claim that may be made by its manufacturer, is not guaranteed or endorsed by the publisher.
Acknowledgments
We would like to thank all the participants who participated in the study for their time and comments that provided a way to improve our work.
References
Asano, S., Okamoto, S., and Yamada, Y. (2015). Vibrotactile Stimulation to Increase and Decrease Texture Roughness. IEEE Trans. Human Mach. Syst. 45 (3), 393–398. doi:10.1109/THMS.2014.2376519
Basdogan, C., Giraud, F., Levesque, V., and Choi, S. (2020). A Review of Surface Haptics: Enabling Tactile Effects on Touch Surfaces. IEEE Trans. Haptics 13 (3), 450–470. doi:10.1109/TOH.2020.2990712
Bau, O., Poupyrev, I., Israr, A., and Harrison, C. (2010). “TeslaTouch: Electrovibration for Touch Surfaces,” in UIST '10: Proceedings of the 23nd annual ACM Symposium on User interface software and technology, New York, NY, October 3–6, 2010, 283–292. doi:10.1145/1866029.1866074
Biswas, A., Manivannan, M., and Srinivasan, M. A. (2015). Vibrotactile Sensitivity Threshold: Nonlinear Stochastic Mechanotransduction Model of the Pacinian Corpuscle. IEEE Trans. Haptics 8 (1), 102–113. doi:10.1109/TOH.2014.2369422
Burns, D. A., Klatzky, R. L., Peshkin, M. A., and Colgate, J. E. (2021). “Spatial Perception of Textures Depends on Length-Scale,” in IEEE World Haptics Conference (WHC), Canada, July 6–9, 2021, 415–420. doi:10.1109/WHC49131.2021.9517265
Culbertson, H., and Kuchenbecker, K. J. (2017). Importance of Matching Physical Friction, Hardness, and Texture in Creating Realistic Haptic Virtual Surfaces. IEEE Trans. Haptics 10 (1), 63–74. doi:10.1109/TOH.2016.2598751
Culbertson, H., Unwin, J., and Kuchenbecker, K. J. (2014). Modeling and Rendering Realistic Textures from Unconstrained Tool-Surface Interactions. IEEE Trans. Haptics 7 (3), 381–393. doi:10.1109/TOH.2014.2316797
Culbertson, H. M. (2015). Data-Driven Haptic Modeling and Rendering of Realistic Virtual Textured Surfaces. Dissertation. Philadelphia (PA): University of Pennsylvania. Available at: http://repository.upenn.edu/edissertations/1674.
Delhaye, B., Lefèvre, P., and Thonnard, J.-L. (2014). Dynamics of Fingertip Contact during the Onset of Tangential Slip. J. R. Soc. Interf. 11 (100), 20140698. doi:10.1098/rsif.2014.0698
Delhaye, B., Barrea, A., Edin, B. B., Lefèvre, P., and Thonnard, J.-L. (2016). Surface Strain Measurements of Fingertip Skin under Shearing. J. R. Soc. Interf. 13, 20150874. doi:10.1098/rsif.2015.0874
Fischer-Cripps, A. C. (1999). The Hertzian Contact Surface. J. Mater. Sci. 34, 129–137. doi:10.1023/A:1004490230078
Hasegawa, H., Okamoto, S., and Yamada, Y. (2020). Phase Difference between Normal and Shear Forces during Tactile Exploration Represents Textural Features. IEEE Trans. Haptics 13, 11–17. doi:10.1109/TOH.2019.2960021
Hertz, H. (1882). Verhandlungen des Vereins zur Beförderung des Gewerbe Fleisses. Ch. 6, 61. London: Macmillan, 410. Translated and reprinted in English in “Hertz’s Miscellaneous Papers”.
ISO 6344 (2013). Coated Abrasives - Grain Size Analysis - Part 3: Determination of Grain Size Distribution of Microgrits P240 to P2500. Available at: https://www.iso.org/standard/56010.html (Accessed November 18, 2021).
Ito, K., Okamoto, S., Elfekey, H., Kajimto, H., and Yamada, Y. (2017). “A Texture Display Using Vibrotactile and Electrostatic Friction Stimuli Surpasses One Based on Either Type of Stimulus,” in 2017 IEEE International Conference on Systems, Man, and Cybernetics (SMC), Banff, Canada, October 5–8, 2017, 2343–2348. doi:10.1109/SMC.2017.8122972
Jeon, S., Metzger, J.-C., Seungmoon Choi, S., and Harders, M. (2011). “Extensions to Haptic Augmented Reality: Modulating Friction and Weight,” in IEEE World Haptics Conference, Istanbul, Turkey, June 21–24, 2011, 227–232. doi:10.1109/WHC.2011.5945490
Kuchenbecker, K. J., Romano, J., and McMahan, W. (2011). “Haptography: Capturing and Recreating the Rich Feel of Real Surfaces,” in Robotics Research. Editors C. Pradalier, R. Siegwart, and G. Hirzinger (Berlin-Heidelberg: Springer), 70, 245–260. Springer Tracts in Advanced Robotics. doi:10.1007/978-3-642-19457-3_15
Lee, J., Sinclair, M., Gonzalez-Franco, M., Ofek, E., and Holz, C. (2019). “TORC: A Virtual Reality Controller for In-Hand High-Dexterity Finger Interaction,” in Proceedings of the 2019 CHI Conference on Human Factors in Computing Systems, Glasgow, UK, May 4–9, 2019. doi:10.1145/3290605.3300301
Maeda, T., Peiris, R., Masashi, N., Tanaka, Y., and Minamizawa, K. (2016). “HapticAid: Wearable Haptic Augmentation System for Enhanced, Enchanted and Empathised Haptic Experiences,” in SA'16: SIGGRAPH ASIA 2016 Emerging Technologies, Macao, China, December 5–8, 2016, 1–2. doi:10.1145/2988240.2988253
Martel, E., and Muldner, K. (2017). Controlling VR Games: Control Schemes and the Player Experience. Entertain. Comput. 21, 19–31. doi:10.1016/j.entcom.2017.04.004
Poupyrev, I., and Maruyama, S. (2003). “Tactile Interfaces for Small Touch Screens,” in UIST '03: Proceedings of the 16th Annual ACM Symposium on User Interface Software and Technology, Vancouver, Canada, November 2–5, 2003, 217–220. doi:10.1145/964696.964721
Preechayasomboon, P., Israr, A., and Samad, M. (2020). “Chasm: A Screw Based Expressive Compact Haptic Actuator,” in CHI '20: Proceedings of the 2020 CHI Conference on Human Factors in Computing Systems, Honolulu, HI, April 25–30, 2020, 1–13. doi:10.1145/3313831.3376512
Strese, M., and Steinbach, E. (2018). “Toward High-Fidelity Haptic Interaction with Virtual Materials: A Robotic Material Scanning, Modelling, and Display System,” in IEEE Haptics Symposium, San Francisco, CA, March 25–28, 2018 (IEEE Press), 247–254. doi:10.1109/HAPTICS.2018.8357184
Takasaki, M., Kotani, H., Mizuno, T., and Nara, T. (2005). “Transparent Surface Acoustic Wave Tactile Display,” in IEEE/RSJ International Conference on Intelligent Robots and Systems, Edmonton, Canada, August 2–6, 2005, 3354–3359. doi:10.1109/IROS.2005.1545129
Ujitoko, Y., Sakurai, S., and Hirota, K. (2020). “Vibrator Transparency: Re-using Vibrotactile Signal Assets for Different Black Box Vibrators without Re-designing,” in IEEE Haptics Symposium (HAPTICS), Crystal City, VA, March 28–31, 2020, 882–889. doi:10.1109/HAPTICS45997.2020.ras.HAP20.80.00957e94
Keywords: bare finger interaction, haptic device, roughness, surface measurement, texture rendering
Citation: Zhang J and Kajimoto H (2022) A Robust Approach for Reproducing the Haptic Sensation of Sandpaper With Different Roughness During Bare Fingertip Interaction. Front. Virtual Real. 3:829946. doi: 10.3389/frvir.2022.829946
Received: 06 December 2021; Accepted: 10 February 2022;
Published: 02 March 2022.
Edited by:
Daniel Leithinger, University of Colorado Boulder, United StatesReviewed by:
Ken Nakagaki, Massachusetts Institute of Technology, United StatesDon Samitha Elvitigala, University of New South Wales, Australia
Copyright © 2022 Zhang and Kajimoto. This is an open-access article distributed under the terms of the Creative Commons Attribution License (CC BY). The use, distribution or reproduction in other forums is permitted, provided the original author(s) and the copyright owner(s) are credited and that the original publication in this journal is cited, in accordance with accepted academic practice. No use, distribution or reproduction is permitted which does not comply with these terms.
*Correspondence: Jianyao Zhang, emhhbmdAa2FqaS1sYWIuanA=