 Kassandra Bauerfeind
 Julia Drüke1
 Lennart Bendewald
 Martin Baumann
- 1Volkswagen AG, Wolfsburg, Germany
- 2University of Ulm, Ulm, Germany
Drivers can benefit from Augmented Reality (AR) information especially in ambiguous navigation situations compared to conventional Head-up displays (HUD). AR information is correctly superimposed on the relevant objects in the environment and therefore directly related to the driving situation. Hence, it is assumed, that drivers no longer have to switch glances between the AR information and the environment (Kim & Dey, 2009). It has to be investigated whether switching glances between the presented navigation information and the environment can be reduced with AR information compared to HUD information. Furthermore, the question arises whether AR information might capture drivers’ attention and therefore distract from the traffic situation compared to a HUD as AR information is presented on the driver’s primary visual axis. The aim of the driving simulator study was to examine glance behaviour in terms of attention allocation while participants navigated in an ambiguous left turn situation with an oncoming car in an urban area (N = 58). Hence, drivers were faced with the decision to turn in front of it or let it pass. A conventional HUD and an AR display presented the navigation information to the driver. The drives differed in traffic complexity (low vs. high) to provide indications whether drivers adapt glance behaviour to altered environmental conditions. Besides the navigation task, drivers performed a non-driving-related task to raise drivers’ mental load while navigating. Results showed that with the AR display participants payed more attention to an oncoming car in the ambiguous left turn situation than with the HUD, which indicates that AR information was not distracting. Furthermore, participants switched glances significantly less between the AR navigation information and the environment, which indicates that with the AR display the driver did not have to map the virtual information onto the real driving situation. Independently of the display type 88% of the participants let the oncoming car pass the first time in this situation. Moreover, subjective data showed that drivers benefitted from AR information. The results of this study contribute to the investigation and development of AR user interfaces.
1 Introduction
The new display technology Augmented Reality (AR), which is an advanced Head-up display, found its way into the vehicle. AR displays have proven to be beneficial for drivers as AR information is readily accessible and presented comprehensively (Bauerfeind et al., 2019; Bauerfeind et al., 2021; Bengler et al., 2015; Gabbard et al., 2014; Israel, 2012; Kim & Dey, 2009; Kim et al., 2013; Medenica et al., 2011; Pfannmüller, 2017; Pfannmüller et al., 2015; Rusch et al., 2013; Tönnis, 2008). AR information is superimposed on the specific object in the environment. Therefore, real and virtual objects are closer, which can reduce divided attention (Gabbard et al., 2014; Kim & Dey, 2009). Furthermore, drivers do not have to map the AR information onto the real driving situation like with a HUD (Pfannmüller, 2017). As a result, AR navigation information is less demanding than a HUD (Bauerfeind et al., 2021) and thus often used for navigation. Especially more difficult navigation scenarios like ambiguous situations, e.g., intersection scenarios with many possible turns, which are very close to each other, are easier to handle with AR information than with a HUD (Bauerfeind et al., 2019; Bauerfeind et al., 2021).
However, AR information as well as HUD information are visual and need to be processed by the driver. HUD information is presented at the bottom of the driver’s primary visual field, giving the impressing as if it is hovering above the hood. HUD information has proved to be beneficial compared to head-down displays (Gish & Staplin, 1995; Grant et al., 1995; Horrey et al., 2003; Liu & Wen, 2004; Schneid, 2009; Milicic, 2010; Sandbrink, 2019), e.g., in terms of reducing glances away from the street (Kiefer, 1991; Knoll, 2015), which might cause divided attention and therefore distract from the driving task and increase the risk of an accident (Kim et al., 2013). In contrast, AR information is presented on the driver’s primary visual axis, as AR information is superimposed over the real driving situation. Consequently, the information is more salient than HUD information. Therefore, altered glance behaviour is discussed (Kim & Gabbard, 2019). Yet, it remains unclear whether AR information might capture drivers’ attention and therefore distract from the traffic situation compared to a HUD. Independent of the presented AR information the driver is supposed to observe relevant road users and show situation appropriate driving behaviour. There are studies addressing the question how attention and consequent behaviour change when driving with AR information. In the context of warning systems AR information proved to guide drivers’ attention directly to traffic relevant events (Rusch et al., 2013) and reduced reaction times (Tönnis, 2008; Kim et al., 2013). Eyraud et al. (2015) examined effects of AR information on the allocation of attention. Eyraud et al. (2015) found out that when the drivers have to take an action, AR information reduced the allocation of visual attention when AR cues were general, but improved it when AR cues were manoeuvre specific. Furthermore, AR information affected the allocation of visual attention during the phase when the driver has to make a decision (Eyraud et al., 2015; Abdi & Meddeb, 2017). In summary, the literature shows first findings concerning attention allocation when driving with AR information in the field of warning systems and driver assistance systems. Thus, glance behaviour in terms of attention allocation should be examined for navigating with AR information.
Another research focus in the context of glance behaviour is reduced switching glances between the presented AR information and the environment compared to information in a HUD. As the AR information is superimposed on the real traffic situation, is assumed, that drivers no longer have to switch glances between the AR information and the environment (Kim & Dey, 2009). Therefore, glance behaviour is facilitated and divided attention is reduced when navigating with AR information (Gabbard et al., 2014; Kim & Dey, 2009). It has to be examined whether switching glances between the presented navigation information and the environment can be reduced with AR information compared to HUD information.
The aim of the driving simulator study presented here was to examine differences in glance behaviour in terms of attention allocation between AR information and a HUD. It has to be investigated whether AR information might capture drivers’ attention and distract from the driving task. Also, it has to be examined whether switching glances between the presented AR information and the environment can be facilitated compared to information in a HUD. The HUD is seen as the base line in this study as it has proved to support the driver in terms of improved glance behaviour compared to head-down displays and it is state-of-the-art in current vehicle models at the time of this user study.
The participants’ task was to find the correct route with navigation information in the AR display vs. HUD in an urban area with ambiguous navigation situations (N = 58). Additionally to the navigation task, drivers had to perform an auditory non-driving-related task (NDRT) to raise drivers’ mental load. Glance and driving behaviour were analysed in a more complex situation, an ambiguous left turn situation with an oncoming car at the end of each drive. In this situation drivers were faced with the decision to turn in front of it or let it pass. It was examined whether drivers pay attention to this car with the respective display type. Besides, it was investigated whether glance behaviour differed between the AR display and the HUD concerning switching glances between the navigation information and the target intersection in regard of mapping the virtual information onto the real driving situation. The drives differed in traffic complexity (low vs. high) to provide indications whether drivers adapt glance behaviour to altered environmental conditions, as paying more attention on other road users in a high traffic complexity. In this study glance data, driving data and subjective ratings concerning the display types were analysed.
2 Methods
2.1 Display types for the navigation task
The two display types (HUD and AR display) used for the navigation task are shown in Figure 1. Here, the HUD had a perceived projection distance of about 1–2 m. The drivers saw the navigation information 120 m before the target intersection by way of a straight blue arrow with distance information (Figure 1A). In case of an ambiguous navigation situation with many possible turns, the turning direction was shown to the drivers 80 m before the target intersection, when there were fewer than three intersections to come (Figure 1B). The bar graph next to the turning arrow presented the remaining distance and was hence reducing while driving closer to the target intersection (Figure 1B+C).
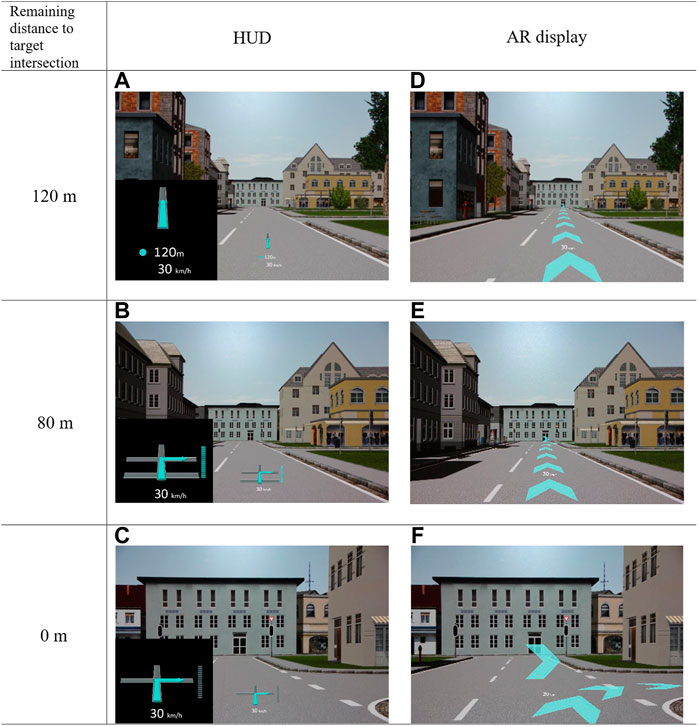
FIGURE 1. HUD (A–C) and AR display (D–F) showing navigation information in respect of the remaining distance to the target intersection in an ambiguous navigation situation. Both display types also presented the speed. The black boxes in the left corner of the pictures (A), (B) and (C) were not presented to the driver. They just help the reader to identify the HUD information details.
With the AR display (Figures 1D–F), the drivers saw the navigation information also 120 m before the target intersection in form of a turquoise fishbone arrow. For the driver it seemed to be placed onto the environment. Additionally, a floating arrow was pointing into the target intersection (Figure 1F). Hence, the 3D AR elements were superimposed on the driver’s lane and at the point of turning. Both display types presented the speed with a projection distance of approximately 1–2 m.
2.2 Static driving simulator
To conduct the study the static driving simulator with a mock-up from Group Innovation of Volkswagen Aktiengesellschaft was used (Figure 2, left). This mock-up represented a car with an automatic gear shift. Five projection screens were placed 3.5 m around the mock-up (Figure 2, right). Thus, a visual field of 180° was realised. The projector had a resolution of 1920 × 1,200 pixels. To implement the simulation world the software Virtual Test Drive (Hexagon, 2021) was used. With the software Unity the two display types (HUD and AR display) were realised. To relate to optical see through, a second projector was used to project the AR display and the HUD in the simulated world. To examine glance behaviour a binocular, head-mounted eye-tracker, the Dikablis Glasses 2 from Ergoneers (Kansteiner, 2014) was used (Figure 2, left).
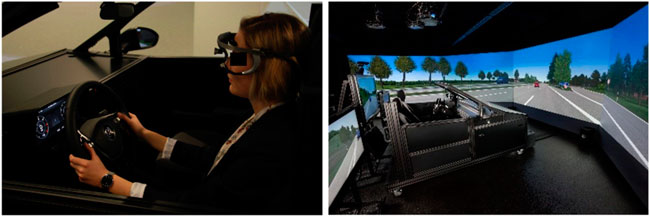
FIGURE 2. Mock-up from Group Innovation of Volkswagen AG (left) in front of five projection screens (right, 2020, with permission from © Volkswagen AG, all rights reserved). The participants wore a binocular, head mounted eye-tracker, the Dikablis Glasses 2 from Ergoneers (Kansteiner, 2014) to analyse glance behaviour.
2.3 Driving simulation, driving task, and ambiguous left turn situation
In this study participants’ task was to find the correct route with the help of the navigation display (HUD vs. AR display) in an urban area with 17 intersections. Seven of them were ambiguous navigation situations because the turning scenarios had many possible turns, which were very close to each other. In pre-testing the distance of 40 m between two possible turns was found as an ambiguous navigation situation. For each display type there were two identical driving scenarios, which just differed in traffic complexity (low vs. high). The traffic complexity referred to the amount of driving and parked vehicles in the scenario. The result of pre-testing was to consider 16 vehicles per kilometer as the low traffic complexity and 23 vehicles per kilometer as the high traffic complexity. There were high vehicles (trucks) and low vehicles (cars).
The last intersection in each drive was a more complex situation, which was analysed: The moment the participants reached the intersection of the last ambiguous left turn and were about to take the turn, an oncoming car was programmed to be 30 m apart. Thus, the participants had to decide to take the turn in front of it or let it pass and therefore wait for a short moment. In pre-testing the distance of 30 m was found as suitable for this situation. The speed limit was 50 km/h according to German traffic regulations. Each drive took about 12 min to provide a suitable driving experience with the respective display type.
2.4 Cognitive non-driving-related task
While driving, participants solved an auditory, cognitive non-driving-related task (NDRT). It was used to raise the drivers’ mental load while navigating. For the NDRT, a speaker in front of the simulator mock-up played random numbers from one to nine. The participants’ task was to evaluate every number. When hearing an even number participants should press a button on the right side of the steering wheel. Participants had to press a button on the left side of the steering wheel when hearing an odd number. The interval of the random numbers was 3s. The NDRT was not that difficult that it fully interfered with the primary task. The participants were instructed to prioritise the navigation task over the NDRT.
2.5 Experimental design
The ethical standards of the American Psychological Association were strictly followed for the driving simulator study. It is based on a within-subjects design with the independent variables display type (AR display or HUD) and traffic complexity (low vs. high). The conditions were counterbalanced and randomised. Half of the participants started with the AR display and the other half started with the HUD (Figure 3). Half of the participants who started with the AR display started with the low traffic complexity and the other half started with the high traffic complexity (Figure 3). The same was done with the participants starting with the HUD. At the end of each drive the participants were facing a more complex situation, an ambiguous left turn situation with an oncoming car, which was analysed. Figure 4 shows the dependent variables for the ambiguous left turn situation with the oncoming car.
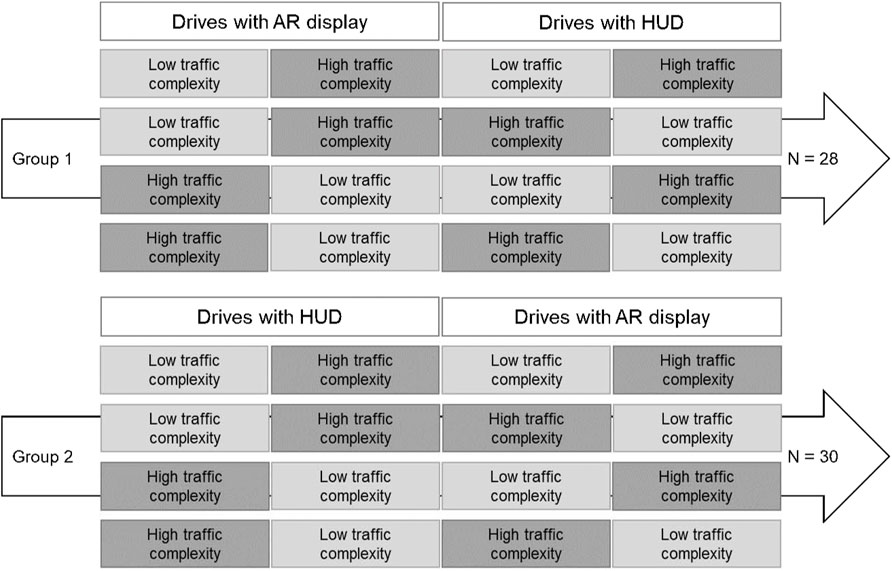
FIGURE 3. Experimental setup for the driving simulator study. Each participant performed four drives. Each drive took 12 min. At the end of each drive the participants were faced with a more complex situation: an ambiguous left turn situation with an oncoming car, the moment when they were about to take the turn.
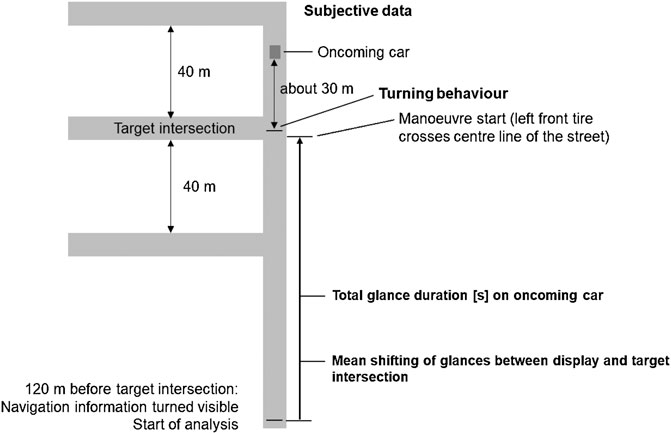
FIGURE 4. Bird’s-eye view of the last ambiguous left turn situation with the oncoming car at the end of each drive. Dependent variables are marked by bold face.
The total glance duration on the oncoming car in the ambiguous left turn situation was a measure for the degree of attention on the oncoming car (Figure 5). Another dependent variable was the mean switching of glances between the navigation information in the display and the target intersection to measure the need to map the virtual information onto the real driving situation (Figure 6). The starting point for the two analysis was 120 m prior to the respective ambiguous navigation situations, when the navigation information turned visible. The endpoint for the analysis was the start of the manoeuvre, which was defined as the left front tire crosses the centre line of the street (Figure 4). Thus, all glances on the oncoming car as well all switching glances up to the manoeuvre start were considered in the analysis.
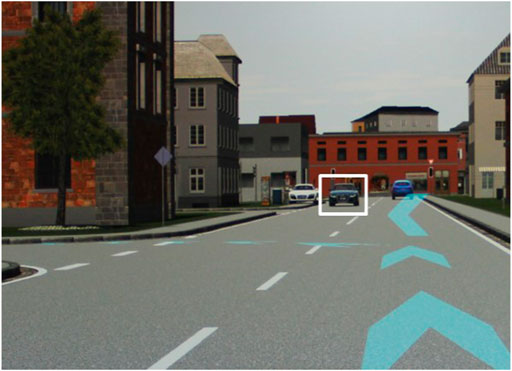
FIGURE 5. Sequence of the left turn situation with the oncoming car at the end of each drive. Glances into the marked area count as glances on the oncoming car.
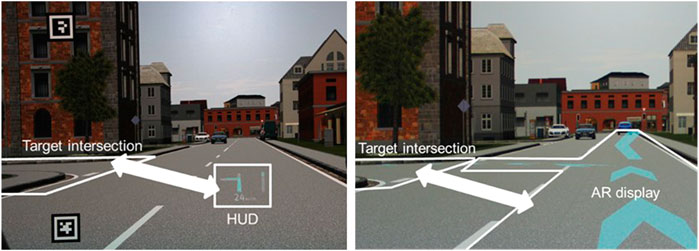
FIGURE 6. Marked areas for the analysis of mean switching of glances between the target intersection and the navigation information in the HUD (left) and the AR display (right). The area of the AR display is bigger than the HUD, because the AR information covered most parts of the driver’s lane, which makes it difficult to distinguish between the driving lane and the AR information.
Furthermore, the driving behaviour in the ambiguous left turn situation with the oncoming car was analysed. Respecting the display type, it was counted whether participants took the left turn in front of the oncoming car or let it pass when they were confronted with this situation the first time. To prevent learning effects just the first time out of four times driving this left turn situation was analysed for each participant.
Moreover, subjective ratings by the drivers were analysed (Table 1). After driving in the low and high traffic complexity with the respective display participants also rated the perceived traffic complexity for a manipulation check. Therefore, participants were asked whether the traffic complexity differed in intensity between the last two drives and if yes, which drive had the higher traffic complexity (Table 1). All closed questions were answered with a 15-point rating scale (Heller, 1982) (Figure 7).
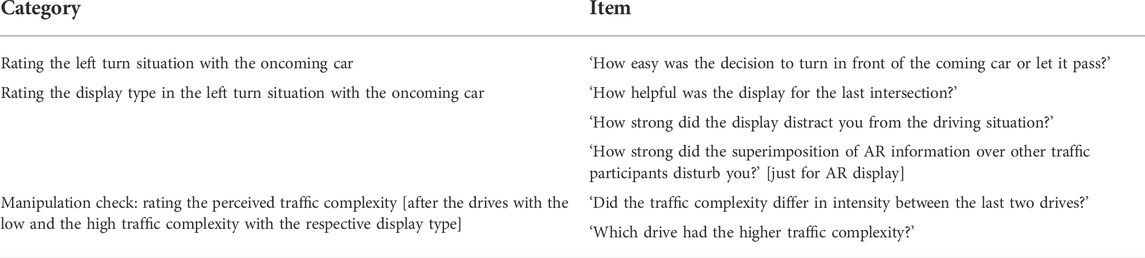
TABLE 1. Items from the evaluation questionnaire separated in categories and respective items.
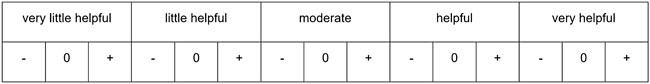
FIGURE 7. 15-point rating scale according to Heller (1982) with regard to the question: ‘How helpful was the display for the last intersection?’ This scale was used for all closed questions.
2.6 Participants
In the driving simulator study a total of 76 drivers participated. However, due to simulator sickness data of 58 participants (n = 12 female) could be analysed. Still, all conditions were tested equally often. The participants averaged 33.0 years old (SD = 10.0 years). All participants were recruited from the test driver pool of Volkswagen Group Innovation. The year before the participants drove on average 20,121.0 km (SD = 13,035.3 km). 51.7% of the participants declared that they had experience with a HUD, however the majority of those participants said that they rarely use it. 21% of the participants used vision correction by glasses or contact lenses. The participants started with a training to get to know the display types and to learn to handle the static simulator. At the end of the study the participants received a present.
2.7 Procedure
Participants were welcomed and asked to complete the socio-demographic questions. Afterwards, they were tested for colour vision performance. The eye-tracker was adjusted and calibrated on the participants’ head. The investigator explained the navigation task (primary task) and the NDRT to the participants. The participants were instructed concerning the buttons on the steering wheel for answering the NDRT. First, they trained the navigation task and the NDRT without driving. Afterwards, both tasks were trained simultaneously until participants performed without errors. After the training, the study started counterbalanced with the display type (HUD, AR display) and the traffic complexity (low, high) in the urban area. If the participants did a navigation error, the investigator informed about the error and relocated the participant on the navigation route. After each drive the participants used the evaluation questionnaire to rate the two display types. The participants received a present for their participation. In total, the study took 120 min for each participant.
3 Results
3.1 Data preparation
Data of the last ambiguous left turn situation with an oncoming car at the end of each drive were analysed (N = 58). For the glance behaviour analysis it was distinguished whether the participant took the turn in front of the oncoming car or let it pass. Glance behaviour is not comparable between these two cases. The data for letting the oncoming car pass was analysed (AR display: 85 drives, HUD: 91 drives), as the sample sizes for turning in front of it were too small for a statistical analysis (AR display: n = 13 [16 drives], HUD: n = 10 [11 drives]). The glance behaviour was manually annotated with the software ELAN, as it was a dynamic driving situation.
For the analysis of the total glance duration on the oncoming car just complete data sets (participants who let the oncoming car pass in all conditions and no technical issues in neither of the drives) could be analysed. Resulting data sets of 31 participants could be analysed. Still, it was decided to run the analysis. The total glance duration on the oncoming car in seconds was examined as a measure of the degree of attention on it. With repeated measures Analysis of Variance (rmANOVA) effects of display type (AR display vs. HUD) and traffic complexity (low vs. high) were examined.
Because of technical issues six participants were excluded from the analysis of mean switching of glances (N = 52). For this analysis, glances were counted between the navigation information in the display and the target intersection. A glance switch was defined as a fixation on area A, followed by a fixation on area B and vise versa. Resulting a generalised linear model with varying intercept and varying slope was analysed. Visual inspection of the raw data led to assume a Poisson distribution for the model. The dependent variable was mean switching of glances. The independent variables were display type (AR display, HUD) and traffic complexity (low, high). Participants were analysed as a random intercept.
With regard to the driving data, nine participants had to be excluded from the analysis because of technical issues (N = 49). Participants’ first time out of four times driving the last ambiguous left turn situation was analysed to prevent learning effects. It was counted whether the participants took the turn in front of the oncoming car or let it pass. This data could just be analysed descriptively as some of the categories had less than five cases.
Subjective data were analysed using rmANOVAs to examine effects of display type (AR display vs. HUD), traffic complexity (low vs. high) and order of the display type as a between subject factor (N = 58).
3.2 Total glance duration on the oncoming car in the ambiguous left turn situation
Regarding the total glance duration at the oncoming car there was a significant difference between the two display types (F (1, 30) = 8.19, p < 0.05,
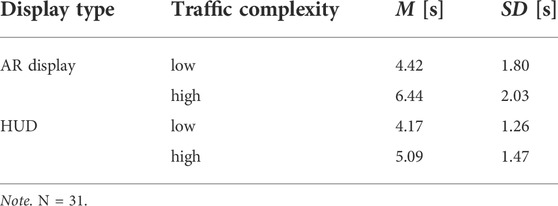
TABLE 2. Mean and standard deviation for total glance duration on the oncoming car [s] in the ambiguous left turn situation at the end of each drive, subdivided into display types and traffic complexities.
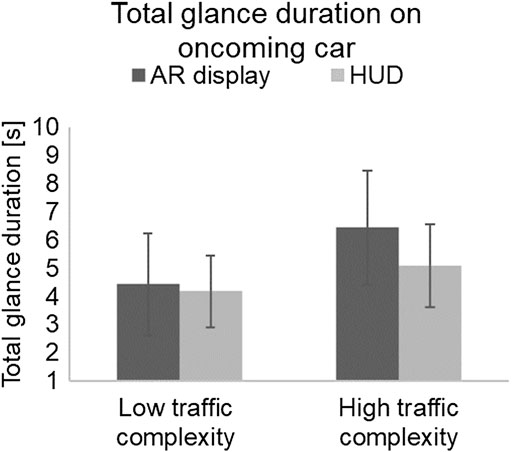
FIGURE 8. Means and standard deviations of total glance duration in s at the oncoming car in the ambiguous left turn situation at the end of each drive.
3.3 Turning behaviour in the ambiguous left turn situation with the oncoming car
Independent of the display type, 88% of the participants let the oncoming car pass before turning in their first time in this situation (Table 3). Thus, the display type did not affect the turning behaviour.
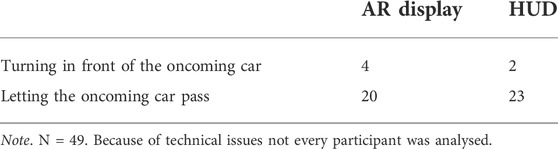
TABLE 3. Frequencies of turning in front of the oncoming car or letting it pass the first time in the ambiguous left turn situation at the end of the drive, subdivided for the display types.
3.4 Mean switching of glances
Table 4 shows the mean switching of glances between the navigation information in the display and the target intersection. While approaching the ambiguous navigation situation in the high traffic complexity participants switched their glances on average less than half as much between the target intersection and the AR display (intercept = 0.82) than between the target intersection and the HUD (0.82 + 0.94) (z = 7.54, p < .001 Table 4). While navigating with AR, the traffic complexity did not show an effect on the mean switching of glances (z = 0.10, p > 0.10).
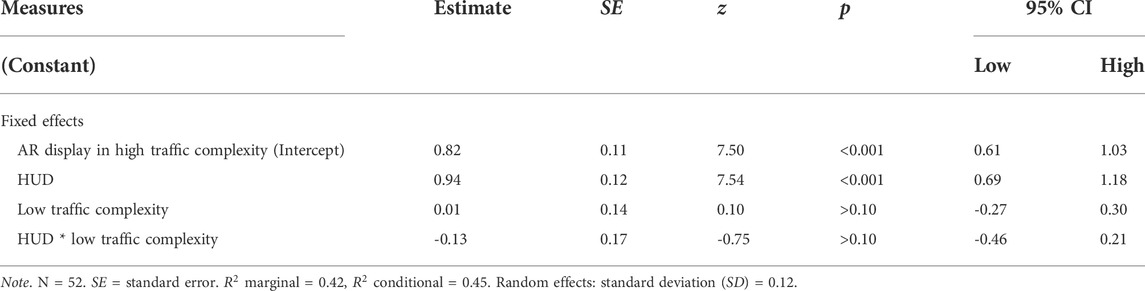
TABLE 4. Generalized linear model of mean switching of glances between the target intersection and the display type in the ambiguous left turn situation for both display types and both traffic complexities.
3.5 Subjective evaluation
After each drive participants rated the respective display. The participants stated that the AR display was more “helpful” for the ambiguous left turn situation with the oncoming car than the HUD (Table 5; Figure 9A). The traffic complexity did not show an effect on the rating. Furthermore, they were less “distracted” by the AR display (Table 5; Figure 9B). The traffic complexity did not have an effect on the rating. Participants stated that the superimposition of AR information over other traffic participants was “little disturbing”, independently of the traffic complexity (Table 5; Figure 9C). They rated the decision to turn in front the oncoming car or let it pass as “easy” with both display types (Table 5; Figure 9D). However, they stated it was easier in the low than in the high traffic complexity. Between subject factor effects (order of the display type) and interaction effects between the display type and the traffic complexity were not significant.
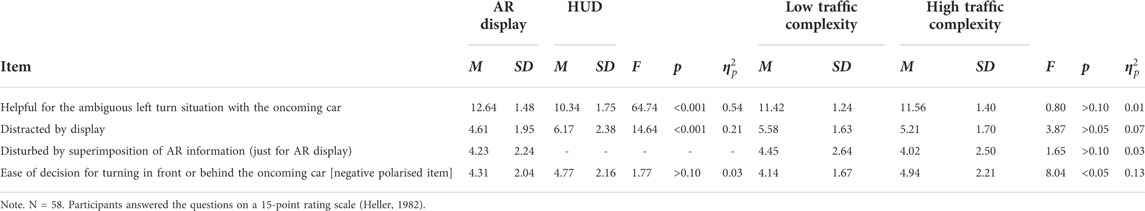
TABLE 5. Results of the subjective evaluation regarding the respective display type in the ambiguous left turn situations with the oncoming car at the end of each drive.
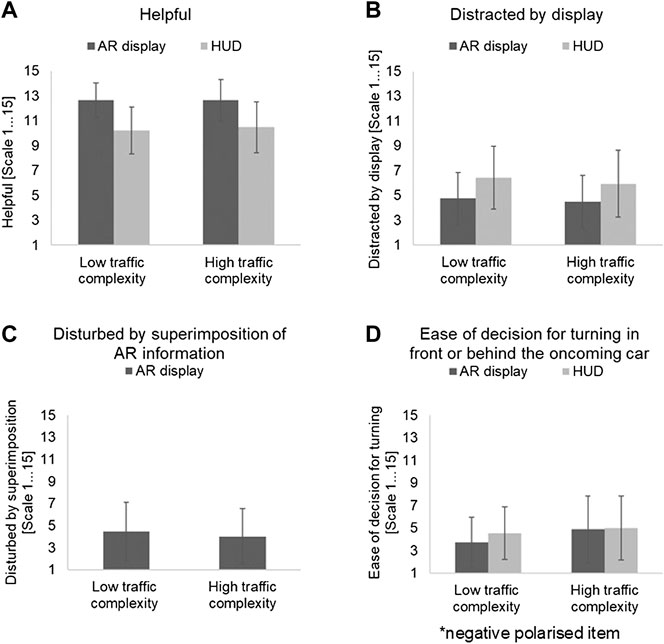
FIGURE 9. Means and standard deviations of subjective evaluation (A–D) of the display types in the left turn situation with the oncoming car (N = 58) (1: low consent, 15: high consent on the specific item, *negative polarised item: 1: high consent, 15: low consent on the specific item).
For checking the manipulation of the traffic complexity participants were asked whether the traffic complexity differed in intensity between the last two drives (low and high traffic complexity). Solely half of the participants affirmed that there was a difference (after driving the AR display: 57%, after driving the HUD: 52%). A little less than half of the participants who detected the difference could match the low and the high traffic complexity correctly (after driving the AR display: 48%, after driving the HUD: 45%).
4 Discussion
The aim of the driving simulator study presented here was to examine differences in glance behaviour in terms of attention allocation between AR information and a HUD. To raise the drivers’ mental load while navigating in a simulated environment, the participants solved an auditory, cognitive NDRT. In this study the NDRT proved to be appropriate for this purpose. Results showed that the drivers payed attention to an oncoming car in an ambiguous left turn situation with both display types. However, they looked more on it with the AR display. Independently of the display type 88% of the participants let the oncoming car pass the first time in this situation. However, glance data showed that with the AR display the driver did not have to map the virtual information onto the real driving situation. Moreover, this study showed that drivers benefitted from AR information regarding the subjective experience.
In the ambiguous left turn situation the drivers had to closely observe the oncoming car to decide how to act in this turning situation. Results showed that participants payed attention to the oncoming car with the AR display and the HUD. However, they looked more on it with the AR display. This result indicates that with the AR display drivers had resources available to sufficiently observed the oncoming car in the left turn situation. Also, this result indicates that the AR information was not distracting and did not capture drivers’ attention.
Moreover, independently of the display type 88% of the participants decided to let the oncoming car pass the first time in the last ambiguous left turn situation. That proves that the oncoming car was observed appropriately with both display types. Participants rated the decision to turn in front of the oncoming car or let it pass as „easy“ with both display types.
Furthermore, data showed that participants switched their glances significantly less between the target intersection and the AR display than with the HUD while approaching the ambiguous navigation situation. This result is in line with Kim & Dey (2009) stating, that the driver no longer has to switch between the AR information and the real driving situation. That indicates that with the AR display participants do not have to map the AR information on the real driving situation like with a HUD, which is a line with the assertion from Kim & Dey (2009) and Pfannmüller (2017). This results from the superimposition of AR information on the specific objects in the real driving situation. Thus, real and virtual objects are closer. The results of this study show that with the AR display the drivers did not have to spend their attention on the mental mapping and could therefore pay attention on the oncoming car in the last ambiguous left turn situation. Subjective data support this result. Participants rated the AR display as more helpful for the left turn situation with the oncoming car than the HUD. Furthermore, they stated they were less distracted by the AR display than by the HUD. Moreover, participants also rated the superimposition of AR information over other traffic participants as “little disturbing” independently of the traffic complexity.
The traffic complexity had an effect in glance behaviour as participants looked more on the oncoming car in the high than in the low traffic complexity. Especially in the high traffic complexity participants’ total glance duration at the oncoming car was higher with the AR display than with the HUD. Nevertheless, half of the participants did not observe a difference between the two traffic complexities. The traffic complexity might have affected the navigation task too little to be noticeable. Furthermore it is assumed that the traffic complexity is solely important in specific traffic situations, e.g., traffic jams or recognising the proper gap to merge on a busy road. These situations were presented too rarely and therefore the traffic complexity was not noticed.
Concerning the analysis of the mean switching of glances, it has to be discussed that the analysis area for the AR display was bigger than for the HUD. AR information covered most parts of the driver’s lane, which is why it is difficult to distinguish between glances on the street and on the AR display. Still, the mean amount of switching glances between the target intersection and the AR display was less than with the HUD.
Regarding the technical implementation of the AR display it has to be noted that in this simulator study the projection screens were placed 3.5 m around the mock-up. Therefore the AR information was also 3.5 m apart from the driver’s eye. To relate to optical see through, a second projector was used to project the AR display in the simulated world. In real cars AR information is projected with a distance of about 10 m. Nevertheless in this study the AR information was coherent with the simulated environment, which was perceived as a three-dimensional world because of monocular depth cues used in simulated environments.
Further research should evaluate these findings in a real driving study to examine whether current technical limitations of AR displays, e.g., sensor inaccuracies or the resonation of the presented AR information caused by vehicle movement might cause divergent results.
At last, this study did not focus on the graphical visualisation of the presented AR information, which is why generalised assertions regarding the visualisation can not be derived. Therefore, further research should focus on the impact of the chosen user interface design on drivers’ acceptance as well as glance and driving behaviour. Furthermore, potential disadvantages of superimposed visualisations should be carefully examined, e.g., the risk of visually blocking other traffic participants or relevant objects.
5 Conclusion
This research study was focused on examining differences in glance behaviour while navigating with an AR display or a HUD. Results showed that the drivers payed attention to an oncoming car in an ambiguous left turn situation with both display types. However, they looked more on it with the AR display. Hence, the data of this study indicates that the AR information was not distracting and did not capture drivers’ attention. Besides, reduced switching glances between the AR navigation information and the environment indicated that with the AR display drivers did not have to map the virtual information onto the real driving situation. Moreover, this study showed that drivers benefitted from AR information regarding the subjective experience. The traffic complexity affected the navigation task too little, therefore half of the participants did not observe a difference between the two traffic complexities.
Further research should evaluate these findings in a real driving environment. It has to be tested whether current technical limitations of AR displays, e.g., the resonation of the presented AR information caused by vehicle movement or sensor inaccuracies cause different results. The results of this study contribute to the investigation and development of AR user interfaces. In this study AR information has proven to be beneficial for navigating, which can result in a pleasant driving experience.
Data availability statement
The datasets presented in this article are not readily available because Volkswagen AG restricts that only the corresponding author of the study will have access to the stored data. Requests to access the datasets should be directed to to the corresponding author and Volkswagen AG.
Ethics statement
The APA ethical standards were strictly followed for the driving simulator study. The patients/participants provided their written informed consent to participate in this study.
Author contributions
KB, JD, LB and MB contributed to the conception/design of the study. The study was conducted by KB. KB performed the statistical analysis in discussion with JD and MB. KB wrote the manuscript. JD, LB and MB gave feedback on the manuscript.
Acknowledgments
We express our sincere thanks to Michael Wittkämper for implementing the AR display in the simulated world, to Doreen Schwarze for her support in data collection and preparation, to Fabian Fischer and Isabelle Wenck for their support in data preparation.
Conflict of interest
Authors KB, JD and LB are employed by Volkswagen AG.
The remaining author declares that the research was conducted in the absence of any commercial or financial relationships that could be construed as a potential conflict of interest.
Publisher’s note
All claims expressed in this article are solely those of the authors and do not necessarily represent those of their affiliated organizations, or those of the publisher, the editors and the reviewers. Any product that may be evaluated in this article, or claim that may be made by its manufacturer, is not guaranteed or endorsed by the publisher.
Author disclaimer
The results, opinions and conclusions expressed in this publication are not necessarily those of Volkswagen Aktiengesellschaft.
References
Abdi, L., and Meddeb, A. (2017). In-vehicle augmented reality system to provide driving safety information. J. Vis. (Tokyo). 21 (1), 163–184. doi:10.1007/s12650-017-0442-6
Bauerfeind, K., Drüke, J., Bendewald, L., and Baumann, M. (2019). “When does the driver benefit from AR information in a navigation task compared to a head-up display? Results of a driving simulator study,” in Proceedings of the Human Factors and Ergonomics Society Europe Chapter 2018 Annual Conference, Berlin, Germany, October 2018. Editors D. de Waard, K. Brookhuis, D. Coelho, S. Fairclough, D. Manzey, A. Naumannet al. 219–230. Download from http://hfes-europe.orgISSN 2333-4959).
Bauerfeind, K., Drüke, J., Schneider, J., Haar, A., Bendewald, L., Baumann, M., et al. (2021). Navigating with Augmented Reality – how does it affect drivers’ mental load? Appl. Ergon. 94, 103398. Download from. doi:10.1016/j.apergo.2021.103398
Bengler, K., Götze, M., Pfannmüller, L., and Zaindl, A. (2015). “To see or not to see - innovative display technologies as enablers for ergonomic cockpit concepts. Ergonomic requirements, future mobility, future functionality,” in Proceedings of the electronic displays Conference, Nuremberg, Germany, February 25–26, 2015
Eyraud, R., Zibetti, E., and Baccino, T. (2015). Allocation of visual attention while driving with simulated augmented reality. Transp. Res. part F traffic Psychol. Behav. 32, 46–55. doi:10.1016/j.trf.2015.04.011
Gabbard, J. L., Fitch, G. M., and Kim, H. (2014). Behind the glass: Driver challenges and opportunities for AR automotive applications. Proc. IEEE 102 (2), 124–136. doi:10.1109/JPROC.2013.2294642
Gish, K. W., and Staplin, L. (1995). Human factors aspects of using head up displays in automobiles: A review of the literature. (Report No. DOT HS 808 320). Washington D.C: National Highway Traffic Safety Administration U.S Department of Transportation.
Grant, B. S., Kiefer, R. J., and Wierwille, W. W. (1995). Drivers' detection and identification of head-up versus head-down telltale warnings in automobiles. Proc. Hum. Factors Ergonomics Soc. Annu. Meet. 39 (17), 1087–1091. doi:10.1177/154193129503901705
Heller, O. (1982). “Theorie und Praxis des Verfahrens der Kategorieunterteilung (KU),” in Forschungsbericht. Editor O. Heller (Wuerzburg, Germany: Department of Psychology), 1–15. Virtual.
Hexagon, A. B. (2021). Virtual Test Drive vollständige Prozesskette für die Fahrsimulation. 2021. Available at: https://www.mscsoftware.com/de/virtual-test-drive.web
Horrey, W. J., Alexander, A. L., and Wickens, C. D. (2003). “Does workload modulate the effects of In-vehicle display location on concurrent driving and side task performance?” in Driving Simulation Conference North America Proceedings, Dearborn, Michigan, October 8-10,2003.
Israel, B. (2012). Potenziale eines kontaktanalogen Head-up Displays für den Serieneinsatz (Doctoral dissertation). Munich, Germany: Technical University of Munich.
Kansteiner, N. (2014). Ergoneers GmbH. Available at: https://www.ergoneers.com/en/2014/07/(Accessed 2014 1. July).
Kiefer, R. J. (1991). Effect of a Head-Up versus Head-Down digital speedometer on visual sampling behavior and speed control performance during daytime automobile driving. SAE Tech. Pap. 1991, 910111. doi:10.4271/910111
Kim, H., and Gabbard, J. L. (2019). Assessing distraction potential of augmented reality head-up displays for vehicle drivers. Hum. Factors 28, 18720819844845. doi:10.1177/0018720819844845
Kim, H., Wu, X., Gabbard, J. L., and Polys, N. F. (2013). “Exploring head-up augmented reality interfaces for crash warning systems,” in Proceedings of the 5th International Conference on Automotive User Interfaces and Interactive Vehicular Applications, New York, NY, 28 October 2013 (Association for Computing Machinery), 224–227. doi:10.1145/2516540.2516566
Kim, S., and Dey, A. K. (2009). “Simulated augmented reality windshield display as a cognitive mapping aid for elder driver navigation,” in Proceedings of the SIGCHI Conference on Human Factors in Computing Systems, New York, NY, April 4-9, 2009 (ACM), 133–142. doi:10.1145/1518701.1518724
Knoll, P. (2015). “Anzeigen für Fahrerassistenzsysteme,” in ATZ/MTZ-Fach-buch. Handbuch Fahrerassistenzsysteme: Grundlagen, Komponenten und Systeme für aktive Sicherheit und Komfort. Editor H. Winner (Wiesbaden: Springer Fachmedien Wiesbaden), 659–673. doi:10.1007/978-3-658-05734-3_36
Liu, Y.-C., and Wen, M.-H. (2004). Comparison of head-up display (HUD) vs. head-down dis-play (HDD): Driving performance of commercial vehicle operators in Taiwan. Int. J. Human-Computer Stud. 61 (5), 679–697. doi:10.1016/j.ijhcs.2004.06.002
Medenica, Z., Kun, A. L., Paek, T., and Palinko, O. (2011). “Augmented reality vs. street views: A driving simulator study comparing two emerging navigation aids,” in Proceedings of the 13th International Conference on Human Computer Interaction with Mobile Devices and Services, Stockholm, Sweden, 30 August 2011 (ACM), 265–274. doi:10.1145/2037373.2037414
Milicic, N. (2010). Sichere und ergonomische Nutzung von head-up Displays im fahrzeug (doctoral dissertation). Munich, Germany: Technical University of Munich.
Pfannmüller, L. (2017). Anzeigekonzepte für ein kontaktanloges Head-up Display (Doctoral dissertation). Munich, Germany: Technical University of Munich.
Pfannmüller, L., Kramer, M., Senner, B., and Bengler, K. (2015). A comparison of display concepts for a navigation system in an automotive contact analog Head-up Display. Procedia Manuf. 3, 2722–2729. doi:10.1016/j.promfg.2015.07.678
Rusch, M. L., Schall, M. C., Gavin, P., Lee, J. D., Dawson, J. D., Vecera, S., et al. (2013). Directing driver attention with augmented reality cues. Transp. Res. part F Traffic Psychol. Behav. 16, 127–137. doi:10.1016/j.trf.2012.08.007
Sandbrink, J. (2019). Gestaltungspotenziale für Infotainment-Darstellungen im Fahrzeug (Doctoral dissertation). Wiesbaden: Springer Fachmedien Wiesbaden.
Schneid, M. (2009). Entwicklung und Erprobung eines kontaktanalogen Head-up-Displays im Fahrzeug (Doctoral dissertation). Munich, Germany: Technical University of Munich.
Keywords: Augmented Reality head-up display, glance behaviour, attention allocation, ambiguous navigation task, driving simulator study
Citation: Bauerfeind K, Drüke J, Bendewald L and Baumann M (2022) How does navigating with Augmented Reality information affect drivers’ glance behaviour in terms of attention allocation?. Front. Virtual Real. 3:930117. doi: 10.3389/frvir.2022.930117
Received: 27 April 2022; Accepted: 04 July 2022;
Published: 16 August 2022.
Edited by:
Youngho Lee, Mokpo National University, South KoreaReviewed by:
Che Samihah Che Dalim, Universiti Tun Hussein Onn Malaysia, MalaysiaRoy Damgrave, University of Twente, Netherlands
Copyright © 2022 Bauerfeind, Drüke, Bendewald and Baumann. This is an open-access article distributed under the terms of the Creative Commons Attribution License (CC BY). The use, distribution or reproduction in other forums is permitted, provided the original author(s) and the copyright owner(s) are credited and that the original publication in this journal is cited, in accordance with accepted academic practice. No use, distribution or reproduction is permitted which does not comply with these terms.
*Correspondence: Kassandra Bauerfeind, a2Fzc2FuZHJhLmJhdWVyZmVpbmRAdm9sa3N3YWdlbi5kZQ==