 Cristina Gil-López1
 Jaime Guixeres1*
 Javier Marín-Morales1
 Carmen Torrecilla1
 Edu Williams2
 Mariano Alcañiz1
- 1Instituto de Investigación e Innovación en Bioingeniería (i3B), Universitat Politécnica de Valencia, Valencia, Spain
- 2Departamento Economía y Dirección de Empresas, Universidad de Las Palmas de Gran Canaria, Las Palmas, Spain
There is increasing interest in studies analyzing the influence of technologies that integrate virtual and real-world components on consumer behavior. These technologies include augmented reality, virtual reality and mixed reality. Mixed reality is a user environment in which physical reality and digital content are combined in a way that enables interaction with and among real-world and virtual objects. In spite of previous works related with MR and retails spaces, little is known about how consumers respond to MR features and which elements of the MR-based experience, such as vividness and novelty, impact behavior. In this study, we have explored the relative advantage of mixed reality in retail shopping practices over a traditional-based purchase. Implicit reactions of shoppers when interacting with products with and without MR glasses were compared. The results reveal that participants wearing MR glasses exhibited different patterns of interaction (i.e., frequency and interaction with product duration) that differed from those indicated by participants who did not wear the MR technology. At the level of purchase decision, our results show that the use of MR smart glasses has an impact on decision times that relates to a utilitarian purchase type. Based on participants’ explicit answers to questionnaires, the reported findings further show that the perceived hedonic and utilitarian values of the purchase experience were higher when MR was used, which also affected future purchase intentions and perceived emotional state as reported by consumers’ experience and satisfaction in the context of retail.
1 Introduction
Technological innovation has become essential to help retailers create competitive tools with several advantages for product presentation (Jaekel, 2016; Inman and Nikolova, 2017). Among these new emerging technologies, augmented reality (AR) has become popular in retail, introducing relevant changes in the way consumers make choices and consume products and brands (Jain and Werth, 2019; Dehghani et al., 2020; Libai et al., 2020). AR differs in its ability to provide a highly interactive and vivid experience with the real world by superimposing virtual objects on the natural environment of the viewer (Yim et al., 2017). An outstanding value of AR is its ability to improve the consumer experience, thus providing higher purchase satisfaction rates (Grewal et al., 2020).
There is an increasing interest in studies analyzing the influence of technologies that integrate virtual and real-world components within the marketing discipline on consumer behavior. These technologies include augmented reality (AR), virtual reality (VR) and mixed reality (MR). A common aspect of AR/VR/MR technologies is their ability to add additional information to existing real-life experiences. While AR allows the consumer to anticipate the experience with products in real-world consumption contexts (e.g., viewing themselves wearing a wide range of virtual products in a physical store; Verhagen et al., 2014), VR simulates the real-world environment, thereby allowing the user to have a different shopping experience outside the immediate surrounding environment (Alcañiz et al., 2019).
Milgram and Kishino (1994) defined mixed reality (MR) as a combination of virtual and real-world objects along a continuum that goes from pure reality (a real environment) to complete virtuality (virtual reality content). The amount of reality and virtuality depends on where in the continuum a particular display or extended content falls (Milgram and Kishino, 1994; Milgram, 2006). MR comprises both AR and augmented virtuality technologies. It is mainly a VR technology used for mixing the physical and virtual worlds, with the advantage of providing realistic interaction between users and digital objects. Therefore, MR technology presents an optimal channel for improving customer experiences in different ways (Flavián et al., 2019). For example, integrating MR into the presentation of products and commercial offers in retail increases value for customers, resulting in an improved experience due to VR technology (Dehghani et al., 2020).
Digital devices should be used while handling MR to have a fully immersive experience. Microsoft’s HoloLens is a trendy example of these devices. Users can react to digital objects by their actions through these translucent MR devices and gestures, gaze, or voice recognition technologies. They can interact with both the physical and virtual environments simultaneously. Instead of relying only on remote control devices, smart glasses, or smartphones, users can also use their gestures, glancing or blinking. These interactions and realistic renderings make the experience of MR more convincing as if it were real life.
Recent studies show that MR technology produces greater enjoyment of the user shopping experience (Meegahapola and Perera, 2017; Dehghani et al., 2020; Jessen et al., 2020; Park and Yoo, 2020), improves customer engagement (Wang, 2020) and positively impacts emotional valence toward the brand (McLean and Wilson, 2019), which ultimately influences purchase intention (Monteiro et al., 2020). From the user’s point of view, MR provides consumers with strategic cues to make smarter decisions, receive personalized offers, and experience faster service (Grewal et al., 2017). Such advantages positively impact the way consumers perceive product affordances, resulting in a substantial improvement in the overall shopping experience and satisfaction (Dehghani et al., 2020; Jain et al., 2021; de Regt and Barnes, 2019). Although the current literature shows different advantages of MR, and several applications in retail, more research is required to better understand how consumers’ implicit behavior and perception towards this technology contributes to designing and predicting better shopping experiences.
This paper makes several important contributions. First, our study provides novel insights into consumer implicit behavior and acceptance of MR wearable technology based on product interaction patterns at the point of sale. Second, this research compares the positive effects of MR product information delivery on purchasing behavior (i.e., decision making, product choice) relative to a shopping experience without MR technology, providing novel evidence supporting the usefulness of MR-smart glasses in-store. Third, the results of this study have strong practical implications since they are intended to guide retailers aiming to integrate MR-smart glasses into their commercial services, thus improving the consumer shopping experience and levels of satisfaction. Lastly, the paper also provides specific theoretical and managerial contributions for improving the quality of retail practices based on the use of this technology and future research.
1.1 Theoretical framework: The role of AR technology in the context of shopping practices
In recent years, innovative marketers have leveraged AR to create more interactive experiences enabling consumers to interact with products and spaces in novel ways (e.g., increasing the sense of presence). Although the power of AR in mediating consumer experience is broadly recognized in the published literature (Dehghani et al., 2020; Jain et al., 2021; Pantano and Di Pietro, 2012; Scholz and Smith, 2016; Yim et al., 2017; Lecointre-Erickson et al., 2018; Bonetti et al., 2019), most of the research analyzing drivers of AR technology acceptance in retail are based on online retailing contexts (Poushneh and Vasquez-Parraga, 2017; Elboudali et al., 2020; Chiu et al., 2021; Arghashi and Yuksel, 2022; Hoffmann and Mai, 2022) and very little is known about the factors that drive consumers’ acceptance of these technology as a channel at the point of sale (Holdack et al., 2020; de Amorim, Guerreiro, Eloy and Loureiro, 2022; Hoffmann et al., 2022). Such predominance of online AR studies mirrors a greater utility of AR solutions in remote environments via handheld devices whose development and incorporation of AR functionalities is effective given its high penetration into consumers’ daily basis (Riar et al., 2022).
Indeed, widespread adoption by users of AR technology takes place through smartphone devices or web-based AR applications, conceptualized as mobile shopper marketing (Shankar et al., 2016; Daassi and Debbabi, 2021; Nikhashemi et al., 2021; Whang et al., 2021). These AR apps allow placing virtual content (e.g., new furniture) in a natural environment (e.g., the consumer’s home), thus enhancing the consumer purchase experience. In this regard, most of the investigated capabilities that AR brings to retailers have been directed toward its use in mobile applications (Olsson et al., 2013; Rese et al., 2017; Omar et al., 2021; Tan et al., 2021). Other forms of AR experience in marketing, such as head-mounted devices or smart glasses, have been shown to improve the purchase experience in retail environments (Kalantari, 2017; Hoffmann and Mai, 2022; Riar et al., 2022; Xie et al., 2022).
Grounded in literature on technology acceptance, perceived enjoyment and perceived informativeness are both factors mediating customers’ perceptions and attitudes towards using AR wearables in a retailing context (Holdack et al., 2020). From a purchase behavior perspective, consumers’ adoption of wearable technology in retail settings (e.g., smart glasses) also has been shown to impact brand engagement, willingness to pay, and purchase intentions (Morozova and Gurova, 2021; de Amorim et al., 2022). However, it is unknown whether the increased interactivity (e.g., handling or looking at physical products) provided by hands-free AR technology affects the overall shopping experience, or its role in the actual purchase behavior.
1.1.1 Consumer technology acceptance model
Knowledge of consumer acceptance of MR is crucial for the success of new technology in the marketplace (Jain and Werth, 2019). Many theories have been used in technology adoption research, with the technology acceptance model (TAM) being the most widely used. The TAM claims that a user’s motivation to adopt a new system is mainly determined by three constructs: attitude toward the system, perceived ease of use (PEU), and perceived usefulness (PU). The construct behavioral intention (BI) was incorporated later in the TAM as a new element, directly affected by attitude and perceived usefulness (Davis et al., 1989).
Several measurement scales have been developed and broadly used in consumer research, showing their validity in predicting technology adoption and behavioral intentions. The PU construct contributes most to predicting behavioral outcomes (McFarland and Hamilton, 2006). However, researchers agree that TAM itself does not produce consistent results, making it critical to identify additional constructs to increase the predictive power of detailed TAM-based assessments.
In the context of AR, perceived enjoyment (PE) has been proposed as another critical factor in driving acceptability (Holdack et al., 2020). Specifically, highly immersive MR wearables introduce enjoyment elements to create more hedonic shopping experiences, differentiating them from non-wearable MR technologies. For instance, head-mounted wearables react to voice and haptic gestures to display information in real time. Such playful experiences come with higher hedonic values that ultimately enrich the shopping experience (Pantano and Di Pietro, 2012; Olsson et al., 2013).
Therefore, the adoption of MR wearables is of particular interest in the retailing industry (de Regt and Barnes, 2019; Jain and Werth, 2019). While other augmented technologies have an extensive research history (Carmigniani et al., 2011; Javornik, 2016), the analysis of determinants of MR wearables acceptability is quite scarce. As this wearable technology becomes increasingly accessible to retailers and consumers, a comprehensive analysis of the specific drivers of consumer technology acceptance becomes relevant (Rauschnabel and Ro, 2016; Dehghani et al., 2020).
1.1.2 Analyzing the impact of MR wearables on retail settings
MR wearables support technological integration with the physical world, enabling fast, real-time access to information. Microsoft HoloLens and Google Glass are two examples of this type of wearable technology, referred to as MR or AR smart glasses, which soon might significantly influence shopping practices and commerce in general (Kalantari and Rauschnabel, 2018; Flavián et al., 2019; Hoffmann and Mai, 2022). By using smart glass devices, the consumer can access the hands-free guidance of digitized information while directly interacting with physical products. This capability allows vendors to offer personalized content, conduct customized promotions, help customers in the purchasing process, and obtain valuable information on buyers.
In retail, MR-wearable devices constitute a new form of communication transmission at the point of sale (Rauschnabel and Ro, 2016; Hoffmann and Mai, 2022). As the literature has indicated, such embodied technology provides a variety of advantages for consumers (Kalantari, 2017; Kalantari and Rauschnabel, 2018; Flavián, Ibáñez-Sánchez, and Orús, 2019; Herz and Rauschnabel, 2019; Javaheri, Mirzaei, and Lukowicz, 2020). For example, wearing smart glasses while walking inside a store has been shown to improve the overall shopping process by creating more holistic experiences that impact behavioral intent (Holdack et al., 2020). Compared to other AR technologies (e.g., mobile and web-based AR applications), MR wearables provide a much more immersive experience and higher interactivity by allowing consumers to shop hands-free, as they would in traditional supermarkets or stores. Furthermore, using MR wearables in-store is less distracting than AR app-based and handheld-mobile devices because it enables quick access to product information that the consumer needs to see, instead of having to look back and forth between a mobile or tablet screen (He et al., 2015; Arghashi, 2022). This technological embodiment factor that characterizes wearable technologies improves consumers’ capacities (e.g., visual perception, bodily autonomy, and touch) and sensory stimulation, thus increasing the dynamism of the purchasing process (Flavián, et al., 2019).
In light of the increasing adoption of MR wearable technology by retailers and customers (Javornik, 2016; Kalantari, 2017; Dehghani et al., 2020), the analysis of in-store buying behaviors has become relevant (for a review, see Lavoye et al., 2021). To date, few academic studies have provided novel insights into the influence of using smart glasses in-store on different aspects of consumer behavior (Holdack et al., 2020; de Amorim, Guerreiro, Eloy, and Loureiro, 2022). For example, Holdack et al. (2020) empirically tested customers’ perceptions and attitudes toward using AR smart glasses (i.e., usefulness, ease of use, enjoyment, and informativeness) in a retail environment. The reported results support an improvement in the customer shopping experience with using smart glasses by including additional factors of enjoyment and information. Moreover, the enjoyable experience of MR wearables was shown to influence the perceived information, intention of use, and consumers’ attitudes toward this technology. The study of de Amorim et al. (2022) confirmed that AR smart glasses positively impact consumer-brand engagement and willingness to buy, thus demonstrating the significant potential of this type of MR wearable device in retail services.
In sum, current MR-wearable technology research mainly focuses on the adoption or general use of MR wearables, such as perceived usefulness, trust, attitudes toward technology, and hedonic and utilitarian motivations. However, there is a knowledge gap in how consumers interact with products while wearing MR technology during the shopping process and how specific behavioral interaction patterns may (or may not) lead to satisfaction, product preference, and actual purchases. Research in this regard remains scarce.
1.1.3 Shopping with MR-wearables: The role of interactivity
The growing popularity and advantages of MR devices (e.g., hands-free, vivid interactions, and instant feedback) are leading to their increased use in retail settings (Hoffmann and Mai, 2022; Rauschnabel et al., 2018; Rejeb et al., 2021; Riar et al., 2022) as effective channels for both in-store and remote shopping activities. Inside the store, MR wearables provide interactive functionalities similar to traditional shopping without AR technology. For example, smart glasses allow consumers to interact hands-free with products and vendors while on the go or when looking at physical products on shelves. However, adding augmented functionalities, such as additional product information and personalization at the point of sale, enriches the interactivity component that characterizes retail shopping experiences (de Amorim et al., 2022; Riar et al., 2022).
The effects of behavioral interactivity (see definition in Sohn, 2011) on consumer experience have been extensively addressed in AR mobile-based shopping contexts (Watson et al., 2018; Plotkina and Saurel, 2019; Park and Yoo, 2020; Kazmi et al., 2021; Lavoye et al., 2021; Arghashi and Yuksel, 2022). In these studies, interactivity has been shown to positively influence shopping behaviors. A main outcome is that including interactive features at retail shopping sites provides consumers with more engaging, experiential shopping experiences (e.g., Pantano et al., 2017; Park and Yoo, 2020). However, since the level of interactivity that AR mobile technology provides differs significantly from that offered by MR wearable devices (Flavián et al., 2019), research on the possible transfer of such positive effects due to using MR technology becomes relevant.
Unlike mobile-based AR, MR wearable devices integrate with the user’s body, creating more immersive experiences thus, expanding the perceived sensorial stimulation (Flavián et al., 2019). For example, providing consumers with MR smart glasses in stores creates enjoyable experiences driven by more integrated product visualization functionalities and media richness possibilities (de Amorim et al., 2022). In this regard, current research shows that when consumers can touch or pick up products at the point of sale and, at the same time, control the environment in an increased way, there is greater purchase confidence, as well as a greater willingness to buy (Meegahapola and Perera, 2017; Vonkeman et al., 2017; Brengman et al., 2018; Caboni and Hagberg, 2019).
It is thus important to understand the nature of consumer interaction with products through MR technology (e.g., the time spent interacting with products) to anticipate its successful application, particularly in physical retail stores. Cluster-based study designs can be very insightful for understanding how the augmented interaction features provided by MR wearables, compared to purchases without AR technology support, lead to different purchasing behavior outcomes. In particular, the measurement of interactive variables, such as product interaction times, product retention/touch frequency, or product choice latencies, is of great interest in determining the potential value of this technology as a future selling channel.
1.2 Present study
The present study explores the impact of using new MR smart glasses (HoloLens v2 by Microsoft) to improve the customer shopping experience (Lecointre-Erickson et al., 2018) compared to non-MR shopping experience conditions. To this end, participants’ resulting behavioral patterns of interaction in response to 12 samples of wine bottles will be measured. This study also analyzes consumers’ self-reported attitudes toward MR-based shopping experiences, as the literature identifies them as critical elements of technology acceptance and overall customer satisfaction (Inman and Nikolova, 2017). Therefore, perceived usability, future behavioral intentions and perceived affective, hedonic and utilitarian values will be measured.
1.3 Hypothesis
MR technology using wearable glasses is expected to mediate the interactivity pattern with products, resulting in various levels of positive evaluations of the shopping experience that may differ from the comparable experience without MR. Therefore, we propose the following hypothesis:
Hypothesis 1A:. The total product interaction time in terms of visualization duration of the MR window will increase with the use of MR smart glasses.
Hypothesis 1B:. Using MR glasses will increase the frequency and product interaction time during in-store purchases compared with a non-MR purchase experience.
Hypothesis 1C:. Because the experience of shopping with MR glasses will lead to greater product awareness, consumers’ decision times on the chosen product will be extended compared to a shopping experience without MR technology.Additionally, the net result of a shopping experience using MR glasses technology will be an improvement in the perceived value of the purchase experience, therefore changing future purchase behavior intentions, as hypothesized below:
Hypothesis 2A:. The use of MR glasses will provide shoppers with a good experience measured by usability, acceptability, hedonic and utilitarian values.
Hypothesis 2B:. The emotional response linked to the experience of MR shopping will increase relative to a non-MR shopping experience.
Hypothesis 2C:. MR glasses will positively impact purchase intentions and satisfaction in retailing.
2 Materials and methods
2.1 Sample of participants
A sample of 50 participants balanced in gender and age (range age between 30 and 35) took part in this study. The average age of the participants was 32.84 (SD = 1.59). Half of the participants were randomly assigned to the HoloLens-MR experience condition, and half were assigned to a control condition (non-MR shopping experience). All selected participants reported being regular consumers of the tested products.
2.2 Tested products
The tested products consisted of 12 bottles of red wine varieties, as shown in Figure 1. The price was shown on the shelf below the product based on how it is typically exhibited in supermarkets. For each bottle, an interface with additional information about the wine (e.g., type of wine, type of aging, smell, flavor, pairing and grape variety) was displayed in an augmented form in the glasses.
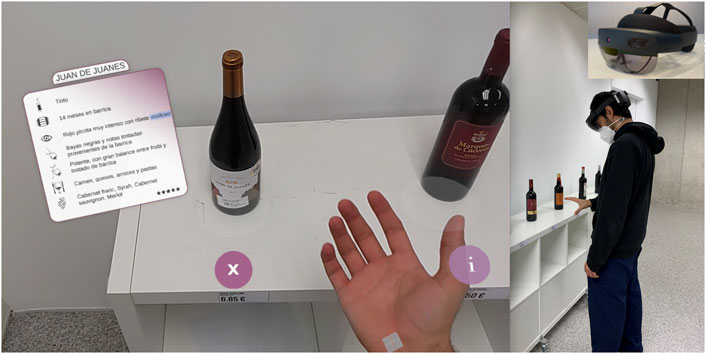
FIGURE 1. Visual interface used in the study showing what the user can see (top and center image) when wearing HoloLens v2 glasses (bottom image).
One might ask why wine was chosen as the test product for this study and why there were no other categories. Wine is characterized by having high information content that often does not entirely come printed on the bottle’s label. At the same time, consumer knowledge regarding wine is often poor, which sometimes ends up in the product failing to meet consumer expectations (Robertson et al., 2018). For this reason, choosing this type of product in the study was optimal for testing the usefulness of MR technology in the purchase process in physical stores where wine-related information is more limited than in online shopping.
2.3 Experimental design and procedures
A study was designed to investigate the overall effectiveness of MR glasses technology in purchasing products in an exploratory way and, more specifically, to assess whether wearable MR-based technology influences consumer behavior and opinions about the shopping experience compared to traditional shopping. A between-group design (MR Group vs. Non-MR Group) was adopted to test the research hypotheses of this study. Participants assigned to the MR group condition engaged in a retail purchase experience wearing smart glasses, which allowed them to look at and amplify the information associated with each tested product. In contrast, participants assigned to the control condition group carried out the same purchase experience without wearing MR technology.
The experimental session was conducted in a well-conditioned laboratory using a reliable replica of a wine cellar shelf. Upon arrival at the laboratory, participants were welcomed and then had the procedure explained to them. After reading and signing the informed consent form, participants assigned to the MR smart glasses group were given a short tutorial on the control functions of the smart glasses. An MR interface was shown directly in the glasses each time they directed their gaze to a particular product. An additional information menu was deployed each time the participant chose the “extra info” label directly with their hands (see Figure 1).
Additionally, participants of both groups received instructions to perform the purchase in a free exploratory mode and make a product choice with the following specifications: “Please choose a pairing wine for a dinner you have been invited to. The main dish on the menu is red meat, and most of the guests are regular wine consumers.”
2.4 MR user interface design
To optimize the visualization of augmented product information, various user interface (UI) designs were built following the principles and recommendations found in the literature (Endsley et al., 2017; Kim et al., 2019). A total of 16 UI layouts were generated, each displaying different combinations of text-like visuals (extended product information), chromatic patterns, widgets, and infographic icons. For each design, a usability test was carried out with a total of 12 users who evaluated the design on a scale from 1 to 10:
1. The clarity of the design in terms of ease of reading and understanding.
2. The precision of the design to coincide the augmented panels with the physical elements.
3. The effectiveness and comfort of the design for hand gesture interactions.
2.5 Equipment
Cutting-edge wearable HoloLensv2 glasses (Microsoft, 2020) were used to facilitate the seamless interaction with MR holograms. This device allows users to embed such MR holograms in their physical environment. MR technology participants were encouraged to freely interact with the products by directly displaying the MR windows linked to each item physically presented on the shelves.
In addition, body movements and hand gestures were also tracked using a high-definition camera while participants of both groups physically interacted with the products.
2.6 HoloLens metrics
Metrics related to product interactions mediated by MR technology were collected from the smart glasses participants (see Table 1). Of great interest was characterizing consumers’ interaction patterns with products as a function of the duration and frequency of the MR window display.
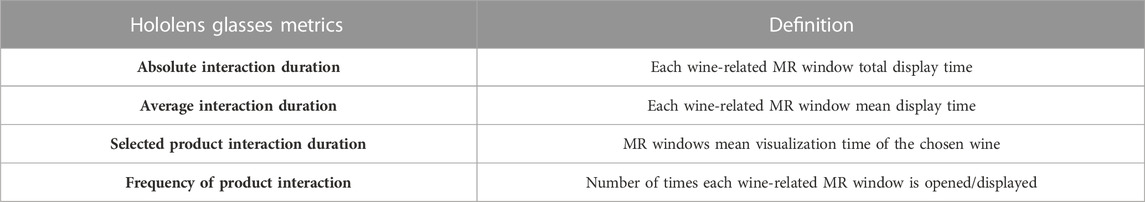
TABLE 1. Metrics of interest collected during the purchase experience with smart glasses.
2.7 General HBT metrics
Measurements of hand/body movements were tracked and registered for participants in both groups. Of particular interest was characterizing consumer interactions with products in terms of duration and frequency to objectively quantify the relative impact of MR technology. All collected and analyzed metrics and their definitions are listed in Table 2.
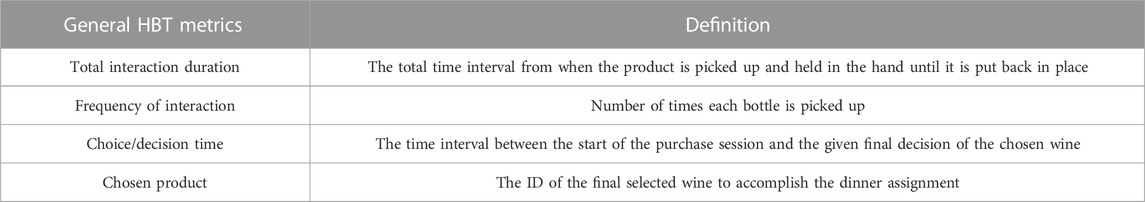
TABLE 2. General HBT metrics of interest are collected during the purchase experience.
2.8 Questionnaires
Several questionnaires were administered to all participants after interacting with wine products asking about their perceived shopping value. The questionnaires consisted of three sections: 1) future behavioral/purchase intentions (Morwitz, 2014), 2) hedonic/utilitarian purchase motivations (Jones et al., 2006), and 3) emotional state (SAM scale, Bradley and Lang, 1994). Additionally, two more questionnaires measuring MR technology usability and acceptance (King and He, 2006; Kalantari and Rauschnabel, 2018) were completed only by participants in the HoloLens group. All items were measured using a five/nine-point Likert-type scale ranging from “strongly agree” to “strongly disagree” (see Appendix A).
3 Calculation
3.1 General Human Behavior tracking (HBT) signal processing
The experiment was recorded using a video camera anchored to the ceiling, model AXIS 214PTZ. The video was recorded at 1280 × 800 (30 fps). They were analyzed using the software Boris (Black Lives Matter, 2021; Friard and Gamba, 2016). A set of marks were included in the video to mark the following frames: 1) task starts, 2) subject picks up product X, 3) subject puts down product X, 4) subject selects product X, and task ends. These marks were exported in a file per subject. Finally, a script in Python 3.0 was developed to process the files and create the HBT metrics.
3.2 Statistical analysis
To identify the impact of MR technology on the product shopping experience, HBT and HoloLens metrics related to the mean duration and frequency of interaction with products, the final chosen product, and total decision time were compared across groups. Individual t-tests for two independent samples (i.e., Mann–Whitney) were conducted to assess the significance of each contrast of interest. In the case of significant detected differences, the analysis of variance (ANOVA) for two independent variables was performed to determine the MR technology interaction and main effects on product interaction.
Participants’ responses to questionnaires were statistically analyzed to validate the mediating effect of MR technology in perceived shopping value constructs. Mean scores were calculated for each self-reported measure to obtain the index score for the assessed shopping value factors. t-test comparisons for two independent samples were conducted accordingly to validate between-group differences.
4 Results
This section describes the results of General HBT and MR-smart glasses measurements in terms of 1) time spent interacting with products either through MR holograms or physically holding products with hands, 2) frequency of interactions and 3) the decision time of the chosen product. Between-group significant differences found in both groups across each of these metrics are also reported.
4.1 Between-group differences in product interaction duration and frequency
The mean time spent interacting with products for each group condition is shown in Figure 2. On average, participants wearing smart glasses dedicated 26 s (Std = 6.49) to visualizing the information displayed by the MR window hologram, which differs from the time spent by the control group physically interacting with products (M = 5.95 s, Std = 2.08). This difference was found to be statistically significant according to the Mann–Whitney test for two independent samples. The subsequent two-factor analysis of variance (ANOVA) confirmed a significant interaction effect between product interaction duration and MR technology (F = 21.165; df = 1; η2 = 0.310; p = 0.0001).
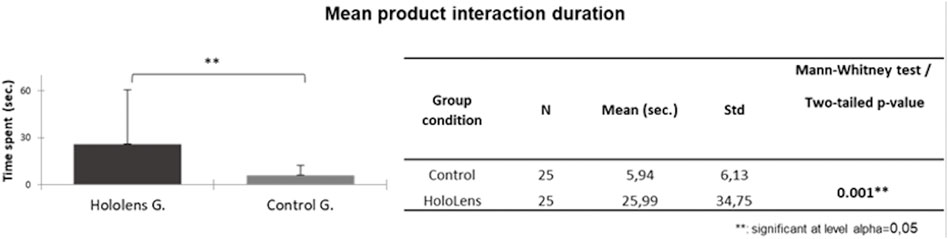
FIGURE 2. Between-group comparisons of mean time spent interacting with products.
When comparing the frequency of interaction with products across groups, the results confirm that the participants belonging to the group wearing MR technology interacted quantitatively more times with the set of 12 products (Mean % = 0.73; Std = 8.09) than participants assigned to the control group (Mean % = 0.46; Std = 10.14). This proportion of interactions was 27.5% higher in the smart glasses group (see Table 3). According to the Mann–Whitney test, this ratio of interaction frequency differed significantly between groups (U = 142, n1 = 12, n2 = 12; p < 0.0001).
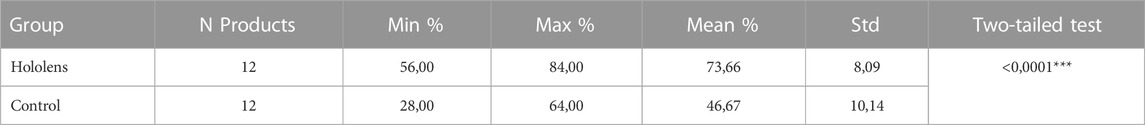
TABLE 3. Between-group differences in mean interaction frequency (%) with products.
When focusing on each group’s mean product interaction frequency, participants wearing smart glasses opened an average of nine times one or more product-related MR windows. In contrast, participants held products with a mean frequency of 7 times (see Table 4).
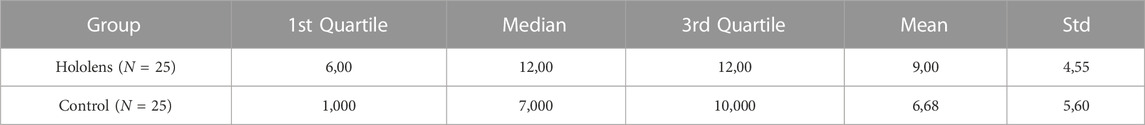
TABLE 4. Mean product interaction frequency.
4.2 Chosen product and decision time results
The distribution of frequencies and decision times (DT) of the most chosen products is shown in Table 5. The statistical analysis indicated that, in general, both groups agreed on their product selections, with only two products out of 12 being the most preferred in both groups above 23%.
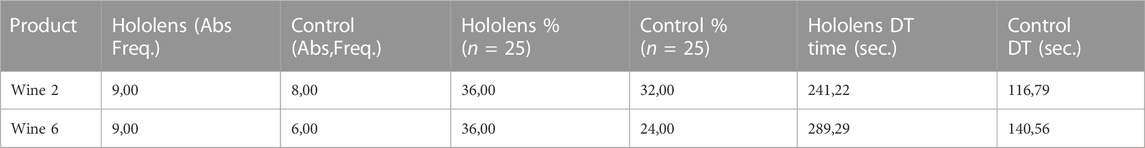
TABLE 5. Product choices (> 23%) and decision times (DT).
When inspecting the overall decision times of the chosen products (n = 12) in both groups (Figure 3), the results indicate that participants wearing smart glasses showed a larger mean DT (M = 229.67, SD = 97.99) than participants not wearing MR technology (M = 145.04, SD = 89.84). The two independent sample t tests confirmed that this difference was statistically significant (t(48) =−3.183; d = 0.90 p= 0.003**).
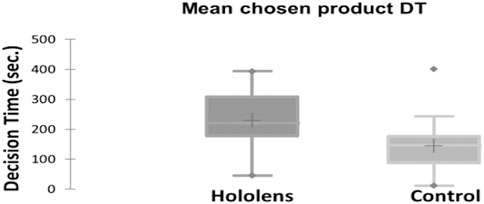
FIGURE 3. Differences between groups in decision times relative to product choice.
Altogether, these results confirm an important influence of MR technology on the duration and frequency of interaction with products that differ from those shown in a traditional shopping experience without MR technology. In contrast, the results related to product decisions do not support a significant MR technology-driven influence, as participants in both groups more or less agreed on the preferred products. Critically, significant differences were found at the level of decision-making times, with longer decision times for the chosen product linked to the MR technology condition.
4.3 Questionnaire results
A summary of the mean rating scores for each evaluated category is displayed in Table 6 (evaluation of MR shopping experience) and Table 7 (evaluation of overall shopping experience).
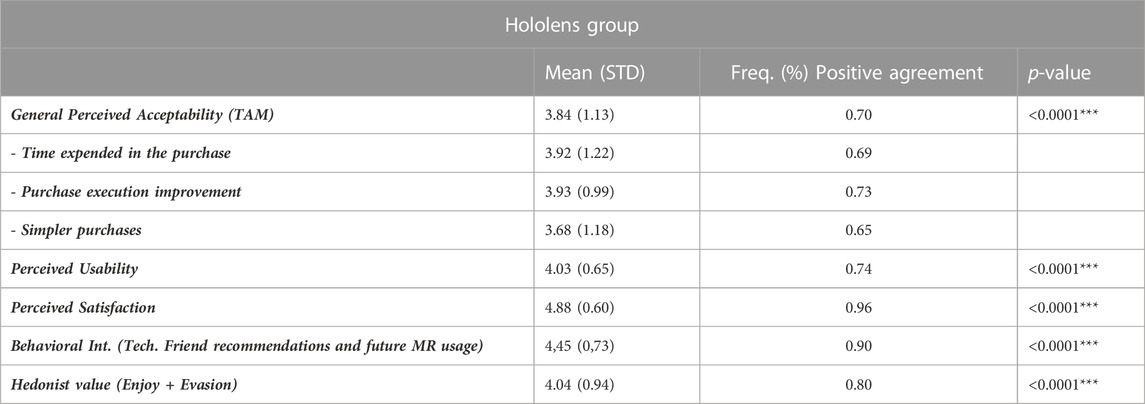
TABLE 6. Mean and frequency of rating scores.

TABLE 7. Scores of participants’ explicit evaluation of the overall shopping experience.
4.4 Evaluation of acceptability of MR smart glasses technology
According to the answers to the TAM questionnaire, the perceived MR acceptability has a general mean rating score of 3.84 on a 5-point rating scale, with a 70% frequency of positive agreement ratings (i.e., “Slightly likely and Highly likely” responses).
Perceived usability of MR technology has a mean rating score of 4.03 and a frequency of agreement rating of over 74%. The answers to the Perceived Satisfaction Questionnaire reached a mean rating score of 4.88, with 96% of the agreement rating frequencies.
The results of Hedonist value linked to MR at the level of “Enjoy and Evasion” dimensions indicated a mean rating score of 4.04 and a frequency rating of 80%.
4.5 Comparisons of shopper experience between smart glasses and control groups
The perception of Hedonist value based on the “Attractiveness” indicator resulted in a higher mean rating score (M = 4.60; STD = 0.64) in the HoloLens group compared to ratings given by the control group (M = 3.96; SDT = 0.73; Freq. (%) = 0.92). The magnitude of this difference was significantly superior in the HoloLens group (t (48) =3.27; d = 0.85; p= 0.002).
Similarly, the overall Utilitarian value score achieved a higher rating (M = 4.24, STD = 0.48; Freq. (%) = 0.81) in the HoloLens group compared with Control group ratings (M = 3.81; STD = 0.71; Freq. (%) = 0.68). This difference was also statistically significant (t (48)= 2.29; d = 0.61; p = 0.026). When looking at each utilitarian measure separately, a significant difference was appreciated at the level of “Satisfaction of needs” (see Table 5 below).
The mean answers to overall shopping intentions related to a future purchase of the same products/store were 4.45 on a 5-point rating scale for the HoloLens group. This mean score differed significantly from the mean ratings given by participants in the control group (U = 435, n1 = 25, n2 = 25; d = 0.63; p = 0.013).
Mean ratings are given for the emotional assessment scale (SAM), which also differed between experimental groups. For participants wearing HoloLens glasses, self-assessment ratings of arousal (M = 6.57, STD = 1.73) and valence (M = 7.56; STD = 1.00) during the shopping experience were superior to ratings given by the control group (see Table 8). Such differences were found to be statistically significant at the level of arousal (U = 445, n1 = 25, n2 = 25; d = 0.66; p = 0.008**) and marginally significant for the valence dimension (U = 407, n1 = 25, n2 = 25; d = 0.50; p = 0.059). Instead, the results of self-assessment ratings found at the level of dominance were superior for the Control group (M = 7.40; STD = 2.14), although this difference did not reach statistical significance.
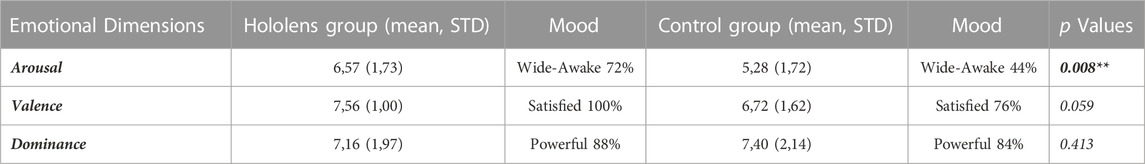
TABLE 8. SAM-Scale scores and p values.
Interestingly, the distribution of the rating score frequencies found for arousal shows that 72% of the participants who wore the MR smart glasses felt wide awake or excited during the shopping experience compared to 44% of the scores found in the control group for the exact mood category (Table 8). When focusing on the distribution of frequency scores for valence, 100% of participants in the HoloLens group reported feeling satisfied or highly pleased using MR compared to 76% of participants in the control group who reported experiencing the same mood.
In summary, the acceptability of the MR technology and perceived degree of usability were moderately positive among participants wearing Smart Glasses, ranging from 70% to 74% probability acceptance. The hedonic value of the shopping experience with MR technology was significantly higher in the HoloLens group at the level of “Attraction” (> 90%). Similarly, the general utilitarian value was perceived as significantly higher in physical purchases with MR technology (> 80%). Interestingly, the emotional response was 28% more intense in the MR shopping experience than in the non-MR shopping context. Additionally, the behavioral purchase intention was significantly more favorable in the group wearing MR technology.
5 Discussion
The goal of this study was to explore the relative advantage of mixed reality (MR) in retail shopping practices over a traditional-based purchase focusing on the interactivity component. We conducted a consumer study using a common wine cellar expositor replica and asked participants to make purchase choices in a freely explorative way. Implicit reactions of shoppers when interacting with products with and without MR glasses were compared. The results reveal that participants wearing MR glasses exhibited different patterns of interaction (i.e., frequency and interaction with product duration) from those indicated by participants who did not wear the MR technology, thus supporting Hypothesis 1A, 1B. At the level of purchase decision, our results show that the use of MR glasses technology impacts decision times that relate to a utilitarian purchase type (Hypothesis 1C).
Based on participants’ explicit answers to questionnaires, the reported findings further show that the perceived hedonic and utilitarian values of the purchase experience were higher when MR was used, which also affected future purchase intentions and perceived emotional state as reported by consumers (Hypothesis 2A, 2B). These results support the unique ability of MR technology to improve the perceived consumer experience and satisfaction in the context of retail (Hypothesis 2C), which is consistent with recently published research on the role of high immersion technologies in shopping environments (Peukert et al., 2019; Holdack et al., 2020).
5.1 Spotting the role of MR glasses technology in retail
According to a recent market analysis report (Grand View Research, 2020), MR wearables have the potential to grow exponentially in retailing services, shifting from traditional methods of communication with consumers into one that is highly interactive and experiential (Dehghani et al., 2020; Hoffmann et al., 2022; Holdack et al., 2020; Jain and Werth, 2019; Jain et al., 2021; Kazmi et al., 2021). In this respect, previous research has already stressed the positive role of MR wearable on consumer shopping drivers and perceived experience in the point of sale (de Regt and Barnes, 2019; Holdack et al., 2020; Jain et al., 2021). Consistently, our study supports positive effects of MR-smart glasses adoption in retailing based on behavioral patterns of interaction, proving a relevant role of AR-based information delivery on perceived purchase values. A main supported claim in the literature is that MR-wearable devices enhance consumer experiences by including additional amusement and informational functionality, which positively affects behavioral intentions (Childers et al., 2001; Pantano and Di Pietro, 2012; Dehghani et al., 2020; Romano et al., 2021). The presented findings are in line with this claim as participants in the group of MR technology in general scored higher in purchase values (hedonist, utilitarian and future behavioral intentions) compared to the group without technology. Thus, our results confirm that the information delivery functionality of MR-smart glasses at the point of sale facilitates interactivity resulting in a better purchase experience.
In addition, we found that the relatively longer interaction times with the product through the visualization of MR windows may be indicative of high levels of engagement, probably derived from the recreational and self-exploratory aspects that characterize MR technology (Scholz and Smith, 2016; Jessen et al., 2020). As shown by different cognitive studies, the length of time spent on a specific activity is suggestive of high engagement, which at the same time mirrors affective states such as enjoyment and curiosity (for a review, see Skinner et al., 2009, pp. 223–245). Someone can argue that spending more time viewing the MR windows may not necessarily mean additional interaction and engagement with product information but rather more time determining how to use the device or getting acquainted with the equipment. This does not seem to be the case in our study since a significant majority (75%) of participants stated being comfortable with technology usage (see MR Group usability rating scores table), even if most had never used an MR wearable before. In addition, the observation and tracking of participants did not reveal difficulties using the smart glasses.
Our results also reveal a particular role of MR wearable in mediating consumers’ decision times that has not been reported in previous studies. In the context of purchase decision, often consumers have a set of initial alternatives that they actively consider before making their final choice (Hauser, 2014; Romano et al., 2021), especially if knowledge that consumers have about the product is limited, as in the case of wine. When participants in our study had to accomplish a goal-oriented assignment (e.g., choosing a specific type of wine for dinner), the utilitarian value acquired greater prominence in the MR group. A main explanation is that consumers tend to pay more attention to the information about the product shown in the augmented MR window because they find it more useful and helpful for reducing choice overload (Garaus et al., 2015). As shown in the literature, a main positive effect of using MR for decision-making is expanding consumers’ purchase consideration set, which may result in higher cognitive fluency (Romano et al., 2021) ultimately improving their decision-making ability (Hilken et al., 2017). Such a cognitive factor of the decision process should be carefully considered when presenting product information to consumers (Rese et al., 2017), especially in categories of products such as wines where key information is not fully available on the label.
At this point, a pertinent question may be whether delivering additional information through augmented windows would consistently play an advantageous role in retailing. Despite additional information is often well-accepted by consumers (Holdack et al., 2020; Joerß et al., 2021), too much of it can reduce effectiveness or even be counterproductive (Hoffmann et al., 2022; Hu & Krishen,2019; Roetzel, 2019). As explained in the conceptual model of AR-delivered product information of Hoffmann et al. (2022), negative effects arise when both, information detailedness and level of controllability are high. Furthermore, such negative effects become particularly acute during busy shopping times (i.e., rush hours). In our study, none of these limiting conditions interplay with reported interactive behavioral patterns. The structure of the augmented panel only contained one round of information (e.i., without nesting information) and was supported by easily recognizable icons, thus facilitating a holistic visualization and comprehension (see example in Figure 1). According to Hoffman’s model, a negative effect of AR-based information delivery is likely when controllability is spread over multiple rounds mainly because it reduces consumers’ perceptions of being aware of all the available information and increases the sense of not being fully informed. Lastly, although the condition of rush hour was not included in the experimental design, we cannot rule out that it could have a negative effect if the study is repeated by adding this environmental variable. Anyhow, this is an empirical question that deserves to be investigated to increase the ecological validity of the study and generalization of results.
Taken together, our results highlight both hedonic and utilitarian roles in mediating the consumer experience with MR wearables (Jessen et al., 2020; Kang et al., 2020). Thus, in addition to the “playful” aspect, the information feature linked to a hand-free MR technology should not be neglected in the context of retail, since utilitarian purchases occur quite frequently, to some extent moderating the hedonic value of the experience (Kang et al., 2020). Compared to a common shopping situation, the longer decision times shown in our study in the group wearing the MR glasses may suggest a more active role of the consumer during the purchase process that should be maximized in designing immersive shopping experiences.
5.2 Managerial implications and future research
The results of this study have implications for theory, practice, and future research. First, our study identifies user engagement as a key variable mediating a satisfactory shopping experience with MR glasses. This cognitive aspect integrates the consumer experience with MR and further complements current models explaining technology acceptance drivers (e.g., Rauschnabel and Ro, 2016; Van Esch et al., 2019; Oyman et al., 2022). Second, from a consumer behavior approach, our study provides empirical data supporting a significant role of gesture-based interactivity as a core part of a satisfactory experience with wearable MR technology. Knowledge about how consumers manage technology is critical in consumers’ adoption, which in the case of MR wearables remains important to predict expected future diffusion. It is, therefore, essential to test MR wearables, such as Hololelens, particularly in the retail landscape where this technology has barely penetrated. Finally, our results provide valuable insights into MR wearable device applications throughout the in-store customer journey, highlighting the expanded information of products as a key feature to enhance interactivity between customers and vendors. However, hands-free MRI devices will work effectively in retail if the augmented information delivery is carefully designed to avoid undesirable effects such as cognitive overload or the fear of missing out information (Hoffmann et al., 2022).
Given the multiple factors directly involved in a shopping experience using virtual reality-based technology, future MR-related studies should aim to reach beyond separate consumer responses and investigate the purchase experience. For instance, more in-depth research is needed to understand whether the playful aspect linked to MR wearables impacts not only technology acceptance but also the quality of purchase decision-making. In addition, it would be interesting to test possible disruptive effects of MR technology for different AR-enabling devices, such as perceived complexity and level of intrusiveness in their natural behavior. Although head-mounted displays, MR smart-glasses and other optical see-through systems (e.g., contact lenses) could enable a more natural shopping experience, these devices are not common yet in everyday shopping activities. More research is therefore required on how wearable MR devices could be more naturally integrated into consumers’ everyday purchases at the point of sale (e.g., like wearing regular glasses).
Since MR technology in marketing is evolving rapidly, sooner rather than later, retailers will apply it to many market segments, including grocery shopping. Suggested directions for future research include a better definition of the consumer profile of early adopters and differentiate their behavioral responses in terms of purchase intentions, preferred sensorial modality (touch, vision, olfactive) or to differentiate the pattern of body gestures/movements consistent with a purchase decision from those that are elicited when the intention is only exploratory or ludic. Having this knowledge will enable marketers to present products and embedded MR information more efficiently and tailored to consumer needs. Hopefully, this work provides valuable insights to obtain the first picture of distinct implicit behavioral patterns linked to this modality of MR technology that are differentiated from common shopping activities without using augmented devices in terms of interactivity and decision-making times.
5.3 Limitations
This study presents some limitations related to the type of MR device used and the product category. As we rely on HoloLens 2 glasses to elicit responses from users, our study results do not cover the wide range of factors mediating consumer experiences in other types of MR wearable devices that are also compatible with retail shopping practices. In fact, the flow of a particular type of wearable is likely linked to the product category, which in our study is limited to only one type of product (bottles of wine). As shown in the literature, product type can moderate the influence of the MR shopping experience on many levels, e.g., cognitive load and product attitude (Fan et al., 2020). Similarly, environmental variables not considered in our study, such as rush-hour shopping times or crowded settings that typically characterize purchases in physical stores, could also influence the effectiveness of MR information delivery. This high specificity inevitably implies some limitations in the broader generalizability of our findings, which offers opportunities for future research.
Another limitation affects the experimental design. Our study did not include a third condition (e.g., AR mobile app purchase experience) to control for possible alternative effects of providing additional information to the consumer beyond what is obtained directly from the product label. Based on media richness theory (Daft and Lengel, 1986), it is assumed that consumers welcome richer and more complete product information. In the retail context, increasing the amount of information about products generally implies positive effects on, e.g., decision-making and purchase intentions (Javornik, 2016; Holdack et al., 2020). In the particular context of this study, we demonstrate that the greater amount of information delivered through MR technology relative to the information written on the wine bottle label enriches the shopping experience. We attribute these positive effects to the fact that, just like in physical retail, additional information is contextualized, that is, inside the store and directly on the physical product. However, comparisons with a non-contextualized shopping experience scenario, such as out-of-the-store AR shopping apps, are necessary for a future study to discard a possible indirect effect attributed to a greater/lower amount of information itself.
Finally, our results show higher interaction times in the group wearing the smart glasses, which we attribute to one of the positive effects of MR technology, based on their reported answers to technology acceptance model and the hedonic shopping value questionnaires. Even though previous research agrees that a positive attitude towards technology positively impacts time spent buying in-store (Peukert et al., 2019), in the context of our study, one may think that the longer interaction time may not be univocally due to the positive effects of MR technology. Specifically, other extraneous variables, such as technology handling or lower persistence of information (i.e., a possible mental cost linked to visualization of product information in AR displays) could also explain higher interaction times with a detrimental effect on consumer experience. Regarding users’ cognitive ability to manage additional information, studies show that AR facilitates the perception and understanding of information when given in context (Hertzum and Holmegaard, 2013; Jeffri and Awang Rambli, 2021; Lei et al., 2022), as in the case of our study. However, we acknowledge that the need for a control measure to accurately quantify a minimal influence of low/high information persistence (e.g., user comprehension/retention time of information) may, to some extent, limit the scope of the study. Such ambivalence confirms the advisability of inquiring further into the interactive and cognitive aspects that this technology evokes. For future studies, we suggest combining body-related behavioral measurements (e.g., body movement patterns or hand gestures) with consumer-perceived interaction time and perceived mental workload as effective measures for controlling mentioned confounding factors.
6 Conclusion
The findings presented in this study highlight engagement as the most relevant factor driving the positive use of MR wearables in a retail environment. Interactivity has shown to be a strong feature characterizing the purchase flow engagement with MR wearables differing significantly from a shopping experience without MR technology. Based on consumer shopping value ratings, the acceptance of this technology seems to be linked to hedonistic and utilitarian values at different stages of the shopping journey. Thus, we believe that a successful consumer adoption of MR wearables and satisfaction in retail may depend on how these factors interact with added value (e.g., rapid access to product deals, customized information, novelty) that cannot be easily obtained otherwise. Overall, this study contributes new insights supporting a more natural augmented form of interaction with products in physical stores, which may differ from other augmented experience devices such as AR smartphone apps.
Data availability statement
The original contributions presented in the study are included in the article/supplementary material, further inquiries can be directed to the corresponding author.
Ethics statement
Ethical review and approval was not required for the study on human participants in accordance with the local legislation and institutional requirements. The patients/participants provided their written informed consent to participate in this study.
Author contributions
JG, EW, and MA contributed to conception, study design and manuscript writing. CT conducted the experiment and data acquisition, JM and CG contributed to data organization, analyses and manuscript writing.
Funding
This work was supported by the European Commission (Project RHUMBO H2020-MSCA-ITN-2018-813234), by the Generalitat Valenciana funded project “Rebrand”, grant number PROMETEU/2019/105, and by the European Regional Development Fund program of the Valencian Community 2014–2020 project “Interfaces de Realidad mixta Aplicada a Salud y toma de decisiones”, grant number IDIFEDER/2018/029.
Acknowledgments
Paper was edited for proper English language, grammar, punctuation, spelling, and overall style by one or more of the highly qualified native English-speaking editors at American Journal Experts (AJE).
Conflict of interest
The authors declare that the research was conducted in the absence of any commercial or financial relationships that could be construed as a potential conflict of interest.
Publisher’s note
All claims expressed in this article are solely those of the authors and do not necessarily represent those of their affiliated organizations, or those of the publisher, the editors and the reviewers. Any product that may be evaluated in this article, or claim that may be made by its manufacturer, is not guaranteed or endorsed by the publisher.
Abbreviations
AR, augmented reality; BI, behavioral intention; DT, decision times; HBT, human behaviour tracking; TAM, general perceived acceptability; VR, virtual reality; MR, mixed reality; PEU, perceived ease of use; PU, perceived usefulness; PE, perceived enjoyment.
References
Alcañiz, M., Bigné, E., and Guixeres, J. (2019). Virtual reality in marketing: A framework, review, and research agenda. Front. Psychol. 10, 1530. doi:10.3389/fpsyg.2019.01530
Arghashi, V. (2022). Shopping with augmented reality: How wow-effect changes the equations. Electron. Commer. Res. Appl. 54, 101166. doi:10.1016/j.elerap.2022.101166
Arghashi, V., and Yuksel, C. A. (2022). Interactivity, Inspiration, and Perceived Usefulness! How retailers’ AR-apps improve consumer engagement through flow. J. Retail. Consumer Serv. 64, 102756. doi:10.1016/j.jretconser.2021.102756
Bonetti, F., Pantano, E., Warnaby, G., and Quinn, L. (2019). Augmenting reality: Fusing consumers' experiences and interactions with immersive technologies in physical retail settings. Int. J. Technol. Mark. 13, 260–284. doi:10.1504/IJTMKT.2019.104592
Bradley, M. M., and Lang, P. J. (1994). Measuring emotion: The self-assessment manikin and the semantic differential. Ther. Exp. Psychiatry 25, 49–59. doi:10.1016/0005-7916(94)90063-9
Brengman, M., Willems, K., and Van Kerrebroeck, H. (2018). “Can’t touch this: The impact of augmented reality versus touch and non-touch interfaces on perceived ownership,” in Virtual reality, 1–12. available at:. doi:10.1007/s10055-018-0335-6
Caboni, F., and Hagberg, J. (2019). Augmented reality in retailing: A review of features, applications and value. Int. J. Retail Distribution Manag. 47.
Carmigniani, J., Furht, B., Anisetti, M., Ceravolo, P., Damiani, E., and Ivkovic, M. (2011). Augmented reality technologies, systems and applications. Multimed. Tools Appl. 51, 341–377. doi:10.1007/s11042-010-0660-6
Childers, T. L., Carr, C. L., Peck, J., and Carson, S. (2001). Hedonic and utilitarian motivations for online retail shopping behavior. J. Retail. 77, 511–535. doi:10.1016/S0022-4359(01)00056-2
Chiu, C. L., Ho, H. C., Yu, T., Liu, Y., and Mo, Y. (2021). Exploring information technology success of augmented reality retail applications in retail food chain. J. Retail. Consum. Serv. 61, 102561. doi:10.1016/j.jretconser.2021.102561
Daassi, M., and Debbabi, S. (2021). Intention to reuse AR-based apps: The combined role of the sense of immersion, product presence and perceived realism. Inf. Manag. 58 (4), 103453. doi:10.1016/j.im.2021.103453
Daft, R. L., and Lengel, R. H. (1986). Organizational information requirements, media richness and structural design. Manag. Sci. 32 (5), 554–571. doi:10.1287/mnsc.32.5.554
Davis, F. D., Bagozzi, R. P., and Warshaw, P. R. (1989). User acceptance of computer technology: A comparison of two theoretical models. Manag. Sci. 35, 982–1003. doi:10.1287/mnsc.35.8.982
de Amorim, I. P., Guerreiro, J., Eloy, S., and Loureiro, S. M. C. (2022). How augmented reality media richness influences consumer behaviour. Int. J. Consumer Stud. 46 (6), 2351–2366. doi:10.1111/ijcs.12790
de Regt, A., and Barnes, S. J. (2019). “V-commerce in retail: Nature and potential impact,” in Augmented reality and virtual reality. Progress in IS. Editors M. tom Dieck, and T. Jung (Cham: Springer). doi:10.1007/978-3-030-06246-0_2
Dehghani, M., Lee, S. H., and Mashatan, A. (2020). Touching holograms with windows mixed reality: Renovating the consumer retailing services. Technol. Soc. 63, 101394.
Elboudali, A., Aoussat, A., Mantelet, F., Bethomier, J., and Leray, F. (2020). A customised virtual reality shopping experience framework based on consumer behaviour: 3DR3CO. Int. J. Interact. Des. Manuf. 14, 551–563. doi:10.1007/s12008-020-00645-0
Endsley, T. C., Sprehn, K. A., Brill, R. M., Ryan, K. J., Vincent, E. C., and Martin, J. M. (2017). “Augmented reality design heuristics: Designing for dynamic interactions,” in Proceedings of the human factors and ergonomics society annual meeting (Los Angeles, CA: Sage Publications), 61, 2100–2104. Sage CA.No. 1.
Fan, X., Chai, Z., Deng, N., and Dong, X. (2020). Adoption of augmented reality in online retailing and consumers’ product attitude: A cognitive perspective. J. Retail. Consum. Serv. 53, 101986. doi:10.1016/j.jretconser.2019.101986
Flavián, C., Ibáñez-Sánchez, S., and Orús, C. (2019). The impact of virtual, augmented and mixed reality technologies on the customer experience. J. Bus. Res. 100, 547–560. doi:10.1016/j.jbusres.2018.10.050
Friard, O., and Gamba, M. (2016). Boris: A free, versatile open-source event-logging software for video/audio coding and live observations. Methods Ecol. Evol. 7, 1325–1330. [Accessed April 2022]. doi:10.1111/2041-210X.12584
Garaus, M., Wagner, U., and Kummer, C. (2015). Cognitive fit, retail shopper confusion, and shopping value: Empirical investigation. J. Bus. Res. 68 (5), 1003–1011. doi:10.1016/j.jbusres.2014.10.002
Grand View Research (2020). Augmented reality market size, share and trends analysis report by component (hardware, software), by display (Head-Mounted display and smart glass, head-up display, handheld devices), by application, by region, and segment forecasts, 2022 - 2030. Available at: https://www.grandviewresearch.com/industry-analysis/augmented-reality-market.
Grewal, D., Noble, S. M., Roggeveen, A. L., and Nordfalt, J. (2020). The future of in-store technology. J. Acad. Mark. Sci. 48, 96–113. doi:10.1007/s11747-019-00697-z
Grewal, D., Roggeveen, A. L., and Nordfält, J. (2017). The future of retailing. J. Retail. 93, 1–6. doi:10.1016/j.jretai.2016.12.008
Hauser, J. R. (2014). Consideration-set heuristics. J. Bus. Res. 67 (8), 1688–1699. doi:10.1016/j.jbusres.2014.02.015
He, J., Choi, W., McCarley, J. S., Chaparro, B. S., and Wang, C. (2015). Texting while driving using Google Glass™: Promising but not distraction-free. Accid. Analysis Prev. 81, 218–229. doi:10.1016/j.aap.2015.03.033
Hertzum, M., and Holmegaard, K. D. (2013). Perceived time as a measure of mental workload: Effects of time constraints and task success. Int. J. Hum.-Comput. Interact. 29 (1), 26–39. doi:10.1080/10447318.2012.676538
Herz, M., and Rauschnabel, P. A. (2019). Understanding the diffusion of virtual reality glasses: The role of media, fashion and technology. Technol. Forecast. Soc. Change 138, 228–242. doi:10.1016/j.techfore.2018.09.008
Hilken, T., de Ruyter, K., Chylinski, M., Mahr, D., and Keeling, D. I. (2017). Augmenting the eye of the beholder: Exploring the strategic potential of augmented reality to enhance online service experiences. J. Acad. Mark. 45, 884–905.
Hoffmann, S., and Mai, R. (2022). Consumer behavior in augmented shopping reality. A review, synthesis, and research agenda. Front. Virtual Real 3, 961236. doi:10.3389/frvir.2022.961236
Hoffmann, S., Joerß, T., Mai, R., and Akbar, P. (2022). Augmented reality-delivered product information at the point of sale: When information controllability backfires. J. Acad. Mark. Sci. 50, 743–776. doi:10.1007/s11747-022-00855-w
Holdack, E., Lurie-Stoyanov, K., and Fromme, H. F. (2020). The role of perceived enjoyment and perceived informativeness in assessing the acceptance of AR wearables. J. Retail. Consumer Serv. 65, 102259. doi:10.1016/j.jretconser.2020.102259
Inman, J. J., and Nikolova, H. (2017). Shopper-facing retail technology: A retailer adoption decision framework incorporating shopper attitudes and privacy concerns. J. Retail. 93, 7–28. doi:10.1016/j.jretai.2016.12.006
Jaekel, B. (2016). Sephora's virtual artist brings augmented reality to large beauty audience. Luxury Daily. Available at: https://www.luxurydaily.com/sephoras-virtual-artist-brings-augmented-reality-to-largebeauty-audience (Accessed October 17, 2016).
Jain, S., Schweiss, T., Bender, S., and Werth, D. (2021). “Omnichannel retail customer experience with mixed-reality shopping assistant systems,” in Advances in visual computing. ISVC 2021 (Cham: Springer), 13017. Lecture Notes in Computer Science. doi:10.1007/978-3-030-90439-5_40
Jain, S., and Werth, D. (2019). “Current state of mixed reality technology for digital retail: A literature review,” in HCI in business, government and organizations. eCommerce and consumer behavior. HCII 2019. Editors F. F. H. Nah, and K. Siau (Cham: Springer), 11588. Lecture Notes in Computer Science. doi:10.1007/978-3-030-22335-9_2
Javaheri, H., Mirzaei, M., and Lukowicz, P. (2020). “How far can wearable augmented reality influence customer shopping behavior,” in MobiQuitous 2020-17th EAI international conference on mobile and ubiquitous systems: Computing (Networking and Services), 464–469.
Javornik, A. (2016). Augmented reality: Research agenda for studying the impact of its media characteristics on consumer behaviour. J. Retail. Consum. Serv. 30, 252–261. doi:10.1016/j.jretconser.2016.02.004
Jeffri, N. F. S., and Awang Rambli, D. R. (2021). A review of augmented reality systems and their effects on mental workload and task performance. Heliyon 7 (3), e06277. doi:10.1016/j.heliyon.2021.e06277
Jessen, A., Hilken, T., Chylinski, M., Mahr, D., Heller, J., Keeling, D. I., et al. (2020). The playground effect: How augmented reality drives creative customer engagement. J. Bus. Res. 116, 85–98. doi:10.1016/j.jbusres.2020.05.002
Joerß, T., Hoffmann, S., Mai, R., and Akbar, P. (2021). Digitalization as a solution to environmental problems? When users rely on augmented reality-recommendation agents. J. Bus. Res. 128, 510–523. doi:10.1016/j.jbusres.2021.02.019
Jones, M. A., Reynolds, K. E., and Arnold, M. J. (2006). Hedonic and utilitarian shopping value: Investigating differential effects on retail outcomes. J. Bus. Res. 59, 974–981. doi:10.1016/j.jbusres.2006.03.006
Kalantari, M. (2017). Consumers' adoption of wearable technologies: Literature review, synthesis, and future research agenda. Int. J. Technol. Mark. 12, 274–307. doi:10.1504/IJTMKT.2017.089665
Kalantari, M., and Rauschnabel, P. (2018). “Exploring the early adopters of augmented reality smart glasses: The case of Microsoft HoloLens,” in Augmented reality and virtual reality. Progress in IS. Editors T. Jung, and M. tom Dieck (Cham: Springer). doi:10.1007/978-3-319-64027-3_16
Kang, H. J., Shin, J. h., and Ponto, K. (2020). How 3D virtual reality stores can shape consumer purchase decisions: The roles of informativeness and playfulness. J. Interact. Mark. 49, 70–85. doi:10.1016/j.intmar.2019.07.002
Kazmi, S. H. A., Ahmed, R. R., Soomro, K. A., Hashem, E. A. R., Akhtar, H., and Parmar, V. (2021). Role of augmented reality in changing consumer behavior and decision making: Case of Pakistan. Sustainability 13 (24), 14064. doi:10.3390/su132414064
Kim, M., Choi, S. H., Park, K. B., and Lee, J. Y. (2019). User interactions for augmented reality smart glasses: A comparative evaluation of visual contexts and interaction gestures. Appl. Sci. 9 (15), 3171. doi:10.3390/app9153171
King, W. R., and He, J. (2006). A meta-analysis of the technology acceptance model. Inf. Manag. 43, 740–755. doi:10.1016/j.im.2006.05.003
Lavoye, V., Mero, J., and Tarkiainen, A. (2021). Consumer behavior with augmented reality in retail: A review and research agenda. Int. Rev. Retail, Distribution Consumer Res. 31 (3), 299–329. doi:10.1080/09593969.2021.1901765
Lecointre-Erickson, D., Daucé, B., and Legohérel, P. (2018). The influence of interactive window displays on expected shopping experience. Int. J. Retail Distrib. Manag. 46, 802–819. doi:10.1108/IJRDM-05-2017-0111
Lei, X., Tsai, Y.-L., and Rau, P.-L. P. (2022). Harnessing the visual salience effect with augmented reality to enhance relevant information and to impair distracting information. Int. J. Human–Computer Interact. 39, 1280–1293. doi:10.1080/10447318.2022.2062548
Libai, B., Bart, Y., Gensler, S., Hofacker, C. F., Kaplan, A., Kötterheinrich, K., et al. (2020). Brave new world? On AI and the management of customer relationships. J. Interact. Mark. 51, 44–56. doi:10.1016/j.intmar.2020.04.002
McFarland, D. J., and Hamilton, D. (2006). Adding contextual specificity to the technology acceptance model. Comput. Hum. Behav. 22, 427–447. doi:10.1016/j.chb.2004.09.009
McLean, G., and Wilson, A. (2019). Shopping in the digital world: Examining customer engagement through augmented reality mobile applications. Comput. Hum. Behav. 101, 210–224. doi:10.1016/j.chb.2019.07.002
Meegahapola, L., and Perera, I. (2017). “Enhanced in-store shopping experience through smart phone based mixed reality application,” in Seventeenth international conference on advances in ICT for emerging regions (ICTer) (Colombo, Sri Lanka, 1–8. doi:10.1109/ICTER.2017.8257810
Microsoft (2020). Hololens 2 web page info. Available at: https://www.microsoft.com/en-us/hololens (Accessed April, 2022).
Milgram, P., and Kishino, F. (1994). A taxonomy of mixed reality visual displays. IEICE Trans. Inf. Syst. 77 (12), 1321–1329.
Milgram, P. (2006). “Some human factors considerations for designing mixed reality interfaces,” in Virtual media for military applications (pp. KN1-1 – KN1-14). Meeting proceedings RTO-MP-HFM-136, keynote 1. Neuilly-sur-Seine (France: RTO).
Monteiro, P., Guerreiro, J., and Loureiro, S. M. C. (2020). Understanding the role of visual attention on wines’ purchase intention: An eye-tracking study. Int. J. Wine Bus. Res. 32, 161–179. doi:10.1108/IJWBR-03-2019-0017
Morozova, D., and Gurova, O. (2021). Being like others vs. being different: Wearable technology and daily practices of 50+ consumers in Russia and Finland. Int. J. Consumer Stud. 45 (6), 1335–1356. doi:10.1111/ijcs.12656
Morwitz, V. (2014). Consumers' purchase intentions and their behavior. Found. Trends Mark. 7, 181–230. doi:10.1561/1700000036
Nikhashemi, S. R., Knight, H. H., Nusair, K., and Liat, C. B. (2021). Augmented reality in smart retailing: A (n)(A) symmetric approachto continuous intention to use retail brands’ mobile AR apps. J. Retail. Consumer Serv. 60, 102464. doi:10.1016/j.jretconser.2021.102464
Olsson, T., Lagerstam, E., Kärkkäinen, T., and Väänänen-Vainio-Mattila, K. (2013). Expected user experience of mobile augmented reality services: A user study in the context of shopping centres. Pers. Ubiquitous Comput. 17, 287–304. doi:10.1007/s00779-011-0494-x
Omar, S., Mohsen, K., Tsimonis, G., Oozeerally, A., and Hsu, J. H. (2021). M-Commerce: The nexus between mobile shopping service quality and loyalty. J. Retail. Consum. Serv. 60, 102468. doi:10.1016/j.jretconser.2021.102468
Oyman, M., Bal, D., and Ozer, S. (2022). Extending the technology acceptance model to explain how perceived augmented reality affects consumers' perceptions. Comput. Hum. Behav. 128, 107127. doi:10.1016/j.chb.2021.107127
Pantano, E., and Di Pietro, L. (2012). Understanding Consumer&#8217;s acceptance of technology-based innovations in retailing. J. Technol. Manag. Innov. 7, 1–19. doi:10.4067/S0718-27242012000400001
Pantano, E., Rese, A., and Baier, D. (2017). Enhancing the online decision-making process by using augmented reality: A two country comparison of youth markets. J. Retail. Consum. 38, 81–95.
Park, M., and Yoo, J. (2020). Effects of perceived interactivity of augmented reality on consumer responses: A mental imagery perspective. J. Retail. Consum. Serv. 52, 101912. doi:10.1016/j.jretconser.2019.101912
Peukert, C., Pfeiffer, J., Meißner, M., Pfeiffer, T., and Weinhardt, C. (2019). Shopping in virtual reality stores: The influence of immersion on system adoption. J. Manag. Inf. Syst. 36, 755–788. doi:10.1080/07421222.2019.1628889
Plotkina, D., and Saurel, H. (2019). Me or just like me? The role of virtual try-onand physical appearance in apparel M-retailing. J. Retail. ConsumerServices 51, 362–377. doi:10.1016/j.jretconser.2019.07.002
Poushneh, A., and Vasquez-Parraga, A. Z. (2017). Discernible impact of augmented reality on retail customer's experience, satisfaction and willingness to buy. J. Retail. Consum. Serv. 34, 229–234. doi:10.1016/j.jretconser.2016.10.005
Rauschnabel, P. A., He, J., and Ro, Y. K. (2018). Antecedents to the adoption of augmented reality smart glasses: A closer look at privacy risks. J. Bus. Res. 92, 374–384. doi:10.1016/j.jbusres.2018.08.008
Rauschnabel, P. A., and Ro, Y. K. (2016). Augmented reality smart glasses: An investigation of technology acceptance drivers. Int. J. Technol. Mark. 11, 123–148. doi:10.1504/IJTMKT.2016.075690
Rejeb, A., Keogh, J. G., Leong, G. K., and Treiblmaier, H. (2021). Potentials and challenges of augmented reality smart glasses in logistics and supply chain management: A systematic literature review. Int. J. Prod. Res. 59, 3747–3776. doi:10.1080/00207543.2021.1876942
Rese, A., Baier, D., Geyer-Schulz, A., and Schreiber, S. (2017). How augmented reality apps are accepted by consumers: A comparative analysis using scales and opinions. Technol. Forecast. Soc. Change 124, 306–319. doi:10.1016/j.techfore.2016.10.010
Riar, M., Xi, N., Korbel, J. J., Zarnekow, R., and Hamari, J. (2022). Using augmented reality for shopping: A framework for AR induced consumer behavior, literature review and future agenda. Internet Res. doi:10.1108/INTR-08-2021-0611
Robertson, J., Ferreira, C., and Botha, E. (2018). The influence of product knowledge on the relative importance of extrinsic product attributes of wine. J. Wine Res. 29, 159–176. doi:10.1080/09571264.2018.1505605
Romano, B., Sands, S., and Pallant, J. I. (2021). Augmented reality and the customer journey: An exploratory study. Australas. Mark. J. 29 (4), 354–363. doi:10.1016/j.ausmj.2020.06.010
Scholz, J., and Smith, A. N. (2016). Augmented reality: Designing immersive experiences that maximize consumer engagement. Bus. Horiz. 59, 149–161. doi:10.1016/j.bushor.2015.10.003
Shankar, V., Kleijnen, M., Ramanathan, S., Rizley, R., Holland, S., and Morrissey, S. (2016). Mobile shopper marketing: Key issues, current insights, and future research avenues. J. Interact. Mark. 34, 37–48. doi:10.1016/j.intmar.2016.03.002
Skinner, E. A., Kindermann, T. A., Connell, J. P., and Wellborn, J. G. (2009). “Engagement and disaffection as organizational constructs in the dynamics of motivational development,” in Handbook of motivation at school. Editors K. R. Wenzel, and A. Wigfield (New York, NY, US: Routledge/Taylor and Francis Group), 223–245.
Sohn, D. (2011). Anatomy of interaction experience: Distinguishing sensory, semantic, and behavioral dimensions of interactivity. New Media Soc. 13 (8), 1320–1335.
Tan, Y. C., Chandukala, S. R., and Reddy, S. K. (2021). Augmented reality in retail and its impact on sales. J. Mark. 86, 48–66. doi:10.1177/0022242921995449
van Esch, P., Arli, D., Gheshlaghi, M. H., Andonopoulos, V., von der Heidt, T., and Northey, G. (2019). Anthropomorphism and augmented reality in the retail environment. J. Retail. Consumer Serv. 49, 35–42. doi:10.1016/j.jretconser.2019.03.002
Verhagen, T., Vonkeman, C., Feldberg, F., and Verhagen, P. (2014). Present it like it is here: Creating local presence to improve online product experiences. Comput. Hum. Behav. 39, 270–280. doi:10.1016/j.chb.2014.07.036
Vonkeman, C., Verhagen, T., and Van Dolen, W. (2017). Role of local presence in online impulse buying. Inf. Manag. 54 (8), 1038–1048. doi:10.1016/j.im.2017.02.008
Wang, R. J. H. (2020). Branded mobile application adoption and customer engagement behavior. Comput. Hum. Behav. 106, 106245. doi:10.1016/j.chb.2020.106245
Watson, A., Alexander, B., and Salavati, L. (2018). The impact of ExperientialAugmented reality applications on fashion purchase intention. Int. J. Retail Distribution Manag. 48, 433–451. doi:10.1108/IJRDM-06-2017-0117
Whang, J. B., Song, J. H., Choi, B., and Lee, J. H. (2021). The effect of aug-mented reality on purchase intention of beauty products: The roles of consumers’ control. J. Bus. Res. 133, 275–284. doi:10.1016/j.jbusres.2021.04.057
Xie, J., Chai, J. J., O’Sullivan, C., and Xu, J. L. (2022). Trends of augmented reality for agri-food applications. Sensors 22 (21), 8333. doi:10.3390/s22218333
Appendix A

Keywords: Mixed reality, interactivity, immersion, consumer behavior, smart glasses in retail, instore experience
Citation: Gil-López C, Guixeres J, Marín-Morales J, Torrecilla C, Williams E and Alcañiz M (2023) Is mixed reality technology an effective tool for retail? A vividness and interaction perspective. Front. Virtual Real. 4:1067932. doi: 10.3389/frvir.2023.1067932
Received: 12 October 2022; Accepted: 27 March 2023;
Published: 11 April 2023.
Edited by:
Florian Daiber, German Research Center for Artificial Intelligence (DFKI), GermanyReviewed by:
Federico Manuri, Polytechnic University of Turin, ItalyMichele Fiorentino, Politecnico di Bari, Italy
Copyright © 2023 Gil-López, Guixeres, Marín-Morales, Torrecilla, Williams and Alcañiz. This is an open-access article distributed under the terms of the Creative Commons Attribution License (CC BY). The use, distribution or reproduction in other forums is permitted, provided the original author(s) and the copyright owner(s) are credited and that the original publication in this journal is cited, in accordance with accepted academic practice. No use, distribution or reproduction is permitted which does not comply with these terms.
*Correspondence: Jaime Guixeres, amFpZ3VpcHJAaTNiLnVwdi5lcw==