 Ramy Kirollos
 Wasim Merchant
- Defence Research and Development Canada, Toronto Research Centre, Toronto, ON, Canada
Introduction: Defence Research and Development Canada is developing guidance on the use of Mixed Reality head-mounted displays for naval operations in the Royal Canadian Navy. Virtual reality head-mounted displays display graphics to the user in 3D and completely occlude the user’s view of the real world. Mixed Reality head-mounted displays overlay and integrate graphics onto the real world allowing the user to perceive the real world and rich 3D graphic elements simultaneously. Nausea and other debilitating symptoms caused by the use of head-mounted displays, known as ‘cybersickness’, is well documented during Virtual reality head-mounted display exposure and can be quite severe. However, it is not yet clear from the literature on Mixed Reality head-mounted displays whether CS differs in Virtual reality vs. Mixed Reality head-mounted displays. The objective of this study was to determine the impact of MR HMDs on CS.
Method: This was done by modulating the quantity of graphics in two Mixed Reality conditions and one Virtual reality condition. Only foreground objects were graphically rendered in the first Mixed Reality condition (called ‘Mixed Reality’ condition), while the entire scene was graphically rendered in the second Mixed Reality condition (called ‘Mixed Reality +’ condition). The Virtual reality condition simulated the Mixed Reality + condition but was displayed in a Virtual reality head-mounted display. Participants observed the virtually rendered scene in one of the three conditions and reported their CS with the simulator sickness questionnaire six times throughout the 30-min experiment. We hypothesized that CS severity would increase as quantity of graphics in the display increased.
Results and Discussion: Findings indicated that CS was significantly greater in the ‘Mixed Reality +’ condition compared to the ‘Mixed Reality’ and ‘Virtual reality’ conditions, providing partial evidence for our main hypothesis. Moreover, CS increased significantly and meaningfully after 25 min in the ‘Mixed Reality +’ condition. These findings indicate safe use of Mixed Reality head-mounted displays by the RCN for shore-based applications provided quantity of graphics is limited.
1 Introduction
Defence Research and Development Canada (DRDC) is developing guidance on the use of mixed reality (MR) head-mounted displays (HMDs) for naval operations within the Royal Canadian Navy (RCN). These MR HMDs can allow for enhanced and augmented visualization of the underwater battlespace while retaining user situational awareness of the physical world. Existing research on cybersickness (CS) focuses primarily on virtual reality (VR) HMDs; repeatedly showing that it can provoke sometimes severe CS, especially over extended use (Yildirim, 2019; Palmisano et al., 2020; Rebenitsch and Owen, 2021). However, less research has focused on CS in MR HMDs. The objective of the current study was to investigate the severity of CS in MR to advise the RCN on whether these HMDs are safe for operational naval use. This was done by modulating graphic quantity in an MR HMD, and comparing sickness scores across 2 MR conditions, and one VR condition.
1.1 Cybersickness in VR and MR HMDs
We define augmented reality (AR) as the display of virtual graphics overlaid onto the physical world. In VR, virtual graphics completely occlude the physical world. MR integrates virtual graphics with physical properties of the physical world, allowing interactive and integrated use of graphics. We use the term extended reality (xR) as an umbrella term encompassing VR, AR and MR (Milgram and Kishino, 1994; He et al., 2019; Kirollos and Harriott, 2021; XR Collaboration, 2021; Merchant and Kirollos, 2022).
Motion sickness (MS) is malaise characterized by vomiting, retching, pallor, sweating, nausea, ocular fatigue, incapacitation, discomfort, irritability and trouble communicating (Kennedy et al., 2010). The feeling of MS can arise in a variety of environments, and thus symptom and sign severity may vary slightly accordingly (Casali and Frank, 1986; Rebenitsch and Owen, 2016; Mittelstaedt et al., 2018; Bos et al., 2021). Airsickness, carsickness, seasickness and simulator sickness are some examples of the various types of MS resulting from different environments. There is debate on the definition of CS, and if it should be limited to sickness associated with head-fixed displays such as xR HMDs (Arcioni et al., 2018; Kirollos and Jarmasz, 2021), or if it should also include sickness from world-fixed displays such as 2D monitors and 3D stereoscopic projection systems (Kennedy et al., 2003; Gallagher and Ferrè, 2018). Here we define CS as a variation of MS that emerges from the use of xR HMDs specifically (Arcioni et al., 2018; Kirollos and Jarmasz, 2021).
1.2 Measuring cybersickness
There are many self-report, behavioural and physiological measures to index sickness susceptibility and sickness state (see Merchant and Kirollos (2022) for a recent review). Importantly, many physiological measures continue to be scrutinized for their reported unreliability in predicting or detecting sickness across individuals (Bos and Lawson, 2021). On the hand, self-report measures capture participant perceived sickness severity and ability to perform their duties–the most important consideration for use within military.
Motion sickness susceptibility methods are used to index past episodes of sickness. An example of this includes the motion sickness susceptibility questionnaire (MSSQ) (Golding, 1998; Golding, 2006). Some research has shown that scores from sickness susceptibility questionnaires correlate significantly with sickness state questionnaires, demonstrating that past sickness events can predict future sickness (Beadle et al., 2021; Golding et al., 2021).
Sickness state questionnaires determine how sick an individual is in their current state. Examples of sickness state questionnaires include the simulator sickness questionnaire (SSQ), the fast motion sickness scale (FMS) and the virtual reality sickness questionnaire (VRSQ) (Kennedy et al., 1993; Keshavarz and Hecht, 2011; Kim et al., 2018). Among all of them, the SSQ is the most well-established and well-validated sickness state questionnaire (Weech et al., 2019; Kemeny et al., 2020). The SSQ has a maximum total severity score (TS) of approximately 235 (Bimberg et al., 2020). The TS consists of three non-mutually exclusive subscales: nausea N), oculomotor discomfort O), and disorientation D).
1.3 Motion sickness theories
There are various theories attempting to explain, predict and reduce incidence of MS. The neural mismatch theory is the most accepted theory of motion sickness (Reason, 1978). It posits that MS occurs because of a sustained conflict between visual and vestibular inputs. Rest frame hypothesis (RFH) predicts that in the absence of a visually stable cue such as the horizon (i.e., the point at which the sky and the Earth’s surface appear to meet), MS becomes proportionally severe (Parker and Prothero, 2003). RFH is arguably related to the neural mismatch theory as it infers that a lack of cues for spatial orientation aggravates the visual-vestibular conflict (Hemmerich et al., 2020). However, when clear and reliable reference cues such as the horizon are present, MS can be far less severe as these provide relative spatial orientation cues to an observer.
The poison theory posits that signs and symptoms of MS are an evolutionary by-product of a toxin detection and expulsion mechanism (Treisman, 1977). Lastly, the postural instability theory suggests that MS can be predicted based on the difficulty in maintaining postural stability by an individual before MS occurs (Riccio and Stoffregen, 1991). Despite the attempts to explain, predict and mitigate MS and CS, there is no universally accepted theory or solution (Lawson, 2014).
1.4 Contributors to CS
Vergence-accommodation mismatch (VAM) is a visual conflict that contributes to CS (Hoffman et al., 2008). When viewing objects in nature, as the angle of the convergence of each eye approaches infinity, the lenses of each eye become proportionally convex to fixate far targets. Stereoscopic displays such as xR HMDs do not allow for vergence-accommodation, causing visual fatigue, and discomfort–factors associated with CS (Hoffman et al., 2008). Mitigating VAM in xR HMDs would involve physically altering the focal distances from the user’s head in order for the lens of the eyes to accommodate appropriately and match the depth of objects in the virtual scene. Alternatively, depth of field blurring is a method used to blur non-fixated objects to eliminate depth cues that may be in conflict with depth cues from a fixated object (Langbehn et al., 2016). A second known visual conflict contributing to CS is interpupillary distance (IPD) mismatches between the individual and HMD (Stanney et al., 2020). Stanney et al. (2020) demonstrated that IPD discrepancies between the individual and HMD significantly affect CS.
In addition to visual conflicts, visual-vestibular conflicts contribute to CS. For instance, delay between virtual head position and actual head position, and their corresponding visual display is termed motion-to-photon lag (Allison et al., 2001; Moss et al., 2011; Zhao et al., 2017). This delay creates a discrepancy in perceived head position between the visual and vestibular systems, which contributes to CS. Kim et al. (2020) found that CS scores were negligible (i.e., below a score of 1/20 on the FMS) in their native lag condition (∼4 m) for a VR HMD. Generally, native motion-to-photon lag of modern xR HMDs for yaw-axis head movement, the most common type of head movement, is becoming increasingly negligible (Kim et al., 2020).
A lack of rest frames (RFs), or fixed visual cues, is also a source of visual-vestibular conflict that contributes to CS. In MR HMDs, fixed visual cues of the physical world should serve as RFs as they act as stable orientation cues when displaying graphic content. Moro et al. (2017) compared the use of VR HMDs, MR HMDs and tablets as anatomy training tools. Participants reported higher symptoms of CS when using VR compared with MR HMDs and tablets. This finding is consistent with RFH because VR occludes the physical world completely and therefore provides no real-world RFs in contrast to MR HMDs where physical world RFs are visible. A caveat of Moro et al. (2017) is that the authors did not use a recognized measure of CS. Work by Kemeny et al. (2017); Cao et al. (2018); Hemmerich et al. (2020); Whittinghill et al. (2015) all found that the presence of RFs reduced symptoms of CS. Thus, CS is thought to be less severe in MR compared to VR because MR devices permit the user to perceive a physical reference cue (Lawson, 2005; Kuiper et al., 2019; Risi and Palmisano, 2019).
Van Benthem et al. (2021) identified a few studies demonstrating that CS was milder in MR than in VR during a review of CS in MR HMDs. However, a limited number of studies have reported specifically on CS in MR HMDs, and even fewer studies have focused on CS resulting from MR HMDs. The report by Van Benthem et al. concluded that studies using MR HMDs generally indicated less severe CS than studies employing VR HMDs.
1.5 Present study
We have identified a gap in the literature wherein the severity of CS in MR HMDs has not been directly investigated. Additionally, the relative difference in CS severity caused by VR HMDs and MR HMDs has not been directly investigated. To fill this research gap, we conducted an experiment using MR and VR HMDs to investigate how graphic quantity in these HMDs impact CS. Graphic element quantity was modulated in this experiment to determine its effect on CS. We evaluated CS in three conditions: two conditions employed an MR HMD, and one condition employed a VR HMD. In 1 MR condition, only foreground objects were graphically rendered. This was called the ‘MR’ condition and presented limited graphic elements. In the second MR condition, foreground and background objects were graphically rendered. This was the ‘MR+’ condition and was entirely graphically generated. The ‘MR+’ condition therefore simulates VR. In a third condition, a VR HMD was used to present graphic objects approximating the MR + condition. This was called the ‘VR’ condition.
1.6 Hypotheses
Our first hypothesis was that graphic quantity would directly impact CS severity, consistent with RFH. Therefore, we hypothesized that the MR condition would produce the lowest CS scores, while the MR+ and VR condition would produce higher CS scores. Our second hypothesis was that increased exposure times in the experiment would result in increased CS scores across all three conditions as many previous studies have found (Hemmerich et al., 2020; Jasper et al., 2020; Palmisano et al., 2020; Lawson et al., 2021; Porcino et al., 2021). Our third hypothesis was that individuals reporting severe motion sickness in the past would report more CS in the present study compared to participants that reported negligible motion sickness in the past. Some researchers have found a significant correlation between history of motion sickness and present CS (Beadle et al., 2021; Golding et al., 2021). We therefore hypothesized that participants with high motion sickness susceptibility questionnaire (MSSQ) scores would have high SSQ scores in the current experiment.
2 Materials and methods
2.1 Participants
Participants were healthy Canadian Armed Forces (CAF) members. Forty-one adults (Mage = 28, SDage = 9) participated in the study. Three participants were female. Participants wore their spectacles while wearing the MR or VR HMD. Participants were recruited from the 32 Brigade and Canadian Forces Environmental Medicine Establishment. All participants were briefed on the experiment and provided informed written consent to participate in the experiment. Participants were informed that they were free to withdraw from the study at any point during experimentation. Individuals were excluded from participating if they reported uncorrected vision, visual deficits, balance/vestibular disorders and neurological conditions assessed with a self-reporting questionnaire. Remuneration was provided to all participants. Three participants in the experiment were naval personnel. All participants completed the study.
2.2 Materials
An in-house application was developed in Unity (version 2019.2), a cross-platform game engine, created by Unity Technologies. The application generates visual stimuli for conditions of the experiment through custom scripts written in C#.
The Microsoft HoloLens 2 MR HMD displayed visual stimuli in the MR and MR + conditions. The HoloLens two can render graphics overlaid onto the physical environment and allows for viewing of virtual objects in 3D. This HMD has a native 1,440 × 936-pixel resolution per eye, 60 Hz refresh rate, and 43 horizontal by 29 vertical field of view (FOV), providing a 52 diagonal FOV per eye.
The Oculus Rift S VR HMD displayed visual stimuli in the VR condition. The Oculus Rift S completely occludes the physical environment to present an entirely graphically rendered scene to the user. This HMD has a native 1,280 × 1440-pixel resolution per eye, 80 Hz refresh rate, and a 102 diagonal FOV per eye.
2.3 Stimuli and conditions
A virtual office space was generated in Unity to match the physical dimensions of the experimental room: 2.72 × 6.62 × 2.57 m. Furniture such as a computer desk, a chair, shelves and portraits populated the virtual space. Figure 1 displays approximations of the stimuli used for all three conditions. The ‘MR’ condition displayed graphically generated foreground objects, such as furniture and portraits. Background objects such as the walls and ceiling were not represented graphically in the ‘MR’ condition. The ‘MR+’ condition displayed all objects in the MR condition as well as graphically rendered walls. The contents of the ‘MR+’ condition and the ‘VR’ condition were identical but presented in an MR HMD and a VR HMD, respectively. Participants were randomly assigned to one of the three conditions. FOV in all conditions across both HMDs was set to 43° horizontally by 29° vertically. Average framerate over the course of a 5-min block was calculated for each condition. The Hololens two rendered at approximately 60 frames per second (fps) in the MR and MR + condition and the Oculus Rift S rendered at approximately 80 fps in the VR condition.
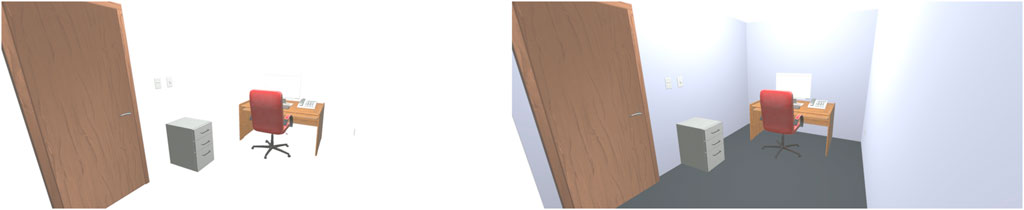
FIGURE 1. Simplified approximations of the MR condition (left), and the MR + and VR conditions (right).
2.4 Design
This experiment had a mixed factors design. The between-subjects factor was visual condition with three levels: VR, MR and MR+. The within-subjects factor was time, with six-levels: time 1–6. Each within-subjects level represents a 5-min increase in exposure time for a maximum of 25-min. Time one represents the baseline assessment, prior to exposure, while time six represents the final assessment after the last exposure. The primary dependent variable was CS severity, indexed with the SSQ (Kennedy et al., 1993).
2.5 Measures
2.5.1 Visual assessment tests
The Random Dot Stereo Acuity Test (Stereo Optical Company Inc, Stereo Acuity Test Version 2012) was used to assess stereoacuity in all participants. IPD was also measured using the Reichert PDM Digital PD Meter prior to experimentation (Model #15020).
2.5.2 Demographic questionnaire
The demographic questionnaire recorded each participant’s sex, age, experience aboard Navy vessels, video game and simulator experience, recent use of any substance that can impact nausea (e.g., anti-nauseogenics, medications, alcohol, and recreational drugs), history of neurological and vestibular disorders as well as any visual impairments.
2.5.3 Motion sickness susceptibility questionnaire
The short form of the MSSQ (Golding, 2006) was used to measure participant susceptibility to MS. The MSSQ was administered prior to experimentation to capture previous experiences with MS when using different modes of transportation (e.g., car, roller coaster) both as a child and as an adult. Participants rated each transportation item on a scale of zero (never got sick) to three (often got motion sick) on the MSSQ.
2.5.4 Simulator sickness questionnaire
The SSQ (Kennedy et al., 1993) contains 16 symptoms (e.g., nausea, fatigue, discomfort). The intensity of each symptom is rated on a four-point Likert scale (not at all = 0, mild = 1, moderate = 2, and severe = 3). The SSQ is comprised of three subscales to measure the three most common symptoms of motion sickness: Nausea N), Oculomotor Discomfort O), and Disorientation D). The TS is computed as the weighted average of the sum of these three subscale scores, multiplied by a constant value (see Kennedy et al. (1993); Merchant and Kirollos (2022) for details on the SSQ).
2.6 Procedure
Upon arrival at the lab, participants first provided informed consent. Participants completed the demographic questionnaire, the MSSQ and the baseline SSQ. Experimenters measured participant IPD and stereoacuity. Participants were then set-up in either the HoloLens two if assigned the ‘MR’ or ‘MR+’ conditions, or the Rift S if assigned the ‘VR’ condition. The experimenter confirmed the correct fit and placement of either device on the participant’s head, followed by a calibration of IPD. The lights of the experimental room were dimmed to approximately 2.5 Lux for the duration of the experiment (Extech Instruments Light Meter, LT300).
After configuration and calibration of either the HoloLens two or the Rift S, a 30-s practice session took place to familiarize participants with the required task. The first of five, 5-min blocks then began. In all conditions, participants viewed a virtual representation of the office room depicted in Figure 1. They were required to make yaw-axis head movements to the left-and-right every 3s while seated. The sound of a metronome generated by the HMD every 3s cued participants to make the angular yaw-axis movements with their heads, from shoulder-to-shoulder repeatedly as shown in Figure 2. Participants were instructed to look at the virtual objects within the scene that were aligned with their head orientation throughout the task. This task was chosen as it closely replicates the visual scanning and head movements pattern that would be required by users in the RCN.
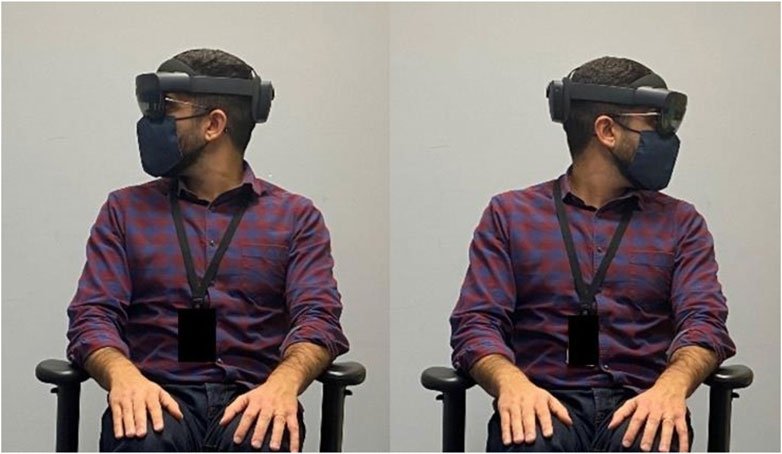
FIGURE 2. Depiction of the experimental task. Participants were seated while observing the visual stimuli within the HMD and turning their head left-to-right at the 3-s constant interval of an auditory cue.
The SSQ was administered via paper and pen at the end of each block during a 1-min break. Overall, six SSQ questionnaires were administered to each participant. The experimental procedure is outlined in Figure 3.
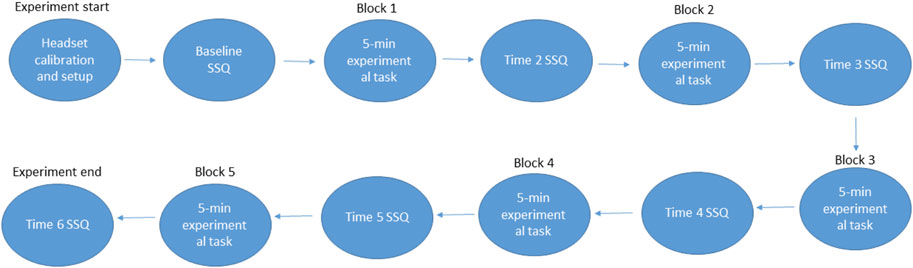
FIGURE 3. Summary of experimental procedure.
3 Results
3.1 Data analysis
Kruskal–Wallis tests exploring the effect of condition (MR, MR+, and VR) were performed on SSQ TS scores. Post-hoc analyses were performed using the Dunn’s test with a Bonferroni correction for multiple comparisons to determine significance between condition groups. Effect sizes for each comparison were measured using Epsilon squared (ℇ2) (Tomczak and Tomczak, 2014).
Friedman tests exploring the impact of exposure duration on SSQ TS scores were also performed. Post-hoc analyses were performed using the Wilcoxon Signed Rank Test with a Bonferroni correction to determine significance between time points. Effect sizes for each comparison were measured using Kendall’s W W) (Rea and Parker, 2014). The relationships between motion sickness susceptibility, stereoacuity, IPD and cybersickness were evaluated using Spearman’s and Pearson correlations where appropriate.
3.2 Between-subjects analyses on SSQ TS scores
A Kruskal–Wallis test was performed to compare SSQ TS scores across all three conditions within a respective block from times 2–6, totaling five Kruskal–Wallis tests. For instance, one Kruskal–Wallis test compared MR (time #2), MR+ (time #2), and VR (time #2) to determine if there was any significant difference between TS scores of each condition in the second block of the experiment. Data for these analyses are displayed in Figure 4.
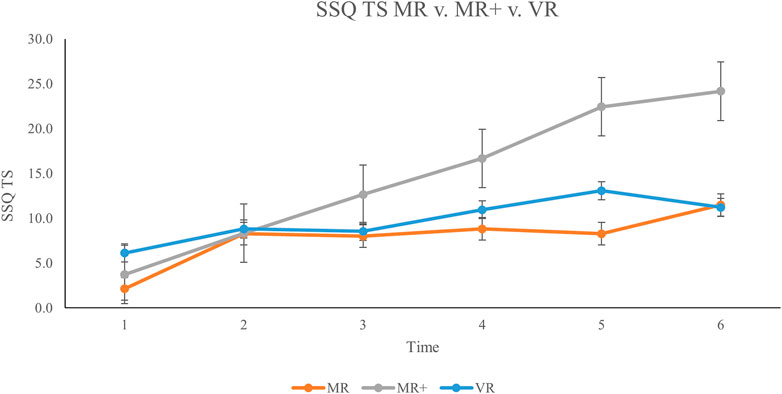
FIGURE 4. Mean TS scores across all participants from baseline (Time #1) to experiment completion (Time #6). Error bars represent standard error rates.
Findings indicated a significant difference in TS scores for time #5: H 2) = 7.135, p = 0.028, ℇ2 = 0.178. This demonstrates a strong effect size according to Rea & Parker (2014). A Dunn’s post hoc comparison was carried out for the three pairs of groups (MR–MR+, MR+—VR+, VR–MR) for time #5. There was a significant difference (p < 0.05, adjusted for Bonferroni correction) between the MR and MR + groups at time #5. The remaining two comparisons were not significant (p > 0.05).
3.3 Within-subjects analyses on SSQ TS scores
To assess the impact of exposure duration on SSQ TS scores, a within-subject analysis was conducted to analyze the difference in SSQ scores within each respective condition. Three Friedman’s tests were conducted on the MR, MR+ and VR data separately.
Findings indicated a significant difference in TS scores across times one to six in the MR condition W) X2 (14) = 14.730, p < 0.05, W = 0.210. According to Rea & Parker (2014), this represents a fair effect size. A post hoc Wilcoxon Signed Rank Test with a Bonferroni correction was used to compare scores from all six time-points. As such, 15 pairwise comparisons were conducted. After employing the Bonferroni correction (adjusted p-value cut-off = 0.05/15 = 0.0033), results suggested no significant differences between SSQ TS scores within the MR condition.
The Friedman test comparing times one to six in the MR + condition also indicated a significant difference W), X2 (13) = 32.487, p < 0.001, W = 0.500. According to Rea and Parker (2014), this result represents a strong effect size. A post hoc Wilcoxon Signed Rank Test with a Bonferroni correction was used to compare TS scores from all six time-points in the MR + condition. After employing a Bonferroni correction (adjusted p-value cut off = 0.05/15 = 0.0033), results suggested a significant difference in TS scores between time #1 and time #5 (p = 0.002). There were no significant differences between SSQ TS scores in the VR condition.
3.4 SSQ subscales: N, O and D scores
Across the MR, MR+ and VR conditions, the SSQ scores were separated into their respective subscales of Nausea N), Oculomotor Discomfort O), and Disorientation D). SSQ score for each subscale, across all three conditions is displayed in Figure 5; Figure 6; Figure 7, respectively. This analysis was done in order to 1) determine any difference in symptom profile within a respective condition, and 2) determine any difference in symptom profile across the three conditions.
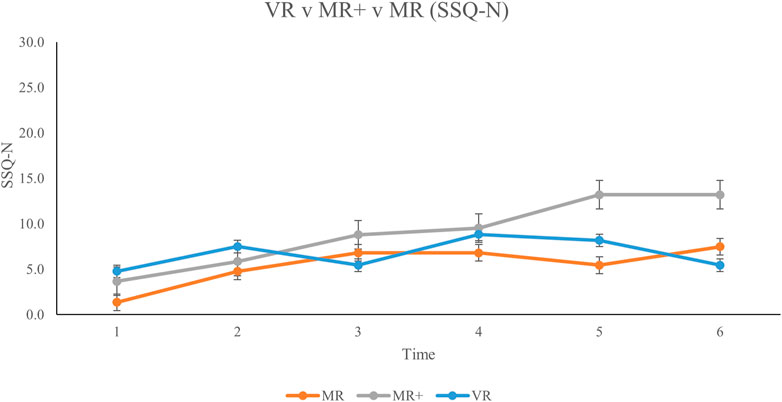
FIGURE 5. Mean Nausea subscale scores for all participants from baseline (Time #1) to experiment completion (Time #6). Error bars represent standard error rates.
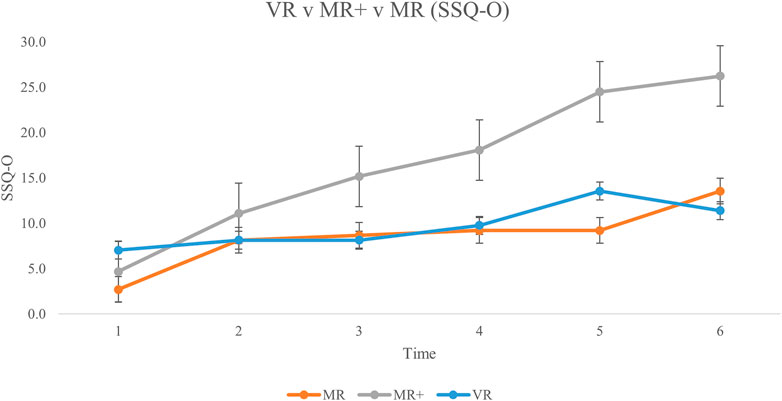
FIGURE 6. Mean Oculomotor Discomfort subscale scores for all participants from baseline (Time #1) to experiment completion (Time #6). Error bars represent standard error rates.
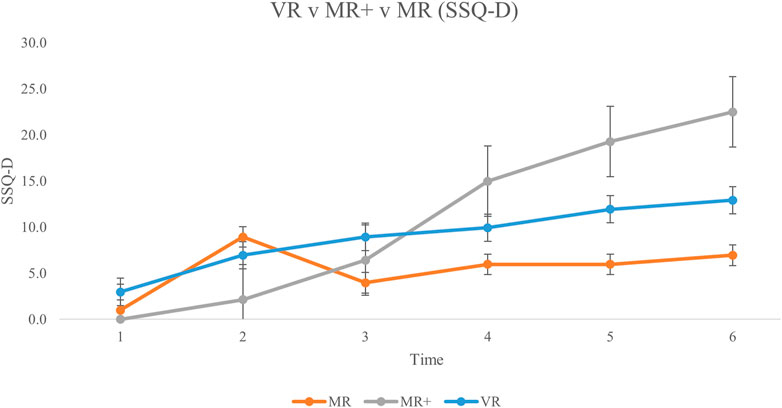
FIGURE 7. Mean Disorientation subscale scores for all participants from baseline (Time #1) to experiment completion (Time #6). Error bars represent standard error rates.
Friedman tests were conducted to compare the average N, O and D subscale scores for each participant across all six SSQs in each condition separately. None of the comparisons were significant (MR: X (14) = 2.579, p = 0.275; MR+: X (13) = 5.692, p = 0.058; VR: X (14) = 0.760, p = 0.684). Kruskal–Wallis tests were then conducted to compare the average N, O and D subscale scores across the three conditions. There were no significant differences in the average subscale score across the different conditions (N: H 2) = 1.496, p = 0.473; O: H 2) = 3.499, p = 0.174; D: H 2) = 0.168, p = 0.919).
3.5 Correlation between MSSQ and SSQ scores
A Spearman correlation was performed to determine if there was a relationship between history of motion sickness (total MSSQ) and CS in the current experiment (mean SSQ TS scores). For all conditions, there were no significant interactions between MSSQ, and average TS scores (p > 0.05). Each condition was examined separately (MR: ρ (14) = 0.084, p = 0.776; MR+: ρ (13) = 0.065, p = 0.832; VR: ρ (14) = 0.048, p = 0.869).
3.6 Effect of stereoacuity on SSQ scores
Stereoacuity measures were categorized into ‘good’ stereoacuity (≤ 25 arc sec (“)) (M = 12.5, SD = 13.7, n = 20) vs. ‘bad’ stereoacuity (>25 arc sec (“)) (M = 8.9, SD = 9.9, n = 21) approximating categorizations by Deepa et al. (2019). A Kruskal–Wallis test comparing TS for these two groups found no significant difference, H 1) = .443, p = .506. Further to this, a Spearman correlation test comparing stereoacuity (M = 120.9″, SD = 216.8″) and mean TS scores (M = 10.9, SD = 11.9) yielded no significant difference, ρ (41) = .049, p = .759. We investigated the relationship between participant IPD (M = 63.7 mm, SD = 3.5 mm) and stereo acuity (M = 120.9″, SD = 216.8”) with a Pearson correlation. There was no significant relationship between the two measures, r (41) = .019, p = .907.
4 Discussion
A literature review investigating AR and MR human factors and safety considerations by Van Benthem et al. (2021) indicated that the impact of MR HMD use on CS had not been directly examined. The limited research on this topic suggested that MR HMDs generally produce minimal CS. Based on that report, there has not been a thorough analysis thus far on CS with MR HMDs. Here we have directly examined the impact of MR HMD use on CS and further expanded findings by Van Benthem and others indicating that MR HMDs can produce CS when the visual display is saturated with 3D graphics.
4.1 Impact of extended reality condition on cybersickness (hypothesis 1)
The primary objective of this experiment was to determine the impact of MR HMDs on CS. We did so by varying the quantity of graphically rendered objects in an MR HMD and comparing findings to CS in VR HMDs. A mixed design was used whereby participants completed one of the three conditions to prevent potential adaptation effects when exposed to a similar display and protocol across multiple sessions (Howarth and Hodder, 2008; Beadle et al., 2021). We found significant differences in TS scores between time #5 in the MR condition and time #5 in the MR + condition with a relatively strong effect size. MR + TS scores were higher than MR TS scores in all blocks (Figure 4). Results comparing SSQ TS scores in the MR vs MR + conditions are partially consistent with our hypothesis that MR + scores would be greater than MR scores. These results indicate that generating 3D graphic scenes that occupy the entire visual scene in MR HMDs produce greater CS than when there are limited graphics presented. Based on these findings, the amount of graphically rendered elements in MR HMDs should be limited to mitigate CS.
We hypothesized that TS scores would increase as a function of quantity of graphically rendered elements within the participant’s FOV. In other words, we predicted the MR+ and VR conditions to have the highest TS scores, followed by the MR condition. However, we only found partial evidence supporting this hypothesis as the MR + condition showed higher scores than the MR and the VR conditions. Though every attempt was made at keeping the VR and MR + condition identical, including controlling FOV, recruiting participants from the same pool, consistent task, stimuli, procedures and measures, checking that motion-to-photon lag was negligible and that framerates were consistent and similar throughout the experiment and across conditions - the HMDs are different and thus may have resulted in some unforeseen variability. For instance, framerates for the Hololens two were consistent across the MR and MR + condition at approximately 60 fps. However, framerates for the Oculus Rift S in the VR condition was approximately 80 fps, likely contributing to the associated lower TS scores relative to the MR + condition (Jennings et al., 2004).
According to Kennedy et al. (2003), a TS score greater than 20 on the SSQ is indicative of a ‘problem simulator’ and should be avoided. TS scores of 15–20 suggest that symptoms are concerning, scores of 10–15 are significant symptoms while anything below that is considered to be of negligible concern (Kennedy et al., 2003). This criterion is especially relevant in assessing the military population wherein warfighters dependant on MR HMDs must perform duties while cybersick. Our results in the MR + condition indicate that peak mean TS scores exceeded 20 after the fifth experimental block (Figure 3). In contrast, at time #6, the TS mean score for the MR condition was below 11.5. Based on these findings, we conclude that MR HMDs are safe for use if there are only limited graphics displayed.
4.2 Impact of exposure time on cybersickness (hypothesis 2)
The second objective of this experiment was to determine the impact of duration on CS during MR HMD use. Findings from the MR + condition indicated that SSQ TS scores increased significantly over exposure time, with TS scores exceeding 20. This supports the notion that saturating the MR HMD with graphics can produce severe CS over time. Results in the MR condition with limited graphics were significant, though Bonferroni correction in the post hoc analyses could not reveal the specific comparison(s). Critically, CS scores remained low according to criteria in Kennedy et al. (2010), and the MR condition did not produce severe CS over prolonged use. Many studies have reported on the use of VR HMDs and have indicated that CS severity increases as a function of time, consistent with our findings in the MR + condition (Hemmerich et al., 2020; Jasper et al., 2020; Palmisano et al., 2020; Lawson et al., 2021; Porcino et al., 2021) but not consistent with our findings in the VR condition. Most of these studies report peak CS within 10–15 min of exposure. In the current study however, participants used the MR HMD for a total of 25 min and results indicated that CS increased significantly and meaningfully over the 25-min session in the MR + condition. Based on these findings, we recommend use of MR HMDs with limited graphic elements for up to 25 min, and further anticipate longer durations of use to be acceptable.
4.3 Impact of past sickness on cybersickness (hypothesis 3)
Recently, Beadle et al. (2021) and Golding et al. (2021) found significant positive correlations between MSSQ scores and SSQ TS scores. These findings make sense as they suggest that participants with a history of MS were most likely to feel sick using VR HMDs. Thus, we performed a correlational analysis on MSSQ data and SSQ TS data to replicate these findings but did not find a significant correlation between the two measures. Our findings indicate no evidence for a relationship between past MS and present CS with MR or VR HMDs.
4.4 Discussion of SSQ subscales, stereoacuity, VAM and IPD
Stanney et al. (2003) compared SSQ subscale scores in simulators and VR HMDs. They found that VR HMDs produced greater scores on the D subscale than the N and O subscales. They also found that participants in simulators had greater O subscale scores than N and D subscale scores. We compared SSQ subscales N, O and D to determine if MR HMDs provide a distinct symptom profile in contrast to our VR condition, and to compare with Stanney et al.‘s findings. Although the MR + condition had greater scores for each subscale on average, these differences were not significant. This allows us to conclude that the use of MR HMDs does not produce a distinct CS symptom profile from VR HMDs.
Arcioni et al. (2018) findings suggest that stereoacuity does not appear to influence CS. We categorized participants into two groups: ‘good’ (less than 25″) and ‘bad’ (greater than 25”) stereoacuity (approximating Deepa et al. (2019) stereoacuity categorization) to explore the impact of stereoacuity on CS. SSQ TS scores were compared for both groups but did not produce a significant relationship. Our findings therefore support those by Arcioni et al. that stereoacuity does not appear to influence CS.
Luu et al. (2021) indicated that participant with stereopsis experience more severe CS than participants without stereopsis (consistent with Palmisano et al. (2019)). This may initially appear to contrast our current findings in which ‘good’ and ‘bad’ stereoacuity did not affect CS. However, some important differences exist between the current study and Luu et al. (2021). First, stereopsis which was investigated in Luu et al. (2021) is the ability to perceive in depth. This differs from stereoacuity, which is a measure of how well one can perceive in depth. Second, Luu et al. (2021) showed a correlation between vection and indexed sickness. Therefore, it is not clear, if vection resulted in CS, which has been sometimes linked to CS, or if stereopsis solely contributed to increased sickness. Third, the authors do not mention if an adjustment to the FOV in their monocular vs stereopsis condition was made, as larger FOVs typically produce more severe CS than smaller FOVs (Lin et al., 2002). Fourth, Luu et al. used a VR HMD in their respective study, in contrast to the current study where both VR and MR HMDs were used, creating a challenge in comparing results. A final difference between our study and Luu et al. is that Luu et al. employed the FMS to index CS, whereas the current study used the SSQ.
Hoffman et al. (2008) developed a scale to assess fatigue from VAM. Some of the questions on this scale deal directly with ocular fatigue and headache, thereby overlapping with questions in the SSQ. However, Hoffman et al. do not report directly on CS or any form of MS. We have not come across any research that directly investigated the relationship between any form of MS and VAM. This is likely because VAM is difficult to isolate and measure since it requires continuous altering of the headset’s focal distance, which is unsuitable with commercial off-the-shelf HMDs. In the current experiment, VAM was not isolated as it was not our primary research interest. However, it is plausible that the MR+ and VR conditions that have more virtually rendered elements, and therefore more depth cues create more conflict (i.e., VAM) and greater sickness than the MR condition. Based on our findings and the current literature, the relationship between VAM, stereoacuity and CS is unclear.
We were also interested in determining any correlation between IPD and stereoacuity. Some research has shown a relationship between IPD and stereoacuity where greater IPDs are associate with better stereoacuity (Aslankurt et al., 2013; Eom et al., 2013). This makes sense, as a greater separation between the two eyes should yield stronger disparity between the left and right retinal image, and thus, greater depth perception. However, one study demonstrated that smaller IPD results in better stereoacuity (Shafiee et al., 2014) and two studies demonstrated that IPD had no impact on stereoacuity (Mai and Schlueter, 2010; Arcioni et al., 2018). In the current study, there was no significant relationship between IPD and stereoacuity, consistent with findings by Arcioni et al. (2018) and Mai and Schlueter (2010) although we acknowledge that stereoacuity measures in our study were large and variable. These findings taken together led us to conclude that the relationship between IPD, stereoacuity and CS is unclear.
5 Conclusion
The objective of the current study was to understand the characteristics of CS in MR HMDs. We modulated the quantity of graphically rendered elements in the Microsoft HoloLens two and Oculus Rift S while indexing sickness six times throughout exposure. Results showed that the addition of graphic elements in an MR HMD significantly and meaningfully increased CS over time compared to low-graphic MR HMD condition and a VR HMD condition. Overall exposure time was also a contributing factor to increased sickness. These results demonstrate that limiting graphics in an MR HMD can allow for safe use over periods of 25 min or greater for shore-based applications by the RCN. A future planned experiment will test the MR condition at sea to determine whether MR HMDs can be safely used aboard Navy vessels.
Data availability statement
The raw data supporting the conclusions of this article will be made available by the authors, without undue reservation.
Ethics statement
The studies involving human participants were reviewed and approved by Human Research Ethics Board—DRDC. The patients/participants provided their written informed consent to participate in this study.
Author contributions
RK contributed to the conception and design of the experiment, data collection, writing of the original and revised version of the manuscript, and formatting of the manuscript. WM contributed to data collection, data analysis, revision, editing and formatting of the manuscript.
Funding
Funding was provided internally by DRDC Toronto.
Acknowledgments
The authors would like to thank Chris Apostoli for developing the experimental conditions, Elaine Maceda and Captain Igor Da Silva for their assistance with participant recruitment, the participants from 32 Brigade and Canadian Forces Environmental Medicine Establishment for their time in completing this experiment and Tania Randall for her scientific input and guidance throughout this experiment.
Conflict of interest
The authors declare that the research was conducted in the absence of any commercial or financial relationships that could be construed as a potential conflict of interest.
Publisher’s note
All claims expressed in this article are solely those of the authors and do not necessarily represent those of their affiliated organizations, or those of the publisher, the editors and the reviewers. Any product that may be evaluated in this article, or claim that may be made by its manufacturer, is not guaranteed or endorsed by the publisher.
References
Allison, R. S., Harris, L. R., Jenkin, M., Jasiobedzka, U., and Zacher, J. E. (2001). “Tolerance of temporal delay in virtual environments,” in Proceedings IEEE Virtual Reality 2001, Yokohama, Japan, 13-17 March 2001.
Arcioni, B., Palmisano, S., Apthorp, D., and Kim, J. (2018). Postural stability predicts the likelihood of cybersickness in active HMD-based virtual reality. Displays 58, 3–11. doi:10.1016/j.displa.2018.07.001
Aslankurt, M., Aslan, L., Aksoy, A., Özdemir, M., and Dane, Ş. (2013). Laterality does not affect the depth perception, but interpupillary distance. J. Ophthalmol. 2013, 1–5. doi:10.1155/2013/485059
Beadle, S. C., Muth, E. R., and Pagano, C. C. (2021). Using head-mounted displays to examine adaptation and calibration under varying perturbations. Displays 66, 101985. doi:10.1016/j.displa.2020.101985
Bimberg, P., Weissker, T., and Kulik, A. (2020). “On the usage of the simulator sickness questionnaire for virtual reality research,” in 2020 IEEE conference on virtual reality and 3D user interfaces abstracts and workshops (VRW), Atlanta, GA, USA, 22-26 March 2020 (IEEE), 464–467.
Bos, J. E., Lawson, B. D., Allsop, J., Rigato, P., and Secci, S. (2021). “Introduction. Guidelines for mitigating cybersickness in virtual reality systems,” in Peer-reviewed final report of the human factors and medicine panel/modeling and simulations group. Activity Number 323, NATO STO-TR-HFM-MSG-323.
Bos, J. E., and Lawson, B. D. (2021). “Chapter 4: Symptoms and measurement. Guidelines for mitigating cybersickness in virtual reality systems,” in Peer-reviewed final report of the human factors and medicine panel/modeling and simulations group. Activity Number 323, NATO STO-TR-HFM-MSG-323.
Cao, Z., Jerald, J., and Kopper, R. (2018). “Visually-induced motion sickness reduction via static and dynamic rest frames,” in 2018 IEEE Conference on Virtual Reality and 3D User Interfaces (VR), Tuebingen/Reutlingen, Germany, 18-22 March 2018 (IEEE), 105–112.
Casali, J. G., and Frank, L. H. (1986). Perceptual distortion and its consequences in vehicular simulation: Basic theory and incidence of simulator sickness. Transp. Res. Rec. 1059, 57–65.
Deepa, B., Valarmathi, A., and Benita, S. (2019). Assessment of stereo acuity levels using random dot stereo acuity chart in college students. J. Fam. Med. Prim. care 8, 3850. doi:10.4103/jfmpc.jfmpc_755_19
Eom, Y., Song, J.-S., Ahn, S.-E., Kang, S.-Y., Suh, Y.-W., Oh, J., et al. (2013). Effects of interpupillary distance on stereoacuity: The frisby davis distance stereotest versus a 3-dimensional distance stereotest. Jpn. J. Ophthalmol. 57, 486–492. doi:10.1007/s10384-013-0253-9
Gallagher, M., and Ferrè, E. R. (2018). Cybersickness: A multisensory integration perspective. Multisensory Res. 31, 645–674. doi:10.1163/22134808-20181293
Golding, J. F. (2006). Motion sickness susceptibility. Aut. Neurosci. 129, 67–76. doi:10.1016/j.autneu.2006.07.019
Golding, J. F. (1998). Motion sickness susceptibility questionnaire revised and its relationship to other forms of sickness. Brain Res. Bull. 47, 507–516. doi:10.1016/s0361-9230(98)00091-4
Golding, J. F., Rafiq, A., and Keshavarz, B. (2021). Predicting individual susceptibility to visually induced motion sickness by questionnaire. Front. Virtual Real. 2, 3. doi:10.3389/frvir.2021.576871
He, Z., Sui, X., Jin, G., and Cao, L. (2019). Progress in virtual reality and augmented reality based on holographic display. Appl. Opt. 58, A74–A81. doi:10.1364/ao.58.000a74
Hemmerich, W., Keshavarz, B., and Hecht, H. (2020). Visually induced motion sickness on the horizon. Front. Virtual Real. 1, 30. doi:10.3389/frvir.2020.582095
Hoffman, D. M., Girshick, A. R., Akeley, K., and Banks, M. S. (2008). Vergence–accommodation conflicts hinder visual performance and cause visual fatigue. J. Vis. 8 (3), 33–30. doi:10.1167/8.3.33
Howarth, P. A., and Hodder, S. G. (2008). Characteristics of habituation to motion in a virtual environment. Displays 29, 117–123. doi:10.1016/j.displa.2007.09.009
Jasper, A., Cone, N., Meusel, C., Curtis, M., Dorneich, M. C., and Gilbert, S. B. (2020). Visually induced motion sickness susceptibility and recovery based on four mitigation techniques. Front. Virtual Real. 1, 22. doi:10.3389/frvir.2020.582108
Jennings, S., Reid, L. D., Craig, G., and Kruk, R. (2004). Time delays in visually coupled systems during flight test and simulation. J. Aircr. 41, 1327–1335. doi:10.2514/1.449
Kemeny, A., Chardonnet, J.-R., and Colombet, F. (2020). Getting rid of cybersickness. Switzerland: Springer Nature.
Kemeny, A., George, P., Mérienne, F., and Colombet, F. (2017). New vr navigation techniques to reduce cybersickness. Electron. Imaging 29, 48–53. doi:10.2352/issn.2470-1173.2017.3.ervr-097
Kennedy, R. S., Drexler, J., and Kennedy, R. C. (2010). Research in visually induced motion sickness. Appl. Ergon. 41, 494–503. doi:10.1016/j.apergo.2009.11.006
Kennedy, R. S., Drexler, J. M., Compton, D. E., Stanney, K. M., Lanham, D. S., and Harm, D. L. (2003). “Configural scoring of simulator SicknessCybersickness and space adaptation syndrome: Similarities and differences,” in Virtual and adaptive environments: Applications, implications, and human performance issues, 247.
Kennedy, R. S., Lane, N. E., Berbaum, K. S., and Lilienthal, M. G. (1993). Simulator sickness questionnaire: An enhanced method for quantifying simulator sickness. Int. J. Aviat. Psychol. 3, 203–220. doi:10.1207/s15327108ijap0303_3
Keshavarz, B., and Hecht, H. (2011). Axis rotation and visually induced motion sickness: The role of combined roll, pitch, and yaw motion. Aviat. space, Environ. Med. 82, 1023–1029. doi:10.3357/asem.3078.2011
Kim, H. K., Park, J., Choi, Y., and Choe, M. (2018). Virtual reality sickness questionnaire (VRSQ): Motion sickness measurement index in a virtual reality environment. Appl. Ergon. 69, 66–73. doi:10.1016/j.apergo.2017.12.016
Kim, J., Luu, W., and Palmisano, S. (2020). Multisensory integration and the experience of scene instability, presence and cybersickness in virtual environments. Comput. Hum. Behav. 113, 106484. doi:10.1016/j.chb.2020.106484
Kirollos, R., and Harriott, M. (2021). “Virtual reality to mixed reality graphic conversion in unity,” in International Conference on Human-Computer Interaction, Springer, Cham, 06 November 2021. Springer.
Kirollos, R., and Jarmasz, J. (2021). Safety considerations for the land vehicle crew training system (LVCTS): An analysis of the literature. Ottawa, Canada: Defence Research and Development Canada. DEFENCE, D. O. N. (ed.).
Kuiper, O. X., Bos, J. E., and Diels, C. (2019). Vection does not necessitate visually induced motion sickness. Displays 58, 82–87. doi:10.1016/j.displa.2018.10.001
Langbehn, E., Raupp, T., Bruder, G., Steinicke, F., Bolte, B., and Lappe, M. (2016). “Visual blur in immersive virtual environments: Does depth of field or motion blur affect distance and speed estimation?,” in Proceedings of the 22nd ACM Conference on Virtual Reality Software and Technology, Munich, Germany, November 2 - 4, 2016 (New York, NY: ACM), 241–250.
Lawson, B. D., Proietti, P., Burov, O., Sjölund, P., Rodabaugh, T., Kirollos, R., et al. (2021). “Factors impacting cybersickness. Guidelines for mitigating, cybersickness in virtual reality systems,” in Peer-reviewed final report of the human factors and medicine panel/modeling and simulations group. Activity Number 323, NATO STO-TR-HFM-MSG-323.
Lawson, B. (2005). “Exploiting the illusion of self-motion (vection) to achieve a feeling of ‘virtual acceleration’in an immersive display,” in Proceedings of the 11th international conference on human–computer interaction, 1–10.
Lawson, B. (2014). “Motion sickness symptomatology and origins,” in Handbook of virtual, environment: Design, implementation, and applications. 2 ed. (Boca Raton, FL: CRC Press).
Lin, J.-W., Duh, H. B.-L., Parker, D. E., Abi-Rached, H., and Furness, T. A. (2002). “Effects of field of view on presence, enjoyment, memory, and simulator sickness in a virtual environment,” in Proceedings of the IEEE Virtual Reality 2002, Orlando, FL, USA, 24-28 March 2002. IEEE.
Luu, W., Zangerl, B., Kalloniatis, M., and Kim, J. (2021). Effects of stereopsis on vection, presence and cybersickness in head-mounted display (HMD) virtual reality. Sci. Rep. 11, 1–10. doi:10.1038/s41598-021-89751-x
Mai, M. N., and Schlueter, M. A. (2010). The relationship between pupillary distance and depth perception in humans. Investigative Ophthalmol. Vis. Sci. 51, 4359.
Merchant, W., and Kirollos, R. (2022). in An overview of cybersickness self report measures for use in DRDC experiments. Editor D. O. N. DEFENCE (Toronto, ON: DRDC).
Milgram, P., and Kishino, F. (1994). A taxonomy of mixed reality visual displays. IEICE Trans. Inf. Syst. 77, 1321–1329.
Mittelstaedt, J., Wacker, J., and Stelling, D. (2018). Effects of display type and motion control on cybersickness in a virtual bike simulator. Displays 51, 43–50. doi:10.1016/j.displa.2018.01.002
Moro, C., Štromberga, Z., Raikos, A., and Stirling, A. (2017). The effectiveness of virtual and augmented reality in health sciences and medical anatomy. Anat. Sci. Educ. 10, 549–559. doi:10.1002/ase.1696
Moss, J. D., Austin, J., Salley, J., Coats, J., Williams, K., and Muth, E. R. (2011). The effects of display delay on simulator sickness. Displays 32, 159–168. doi:10.1016/j.displa.2011.05.010
Palmisano, S., Allison, R. S., and Kim, J. (2020). Cybersickness in head-mounted displays is caused by differences in the user's virtual and physical head pose. Front. Virtual Real. 1, 24. doi:10.3389/frvir.2020.587698
Palmisano, S., Szalla, L., and Kim, J. (2019). Monocular viewing protects against cybersickness produced by head movements in the Oculus Rift. 25th ACM symposium on virtual reality software and technology. New York, United States: Association for Computing Machinery, 81.
Parker, D., and Prothero, J. (2003). A unified approach to presence and motion sickness. Virtual and adaptive environments. Mahwah, New Jersey: CRC Press.
Porcino, T., Trevisan, D., and Clua, E. (2021). A cybersickness review: Causes, strategies, and classification methods. J. Interact. Syst. 12, 269–282. doi:10.5753/jis.2021.2058
Rea, L. M., and Parker, R. A. (2014). Designing and conducting survey research: A comprehensive guide. John Wiley and Sons.
Reason, J. T. (1978). Motion sickness adaptation: A neural mismatch model. J. R. Soc. Med. 71, 819–829. doi:10.1177/014107687807101109
Rebenitsch, L., and Owen, C. (2021). Estimating cybersickness from virtual reality applications. Virtual Real. 25, 165–174. doi:10.1007/s10055-020-00446-6
Rebenitsch, L., and Owen, C. (2016). Review on cybersickness in applications and visual displays. Virtual Real. 20, 101–125. doi:10.1007/s10055-016-0285-9
Riccio, G. E., and Stoffregen, T. A. (1991). An ecological theory of motion sickness and postural instability. Ecol. Psychol. 3, 195–240. doi:10.1207/s15326969eco0303_2
Risi, D., and Palmisano, S. (2019). Effects of postural stability, active control, exposure duration and repeated exposures on HMD induced cybersickness. Displays 60, 9–17. doi:10.1016/j.displa.2019.08.003
Shafiee, D., Jafari, A. R., and Shafiee, A. A. (2014). Correlation between interpupillary distance and stereo acuity. Bull. Environ. Pharmacol. Life Sci. 3, 26–33.
Stanney, K. M., Fidopiastis, C., and Foster, L. (2020). Virtual reality is sexist: But it does not have to be. Front. Robotics AI 7, 4. doi:10.3389/frobt.2020.00004
Stanney, K. M., Hale, K. S., Nahmens, I., and Kennedy, R. S. (2003). What to expect from immersive virtual environment exposure: Influences of gender, body mass index, and past experience. Hum. factors 45, 504–520. doi:10.1518/hfes.45.3.504.27254
Tomczak, M., and Tomczak, E. (2014). The need to report effect size estimates revisited. An overview of some recommended measures of effect size. Trends sport Sci. 1, 19–25.
Treisman, M. (1977). Motion sickness: An evolutionary hypothesis. Science 197, 493–495. doi:10.1126/science.301659
Van Benthem, K., Cobert, H., and Zoberich, R. (2021). in Human factors and ergonomics considerations when using augmented reality head mounted displays – literature analysis report. Editor D. O. N. DEFENCE (Ontario, Canada: Calian).
Weech, S., Kenny, S., and Barnett-Cowan, M. (2019). Presence and cybersickness in virtual reality are negatively related: A review. Front. Psychol. 10, 158. doi:10.3389/fpsyg.2019.00158
Whittinghill, D. M., Ziegler, B., Case, T., and Moore, B. (2015). Nasum virtualis: A simple technique for reducing simulator sickness. San Francisco, California: Games Developers Conference.
XR Collaboration (2021). XR glossary. XR ignite Inc. Available: https://xrcollaboration.com/guide/a-global-resource-guide-to-xr-collaboration/xr-glossary/(Accessed June 03, 2021).
Yildirim, C. (2019). Don’t make me sick: Investigating the incidence of cybersickness in commercial virtual reality headsets. Virtual Real. 24, 231–239. doi:10.1007/s10055-019-00401-0
Keywords: virtual reality, mixed reality, head-mounted display (HMD), cybersickness, simulator sickness questionnaire (SSQ)
Citation: Kirollos R and Merchant W (2023) Comparing cybersickness in virtual reality and mixed reality head-mounted displays. Front. Virtual Real. 4:1130864. doi: 10.3389/frvir.2023.1130864
Received: 23 December 2022; Accepted: 02 February 2023;
Published: 13 February 2023.
Edited by:
Xiaosong Yang, Bournemouth University, United KingdomCopyright © 2023 Kirollos and Merchant. This is an open-access article distributed under the terms of the Creative Commons Attribution License (CC BY). The use, distribution or reproduction in other forums is permitted, provided the original author(s) and the copyright owner(s) are credited and that the original publication in this journal is cited, in accordance with accepted academic practice. No use, distribution or reproduction is permitted which does not comply with these terms.
*Correspondence: Ramy Kirollos, UmFteS5LaXJvbGxvc0BkcmRjLXJkZGMuZ2MuY2E=