 Yui Suga
 Masahiro Takeuchi1
 Satoshi Tanaka
 Hiroyuki Kajimoto
- 1Department of Informatics, The University of Electro-Communications, Chofu, Japan
- 2Japan Society for the Promotion of Science (JSPS), Chiyoda, Japan
To provide realistic tactile sensations in a virtual environment, it is necessary to stimulate both the cutaneous and proprioceptive senses. This study focuses on a realistic method of presenting softness through the use of electro-tactile stimulation. Our system combines a force-feedback device with an electric stimulator to create a soft sensation by applying a reaction force and spreading cutaneous sensation based on the amount of indentation. We measured the change in the contact area of gel samples and used electric stimulation to reproduce the increase in the contact area of the sample. We conducted a psychophysical experiment to evaluate the effectiveness of the combination of cutaneous and force sensations and confirmed that the sensation of softness was enhanced by the simultaneous presentation.
1 Introduction
The softness of an object can be detected through touch. The perception of softness involves the perception of the relationship between displacement and reaction force, which is based on proprioceptive sensation (the perception of force) as well as the perception of changes in contact with an object based on cutaneous sensation and other factors. Previous researches (Srinivasan and LaMotte, 1995; Bergmann Tiest and Kappers, 2008) have shown that cutaneous sensation cues are particularly important in the perception of softness.
Various attempts to present softness by reproducing an object’s reaction force or cutaneous sensation have been proposed (Fujita and Ohmori, 2001; Liu, et al., 2007). Softness can be simulated by providing a reaction force that is proportional to the amount of indentation on the object in terms of force sensation, or by spreading the stimulus distribution in terms of cutaneous sensation (Figure 1).
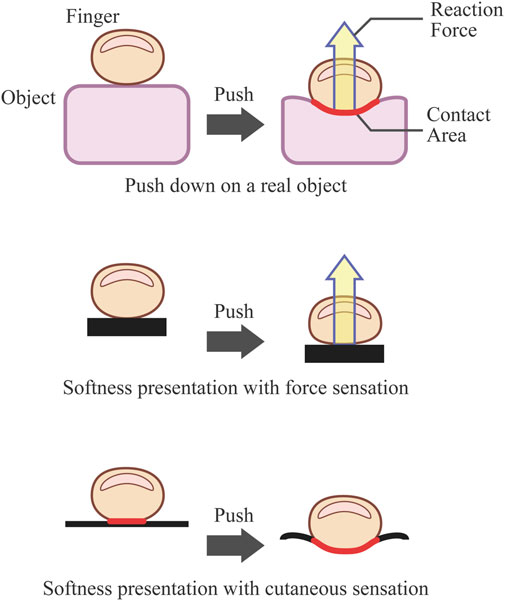
FIGURE 1. Conceptual diagram illustrating the presentation of softness through force sensation alone and through cutaneous sensation alone.
However, in order to provide a realistic perception of softness, it is not sufficient to independently introduce either force or cutaneous sensation, but rather to combine both sensations. (Srinivasan and LaMotte, 1995; Bicchi, et al., 2000; Friedman, et al., 2008; Xu, et al., 2021). Therefore, several methods have been proposed for presenting softness by simultaneously introducing both force and cutaneous sensations. (Kyung, et al., 2005; Kyung, et al., 2006; Scilingo, et al., 2010; Park, et al., 2018). However, in order to change the contact area, a large mechanism must be attached to the end of the device. In general, there are not many applications that only require the presentation of soft sensations, and in many cases, detailed shapes such as edges are also required. Therefore, it is undesirable to have a large device for changing the contact area at the fingertip solely for the purpose of presenting soft sensations.
To address this issue, this study explores the use of electro-tactile stimulation as a means of presenting cutaneous sensation. Owing to their small size, electro-tactile displays are relatively easy to attach to the end of a device. In addition, this method can provide fast and high-density presentation using multiple electrodes and is expected to produce high-definition cutaneous sensation, such as edge shape. Moreover, the cutaneous sensation presented by electrical stimulation does not involve mechanical force, and thus has the advantage of not interfering with the presentation of force sensation.
A method for presenting softness by changing the contact area using an arrayed electro-tactile display was proposed (Takei, et al., 2015; Yem, et al., 2018). However, no attempts have been made to develop a method that presents softness by combining the force sensation with electrical stimuli, and no quantitative evaluation of the presented stimuli has been performed.
Based on the above considerations, this study aimed to present a more realistic softness using the integration of the force sensation with electrical stimuli when electrical stimulation is used as a cutaneous feedback element for the presentation of softness.
In this study, we first measured the change in the contact area of samples in response to the amount of finger indentation and then developed a mechanism to reproduce this change by converting it into distributed electrical stimulation using a flexible electrode that imitates the shape of a finger. Next, the electrodes were mounted on a force-feedback device and we designed a system that simultaneously provided electrical stimulation based on the measurement of the contact area and force-feedback to reproduce the Young’s modulus. The effectiveness of simultaneous introduction was confirmed through psychophysical experiments.
2 Related work
2.1 Simultaneous force-tactile stimulation
There have been numerous attempts to simultaneously present force and cutaneous sensation, not limited to softness presentation, and the cross-modality effects of force and cutaneous sensation have been psychophysically verified in various contexts. Ikei and Shiratori (2002) combined a PHANToM force-feedback device with a vibrating pin array to more accurately and quickly present object textures. Debus et al. (2002) used a PHANToM force-feedback device combined with a vibration mechanism and found that combining force presentation with vibrotactile presentation improved performance in a force control task. Kim et al. (2006) improved performance in a targeting task by combining pneumatic tactile stimuli with force stimuli from a PHANToM force-feedback device and presenting them at the fingertips. Fritschi et al. (2006) examined the integration of a large force-feedback device with various tactile displays that presented sliding friction, shear, and normal forces, respectively, and found that combining appropriate cutaneous sensation stimuli enhanced the realism of the stimuli. Benko et al. (2016) reproduced the 3D surfaces, textures, and forces of virtual objects on a handheld controller, greatly improving the accuracy of VR interaction through haptic feedback. Nakagaki et al. (2019) extended the pin-array shape presentation display to allow closed-loop force-controlled force presentation at each pin to represent more tactile characteristics. Sato et al. (2007) developed a concept to integrate force and cutaneous sensation by mounting an electro-tactile display on a force-feedback device to enable dexterous manipulation.
Various studies have also been conducted on the presentation of softness through the simultaneous presentation of force and cutaneous sensation. Kyung et al. (2005) used a mouse-like device to reproduce the stiffness of an object through translational force presentation and the texture of the object through pin arrays and piezoelectric elements applied to the thumb grasping the device. Through their experiments, they demonstrated that the simultaneous presentation of force and cutaneous sensation enhances perceptual ability and is effective for distinguishing fine shapes. Kyung et al. (2006) used a pin-array tactile display at the end of a PHANToM force-feedback device to simultaneously represent distributed pressure and contact force. Their experimental results showed that the simultaneous presentation of force and cutaneous sensation improved discrimination between hard and soft objects and enabled efficient exploration of different parts of an object with different material properties. Scilingo et al. (2010) developed a device that simultaneously introduced both proprioceptive and cutaneous sensory cues at a single fingertip by combining a force-feedback device with a parallel link mechanism and a pneumatic actuator contact area display. They examined the effects of each sensation on the perception of soft sensations. The results showed that cutaneous sensory information was dominant in identifying soft objects and that simultaneous introduction of proprioceptive and cutaneous sensory cues improved softness discrimination performance. Park et al. (2018) created a device with a servo-motor-driven flat plate and potentiometer attached to the end of a PHANToM force-feedback device. They designed the device so that the fingertip contact area increases linearly with the amount of displacement, particularly for effective rendering of hard objects. They tested the effect of simultaneous presentation in single-finger contact and two-finger grasping and showed that the addition of cutaneous sensory information made the virtual object stiffer. Zhu et al. (2022) developed a handheld device that can control the shape and thickness of a surface made of brass tape, presenting various levels of softness. They demonstrated that it enhances the realism of VR compared to vibration feedback alone.
2.2 Electro-tactile stimulation
Cutaneous electrical stimulation produces tactile sensations by applying electric current from an electrode that touches the skin surface. This is based on the mechanism by which the nerve membrane is depolarized, and an action potential is generated by applying an electric potential to the extramembrane of the tactile nerve axon (McNeal, 1976).
Electrical stimulation acts directly on tactile nerves and produces a tactile sensation without mechanical deformation of the skin. Electrical stimulation has two modes: anodic and cathodic. Anodic stimulation was performed by connecting the stimulating electrode to a high potential and other electrodes to a low potential, causing current to flow from the stimulating electrode to the other electrodes. In contrast, cathodic stimulation was achieved by a reverse connection. Yem and Kajimoto (2017) reported that: 1) the produced tactile sensation depends on the polarity of the electrical stimuli, and 2) anodic stimulation mainly produces vibrational sensations, whereas cathodic stimulation produces both vibrational and pressure sensations.
Transcutaneous electrical stimulators come in a wide range of designs, including thin stimulators that can be printed and attached to any part of the body (Withana, et al., 2018), those using non-volatile ionic gel as a soft conductive interface (Root, et al., 2018), and those that penetrate the stratum corneum of the skin through microneedles for stimulation (Tezuka, et al., 2017). Electro-tactile displays also allow for portable setups due to their simple mechanism (Cornman, et al., 2017). Some studies have used electro-tactile stimuli as wearable devices, presenting them to the fingertips and the entire palm (Lin, et al., 2022; Yao, et al., 2022).
Takei et al. (2015) attached a film pressure distribution sensor under a film electro-tactile display, measured the pressure applied to each electrode by a pressing finger, and used it as feedback for electrical stimulation. They applied electrical stimulation to the outer edge of the area where pressure was applied and designed the stimulation to spread out in steps as the pressing force increased, representing the spread of the contact area and the sensation of softness. However, they did not compare the softness with that of a real object.
Yem et al. (2018) investigated the perception of softness induced by electrical stimulation while touching a virtual object. They showed that cathodic stimulation alone produces perceptions of softness. However, a quantitative realistic evaluation of the sensation of softness caused by electrical stimulation has not been performed.
3 Materials and methods
3.1 Electrical stimulator
The device used for fingertip electrical stimulation was a variation of a previously developed one (Kajimoto, 2021), with the electrode part made of a flexible substrate. As shown in Figure 2, the electrodes are arranged in the shape of a finger and can be deformed horizontally using one row of slits to accommodate the curved surface of the fingertip.
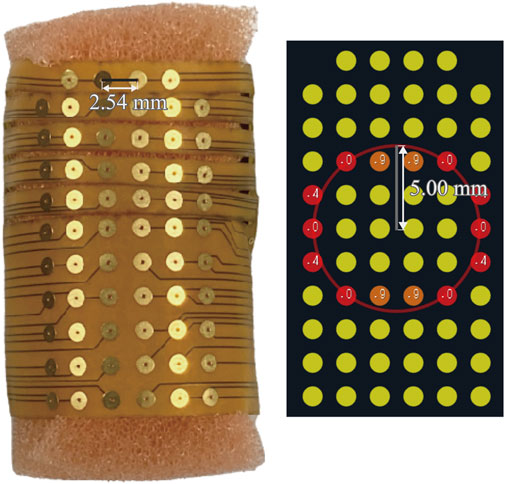
FIGURE 2. Electrodes of the electrical stimulator (left) and its schematic diagram fitting a circle in the stimulator using a random modulator (Tirado, et al., 2020) (right). The red circle has a radius of 5.00 mm at this moment. The red- or orange-tinted electrodes are the electrodes to be stimulated, according to Eq. 1. The command value of the stimulation intensity is constant at a preset value for all electrodes, and only the probability of stimulation varies with the distance from the circle.
A flexible sponge is placed at the bottom of the electrode sheet. The sponge allows the electrode sheet to closely fit and follow the finger when the electrode is pressed, which helps to ensure stable contact between the finger and the electrode. The electrode on the outer edge enables stimulation to the lateral side of the finger. The flexibility of the sponge also prevents deformation of the finger. In the initial stage of this research, we considered using a hard plate electrode or a hard finger sack thimble, but we were concerned about the deformation of the finger due to the hardness of the electrode itself or the mounting device, so we adopted the sponge structure in the present study.
The device can provide a maximum electrical stimulation of approximately 22 mA with 64 electrodes arrayed with a center-to-center distance of 2.54 mm. It is current-controlled, capable of applying current at a specified command value, negating the need for individual measurement of participant conditions. Using current control is a common practice in electrical stimulation in terms of safety. The spread of the contact area can be simulated by switching the electrode point to be stimulated according to the amount of displacement. We designed the stimulation pattern to change at 60 Hz and the pulse width to uniformly stimulate each electrode at 45 μs and then performed electrical stimulation by cathodic stimulation following a previous study (Yem, et al., 2018) to generate pressure sensations.
We implemented a spatial-temporal pattern of electrical stimulation to express concentric circular rings that spread out from the center of the electrode sheet. For an arbitrary circle radius, stimulation was applied to the electrodes whose distance was less than 1 mm from the circumference of the circle, and electrodes closer to the circumference were stimulated more frequently (see Figure 2). The interior of the circle is not stimulated, which simulates the concentration of strain energy near the edge of contact when the skin touches the object. When the finger is pushed in, the presented circle widens, and this widening is expected to be perceived as an increase in the contact area, which conveys a sense of softness (Takei, et al., 2015).
We used a method called random modulator, which was used in ElectroAR (Tirado, et al., 2020), to present circular shapes of arbitrary radius with the highest possible resolution for a 64-electrodes array. This method utilizes the probability of stimulation to represent a specific stimulus intensity. To express the change in the contact area, we assigned a specific circle radius, and then the system calculated a value d (mm) for each electrode; d is the normalized distance from the center of the electrode to the circumference of the circle, so that the electrodes closer to the actual circumference of the circle are stimulated more frequently. The algorithm is expressed as follows:
where rand () is a uniformly distributed random variable that takes values ranging from zero to one. Stimulation was applied to the electrode when rand () was greater than d. No stimulation was performed in any of the other patients. The value of rand () is unique for each of the 64 electrodes and is updated to 60 Hz. The distance between the electrodes in the anterior-posterior direction is approximately 2 mm or less because the electrode sheet deforms along the curvature of the finger. Because it is difficult to correspond exactly to this deformation owing to individual differences, this study assumed the distance between electrodes to be 2 mm.
3.2 Force and cutaneous sensations presentation system
3.2.1 System design
We designed a device to simultaneously present force and cutaneous sensations using a force-feedback device and electro-tactile stimulation. A desktop force-feedback device, Touch X USB (3D Systems), was used for force presentation due to its stability of presentation, accuracy of sensing, and ease of control. As shown in Figure 3, a mount for inserting a finger into the end-effector of the Touch X USB and the electrical stimulator described in the previous section were attached to the Touch X USB in order to present force and electrical stimulation to a specific finger using the Touch X USB. The arm/stylus was fixed to prevent unnecessary rotation of the axis and is limited to one-dimensional push operation in this case.
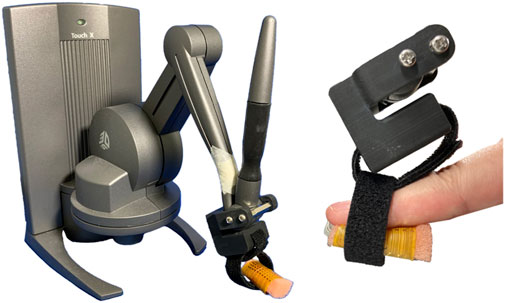
FIGURE 3. force and cutaneous sensations presentation system.
The Touch X USB was set up to exert spring elasticity based on the amount of displacement in the vertical axis. The reference location was 25 mm above the desk. The position of the end-effector was measured using internal encoders with a nominal accuracy of 0.023 mm1. The PC calculates the reaction force in the vertical direction and generates the desired force sensation based on the measured position and spring constant set by the controller.
The electrical stimulator attached to the Touch X USB receives the measured end-effector position and presents a stimulus distribution pattern based on this value. The pattern of the stimulus distribution was designed from the contact area measurement experiment described in the next section to reproduce the contact area of the sample.
The above design reproduces the reaction force and contact area at a certain amount of pushing and simultaneously presents a sense of softness through both force sensation and cutaneous sensation.
3.2.2 Contact area measurement and electrical stimulation pattern design
In preparation for reproducing realistic contact areas using the apparatus, the contact areas of two elastic samples were measured as a function of the amount of indentation applied to the samples by pressing them with a finger. Regarding the method of contact area measurement, we utilized an ink transfer method on the actual object to achieve precise rendering of the contact area on the real sample, which was based on previous studies that measured contact area on elastic objects (Hauser and Gerling, 2016; Hauser and Gerling, 2018; Xu, et al., 2020; Xu, et al., 2021).
We used two soft material gels (Hitohada Gel, EXSEAL Corporation, super soft modelling resin [Milky White] H0-100/H15-100) with a top surface area of 30 × 30 mm2 and a thickness of 25 mm. These samples corresponded to Asker C hardness values of 0 and 15 which are approximately the hardness values of an infant’s cheek and adult’s palm, respectively. Young’s moduli of the prepared samples were 0.033N/mm2, 0.11N/mm2, respectively, when measured using the uniaxial compression test. These samples are hereafter referred to as Gels 0 and 15, respectively.
Six participants (four right-handed and two left-handed; all males, 21–26 years old) were recruited. They were asked to press the inked index finger of their dominant hand against the samples. During the test, the proximal phalanx of the finger was fixed and kept horizontal to the sample using a fixture. Each gel was pressed at 0, 1, 2, and 3 mm in the normal direction. The amount of indentation was measured based on the displacement of the participant’s fingernail using a laser displacement sensor (Keyence LK-H050). The zero point of indentation was set when each participant started to feel a sense of touch on each sample. The participants were also allowed to practice pressing the samples before ink was applied to their fingers. However, because it was difficult to accurately press a predetermined indentation, an indentation error of up to ±0.3 mm was tolerated. After each pressing, the samples were photographed using a camera fixed horizontally at a fixed height, and the inked area was digitally processed and calculated. Samples were thoroughly cleaned after each trial. Figure 4 shows the actual measurement. During the measurement, an electronic scale (maximum capacity of 6000 g, minimum resolution of 0.1 g) was used to measure the pressing force to confirm that the pressing force falls within the range that can be adequately reproduced by the Touch X USB. The maximum recorded value was 479.9 g, which is approximately equal to 4.706 N for a 3 mm press, thus affirming that the reaction force generated for a 3 mm press could be effectively replicated.
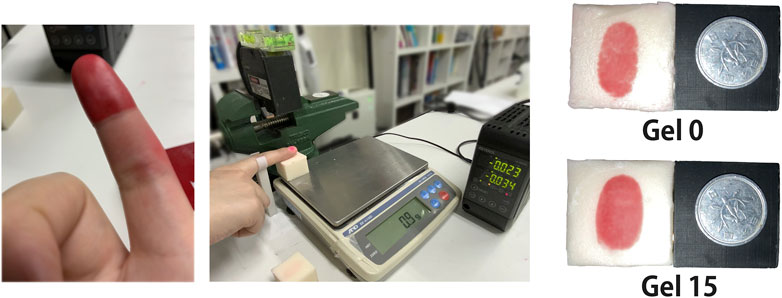
FIGURE 4. Contact area measurement: An inked index finger, An appearance of measurement and photos of 2 mm pressed gels with 20 mm-diameter coin.
Because the electric stimulation pattern was created based on measurement results of up to a 3 mm indentation, the regression value for indentations larger than 3 mm was not used in subsequent experiments, and the contact area presentation used a value of 3 mm when the indentation exceeded 3 mm.
Figure 5 shows the mean values and standard deviations of the contact areas of Gels 0 and 15 at 0–3 mm indentations for the six participants, plotted with error bars and regression curves by logistic regression in the range of 0–3 mm.
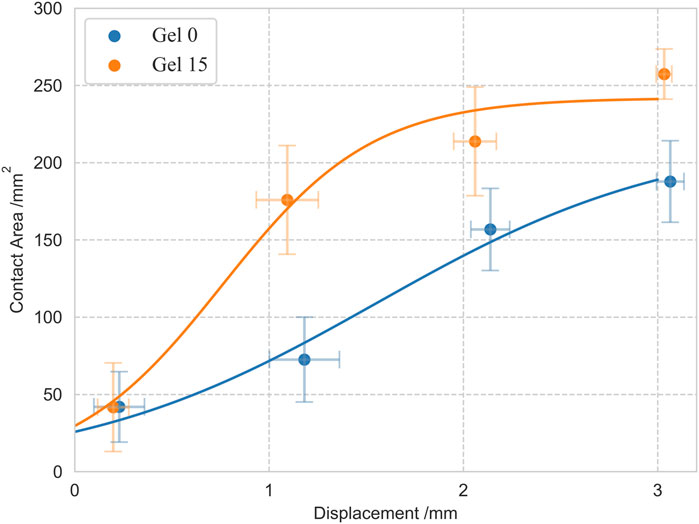
FIGURE 5. Contact area measurement results and regression curves.
The logistic regression curve is expressed as follows:
where A and x represent the contact area and displacement, respectively. The coefficients a,b,c for Gels 0 and 15 are (a0,b0,c0)=(7.46744, 1.29579, 217.874), and (a15,b15,c15)= (7.32174, 1.67252, 229.803), respectively. The coefficients of determination were 0.9809 and 0.9728 for Gels 0 and 15, respectively. This regression function was used because it had a larger coefficient of determination for both gels than polynomial or logarithmic approximations. Using these results, we obtain the area A by inputting the displacement x.
Based on the regression equations of the contact area, we created four different presentation patterns of the electrical stimuli. First, we created two electrical stimuli, Elec 0 and Elec 15, which reproduced the contact area changes of Gels 0 and 15, respectively. These stimuli have an electrical stimulation distribution that spreads as the finger is pressed down. Each follows the regression curve shown in Figure 5. Next, we created two stimuli for comparison, Elec
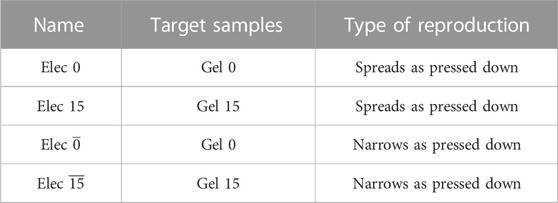
TABLE 1. Four types of electrical stimulation patterns.
4 Experiments
4.1 Experiment 1: Point of subjective equality measurement
This experiment was conducted to verify the effect of the softness presentation using the electrical stimulation patterns created in Section 3.2.2. The purpose of this experiment was to see if the perception of softness in terms of Young’s modulus is affected by addition of cutaneous cue presented by electrical stimulation. In this experiment, the subjective equivalence point of the hardness presented by the device was measured using the adjustment method.
4.1.1 Experimental procedure
The reference stimuli for the adjustment method were Gel 0 and 15 used in Section 3.2.2, and the comparison stimuli were those presented by the simultaneous cutaneous and force presentation device described in Section 3.2.1.
Five comparison stimuli were prepared: one condition consisted of only a force sensation by the force-feedback device and no electrical stimulation, and the other four conditions consisted of a force sensation and one of the four electrical stimuli listed in Table 1. The intensity of the electrical stimulation, or the pulse amplitude, was adjusted by each participant before starting the experiment. The intensity was set within the range where cutaneous sensation of the electrical stimulation could be felt, and none of the participants experienced any pain.
The experiment was conducted with 10 participants (9 males and 1 female, 21–28 years old, average age of 23.4, 7 right-handed, and 3 left-handed). Participants were exposed to 10 conditions (two gels of the reference stimuli × five presentation patterns) and tested three times in succession within each combination. The order of the combinations was counterbalanced between participants. The participants were asked to adjust the spring constant of the force-feedback device to the point where they felt that the hardness of the comparison stimulus matched that of the reference stimulus when they pressed each stimulus. The spring constant could be set in the range 0.1–2.5 N/mm step-by-step using a controller, changing by 15% from the current value to facilitate adjustment, based on the fact that the Weber ratio in softness perception is approximately 15% (Bergmann Tiest and Kappers, 2009). The median of three trials for each combination was treated as the subjective equivalent point of perceived hardness.
During the experiment, the participants wore earmuffs to block the sounds of the operation device and environment. The gel samples and presentation device were concealed (see Figure 6).
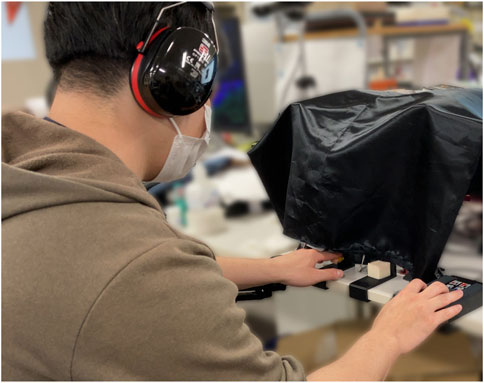
FIGURE 6. Overview of the point of subjective equality measurement.
4.1.2 Results
The adjustment results of the ten participants are summarized in box plots using the median values of three trials for each condition and participant. The adjustment results for Gels 0 and 15 are presented in Figure 7 and Figure 8, respectively. The original Young’s moduli of Gels 0 and 15 are indicated by dotted lines in the figures.
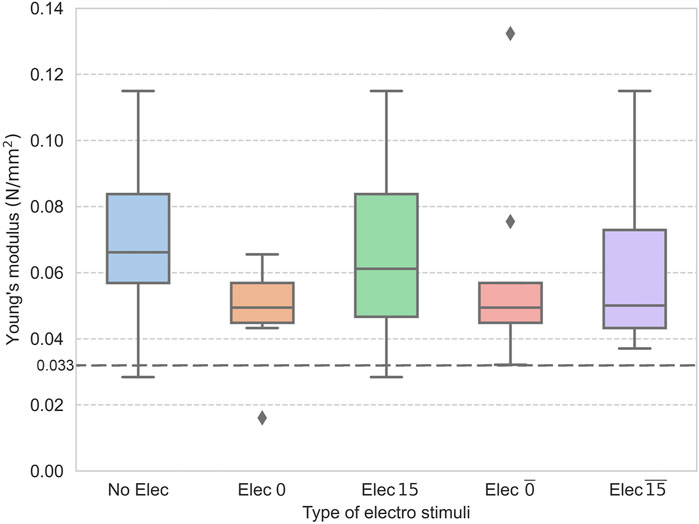
FIGURE 7. Adjustment results for Gel 0.
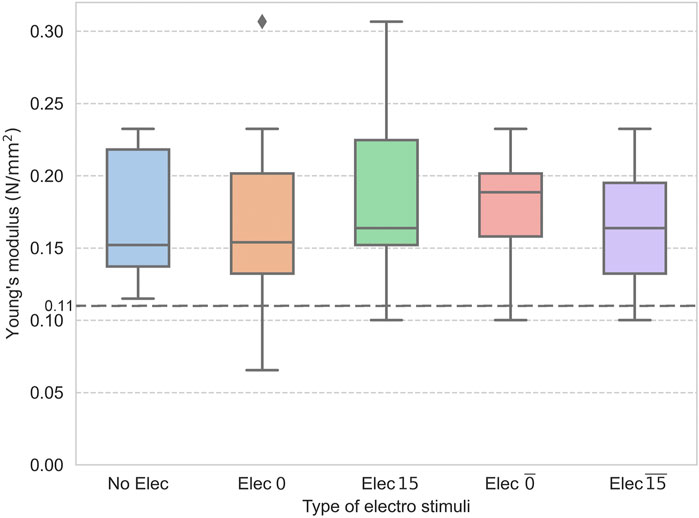
FIGURE 8. Adjustment results for Gel 15.
To examine the effect of the type of electrical stimulation pattern on the adjusted results for each gel sample, a one-way repeated-measures analysis of variance was conducted to test the difference in adjusted values for the type of electrical stimulation pattern. The results were p = 0.298 and p = 0.352 for Gels 0 and 15, respectively, and no significant differences were observed.
4.2 Experiment 2: Subjective evaluation
Based on the results of the adjustment method in Experiment 1, there were no significant differences in the adjustment results with or without electrical stimulation, which suggests that electrical stimulation did not have a negative impact on force-based stiffness perception. We considered that it also implies that cutaneous sensation by electrical stimulation and force feedback could be evaluated independently. Hence, in the next experiment, the participants were asked to evaluate the reality of softness in each of the cutaneous and force sensation separately.
This experiment was conducted to verify the effectiveness of the softness presentation using the electrical stimulation patterns created in Section 3.2.2. In this experiment, the participants were asked to subjectively evaluate the similarity of perceived softness with the real samples to examine the realism of softness presented by the device.
4.2.1 Experimental procedure
On a different day from Experiment 1, the participants were asked to evaluate how similar the comparison stimuli were to the reference stimuli (i.e., real samples) for combinations of two gel samples and presentation patterns of the comparison stimuli. The comparison stimuli were those used in Experiment 1, and we also prepared a condition in which only electric stimuli were presented. The experiment was conducted with 10 participants (9 males and 1 female, 22–27 years old, average age of 23.7, 8 right-handed, and 2 left-handed). Seven of them have participated in Experiment 1, but since 6 months had passed since Experiment 1, it was assumed that they would have no problems participating in Experiment 2.
The pairs of reference and comparison stimuli were presented once each in a pseudo-random order with no bias in the order. To evaluate the difference in softness between the reference and comparison stimuli, participants were asked to answer the following two questions on a 7-point Likert scale (1 = not at all similar, 7 = completely similar): 1) “How similar are they in terms of force sensation?”, and 2) “How similar are they in terms of cutaneous sensation?”. The stimuli with force presentation were presented to the participants in the same manner as in Experiment 1, with the visual stimuli concealed behind a blackout curtain, and the locations of the stimuli made discernible through markers on the edge of the desk. Participants freely touched the stimuli, and were asked to evaluate the vertical drag force exerted by the haptic device when pressing in one dimension with respect to force evaluation, and to evaluate the cutaneous sensation. The spring constant of the force-feedback device was fixed at the same stiffness as the physical rigidity of gel of the reference stimulus for each combination of presentations. In the condition in which only electrical stimuli were presented without force presentation, the electrode fixed to the desk was pressed down sufficiently with the index finger of the dominant hand so that it did not move, and the stimulus was presented by moving the stylus up and down with the non-dominant hand.
4.2.2 Results
The evaluation results of the ten participants are summarized as box plots. The results for Gels 0 and 15 are presented in Figure 9, Figure 10, Figure 11, Figure 12, respectively. The Friedman test was performed on the results of each evaluation and found significant differences, with p = 0.002 for the force evaluation of Gel 0 and p = 0.000 for the cutaneous sensation evaluation of Gel 0, and p = 0.000 for the force evaluation of Gel 15 and p = 0.000 for the cutaneous sensation evaluation of Gel 15. A multiple comparison test using the Bonferroni method was conducted as a post-test. No significant difference was found in the force evaluation of Gel 0. The cutaneous sensation evaluation of Gel 0 showed significant differences between the following conditions: Force only vs Force + Elec 0 (p = 0.009), Elec 0 only vs Force + Elec 0 (p = 0.006), Elec 15 only vs Force + Elec 0 (p = 0.002), Elec
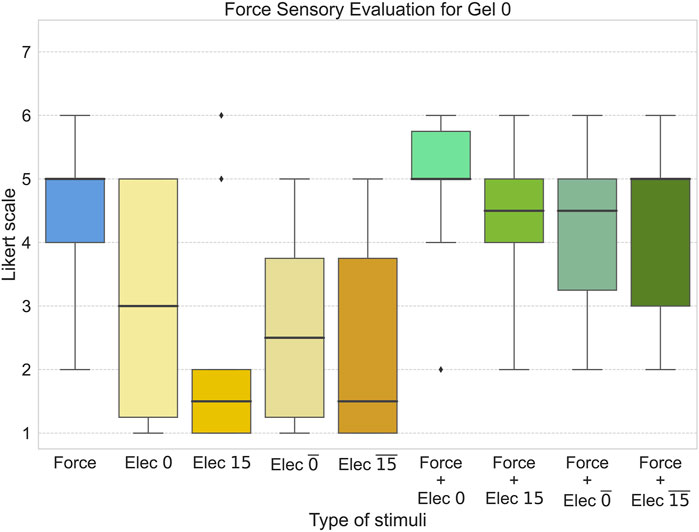
FIGURE 9. Subjective evaluation of force sensation for Gel 0.
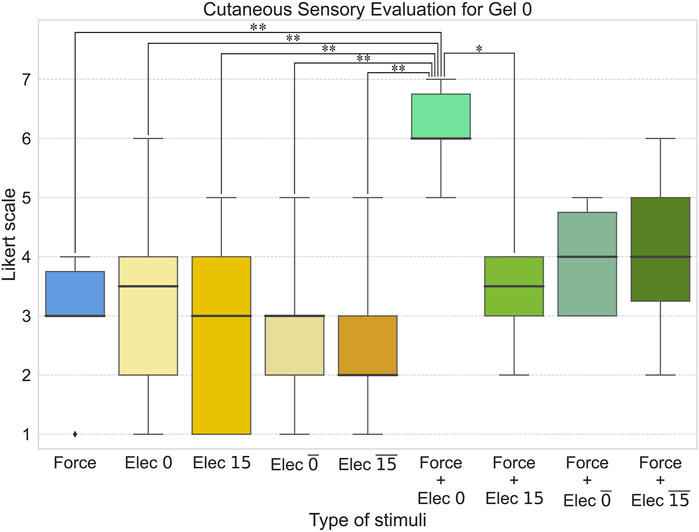
FIGURE 10. Subjective evaluation of cutaneous sensation for Gel 0 (*:p < 0.05, **:p < 0.01)
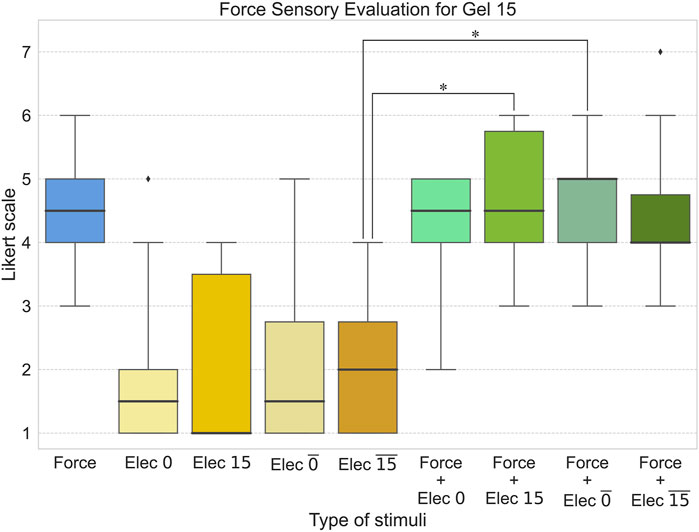
FIGURE 11. Subjective evaluation of force sensation for Gel 15 (*:p < 0.05)
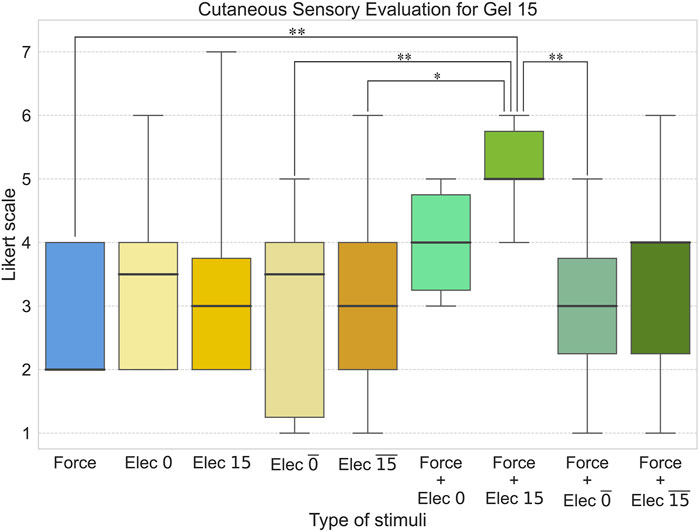
FIGURE 12. Subjective evaluation of cutaneous sensation for Gel 15 (*:p < 0.05, **:p < 0.01)
P1 and P2 noted that they felt a change in the force sensation as a result of the variations in the electrical stimulation when only electrical stimulation was applied. P4 and P5 reported that they felt a pricking sensation and a force similar to a hammering force at their fingertips due to the electrical stimulation. P6 and P8 stated that they were able to clearly perceive the expansion of the contact area due to the electrical stimulation, and that Elec 0 felt the softest. P1 and P2 remarked that the Elec
5 Discussion
In the subjective equality measurement of hardness in Experiment 1, no significant differences were found between the electrical stimulation patterns when electrical stimulation was added to the force stimuli. In other words, when asked to respond to hardness in terms of Young’s modulus, the participants were not adversely affected by the cutaneous sensation of electrical stimulation and were able to make their judgments based solely on the force stimulus. However, the subjective equivalence point values were higher than the hardness of the reference stimulus gel sample (shown in Figure 7, Figure 8 by the dotted line). This may be due to the soft sponge used to hold the film electrode along the finger, which was not perceived as equally hard unless it was adjusted to a stiffer Young’s modulus. In this experimental setup, the fingertip position was measured by TouchX. However, due to the sponge deformation, the fingertip moved a little more than was measured by TouchX. This may be the reason for the uniformly slightly off values when answering the Young’s modulus. To solve this problem, it would be necessary to measure or estimate the true fingertip position, taking into account the compression of the sponge.
In the subjective evaluation experiment of Experiment 2, the realism of softness was significantly improved only when force stimuli that reproduced the actual reaction force and electrical stimuli that simulated the actual expansion of the contact area (Elec 0 and Elec 15, respectively) were presented simultaneously for Gel 0 and Gel 15 in the cutaneous sensation evaluation. This result suggests that the fusion stimulus, which reproduced the reaction force and the increase in the contact area of the real object, provided a more realistic softness sensation. Specifically, the force stimulus plus Elec 0, which reproduced the contact area of Gel 0, was evaluated as a significantly more realistic cutaneous sensation for Gel 0 than all other conditions, indicating the effectiveness of the proposed method. For Gel 15, which is a harder sample, the force stimulus plus Elec 15, which reproduced the contact area of Gel 15, was evaluated as a significantly more realistic cutaneous sensation than the force-only condition and some of the electric stimulation-only conditions.
It has been established that cutaneous sensation cues play a dominant role in the perception of softness (Srinivasan and LaMotte, 1995; Bergmann Tiest and Kappers, 2008), but the results of the present experiment showed that cutaneous sensation was less realistic in the electric stimulation-only condition. This suggests that the realism of softness is reduced when using electric stimulation alone, as electric stimulation is a symbolic, less realistic cutaneous presentation method. In this study, the validity of this method was only tested using two types of samples. In future research, it will be necessary to examine the effectiveness of this method using a larger number of samples in order to determine the range of softness at which effective fusion presentation can be achieved.
As for the force evaluation in the subjective evaluation experiment of Experiment 2, no significant differences were found in multiple comparisons for Gel 0, but significant differences were observed between the condition in which only Elec
There are several limitations to this study. As mentioned previously, the softness of the sponge used in the presentation part is thought to have had a negative impact on the presentation of a realistic softness sensation. Other limitation is the imperfections of the contact area measurement. The contact area was measured based on the amount of pressing during active touch, but the displacement of the finger was measured based on the position of the fingernail, which did not take into account the deformation of the finger pad. As a result, the exact displacement was not measured at the finger pad area. In addition, the measurement error was allowed to be ±0.3 mm, which may have resulted in inaccurate regression curves, particularly for small displacements of 0 and 1 mm. Therefore, the experimental setup should be revised in this regard.
The current rendering approach of pressing a finger on the actual sample to measure the contact area lacks comparing to a simplistic model and is not universally applicable. To generalize the system to accommodate a wider range of softness, we plan to integrate Finite Element Method (FEM) simulations as a future consideration.
Additionally, the area by electrical stimulation was approximated as a regular circle, as described in Section 3.1, and the distance between electrodes was set to 2 mm in the software to account for individual differences in finger geometry. The original contact area is an ellipse, as shown in Figure 4, and the distance between electrodes varies among individuals due to electrode deformation. Future studies may involve the accurate reproduction of these elements.
In the Experiment 2 condition without force feedback, the trial involved moving the stylus up and down with the non-dominant hand while the electrode was placed on the desk. In our experimental setup, the finger was not tightly fixed to a finger sack, as described in Section 3, to avoid unnecessary cutaneous cue. In other words, the design was to push down the surface of the virtual object in the air, by the presence of a force feedback. This made the without-force feedback difficult. Without force feedback, it was impossible to move the stylus by just moving the fingers, as the stylus would fall off immediately. Moreover, if participants were allowed to move freely without force feedback, their fingers would penetrate the surface of the virtual object and provide false motion cues as there were no restrictions on fingertip movement. We might have instructed participants to focus on cutaneous sensation to prevent excessive movement, but this would have resulted in a significant difference in the participants’ awareness from other conditions. For these reasons, we used the condition where the electrodes were placed on the desk in the absence of force feedback. However, the absence of positional kinesthetic feedback could have led to a lower evaluation.
In order to investigate the effect of simultaneous tactile force presentation in one-dimensional pressing, we designed a device using Touch X USB, a standard force presentation device, but this system can be easily integrated into other force presentation mechanisms in general. This system can also be used in combination with wearable force-feedback devices and for multi-finger presentation. In the future, it will be necessary to compare this system with other force-feedback mechanisms and to verify its effectiveness in presenting force to multiple fingers.
6 Conclusion
In this paper, we proposed a method for presenting a soft sensation by combining electro-tactile stimulation that reproduces changes in the contact area and force presentation, and verified its effectiveness. We measured the subjective equivalent point of Young’s modulus using the adjustment method and subjectively evaluated it using a Likert scale. We found that the representation of the change in contact area by electrical stimulation did not affect the perception of Young’s modulus and significantly improved the realism of the sense of softness.
In future studies, we will consider the effect of the sponge material’s softness on the presentation part and work to improve the shape reproduction of the contact area. Additionally, as the present study was limited to one-dimensional pressing with the index finger, we will measure the contact area using the thumb in order to verify the validity of two-finger grasping.
Data availability statement
The raw data supporting the conclusion of this article will be made available by the authors, without undue reservation.
Ethics statement
The studies involving human participants were reviewed and approved by the ethics committee of the University of Electro-Communications. The patients/participants provided their written informed consent to participate in this study.
Author contributions
YS developed the software/hardware setup, implemented the experiments, and analysed the results. HK provided guidance on various aspects, such as the study design and development of the electrical stimulator. MT and ST contributed to the experimental design and assisted with software/hardware setup. All authors contributed to manuscript revision, read, and approved the submitted version.
Funding
This research was supported by JSPS KAKENHI (Grant Numbers JP20H05957).
Acknowledgments
We would like to thank all the participants who participated in the study for their time and comments that provided a way to improve our work.
Conflict of interest
The authors declare that the research was conducted in the absence of any commercial or financial relationships that could be construed as a potential conflict of interest.
Publisher’s note
All claims expressed in this article are solely those of the authors and do not necessarily represent those of their affiliated organizations, or those of the publisher, the editors and the reviewers. Any product that may be evaluated in this article, or claim that may be made by its manufacturer, is not guaranteed or endorsed by the publisher.
Footnotes
13D Systems, “Touch X—Specifications”, https://www.3dsystems.com/haptics-devices/touch-x/specifications.
References
Benko, H., Holz, C., Sinclair, M., and Ofek, E. (2016). “Normaltouch and texturetouch: High-fidelity 3d haptic shape rendering on handheld virtual reality controllers,” in Proceedings of the 29th annual symposium on user interface software and technology. Editor J. Rekimoto (New York: Association for Computing Machinery), 717–728.
Bergmann Tiest, W. M., and Kappers, A. (2009). Cues for haptic perception of compliance. IEEE Trans. Haptics 2 (4), 189–199. doi:10.1109/toh.2009.16
Bergmann Tiest, W. M., and Kappers, A. M. (2008). “Kinesthetic and cutaneous contributions to the perception of compressibility,” in International Conference on Human Haptic Sensing and Touch Enabled Computer Applications, Madrid, Spain, 10-13 June 2008, 255–264.
Bicchi, A., Scilingo, E. P., and De Rossi, D. (2000). Haptic discrimination of softness in teleoperation: The role of the contact area spread rate. IEEE Trans. Robotics Automation 16 (5), 496–504. doi:10.1109/70.880800
Cornman, J., Akhtar, A., and Bretl, T. (2017). “A portable, arbitrary waveform, multichannel constant current electrotactile stimulator,” in 2017 8th International IEEE/EMBS Conference on Neural Engineering (NER), Shanghai, China, 25-28 May 2017, 300–303.
Debus, T., Jang, T-J., Dupont, P., and Howe, R. (2002). “Multichannel vibrotactile display for sensory substitution during teleoperation). “in Proceedings 2002 IEEE International Conference on Robotics and Automation, Washington, DC, USA, 11-15 May 2002, 42–49.
Friedman, R. M., Hester, K. D., Green, B. G., and LaMotte, R. H. (2008). Magnitude estimation of softness. Exp. Brain Res. 191 (2), 133–142. doi:10.1007/s00221-008-1507-5
Fritschi, M., Ernst, M. O., and Buss, M. (2006). “Integration of kinesthetic and tactile display: A modular design concept,” in EuroHaptics International Conference (EH 2006), Paris, France, July 3-6, 2006, 607–612.
Fujita, K., and Ohmori, H. (2001). “A new softness display interface by dynamic fingertip contact area control,” in Proceedings of the World Multiconference on Systemics, Cybernetics and Informatics, July 22-25, 2001, Orlando, Florida. 78–82.
Hauser, S. C., and Gerling, G. J. (2018). Force-Rate cues reduce object deformation necessary to discriminate compliances harder than the skin. IEEE Trans. Haptics 11 (2), 232–240. doi:10.1109/toh.2017.2715845
Hauser, S. C., and Gerling, G. J. (2016). “Measuring tactile cues at the fingerpad for object compliances harder and softer than the skin,” in 2016 IEEE Haptics Symposium (HAPTICS), Philadelphia, PA, USA, 08-11 April 2016, 247–252.
Ikei, Y., and Shiratori, M. (2002). “TextureExplorer: A tactile and force display for virtual textures,” in Proceedings 10th Symposium on Haptic Interfaces for Virtual Environment and Teleoperator Systems. HAPTICS 2002, Orlando, FL, USA, 24-25 March 2002, 327–334.
Kajimoto, H. (2021). “Electro-tactile display kit for fingertip,” in 2021 IEEE World Haptics Conference (WHC), Montreal, QC, Canada, 06-09 July 2021.
Kim, Y., Oakley, I., and Ryu, J. (2006). “Combining point force haptic and pneumatic tactile displays,” in Proceedings of the EuroHaptics, Paris, France, July 3-6, 2006.
Kyung, K.-U., Park, J., Kwon, D. S., and Kim, S. Y. (2006). “Real-time area-based haptic rendering for a palpation simulator,” in International Symposium on Biomedical Simulation, Zurich, Switzerland, July 10-11, 2006, 132–141.
Kyung, K.-U., Son, S.-W., Yang, G.-H., and Kwon, D.-S. (2005). How to effectively display surface properties using an integrated tactile display system. Piscataway: IEEE.
Lin, W., Zhang, D., Lee, W. W., Li, X., Hong, Y., Pan, Q., et al. (2022). Super-resolution wearable electrotactile rendering system. Sci. Adv. 8 (36), eabp8738. doi:10.1126/sciadv.abp8738
Liu, J., Song, A., and Zhang, H. (2007). “Research on stiffness display perception of virtual soft object,” in 2007 International Conference on Information Acquisition, Seogwipo, Korea, 08-11 July 2007, 558–562.
McNeal, D. R. (1976). Analysis of a model for excitation of myelinated nerve. IEEE Trans. Biomed. Eng. 23 (4), 329–337. doi:10.1109/tbme.1976.324593
Nakagaki, K., Fitzgerald, D., Ma, Z. J., Vink, L., Levine, D., and Ishii, H. (2019). “inFORCE: Bi-directionalForce'Shape display for haptic interaction,” in Proceedings of the thirteenth international conference on tangible, embedded, and embodied interaction (Tempe, AZ: ACM), 615–623.
Park, J., Oh, Y., and Tan, H. Z. (2018). Effect of cutaneous feedback on the perceived hardness of a virtual object. IEEE Trans. Haptics 11 (4), 518–530. doi:10.1109/toh.2018.2854721
Root, S. E., Carpenter, C. W., Kayser, L. V., Rodriquez, D., Davies, D. M., Wang, S., et al. (2018). Ionotactile stimulation: Nonvolatile ionic gels for human–machine interfaces. Acs Omega 3 (1), 662–666. doi:10.1021/acsomega.7b01773
Sato, K., Kajimoto, H., Kawakami, N., and Tachi, S. (2007). “Electrotactile display for integration with kinesthetic display,” in RO-MAN 2007 - The 16th IEEE International Symposium on Robot and Human Interactive Communication, Jeju, Korea, 26-29 August 2007, 3–8.
Scilingo, E. P., Bianchi, M., Grioli, G., and Bicchi, A. (2010). Rendering softness: Integration of kinesthetic and cutaneous information in a haptic device. IEEE Trans. Haptics 3 (2), 109–118. doi:10.1109/toh.2010.2
Srinivasan, M. A., and LaMotte, R. H. (1995). Tactual discrimination of softness. J. Neurophysiol. 73 (1), 88–101. doi:10.1152/jn.1995.73.1.88
Takei, S., Watanabe, R., Okazaki, R., Hachisu, T., and Kajimoto, H. (2015). “Presentation of softness using film-type electro-tactile display and pressure distribution measurement,” in Haptic interaction (Springer), 91–96.
Tezuka, M., Ishimaru, K., and Miki, N. (2017). Electrotactile display composed of two-dimensionally and densely distributed microneedle electrodes. Sensors Actuators A Phys. 258, 32–38. doi:10.1016/j.sna.2017.02.021
Tirado, J., Panov, V., Yem, V., Tsetserukou, D., and Kajimoto, H. (2020). “ElectroAR: Distributed electro-tactile stimulation for tactile transfer,” in Lecture notes in computer science (Berlin: Springer Science+Business Media), 442–450.
Withana, A., Daniel, G., and Steimle, J. (2018). “Tacttoo: A thin and feel-through tattoo for on-skin tactile output,” in Proceedings of the 31st Annual ACM Symposium on User Interface Software and Technology, Berlin Germany, 14 October 2018, 365–378.
Xu, C., He, H., Hauser, S. C., and Gerling, G. J. (2020). Tactile exploration strategies with natural compliant objects elicit virtual stiffness cues. IEEE Trans. Haptics 13 (1), 4–10. doi:10.1109/toh.2019.2959767
Xu, C., Wang, Y., and Gerling, G. J. (2021). An elasticity-curvature illusion decouples cutaneous and proprioceptive cues in active exploration of soft objects. PLOS Comput. Biol. 17 (3), e1008848. doi:10.1371/journal.pcbi.1008848
Yao, K., Zhou, J., Huang, Q., Wu, M., Yiu, C. K., Li, J., et al. (2022). Encoding of tactile information in hand via skin-integrated wireless haptic interface. Nat. Mach. Intell. 4, 893–903. doi:10.1038/s42256-022-00543-y
Yem, V., and Kajimoto, H. (2017). Comparative evaluation of tactile sensation by electrical and mechanical stimulation. IEEE Trans. Haptics 10 (1), 130–134. doi:10.1109/toh.2016.2605084
Yem, V., Vu, K., Kon, Y., and Kajimoto, H. (2018). “Effect of electrical stimulation haptic feedback on perceptions of softness-hardness and stickiness while touching a virtual object,” in 2018 IEEE Conference on Virtual Reality and 3D User Interfaces (VR), Tuebingen/Reutlingen, Germany, 18-22 March 2018.
Keywords: softness, force sensation, transcutaneous electrical stimulation, haptics, virtual reality
Citation: Suga Y, Takeuchi M, Tanaka S and Kajimoto H (2023) Softness presentation by combining electro-tactile stimulation and force feedback. Front. Virtual Real. 4:1133146. doi: 10.3389/frvir.2023.1133146
Received: 28 December 2022; Accepted: 17 March 2023;
Published: 24 March 2023.
Edited by:
Myunghwan Yun, Seoul National University, Republic of KoreaReviewed by:
Vincent Levesque, École de technologie supérieure (ÉTS), CanadaTao Zeng, Xiamen University, China
Copyright © 2023 Suga, Takeuchi, Tanaka and Kajimoto. This is an open-access article distributed under the terms of the Creative Commons Attribution License (CC BY). The use, distribution or reproduction in other forums is permitted, provided the original author(s) and the copyright owner(s) are credited and that the original publication in this journal is cited, in accordance with accepted academic practice. No use, distribution or reproduction is permitted which does not comply with these terms.
*Correspondence: Yui Suga, c3VnYUBrYWppLWxhYi5qcA==