 Daniel Schwajda
 Judith Friedl
 Fabian Pointecker
 Hans-Christian Jetter2
 Christoph Anthes
- 1HIVE Research Group, University of Applied Sciences Upper Austria, Hagenberg, Austria
- 2Institute for Multimedia and Interactive Systems, University of Lübeck, Lübeck, Germany
Modern video-based head-mounted displays allow users to operate along Milgram’s entire reality-virtuality continuum. This opens up the field for novel cross-reality applications that distribute data analytics tasks along this continuum to combine benefits of established 2D information visualisation in the real environment with immersive analytics. In this publication, we explore this potential by transforming 2D graph data from a planar, large-scale display in the real environment into a spherical layout in augmented reality 3D space, letting it appear as if the graph is moving out of the display. We focus on design aspects of this transformation that potentially help users to form a joint mental model of both visualisations and to continue their tasks seamlessly in augmented reality. For this purpose, we implemented a framework of transformation parameters that can be categorised as follows: transformation methods, node transformation order (groupings) and different ways of visual interconnection. Variants in each of these areas were investigated in three quantitative user studies in which users had to solve a simple cluster search task. We confirmed that a visual transformation from 2D to 3D helps users to continue their tasks in augmented reality with less interruptions, and that node transformation order should be adjusted to data and task context. We further identified that users can perform tasks more efficiently when a user-controlled transformation is used, while a constant transformation with fixed duration can contribute to lower error rates.
1 Introduction
With recent developments in Mixed Reality (MR) technology, specifically the development of large Field of View (FoV) video-based see-through Head Mounted Displays (HMDs), it has become feasible to develop a new class of MR applications. These MR applications allow the transient movement along Milgram’s Reality-Virtuality Continuum (RVC) (Milgram et al., 1995). They are able to display the real environment with additional augmentations (AR), can support Augmented Virtuality (AV) as well as full Virtual Reality (VR) and are known as Cross-Reality (CR) (Jetter et al., 2021; Maurer et al., 2022) or Cross-Virtuality (XV) (Fröhler et al., 2022). There is a wide range of potential application areas of XV, but the domain of visualisation and Immersive Analytics (IA) (Ens et al., 2021) appears particularly promising, as XV has the potential to help people immersing deeper into their data as described by Chandler et al. (2015). With XV it is possible to further support IA’s objective to improve data understanding and decision making (Marriott et al., 2018) by enhancing it with techniques from the real environment, such as 2D touch interaction with large scale displays, to make use of the full RVC. In particular, it is possible to combine the advantages of traditional 2D information visualisation with the benefits of IA. While 2D information visualisation for instance provides established and efficient ways to manipulate and filter data (Ware, 2010), the use of stereoscopic 3D can add meaningful context (Riegler et al., 2020) by applying an additional axis to conventional 2D visualisations or by displaying data that have a naturally occurring third dimension, such as volumetric or geospatial data (Brath, 2014), as opposed to, for example, graph data that is an abstract representation of data that does not necessarily have a third dimension.
We believe that also graph data visualisation can benefit from this hybrid usage of 2D and 3D technologies. Hence, we explored this potential by interweaving elements from different locations on the RVC in an exemplary graph analytics scenario that allows the transition of data visualisations along parts of this continuum. In particular, we focus on the transition of graph visualisations between a large-scale planar 2D display in the real environment and an AR version of the same data set with a video-based, stereoscopic see-through HMD. By combining well-established 2D graph visualisations with an immersive 3D view on the data in AR, we expect that the comprehension of rather complex networks will be improved in analytic scenarios. It will also enable future work to combine benefits of devices at different stages of the RVC, such as multi-touch input, passive haptic feedback and physical navigation in front of large 2D displays (Kister et al., 2017) with the high level of immersion (Kraus et al., 2021) and unlimited workspace (Nishimoto and Johnson, 2019) of modern HMDs. Therefore, the precise interaction that is possible on 2D touch displays can be introduced to 3D space for data manipulation where raycasting might not be precise enough.
A central question when moving data visualisations from 2D displays into 3D AR space is how this transition should be designed, so that users can continue their task seamlessly in AR without having to re-establish focus on what they previously worked on in the real environment (Schwajda et al., 2021). To establish and maintain such a connection between both visualisations, users need to be able to cognitively follow this transformation from 2D into 3D AR. To support this transformation, an interactively controlled morphing process can improve time, accuracy, and user preference when combining different representation views (Yang et al., 2020). Animated transitions have also been reported to improve user performance and user preference when used between statistical data graphics (Heer and Robertson, 2007), as well as to improve the creation of mental maps of spatial information when used for viewpoint changes in spatial information spaces (Bederson and Boltman, 1999). We believe that carefully designed transformations can greatly help users to understand the relations between a stereoscopic 3D visualisation and its 2D counterpart. They support users in integrating relevant features from both views in a joint mental model of the visualised data. The goal is therefore to derive initial guidelines for the design of data transformations from a 2D space into 3D AR, based on empirical quantitative research.
To assess which factors potentially influence how seamless this transition from 2D to 3D AR is perceived, we designed and implemented different variants of this transformation. These variants were based on our literature research and prototypical testing and cover three major areas of interest that will be further outlined in subsection 3.3: transformation methods, groupings that define node transformation order and visual links that use different degrees of visual interconnection. In multiple pretest iterations, we selected the most promising parameters, uncovered dependencies between them and eliminated usability issues. For each area of interest, we subsequently investigated the users’ recognition capability during the transformation of graph data from 2D into 3D AR with a cluster search task in three different studies. The usage of this rather simple task compared to a full system evaluation allows us to isolate this transformation from other factors and to keep focus on examining the visual transformation from 2D to 3D AR. This initial set of foundational studies provides a starting point for further research into different transformation parameters, layouts and tasks as well as qualitative studies in realistic data analysis scenarios.
We extend the concept for the transformation of graph data from 2D to 3D AR presented by Schwajda et al. (2021) by introducing visual link techniques and providing empiric evidence within three user studies. The main contribution of this publication is therefore the development of a transformation parameter framework and the quantitative comparison of different parameter sets in three controlled user studies from which we derive initial guidelines.
2 Related work
We start our related work section by summarising approaches for visualising graph data and its advantages in 3D, how graph data has already been examined in AR or VR in immersive analytics scenarios and how planar displays have already been interwoven with devices at other locations on the RVC to support data immersion.
2.1 Graph visualisation in 3D
There is a vast amount of literature examining a wide variety of 2D graph layouts such as tree layouts (Walker II, 1990), node-link layouts (Hachul and Jünger, 2006), adjacency matrices (Ghoniem et al., 2004) and tree maps (Ahmed and Hong, 2007). While many of these can be generalised to 3D (Herman et al., 2000), work on graph layouts specifically developed for 3D is comparatively sparse (Hong and Murtagh, 2005). There are, however, observations that 3D graph visualisations can outperform established 2D visualisations such as adjacency matrices, for instance in network comparison tasks (Joos et al., 2022). It is also reported that 3D layouts can mitigate problems with edge crossings or node overlaps that are frequently found in complex 2D layouts (Kotlarek et al., 2020). Three-dimensional spatial relationships between data points can also be used to create mental models that would not be applicable to 2D visualisations (Brath, 2014).
The majority of layouts specifically designed for 3D focuses on visualising hierarchical data with tree-like structures, such as cone trees, in which child nodes form the apex of a cone in 3D space (Robertson et al., 1991). Various derivatives of cone trees exist, in which child nodes are arranged in hyperbolic 3D space (Munzner, 1997; Urribarri et al., 2013) or in naturally occurring phyllotactic patterns (Carpendale and Agarawala, 2004). Hierarchies can also be displayed in 3D as space-filling layouts (Andrews, 2002; Schulz et al., 2009) or by representing nodes as connected bar charts whose height is coupled with node hierarchy level (Keskin and Vogelmann, 1997). An approach also applicable to graphs with no clear hierarchy are spherical layouts that map a 2D node-link layout onto the surface of a sphere. Identified advantages of this layout are for instance a clear overview over the whole network, low physical effort to move around the graph (Kwon et al., 2016), as well as the ability to see nodes without occlusion from inside the sphere (Kwon et al., 2015). Typical graph analysis tasks often involve analysing topological features of a network, such as finding common neighbours and paths (Lee et al., 2006). Studies indicate that these tasks can be performed faster and with less errors in VR by using a spherical graph layout instead of a 2D graph (Kwon et al., 2016), although similar work utilising 3D node-link layouts comes to contrary results (Kotlarek et al., 2020). Thus, we opted for a spherical layout in our study. Mapping data onto a sphere has also been explored with other types of data, such as multidimensional relationships of economic indicators, that are mapped onto spheres (Gross et al., 1997) or where geospatial data is projected onto a sphere (Spur et al., 2022).
2.2 Graph data in AR/VR
Immersive analytics of graph data has been a growing topic in recent years (Fonnet and Prié, 2021) and 3D node-link graphs have already been utilised multiple times for instance in VR (Capece et al., 2018; Burch et al., 2020; Kotlarek et al., 2020). An early comparison of different degrees of motion and stereo depth cues found that head-coupled stereo viewing can increase comprehension of an abstract graphic by a factor of three (Ware and Franck, 1996).
There are observations that users can interpret graph structures more accurately and with lower perceived effort when being immersed into VR (Kotlarek et al., 2020). Task performance for graph analysis and spatial understanding can also benefit from a higher fidelity display with head tracking such as a CAVE (Cruz-Neira et al., 1992) compared to a 2D wall (Henry and Polys, 2010). A comparison between a CAVE-style environment and an HMD in a collaborative graph network analysis, revealed high accuracy in both environments (Cordeil et al., 2016). Task completion time was even faster in the HMD condition. Different input modalities for interaction with 3D graphs in VR have been explored (Huang et al., 2017; Erra et al., 2019). A key aspect for exploring graph data is navigation, which can be provided via real walking (Drogemuller et al., 2018). Considering that real walking is not always possible when exploring graph data in VR due to limited space, navigation can be achieved with fly-through interactive navigation techniques (Capece et al., 2018; Wagner Filho et al., 2018; Erra et al., 2019). Two-handed flying using two controllers was most efficient for node and path finding (Drogemuller et al., 2018). In contrast, hands-free navigation methods were evaluated (Zielasko et al., 2016) in a seated VR experience where a body-leaning metaphor and an accelerometer pedal metaphor performed best in a path finding task. Shifting the graph data from a fully enclosed VR experience to AR is also well suited for graph analysis tasks and can outperform a 2D screen condition (Belcher et al., 2003).
2.3 Extending displays
The use of augmentations to extend planar displays with a monocular see-through HMD has been first proposed by Feiner and Shamash (1991). Extending the display and move data from such displays into the stereoscopic 3D space was first explored by Kijima and Ojika (1997). They discuss a system which allows to move CAD data from a desktop system into an augmented space. Desktop displays have also been extended with AR content by Prouzeau et al. (2019), who also consider potential real world objects which might collide with the extension of the display. Extrusion of 2D and 3D data from mobile and desktop displays has also been demonstrated by Wu et al. (2020).
Other approaches focus on interconnecting multiple 2D views on a large-scale display or on interconnecting multiple large-scale 2D displays spatially (García-Hernández et al., 2016; Reipschläger et al., 2020) in order to provide a larger layout space or to have additional visual information in the form of direct links.
In the area of visualisation, mobile devices have been extended into 3D space with the help of AR displays to use the best of the 2D and 3D world (Langner et al., 2021). A tabletop display has been extended by Butscher et al. (2018) to display parallel coordinates by linking them in 3D space. Mahmood et al. (2018) specifically focus on the use of a large layout space by providing visualisation areas relative to a large-scale 2D display. To overcome the spatial limitations of large-scale displays, Nishimoto and Johnson (2019) suggest to extend these displays with the help of AR in case the observed area is in the border areas of the display. Data display of 3D data relative to a large-scale planar display is shown by Büschel et al. (2021). They use the 3D space to collaboratively discuss data with the help of HMDs and tablets. Seamless extrusion of typical 2D visualisations like histograms, bar charts, line graphs, scatterplots, and parallel coordinate plots into AR 3D and vice versa have also been demonstrated by Seraji and Stuerzlinger (2022a). They also show how visualisations can be authored and shared collaboratively between users being immersed in AR and users working in a conventional desktop setting (Seraji and Stuerzlinger, 2022b).
For design and modelling tasks the extrusion of mobile displays has been presented by Reipschläger and Dachselt (2019). Similarly, De Araújo et al. (2013) demonstrated their 3D modelling approach with a combination of AR and a tabletop display. Although a plethora of display extensions have been prototypically implemented and discussed, no detailed investigation of different extrusion techniques has been presented yet.
The transition of virtual objects between AR and VR without deformation has been recently explored by Cools et al. (2022), as well as techniques for the transitioning of users along the RVC (Pointecker et al., 2022). Further current publications focus on formalising a design space (Wang and Maurer, 2022). Lee et al. (2022) suggest a high-level design space for transformations between 2D and 3D in MR environments, that covers the visualisation’s initial, intermediate and final state during the transformation as well as user interaction techniques and input modalities. They show several examples how traditional 2D visualisations such as bar charts, scatter plots and histograms can benefit from being extended from a planar surface into 3D space. Furthermore, a use case for graphs is demonstrated in which the shortest path between two nodes is extracted into 3D space. Several aspects of this design space were applied throughout our design process. A similar suggestion for a design space to link 2D with 3D data is made by Santos et al. (2022).
3 Transformation design
In this section, we give a first overview over the setup and general process how we transform graph data from the real environment into stereoscopic AR. We continue by briefly summarising our applied design process whose steps and results are outlined in detail in sections three and four, before we explain the developed transformation parameters as part of our framework in detail.
3.1 General process and transformation sequence
Our setup displays a web-based 2D node-link graph visualisation on a touch-enabled, large-scale 2D display. This visualisation is connected via a web socket with a Unity application running on a video-based see-through HMD. The fundamental idea is to move the graph data from its initial layout out of the 2D display into 3D space. We use for this process the term “transformation” because the graph visualisation is not only extruded out of the display as in similar works (Reipschläger and Dachselt, 2019; Wu et al., 2020), but also deformed into a new 3D layout.
The starting point for this transformation forms the 2D graph visualisation on the large-scale display. This graph is used as an initial layout, which is gradually converted into a pre-defined target 3D layout during the transformation. We chose a deterministic layout at his point, because our goal was to examine the transformation parameters in subsection 3.3 with as little distortion as possible. When the transformation is started, a 2D graph with identical layout is displayed on the HMD in AR. To let it appear as if the graph is moving out of the large-scale display, the AR graph has to be registered exactly with the graph on the 2D display to avoid perceiving them as different networks. This is achieved by calculating the geometric centre of the graph on the 2D display and converting it from pixel coordinates to the physical position on the screen. With the known position of the 2D display in AR tracking space, the centre of the AR graph is then aligned with the centre of the graph on the 2D display. Furthermore, the AR graph is scaled to the physical size of nodes and edges on the 2D display.
The actual transformation can be compared with common morphing concepts from computer graphics (Gomes et al., 1999) or with defining key frames when using blend shapes for facial animation (Joshi et al., 2006). It is established by interpolating node positions from the outgoing 2D position to the target position in the 3D layout for all nodes during each position update. We also identified more sophisticated transformation algorithms that do not require a predefined target layout (Malik and Choudhary, 2016), but did not use them due to their run-time and their previous usage only from 3D to 2D. The centre of the graph is simultaneously moved 1.5 m away from the display towards the centre of the AR tracking space during transformation, if otherwise parts of the graph would intersect with the large-scale display after the completion of the transformation.
3.2 System evolution
Before we started to identify relevant factors for the transformation of data visualisations between the real environment and AR, we first focused only on the visual transformation from 2D to 3D and vice versa without any interconnection with devices in the real environment. For this purpose, we first developed a Unity application that can be run on the HMD either in AR or VR, enabling future work to transform data visualisations also from VR to other locations on the RVC. Via a test user interface, a 2D graph dataset was loaded and could be compared to its 3D target layout counterpart by switching between them. After setting parameters, the transformation between 2D and 3D could be visually tested via a progress bar in the test user interface. This progress could also be synced via a web socket or a MLAPI plug-in to other devices, for instance to other co-located or remote HMDs to enable future work to examine collaborative scenarios. This first iteration included as transformation parameters already varying transformation speeds, interpolation methods, target layouts and different algorithms for transformation order (groupings as described in subsection 3.3.2).
In the next step, the AR graph was combined with a large-scale display in the real environment. This was achieved by running an Angular web application on the 2D display that is connected to the Unity application of the HMD. Via selecting a dataset on the HMD and synchronising it via the web socket, the 2D graph with the same layout was displayed also on the large-scale display. The 2D AR graph was then in turn aligned with the graph on the large-scale display as explained in the previous section. The integration of the large-scale display however required porting of the application to a HMD with higher camera resolution (details can be found in subsection 4.3), as single nodes were hardly visible on the large-scale display through the HMD.
After coupling the large-scale display with the HMD, the first question that emerged was how the transformation from 2D real environment to 3D AR can be initiated and controlled in a more realistic scenario without a test user interface. By applying relevant parts of the design space by Lee et al. (2022), we therefore conceptualised, implemented and tested different transformation methods as outlined in subsection 3.3.1. Especially when testing with groupings when not all nodes are transformed at once, we identified a need for further visual hints during the intermediate state of the transformation, so that users are supported in following the transformation and keeping a link between the graph in the real environment and the graph in AR. We therefore also conceptualised and implemented in parallel different visual links as outlined in subsection 3.3.3. This left us with three main categories of transformation parameters as explained in subsection 3.3: transformation methods, groupings and visual links.
To test how these parameter sets can help users following the transformation and continuing their task in AR, we decided to examine each transformation parameter category in three individual user studies, however with a coherent task and study design as described in section 5. Before each upcoming user study, we ran a test phase, in which different users tested the concerning transformation parameters during informal pre-studies as described in subsection 4.2. The collected feedback as well as results from iterative, prototypical pre-testing were then used to identify and fix usability issues, to further refine the transformations and to exclude parameters that were not expected to deliver promising results. With the results of each part study, we further refined the selection of transformation parameters and continued with the most promising conditions from the previous study.
3.3 Developed transformation parameters
Based on our findings from literature and prototypical testing as described in subsection 3.2, we developed a framework of parameters that potentially influence how fluent and seamless the visual graph transformation from 2D displays into AR 3D space is perceived (see overview in Table 1). Hence, we primarily address relevant design decisions for the transformation’s intermediate visualisation state identified by Lee et al. (2022). These parameters were subsequently implemented in a demonstrator application. Although we designed and implemented these parameters specifically for the transformation of graph data, we believe that most of them can be applied to other data visualisations with adaptations, for instance to extend 2D scatter plots by an additional axis or by partitioning other conventional 2D visualisations such as bar charts in 3D space as suggested by Lee et al. (2022).
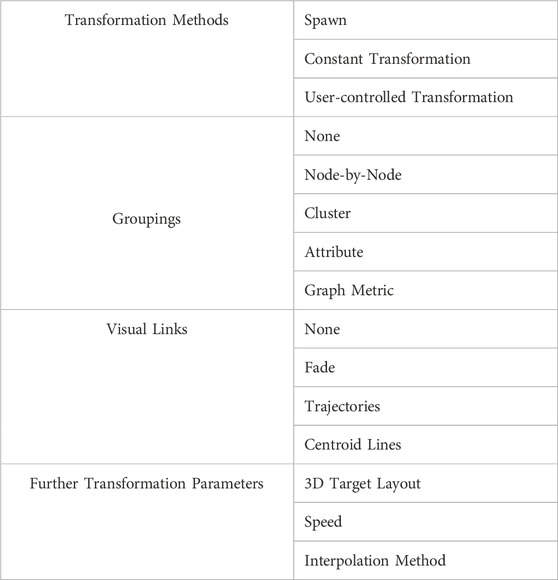
TABLE 1. Overview of the framework’s transformation parameters.
3.3.1 Transformation methods
Transformation methods in the context of our scenario describe how the graph data visualisation transformation from 2D real environment into 3D AR can be initiated and how its progress is controlled. We do not target the actual data manipulation of the graph to evaluate the transformation parameters without bias and distraction. While this initialisation can be implemented in a variety of ways, we believe that most transformations can be classified as follows:
Spawn: The graph is transformed instantly from 2D into its target 3D layout, without a visual animation in-between. This represents a binary switch between the 2D graph on the large-scale display as in Figure 1A and the AR graph already fully transformed to 3D as in Figure 2C and can be seen as a baseline condition.
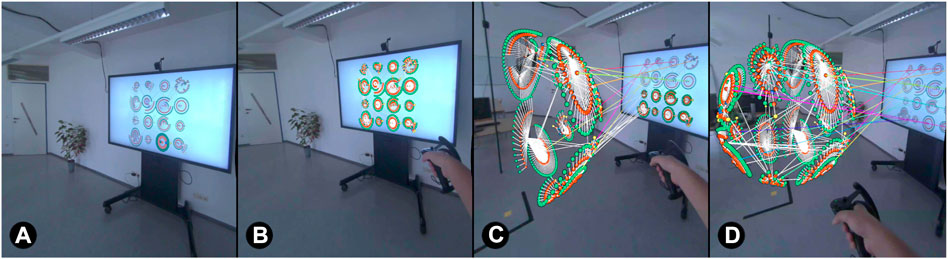
FIGURE 1. Illustration how graph data on a 2D display (A) can be moved into AR 3D space. When starting the transformation, graph spawns in AR and is aligned with graph on the 2D display (B). By using a pull gesture, the AR graph moves gradually away from the display and transforms into a new 3D layout (C,D). Cluster centroids of both graphs are connected with a line as visual guidance.
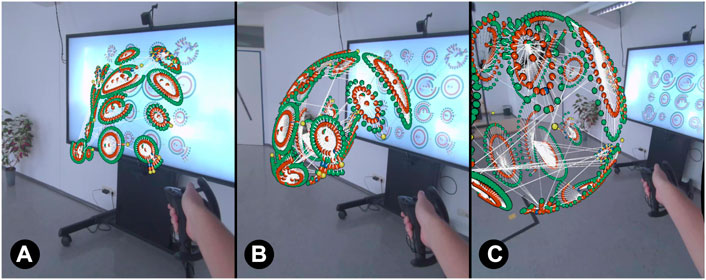
FIGURE 2. Transformation progress when testing transformation methods. The entire graph is moved gradually into AR 3D. A constant transformation requires no controller motion ((A)
Constant Transformation: The constant transformation can be classified as fixed transformation in the design space of Lee et al. (2022) and represents an open-loop control paradigm (Nacenta et al., 2009). All transformation parameters such as order of nodes, speed and duration are set before initiating the transformation, and users cannot adjust their actions before the object is in its final position. The transformation is started uni-directional with those fixed parameters at a fixed speed without the possibility for adhoc adjustments (see sample progress in Figure 2). In our system, users start the constant transformation by pressing a UI button with a virtual laser pointer attached to their hand controller.
User-controlled Transformation: A user-controlled transformation is based on a closed-loop control paradigm which enables users to adjust the execution of an action before it is finished (Nacenta et al., 2009). In our case, it allows to directly manipulate the progress of the transformation and can therefore be classified as controlled transformation in the design space of Lee et al. (2022). After setting parameters and initiating the transformation, progress can be controlled by pausing or adapting the speed of the transformation, for instance by adjusting the speed of controller motion as in our implementation. Unlike the constant transformation, this is a bi-directional process allowing to undo and repeat parts of the transformation. In our prototype, the user-controlled transformation is implemented with a pull gesture of the hand controller, similar to mid-air grab-and-pull gestures already utilised for transformations from 2D to 3D (Lee et al., 2022). By pressing and holding the trigger of the controller and moving it away from the 2D display, the graph can be pulled out of the display along the z-axis and gradually transforms into its target 3D layout (see Figure 2). The graph motion distance is not linearly mapped to the controller motion to reduce physical effort. By reversing the controller movement direction, the transformation can also be undone.
3.3.2 Groupings
With groupings, we define the order in which nodes are transformed into 3D AR. By applying certain criteria, nodes are bundled into categories which in turn are transformed sequentially into 3D space. This can influence which nodes are perceived as one unit as defined in the Gestalt principle of common fate (Chalbi et al., 2020). The order between created groups is a further design consideration. Based on our prototypical testing, we identified and implemented the following groupings:
None: All nodes of the graph are transformed simultaneously, so that the entire graph is transformed at once as in Figure 2.
Node-by-Node: Each individual node of the network is transformed on its own.
Cluster: All nodes belonging to the same cluster within the graph are transformed together, so that one cluster after another moves into 3D as in Figure 3.
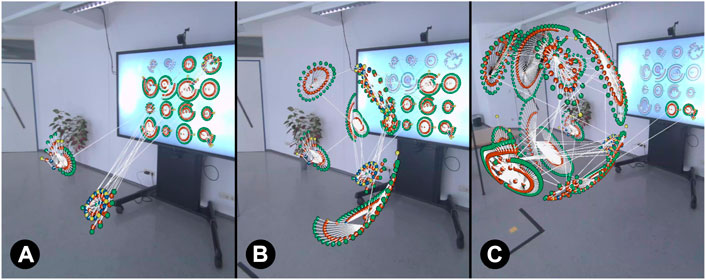
FIGURE 3. Visual transformation progress when using clusters as grouping criterion. Starting with the top-left cluster, clusters are transformed one after another into 3D AR ((A)
Attribute: Transformation order is determined by node attribute values such as company sector, so that all nodes within the same sector are transformed together as illustrated in Figure 4.
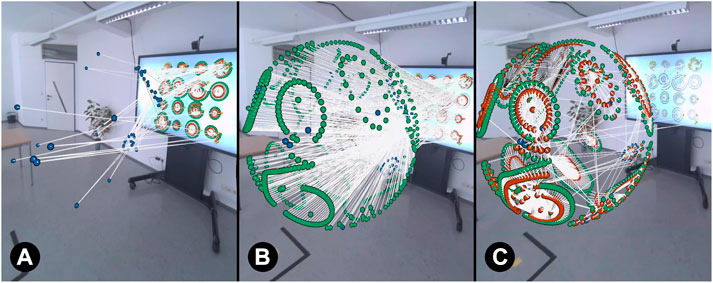
FIGURE 4. Transformation progress when company sector is used as grouping by node attribute. Company sectors are colour-coded in the data set ((A)
Graph Metric: Nodes are ordered by centrality measures (Wasserman and Faust, 1994) such as node degree, closeness or betweenness centrality so that for instance nodes with high degree - i.e., many direct neighbours - move first out of the display as illustrated in Figure 5.
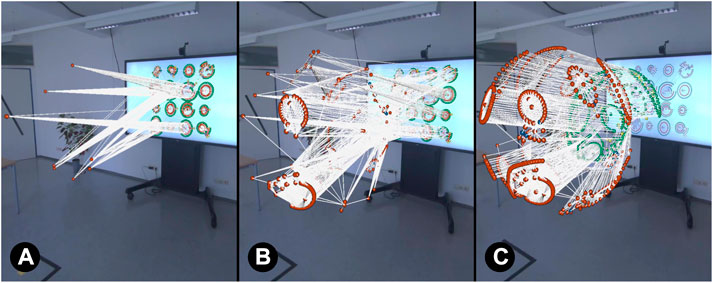
FIGURE 5. Transformation progress when node degree is used as grouping by graph metric. Nodes with many edges move first into AR 3D space ((A)
3.3.3 Visual links
Visual Links describe different ways of visual interconnection between the graph on the 2D display and the graph in AR during and after transformation into 3D AR. These links can act as visual guidance to rediscover graph areas in AR that were previously focused on the 2D display:
None: The transformation is executed without additional visual cues.
Fade: As illustrated in Figure 6, the opacity of nodes and edges that are currently transformed into 3D AR is gradually reduced with transformation progress, so that they fully disappear on the 2D display when their transformation is completed. If the transformation is reversed, opacity is increased again. While this emphasises the illusion that the graph is moving out of the 2D display, users cannot reference to the 2D graph at the end of the transformation when they continue in AR.
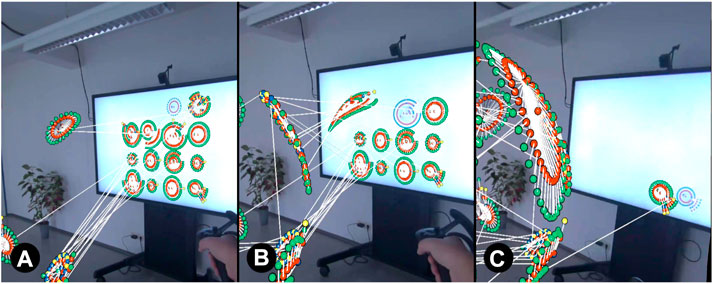
FIGURE 6. Visual transformation progress when grouping by cluster is combined with fade. Clusters transformed into AR 3D space gradually disappear on 2D display ((A)
Trajectories: Trajectories are based on motion lines that are an omnipresent part of the visual language in comic literature (McCloud, 1993; Cohn, 2013). These lines help viewers to better understand and remember the direction of moving objects in static images (Kim and Francis, 1998; Burr and Ross, 2002; Kawabe and Miura, 2006; Kawabe et al., 2007) and to reduce required viewing times compared to using no lines (Cohn and Maher, 2015). We utilise these effects by temporarily displaying the nodes’ movement path with a line for each currently transformed node (see Figure 7). This line is created by drawing polygons behind each moving node after its next position update during the transformation, leaving a trail behind the node. The already drawn polygons disappear after a fixed time emphasising the feeling of motion.
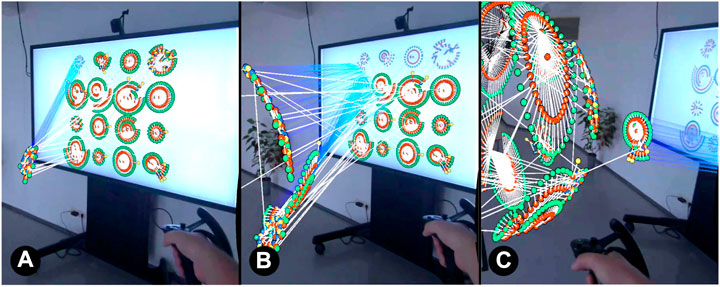
FIGURE 7. Visual transformation progress when grouping by cluster is combined with trajectories. Nodes currently transformed into 3D leave a temporarily visible, transparent motion line ((A):
Centroid Lines: Centroid lines visually link each cluster centroid of the graph on the 2D display with the corresponding centroid in the AR graph during and after the transformation to 3D AR by drawing a straight line between them (see example in Figure 1). Unlike trajectories, these lines are persistent and can be used as reference between the two graphs also after completion of the transformation.
3.3.4 Further transformation parameters
In this section we outline transformation parameters that are part of our conceptual framework, but were not investigated yet in our quantitative research. These are the target layout to which the 2D graph should be interpolated during the transformation, the speed of the transformation and the deployed interpolation method during transformation. We did not investigate these parameters in our studies since there are numerous layouts that need to be analysed in future research, optimal speed highly depends on the exact transformation configuration and interpolation method is hardly noticeable in the short time during the study. Further details on our decisions can be found in subsection 4.2.
3D Target Layout: The target layout to which the nodes are interpolated during transformation defines the graph’s visual appearance in AR after the completion of the transformation. As outlined in section 2, graph networks can be represented in a variety of ways. The“optimal” layout however highly depends on context and different layout methods can produce rather diverse results (Gibson et al., 2013; Kwon and Ma, 2020).
Speed: The transformation speed defines the size of the positional shift of nodes between each frame during transformation, which determines the total duration of the transformation. In our implementation of the user-controlled transformation the speed is coupled to the speed of the hand controller when performing the pull gesture. For the constant transformation, a trade-off between experienced efficiency and the ability to still cognitively follow the transformation has to be made. From our pretests we determined a minimum duration of 10 s without groupings and 15 s with groupings as sufficient.
Interpolation Method: During the transformation, the next node position is calculated by interpolating from the current node position to the final position in the target 3D layout. With different interpolation methods based on linear, exponential, logarithmic, sinus or tangent functions we can vary node position changes during the progress of the transformation. While for instance linear interpolation causes constant node position changes during each update, exponential interpolation increases position changes towards the end of the transformation.
4 Prototype setup
In this section we give insights about the data set we used for our studies, describe the iterative process we followed to identify the potentially most relevant transformation parameters and give an overview about the used apparatus and implementation details.
4.1 Data set and layout algorithm
As data set for our study we used a supply chain network provided by Willems (2008) that has been widely used in the research community for optimisation problems. This network consists of 16 clusters that are formed by 1,386 nodes and 1857 edges. Node colours in both layouts represent different company business sectors, which are manufacturers (red), part suppliers (green), transport (blue) and distributors (yellow). These colours were adapted to a colour scheme that minimises the impact of colour blindness (Wong, 2011). We chose a graph dataset as it provides an abstract data visualisation that often benefits from a third dimension. In contrast, data that is naturally 3D, such as volumetric data, has an inherent representation.
The network layout was created with core concepts of NetBioV (Tripathi et al., 2014) by visualising clusters in a 2D node-link diagram that distributes the clusters evenly across the screen in four rows and four columns. As we focused in this work exclusively on the parameters of the actual transformation, we applied similar to other studies (Erra et al., 2019; Kotlarek et al., 2020) only one 2D base layout and one target 3D layout to avoid distortion in study results by varying target layouts. For the 2D layout we chose a layout that provides clear, distinguishable clusters without too much occlusion of the individual nodes to enable the use of a cluster search task. For the 3D layout, we decided for a spherical 3D target layout by mapping clusters onto the surface of a sphere. This preserves key characteristics of the 2D graph and ensures a good overview over the entire network also in 3D (Kwon et al., 2016) and should therefore help users to maintain a connection to the graph on the 2D display. Although there are more “organic” 3D node-link layouts utilising more extensively immersive space as for instance presented by Kotlarek et al. (2020), these layouts perform not necessarily better than 2D layouts (Joos et al., 2022). Some studies indicate that spherical layouts in VR can improve error rates and completion times for a variety of typical graph analysis tasks, such as finding common neighbours, highest degree nodes and paths, as well as recalling node locations (Kwon et al., 2015). Furthermore, spherical layouts can reduce frequently mentioned problems with occlusion (Jeong and Pang, 1998; Joos et al., 2022) and edge crossings (Archambault et al., 2007), particularly in 3D (Lu and Si, 2020).
4.2 Iterative pretesting and parameter selection
We conducted several iterations of informal pre-studies and prototypical testing to determine the most influential transformation parameters from subsection 3.3 for our upcoming user studies and to identify potential dependencies between transformation parameters. We also tried to uncover usability issues and to find satisfactory thresholds for each transformation parameter configuration.
We decided to test all three transformation methods, which can also be seen in Supplemental Video S1. While spawn was included as baseline condition, we included constant and user-controlled transformation to observe whether there are actual or perceived differences in task efficiency and whether the user-controlled transformation is potentially too distracting. Groupings were reduced to three: none, cluster and attribute, which in our data set are best suited to preserve the users’ mental map (Archambault et al., 2018) during and after the transformation and which can also be seen in Supplemental Video S2. While cluster appears natural for a cluster search task, we also included attribute in which we used business sector as criterion. This attribute is colour-coded in our data set as described in the previous section and represents a dominant visual feature in our data set, so that it preserves most parts of cluster structures during transformation. None was again included as baseline condition. We discarded node-by-node, as this would have resulted in a very lengthy transformation due to the data set size with 1,386 nodes. While grouping by graph metric appeared promising at first sight, we also discarded this criterion, as it led to considerable visual clutter due to node-following edges during the transformation, when for instance nodes with high degree were transformed first into 3D. All implementations of visual links were included, as we expected differences in task performance between these different levels of visual interconnection. The evaluated visual links can also be seen in Supplemental Video S3.
We decided also not to assess different interpolation methods, as differences were difficult to notice visually, especially for the user-controlled transformation. Therefore, linear interpolation was used as default. Different transformation speeds were also not tested, as we considered it as a too narrow design aspect, as long as a sufficient threshold is selected that allows users to cognitively follow the transformation.
However, tests revealed that the optimal transformation speed appears to depend on whether groupings are used or not. While without groupings a constant transformation duration of 10 s was considered as sufficient, this was considerably too fast for groupings with many groups, allowing each individual group only a small proportion of the 10 s total duration to transform. Therefore, the logic was adapted so that constant transformations have a minimum duration of 15 s with groupings, but at least one second for each group.
A further identified usability issue was that the order of groups should be deterministic when cluster is used as grouping. We therefore added a sequencing order, so that clusters were transformed into 3D from the top-left to bottom-right. When using trajectories, we identified problems with occlusion and visual clutter due to the motion lines occluding the graph on the 2D display. We addressed this by adapting line colours, adding transparency and reducing the time for which the lines are visible to 0.5 s after the last movement of the transformed node. Furthermore, centroid lines were not clearly distinguishable from each other during the first iterations, as they were assigned the same colour. This was adapted to assigning each centroid line a unique colour from a predefined colour palette.
4.3 Apparatus and implementation
The AR graph visualisation, the graph transformations from 2D to 3D with all parameters described in subsection 3.3, as well as the user study guidance and collection of study data were implemented with Unity (2021.2.15f1). While first prototypical tests were run on an HTC Vive Pro1, the application was later migrated to a Varjo XR-32 to address the poor camera resolution for video-based AR on the HTC Vive Pro. The Varjo XR-3 features a dual display architecture per eye, with a total FoV of 115° at 90 Hz. While the focus display features a resolution of 70 pixels per degree (27 ° × 27 °), the context display delivers 30 pixels per degree. The built-in front cameras (dual 12-megapixel) were used for the camera stream of the real environment. The HMD was operated on a PC with a Geforce RTX 3090, an Intel Core i9-11900K, and 64 GB of RAM, which achieved an average frame rate of 82 frames per second.
As input devices, Valve Index hand controllers3 were used from which study participants could chose either the left- or right-handed controller. For the selection of buttons in the study user interface as well was the selection of graph clusters, a simple laser pointer, intuitive and familiar to most users with VR experience (Kotlarek et al., 2020), was used that was activated when the thumb was put on the controller’s touchpad and when there was currently no transformation in progress. When performing a user-controlled transformation, the graph could be pulled out of the display by pressing and holding the hand controller’s trigger and by moving the controller gradually away from the screen. A short haptic feedback via controller vibration lasting 500 ms was provided when the transformation was completed.
6DOF tracking for HMD and controllers was provided by four Lighthouse base stations, mounted in the middle at each side of the tracking space, enabling users to move in a 4 × 4 m tracking space. The position of the large-scale display in tracking space was initially determined with a Vive Tracker, but had to be configured statically after migrating to the Varjo HMD due to the lack of Vive tracker support in Unity’s OpenXR system at the time of writing.
The graph visualisation on the large-scale display was implemented as an Angular web application utilising D3.js for graph rendering. This application was operated on an off-the-shelf laptop with an Intel Core i7-8650U, 32 GB of RAM and a Geforce MX130 GPU. Graph data as well as events for graph alignment and user-study-related UI changes were synchronised via a web socket connecting the Angular application running on the large-scale display with the Unity application on the HMD.
5 User studies
To gain insights into the influence of transformation methods, groupings and visual links on user performance when transforming data from 2D to 3D AR, we conducted three distinct quantitative experiments. Each of the studies investigates one set of these transformation styles, however, the results of the first user study influenced the design of the conditions for the second and third user study. This transfer of results was performed to limit variation within a study and produce clearly measurable effects. All three studies were based on the same study task, data set (subsection 4.1), apparatus (subsection 4.3) and used the same procedure. We did not evaluate a specific design for a transformation, but instead investigated a set of possibly influential aspects of the transformation process. Since these parameters potentially only have a small effect on performance and task load, we chose a study design that isolates the effects of the manipulated parameters. We chose a within-subjects design for all of the studies to eliminate any effects based on differences between the groups. To counter learning effects within the studies we used a (balanced) latin square study design. Furthermore, there were at least 4 weeks between each study to counter learning effects across studies. In this section, we describe the design of the three user studies as well as the hypotheses. The results and discussion is then presented in section 6.
5.1 Task
At the start of the task, the complete 2D network representation was displayed on the large-scale display. Then, a randomly selected cluster was highlighted by letting its corresponding nodes pulsate, which was achieved by continuously in- and decreasing their node radius. When the participants were ready, they confirmed that they saw the cluster by using the pointer to select a button in the digital user interface. As soon as the button was pressed, the cluster stopped pulsating and the transformation started in accordance with the respective condition. When the transformation was completed and the graph was displayed entirely in 3D AR, the users used the pointer to select the same cluster in the 3D graph that was highlighted previously in 2D on the large-scale display.
Over all studies, the same task was used for each trial in each condition to collect more data and receive comparable results. While there is a wide variety of other typical, more complex graph tasks (Lee et al., 2006), we chose a cluster search task as it provided precise measurability of the transition process without introducing additional confounding factors. Since the main focus of our quantiative study design was to measure the influence of the respective transformation parameters and the transformation process itself on the users’ ability to connect the 2D representation to its 3D counterpart, we assume that when applied to a realistic scenario with more complex tasks, users would be able to continue with a task after the transformation without interruption. However, our studies only provide an indication for that and the reality of a more complex task should be investigated in a more qualitative study in future research.
5.2 Measures
For all studies, we measured performance by automatically tracking task completion time (from the start of the transformation to selecting a cluster), search time (the time it took to select a cluster after the transformation was completed) as well as error rate for each study. Additionally, we asked users to fill out the simulator sickness questionnaire (SSQ) (Kennedy et al., 1993) before the start of the first condition and after each condition to check for differences in symptoms of simulator sickness. To measure subjective task load, participants also completed the NASA Task Load Index (Hart and Staveland, 1988) without weighting of scales (Hart, 2006) (RTLX) after each condition. For studies two and three we added an informal question on the users preferred condition. We then performed null-hypothesis significance tests on task completion time, search time, error rate and workload data. In the results section of each user study, we only report on significant results. Since there was no effect on the SSQ for any of the user studies, it is not mentioned in the results or discussion. Furthermore, all participants in each study had normal or corrected to normal vision.
5.3 Procedure
In each study, participants first received a short introduction and then gave their informed consent to the data collection on a GDPR compliant form. Then, participants filled out the SSQ to provide a baseline for the following measurements. Afterwards, participants started with the first condition. The order of conditions was counterbalanced using a latin square design for study one and a balanced latin square design for study two and three. In each condition over all three studies, participants first received a short instruction on the respective transformation and then performed one demo trial in this condition before performing the experiment trials. In the first user study, the demo trial was followed by three experimental trials per condition, whereas for the second and third user study users performed four experimental trials per condition. In each study, participants were asked to fill out the SSQ again and then the RTLX, after completing the final trial in a condition. After finishing all conditions and filling out all questionnaires of a study, a demographic questionnaire was administered. In the second and third study then added the quesiton on preference.
5.4 Study 1: Transformation methods
In this study we compared the transformation methods described in subsection 3.3 with each transformation method being one condition: spawn, constant and user-controlled.
Hypotheses: Based on our experience during implementation and testing iteration cycles, we expected the spawn condition to perform worse in all performance measures as well as in the overall task load, as it provides no visual transformation. The constant condition provides visual guidance but does not allow user-control. Hence, we assumed that it would outperform the other conditions for error rate. However, for search time and task completion time we expected the user-controlled transformation to outperform the other conditions, as users had the ability to shorten the transformation time, leading to shorter task completion times, and repeat the transformation when necessary, leading to a shorter search time. Finally, we expected the user-controlled condition to lead to an increase in overall task load as it requires more interaction from the users. This led to the following hypotheses for study 1:
• H1.1: spawn will produce higher error rates, higher search times as well as a higher overall task load than all other conditions.
• H1.2: constant will produce the lowest error rate among all conditions, but a higher task completion time and search time than user-controlled.
• H1.3: constant will lead to lower overall task load than user-controlled and spawn conditions.
Participants: 19 participants were recruited from students and faculty at the university campus (7 women, 12 men). The average age was 29 (SD = 6.13) years ranging from 20 to 41. Eight participants had either never worn a VR headset or only once. Twelve participants had a university degree, seven had a high school diploma as highest completed education and one participant completed an apprenticeship.
5.5 Study 2: Groupings
In the second user study we investigated the groupings in the transformation process described in subsection 3.3. Therefore, we chose constant and user-controlled transformation methods, based on the results of the first study, to be combined with the groupings of the data. As described in subsection 4.2, we selected the two groupings that appeared to be the most promising in the pretesting phase. Due to our task being a cluster search task and the prominent presentation of clusters in our layout, the cluster grouping was chosen for the second study. Furthermore, we selected node attribute grouping with business sector as attribute which is represented by colour in our data set and is therefore easy to understand and easy to spot. Thus, we ended up with four distinct conditions: user-controlled cluster, user-controlled attribute, constant cluster and constant attribute. Additionally, we increased the number of trials for this user study to four experimental trials per condition and added a question on the preferred condition at the end of the study.
Hypotheses: As the study task was a cluster based search task, we expected the conditions with cluster grouping to produce lower overall task load and lower error rates than conditions with attribute grouping. Furthermore, we expected to reproduce the results for the constant and user-controlled transformation methods found in study one. Therefore, we assumed that conditions with constant transformation would lead to a longer task completion time, but a shorter search time. Based on the combination of grouping and transformation method we expected that the condition with cluster grouping and user-controlled transformation will outperform all other conditions in task completion time, because it gives the users control over the transformation duration and fits the cluster search task. Nevertheless, we assumed that the constant transformation combined with cluster grouping would produce the lowest error rates, since it forces users to spend more time on the task watching the transformation process. Therefore, we expected the following outcomes for study 2:
• H2.1: all conditions with cluster-based grouping will result in lower error rates than conditions with attribute-based grouping.
• H2.2: conditions with cluster-based grouping will result in lower overall task load than conditions with attribute-based grouping.
• H2.3: conditions with constant transformation will result in higher task completion times and lower search times.
• H2.4: the lowest task completion time will be achieved with the user-controlled cluster condition, while the lowest error rate will be achieved with the constant and cluster condition.
Participants: 20 participants were recruited from students and faculty on the university campus (10 women, 10 men). The average age was 31.45 (SD = 6.05) years ranging from 25 to 50. Six participants had less than 6 months experience with HMDs for AR or VR. 19 participants had a university degree while one participant had a high school diploma as highest completed education. Five participants had also participated in the first user study.
5.6 Study 3: Visual links
In the third study we investigated differences between the three different types of visual links outlined in section 3: fade, trajectories, centroid lines, as well as none as a baseline condition without any visual link. Based on the results of the first and second study, we chose to pair the visual links with the user-controlled transformation and cluster-based grouping.
Hypotheses: We expected that the control condition without any visual links would be outperformed by all other conditions in error rate, task completion time, search time and overall task load, as it provides no visual guidance apart from the transformation itself. Furthermore, we assumed that the trajectories and centroid lines conditions would lead to a significantly lower error rate, task completion time, search time and overall task load than the fade condition. This assumption was based on the fact that fade displays less obvious visual hints and only aids the user in keeping track of the transformation progress and does not provide additional guidance to find the respective cluster in the 3D layout. Finally, we expected that centroid lines would lead to the lowest overall task load, search time and error rate out of all conditions, as it provides a clearly visible guidance for the users without introducing too much visual clutter. Therefore, we expected the following outcomes for the visual links.
• H3.1: all conditions with visual links will lead to lower error rates, completion and search times as well as lower overall task load compared to the baseline condition with no visual hints.
• H3.2: the fade condition will result in higher error rates, task completion times and overall task load compared to the conditions with more visible visual links, trajectories and centroid lines.
• H3.3: the lowest error rate, search time and overall task load will be observed with centroid lines.
Participants: 18 participants were recruited from students and faculty on the university campus as well as four participants not associated with the university (6 women, 12 men). The average age was 32.11 (SD = 10.50) years ranging from 17 to 55. Eight participants had less than 6 months experience with HMDs for AR or VR. The highest completed education was a university degree for twelve participants, secondary school for three participants, a high school diploma for two participants and a vocational middle school for one. Three participants had also taken part in both prior studies and four had participated in one other study.
6 Results
6.1 Study 1: Transformation methods
6.1.1 Data analysis
Due to a malfunction of the workstation, data of the first condition of a female participant was lost. Therefore, all data of this participant was excluded from data analysis. Neither the time data nor the scales from the RTLX were normally distributed, based on a Shapiro-Wilk test. Thus, we used a Kruskall-Wallis test for the time data and the RTLX data and a chi-squared test for the error data. For post hoc pairwise comparisons, the Bonferroni correction was applied.
6.1.2 Results
We found a significant difference in task completion times (H (2) = 47.55; p < 0.001) with the post hoc pairwise comparison showing that the user-controlled transformation (M = 9.64; SD = 5.44) was significantly faster than the constant (M = 13.49; SD = 4.19) and spawn (M = 28.79; SD = 28.34) transformation, see Figure 8A.
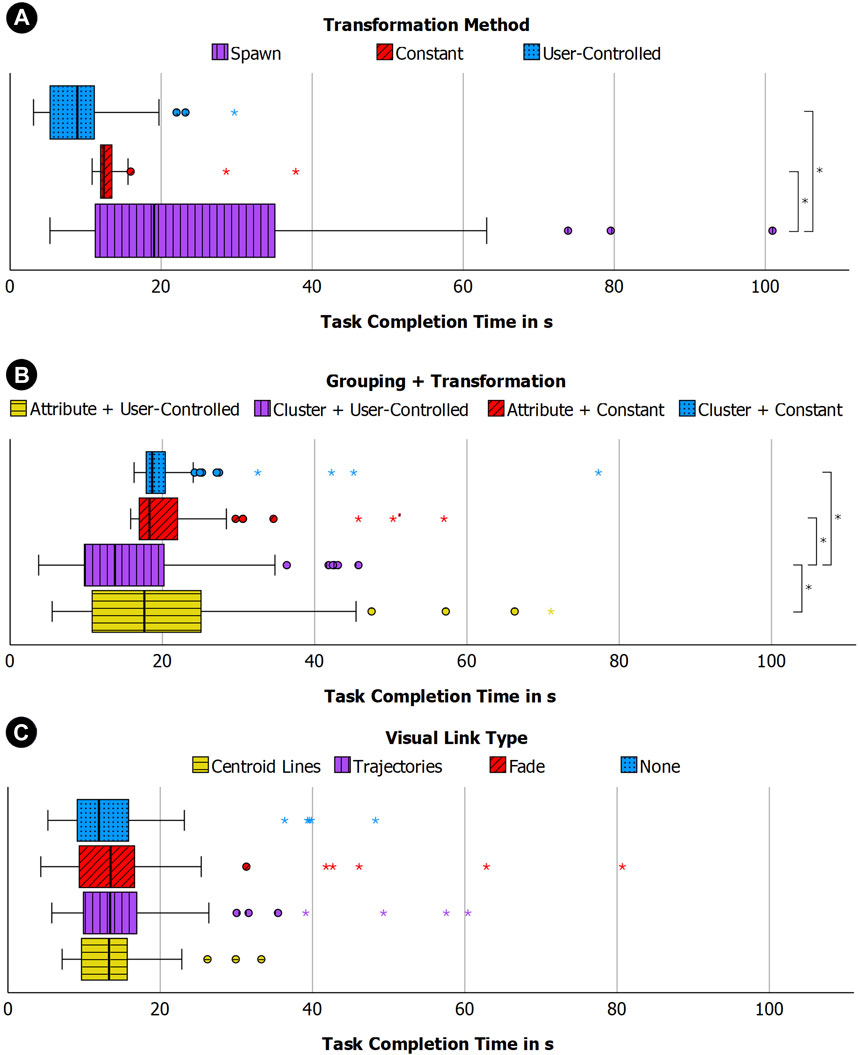
FIGURE 8. Boxplots illustrating distribution of task completion times for study 1 with transformation methods (A), study 2 with groupings (B) and study 3 with visual links (C).
When comparing the search time we also found a significant difference (H (2) = 98.03; p < 0.001). The post hoc test then revealed that the constant transformation (M = 3.49; SD = 4.19) was significantly faster than the user-controlled condition (M = 5.60; SD = 4.64), which in turn was faster than spawn (M = 28.79; SD = 28.34).
The error data revealed a dependency between the transformation type and the error rate (χ2 (2, N = 162) = 16.20, df = 2, p < 0.001). A post hoc test then showed that users selected the correct answer significantly more often than expected when using the constant transformation (expected: 43.3; observed: 50) and less often than expected in the spawn condition (expected: 43.3; observed: 34), see Figure 9A.
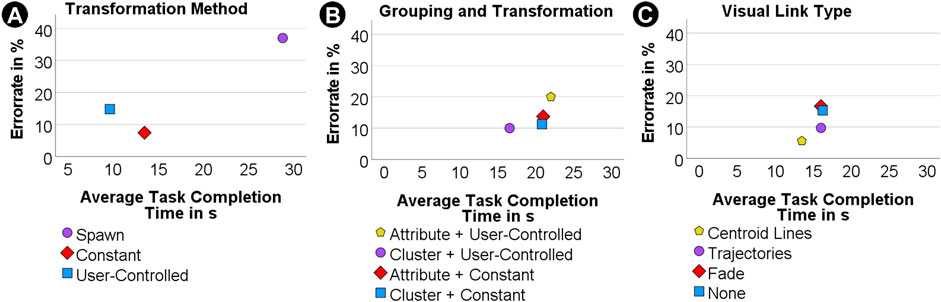
FIGURE 9. Average task completion times in relation to error rate for study 1 with transformation methods (A), study 2 with groupings (B) and study 3 with visual links (C).
For the task load we found a significant difference for the overall task load (H (2) = 25.04; p =< 0.001) with spawn leading to a significantly higher task load (M = 43.00; SD = 22.87) than constant (M = 11.56; SD = 7.84) and user-controlled (M = 19.44; SD = 12.72) transformation, see Figure 10A. We found a similar effect for the mental task load, the user reported performance and the effort. In all of these subscales there was a significantly higher task load for the spawn condition than for both other conditions. We also found significant differences for the frustration, however, in the pairwise comparison only the difference between the spawn condition and the constant transformation condition could be confirmed.
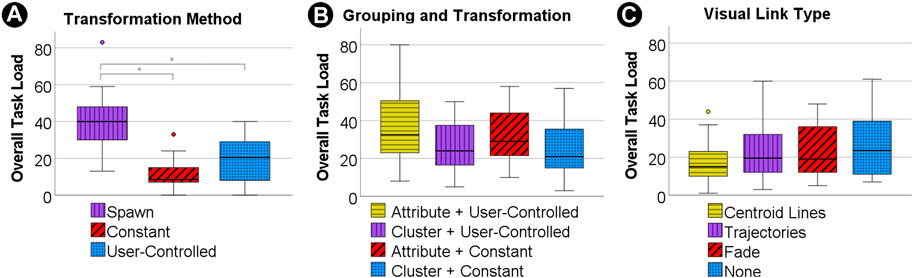
FIGURE 10. Boxplots illustrating distribution of overall task load for study 1 with transformation methods (A), study 2 with groupings (B) and study 3 with visual links (C).
6.1.3 Discussion
As expected, the control condition spawn, without any visual transformation, led to a significantly longer search time and higher error rate. It also caused higher task load scores in the RTLX, which confirms the assumption that a visual transformation assists users in maintaining orientation in the 3D AR graph and H1.1 can therefore be accepted.
Furthermore, we also observed that in the user-controlled condition, users performed the transformation much quicker in terms of task completion time than the fixed time it took in the constant condition, see Figure 8A. Nevertheless, the search time was significantly faster for the constant condition than for the user-controlled condition. Therefore, the transformation speed in the constant transformation may be too slow and could be optimised. However, the constant condition also led to a lower error rate that could not be achieved with the user-controlled condition. Despite users being able to adjust the transformation speed to their needs, this condition still could not bring down the error rate. A possible cause for this result might be that actively pulling data from 2D into 3D AR with the pull gesture may have distracted users visually and mentally from their task of maintaining cognitive relationships between clusters in 2D and 3D AR. Therefore, it could be useful to provide users with a constant transformation when precision is the key concern in decision making. In contexts where speed is the main concern, the user-controlled transformation may be the best option. Hence, H1.2 can be partially accepted, as the assumptions made for task completion time and error rate were correct, but results for search time did not match the hypothesis.
We also could not find a difference in overall task load between constant and user-controlled transformations, which means that H1.3 needs to be rejected, see Table 2.
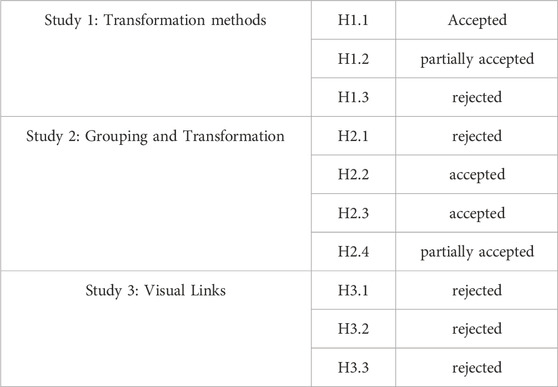
TABLE 2. Hypotheses overview.
6.2 Study 2: Groupings
6.2.1 Data analysis
Since we combined two transformation methods from the first study with two different groupings, we analysed not only each condition on its own but also looked at effects that were only caused by the transformation method or the grouping. The time data and the scales from the RTLX when analysed by conditions were not normally distributed. Thus, we again used a Kruskall-Wallis Test for the time data and the RTLX data and a chi-squared test for the error data. When analysed by grouping or transformation alone, the overall task load was normally distributed. Therefore we used a t-test for this scale. For the other scales as well as time and error data we used a Mann-Whitney-U Test for comparing transformation methods and for comparing groupings. Again, we applied a Bonferroni correction for post hoc tests.
6.2.2 Results
When looking at the transformation method, the user-controlled transformation was faster than constant for task completion time (U = 16653.00, Z = 4.656, p < 0.001). For the search time the constant transformation was significantly faster than the user-controlled transformation (U = 9349.00, Z = −4.170, p < 0.001).
We also found a significant effect for task completion time and search time when comparing each condition. For task completion time (H (3) = 29.908; p < 0.001) the post hoc test revealed that the combination of user-controlled transformation and cluster-based grouping (M = 16.56; SD = 9.77) performed significantly better than all other conditions, see Figure 8B.
For the search time, which also showed a significant difference across all conditions, (H (3) = 24.74; p < 0.001) the post hoc test showed that the constant transformation with cluster-based grouping (M = 20.83; SD = 7.90) performed significantly better than all other conditions and that the constant transformation with the attribute-based grouping (M = 20.99; SD = 7.30) performed better than both conditions with user-controlled transformation.
Regarding the RTLX we found an effect for the mental task load subscale (H (3) = 9.20; p =< 0.027), where users reported significantly less mental effort for the combination of constant transformation with cluster-based grouping than for both conditions with attribute-based grouping. For transformation types, the temporal task load scale showed a significant difference (U = 1,010.50, Z = 2.041, p = 0.041) with the user-controlled transformation type leading to less subjective temporal effort. When looking at the grouping, the overall task load index (U = 547.50, Z = −2.431, p = 0.015), the mental task load scale (U = 517.50, Z = −2.731, p = 0.006) and the subjective performance (U = 530.00, Z = −2.618, p = 0.009) revealed significant differences with grouping by cluster outperforming grouping by attribute in each scale, see Figure 10B.
6.2.3 Discussion
The effects found for the time measurements correspond to the results of the first study, where the user-controlled transformation method was faster than the constant version in the task completion time, see Figures 8A and B. For search time, the constant conditions outperformed the conditions with user-controlled transformation, so that H2.3 can be accepted. A possible explanation from our observations is that users could better follow the constant transformation, as this was their sole task in this condition, while performing the pull gesture in the user-controlled condition might have introduced distraction from the cluster search task, leading to higher search times.
Although the cluster-based grouping seems to perfectly fit a cluster search task, this effect could only be found in the results of the RTLX (see Figure 10B), but was not reflected in the error rate (see Figure 9B), as there was no significant difference between cluster-based and attribute-based grouping. Hence, H2.2. Can be accepted, but H2.1 needs to be rejected. Despite the study design clearly favouring the cluster-based grouping, the attribute-based grouping performed better than anticipated in our hypotheses.
While there was no effect in the overall task load when comparing all conditions, the combination of constant transformation and cluster-based grouping showed significantly less mental effort than conditions with attribute-based grouping. This leads to the assumption, that mental effort might need further investigation in future work to evaluate the effect of grouping on this measure. Regarding H2.4, we can only confirm the lowest completion time for cluster-based, user-controlled transformations, but we did not find statistically significant evidence for constant, cluster-based transformations having the lowest error rate. Therefore, this hypothesis can only be partially accepted, see Table 2.
Additionally, we did not find a significant effect for any of the measures between the participants that also participated in the first study and participants that were not familiar with our study design.
The most popular condition in our post-study informal inquiry was the user-controlled and cluster combination, which was the favourite for 11 participants. Three participants liked the user-controlled and attribute combination the best and two participants preferred either of these and mentioned that the ability to steer the transformation was crucial. The remaining four participants preferred the combination of constant transformation and grouping by clusters, while no participant favoured the constant attribute combination.
6.3 Study 3: Visual links
6.3.1 Data analysis
Since none of our collected data was normally distributed we again used the Kruskall-Wallis Test for the time data and the RTLX data and a chi-squared test for the error data. Unfortunately, there was a significant difference between users that had participated in the prior studies and users that had not. Therefore, we added a second round of analysis where we excluded all participants that had already participated in one of our studies.
6.3.2 Results
In our user study we found no significant results for time measurements, error rate and RTLX data, see Figures 8C, 9C, 10C. In the repeated analysis without participants who also took part in one or two of the other studies, the results were the same as in the first round of analysis, with no significant differences for any of the measures.
In terms of user preference, 13 participants stated that their preferred visual link was centroid lines, two preferred trajectories, two preferred the condition without visual link and one preferred the fade condition.
6.3.3 Discussion
Contrary to our expectation, we found no significant difference between any of the visual links, which requires us to reject H3.1, H3.2 as well as H3.3, see Table 2. There are several possible explanations for this result. First of all, it could be the case that there is no significant effect for visual links when transforming graph data from a 2D screen into 3D AR. Therefore, the difference in overall errors for the conditions is merely a coincidence, see Figure 9 C. We consider this unlikely, because it appears natural that additional visual cues can help users to guide through the task, which also aligns with our gathered user preferences. Despite the absence of significant differences in objective performance there was a clear preference among users: 13 of the 18 participants preferred the centroid lines condition.
On the other hand, it could be due to our study design. Overall the error rates were low which could indicate that the task used for the study was too easy leading to a ceiling effect. Thus, we would need more data to find a significant effect or a more challenging task, e.g., a more complex network or no grouping by clusters. Lastly, the user-controlled transformation method we chose could account for the low error rate. During the study, we observed that users used the user-controlled transformation to stop and sometimes reverse the transformation a bit. Therefore, when they were insecure about the correct cluster, they could check again, leading to a lower error rate.
7 Discussion
As expected, the biggest effect we found in our experiments was that the absence of a visual transformation decreases user performance and increases the task load in the cluster search task, as was shown in the first study. There, the spawn condition was overall significantly worse than both conditions that provided a visual transformation, see Figures 8–10. This spawn condition of the first study also shows that identifying the clusters in the 3D representation purely based on their structure and nodes is not a straightforward assignment.
Secondly, in study two we found that although the study design favoured the cluster based grouping, there was no significant difference in error rate and task completion time. Hence, users were still able to identify the correct cluster within a similar time span when using the more difficult attribute-based grouping. The users therefore managed to sufficiently solve the task with a non-ideal grouping.
The transformation type also had an influence on the users’ performance as we saw in the first and second user study. The constant transformation method led to a shorter search time in both studies and a lower error rate in the first study, since users were forced to look at the transformation for a fixed time period. The user-controlled transformation on the other hand, led to a shorter overall task completion time in both studies. Especially in the second user study where the transformation method was compared with grouping, it became clear that users were able to utilise the user-controlled transformation method more efficiently. The users dynamically adjusted the speed of the transformation and slowed it down when the cluster they were looking for was transformed and increased the transformation speed for irrelevant clusters. Especially in large data sets with numerous manifestations of one attribute or numerous clusters that are transformed one by one, the dynamic adjustment of transformation speed could be a crucial advantage. Furthermore, the conditions with user-controlled transformation were the preferred conditions for 16 out of 20 users. Therefore, we recommend the user-controlled transformation for use cases that focus on efficiency and user experience and the constant transformation for scenarios where precision is crucial.
To our own surprise, we found no significant effect for the different visual links we examined in user study three. Despite users observably utilising, e.g., fade to keep track of which cluster was last transformed or centroid lines to track their origin to identify the correct cluster, there was no measurable difference in task completion time, search time, error rate and task load. This could either be explained by a mitigating effect of the user-controlled transformation method we applied for the third study that allowed users to quickly repeat the transformation. Especially in combination with the cluster-based grouping the task might have gotten too easy, leading to a ceiling effect. As a result, the visual link might not have a large enough effect, so it would be detected in null hypothesis significance testing. This could be examined in a future study with a more complex task. However, there was a clear preference among users with 13 out of 18 participants preferring the centroid lines.
Coming back to our objective to derive first initial guidelines for the transformation of data visualisations from the real environment into AR 3D as announced in the introduction, we can conclude so far the following guidelines based on our discussion and findings from all three user studies:
Moving data visualisations along the reality-virtuality continuum should always involve a visual transition of the respective data representation. Constant transformations are suitable in scenarios where precision is the primary concern, otherwise user-controlled transformations might be more appropriate to allow using transformations more efficiently and to enable repeating specific parts of the transformation if necessary. For visually very complex transformations, constant transformations still might be the better option to avoid distraction from the task. Especially when using groupings, user-controlled transformations allow users to fast-forward irrelevant parts of the transformation. Groupings should fit to the current context of data and task and keep items of shared meaning together. Less-ideal groupings can be used when it is beneficial for the scenario, as long as users still manage to maintain their joint mental model of both visualisations.
Furthermore, we want to shortly discuss that different input modalities as described in the design space by Lee et al. (2022) would change the transformation process. For example, it would be hardly possible to perform a transformation in a way similar to our user-controlled transformation, when using voice input. Each change in transformation speed would then have to be articulated very precisely. However, voice input would still be useful for the constant transformation and keep the users’ hands free for interaction. On the other hand, gestures might be a viable alternative to the controller, given that the hand tracking is precise enough. For a more embodied interaction, approaches where the representation is coupled to the users position (Hurter et al., 2017) could be adapted to be used for transformations. Furthermore, such a transformation to 3D could not just be used to change the layout, but also to add another data dimension, such as a time dimension.
7.1 Limitations
We utilised task randomisation and counterbalancing in our studies to avoid learning effects, but to facilitate comparisons, we used the same data set, 2D source layout and 3D target layout throughout all three part studies. We are however aware that results and effectiveness of our investigated transformation parameters might differ between varying data sets, source or target visualisations. To allow a deeper analysis, multiple data sets and layouts will have to be examined. Furthermore, it seemed natural that additional visual cues such as centroid lines or trajectories would have a positive effect on task completion times and error rates. We can observe this trend in our study data, but as statistically significant results are missing, this area requires another in-depth analysis, for instance by extending our framework with additional visual links, utilising more complex tasks or by a narrower isolation of transformation parameters in a future quantitative study. As we mentioned in the results of the third study in subsection 6.3, due to a significant learning effect in our third study, we repeated the data analysis without participants, that had already participated in another study. Both analyses came to the same conclusion, however, the learning effect and the smaller data sample are clear limitations in this study.
8 Conclusion and future work
In this work we conceptualised, implemented and analysed a framework of transformation parameters to examine the visual transformation of graph data from planar displays in the real environment into AR 3D space: transformation methods, groupings and visual links. These parameter sets were evaluated in three consecutive quantitative user studies, from which we could derive an order of relevance. First, we confirmed that having a visual transformation from 2D to 3D AR is not just pleasant to watch, but helps users to form a joint mental model of both visualisations. This is followed by groupings that fit to the examined data and usage context to reduce search times and error rates. For transformation methods, we identified room for context-specific design decisions. A user-controlled transformation can improve efficiency and can be particularly useful for large data sets with many groups, as it enables users to fast-forward irrelevant parts of the transformation. A constant transformation on the other hand is a better fit for scenarios where precision is the primary concern. Although we observed a clear user preference for additional visual support such as centroid lines, it appears that visual links have a smaller influence than expected compared to other transformation parameters identified so far.
Although we covered with our user studies a wide range of design decisions for moving graph data visualisations along the RVC, there are numerous fields to be addressed by future work. This includes different 2D and 3D layouts, tasks and data sets as well as other types of studies. So far, we investigated graph transformations in a controlled experiment. Future work should therefore examine a more exploratory scenario where users are able to interact with the data more freely and perform visual data analysis on the data set. By allowing more interaction with the data in 2D and 3D in a qualitative user study, it could be observed how users combine these different visualisations along the RVC to fully comprehend a data set and how the presented transformations can help them to keep a link between the data distributed along the RVC. We expect that in this context further requirements emerge that need to be examined, for instance, giving users more options to adjust the 3D layout to their needs, supporting partial transformations in which only selected sections of a visualisation are transformed into 3D AR or how these transformations can be utilised in collaborative scenarios. To make these transformations available for a wider audience and as most of the presented parameters are not limited to graph visualisations, future work should also examine moving other data visualisations along the RVC and extend the presented transformation parameter framework as required. Further research can also work on optimising the transformation process, for instance by testing and evaluating transformation algorithms that effectively avoid temporary occlusion problems during the transformation from 2D to 3D, as we have occasionally observed during our studies. Since we examined specifically transformations from 2D to 3D, future research is also needed to investigate reverse transformations from 3D to 2D.
Data availability statement
The datasets presented in this study can be found in online repositories. The names of the repository/repositories and accession number(s) can be found below: https://github.com/HIVE-ResearchGroup/graph-transformations-2D-3DAR- schwajda-et-al-dataset.
Ethics statement
Ethical review and approval was not required for the study on human participants in accordance with the local legislation and institutional requirements. Written informed consent from the participants’ legal guardian/next of kin was not required to participate in this study in accordance with the national legislation and the institutional requirements.
Author contributions
DS implemented the main parts of the prototype and data collection, conducted the user studies, conceptualised the transformation parameter framework and is main author of the manuscript. JF was responsible for the user studies design, conducting the studies, the evaluation of study results and evaluation section of the manuscript. FP supported the related work section, the porting of the prototype to the Varjo HMD and compiled images and further demo material. H-CJ acted as academic consultant concerning research questions and study design and co-edited the manuscript. CA is the academic research project supervisor, conceptualised the algorithmic transformation process from 2D to 3D, as well as parts of the transformation parameter framework and co-edited the manuscript with focus on introduction and related work section.
Funding
This publication is a part of the X-PRO project. The project X-PRO is financed by research subsidies granted by the government of Upper Austria.
Conflict of interest
The authors declare that the research was conducted in the absence of any commercial or financial relationships that could be construed as a potential conflict of interest.
The handling editor YY declared a past co-authorship with the author CA and FP.
Publisher’s note
All claims expressed in this article are solely those of the authors and do not necessarily represent those of their affiliated organizations, or those of the publisher, the editors and the reviewers. Any product that may be evaluated in this article, or claim that may be made by its manufacturer, is not guaranteed or endorsed by the publisher.
Supplementary material
The Supplementary Material for this article can be found online at: https://www.frontiersin.org/articles/10.3389/frvir.2023.1155628/full#supplementary-material
Footnotes
1https://www.vive.com/us/product/vive-pro-full-kit/.
2https://varjo.com/products/xr-3/.
3https://www.valvesoftware.com/de/index/controllers.
References
Ahmed, A., and Hong, S.-h. (2007). “Navigation techniques for 2.5D graph layout,” in 2007 6th international asia-pacific symposium on visualization, 81–84. doi:10.1109/APVIS.2007.329279
Andrews, K. (2002). “Visual exploration of large hierarchies with information pyramids,” in Proceedings sixth international conference on information visualisation, 793–798. doi:10.1109/IV.2002.1028871
Archambault, D., Klein, K., and Misue, K. (2018). Reimagining the mental map and drawing stability. Tokyo, Japan: National Institute of Informatics Tech. rep., 2-1-2 Hitotsubashi, Chiyoda-Ku.
Archambault, D., Munzner, T., and Auber, D. (2007). TopoLayout: Multilevel graph layout by topological features. IEEE Trans. Vis. Comput. Graph. 13, 305–317. doi:10.1109/TVCG.2007.46
Bederson, B. B., and Boltman, A. (1999). “Does animation help users build mental maps of spatial information?,” in Proceedings 1999 IEEE symposium on information visualization (InfoVis’ 99) (IEEE), 28–35.
Belcher, D., Billinghurst, M., Hayes, S., and Stiles, R. (2003). “Using augmented reality for visualizing complex graphs in three dimensions the Second IEEE and ACM International Symposium on Mixed and Augmented Reality,” in 2003. Proceedings, 84–93. doi:10.1109/ISMAR.2003.1240691
Brath, R. (2014). “3D InfoVis is here to stay: Deal with it,” in In 2014 IEEE VIS international workshop on 3DVis (3DVis), 25–31. doi:10.1109/3DVis.2014.7160096
Burch, M., Vramulet, A., Thieme, A., Vorobiova, A., Shehu, D., Miulescu, M., et al. (2020). “VizWick: A multiperspective view of hierarchical data,” in Proceedings of the 13th international symposium on visual information communication and interaction, 1–5. doi:10.1145/3430036.3430044
Burr, D. C., and Ross, J. (2002). Direct evidence that “Speedlines” influence motion mechanisms. J. Neurosci. 22, 8661–8664. doi:10.1523/JNEUROSCI.22-19-08661.2002
Büschel, W., Lehmann, A., and Dachselt, R. (2021). “Miria: A mixed reality toolkit for the in-situ visualization and analysis of spatio-temporal interaction data,” in CHI ’21: Proceedings of the 2021 CHI conference on human factors in computing systems, 1–15. doi:10.1145/3411764.3445651
Butscher, S., Hubenschmid, S., Müller, J., Fuchs, J., and Reiterer, H. (2018). “Clusters, trends, and outliers: How immersive technologies can facilitate the collaborative analysis of multidimensional data,” in CHI ’18: Proceedings of the 2018 CHI conference on human factors in computing systems, 1–12. doi:10.1145/3173574.3173664
Capece, N., Erra, U., and Grippa, J. (2018). “GraphVR: A virtual reality tool for the exploration of graphs with HTC vive system,” in 2018 22nd international conference information visualisation (IV), 448–453. doi:10.1109/iV.2018.00084
Carpendale, S., and Agarawala, A. (2004). “PhylloTrees: Harnessing nature’s phyllotactic patterns for tree layout,” in IEEE symposium on information visualization, 1–18. doi:10.1109/INFVIS.2004.53
Chalbi, A., Ritchie, J., Park, D., Choi, J., Roussel, N., Elmqvist, N., et al. (2020). Common fate for animated transitions in visualization. IEEE Trans. Vis. Comput. Graph. 26, 386–396. doi:10.1109/TVCG.2019.2934288
Chandler, T., Cordeil, M., Czauderna, T., Dwyer, T., Glowacki, J., Goncu, C., et al. (2015). “Immersive analytics,” in 2015 big data visual analytics (BDVA), 1–8. doi:10.1109/BDVA.2015.7314296
Cohn, N., and Maher, S. (2015). The notion of the motion: The neurocognition of motion lines in visual narratives. Brain Res. 1601, 73–84. doi:10.1016/j.brainres.2015.01.018
Cohn, N. (2013). The visual language of comics: Introduction to the structure and cognition of sequential images. A&C Black).
Cools, R., Esteves, A., and Simeone, A. L. (2022). “Blending spaces: Cross-reality interaction techniques for object transitions between distinct virtual and augmented realities,” in 2022 IEEE international symposium on mixed and augmented reality (ISMAR), 528–537. doi:10.1109/ISMAR55827.2022.00069
Cordeil, M., Dwyer, T., Klein, K., Laha, B., Marriott, K., and Thomas, B. H. (2016). Immersive collaborative analysis of network connectivity: Cave-style or head-mounted display? IEEE Trans. Vis. Comput. Graph. 23, 441–450. doi:10.1109/tvcg.2016.2599107
Cruz-Neira, C., Sandin, D. J., DeFanti, T. A., Kenyon, R. V., and Hart, J. C. (1992). The CAVE: Audio visual experience automatic virtual environment. Commun. ACM 35, 64–72. doi:10.1145/129888.129892
De Araújo, B. R., Casiez, G., Jorge, M., and Hachet, J. A. (2013). Mockup builder: 3d modeling on and above the surface. Comput. Graph. 37, 165–178. doi:10.1016/j.cag.2012.12.005
Drogemuller, A., Cunningham, A., Walsh, J., Cordeil, M., Ross, W., and Thomas, B. (2018). “Evaluating navigation techniques for 3D graph visualizations in virtual reality,” in 2018 international symposium on big data visual and immersive analytics (BDVA) (IEEE), 1–10. doi:10.1109/BDVA.2018.8533895
Ens, B., Bach, B., Cordeil, M., Engelke, U., Serrano, M., Willett, W., et al. (2021). “Grand challenges in immersive analytics,” in CHI ’21: Proceedings of the 2021 CHI conference on human factors in computing systems, 1–17. doi:10.1145/3411764.3446866
Erra, U., Malandrino, D., and Pepe, L. (2019). Virtual reality interfaces for interacting with three-dimensional graphs. Int. J. Human–Computer Interact. 35, 75–88. doi:10.1080/10447318.2018.1429061
Feiner, S., and Shamash, A. (1991). “Hybrid user interfaces: Breeding virtually bigger interfaces for physically smaller computers,” in Proceedings of the 4th annual ACM symposium on User interface software and technology, 9–17.
Fonnet, A., and Prié, Y. (2021). Survey of immersive analytics. IEEE Trans. Vis. Comput. Graph. 27, 2101–2122. doi:10.1109/TVCG.2019.2929033
Fröhler, B., Anthes, C., Pointecker, F., Friedl, J., Schwajda, D., Riegler, A., et al. (2022). A survey on cross-virtuality analytics. Comput. Graph. Forum 41, 465–494. doi:10.1111/cgf.14447
García-Hernández, R., Anthes, C., Wiedemann, M., and Kranzlmüller, D. (2016). “Perspectives for using virtual reality to extend visual data mining in information visualization,” in Aerospace conference (IEEE), 1–11. doi:10.1109/AERO.2016.7500608
Ghoniem, M., Fekete, J.-D., and Castagliola, P. (2004). “A comparison of the readability of graphs using node-link and matrix-based representations,” in IEEE symposium on information visualization, 17–24. doi:10.1109/INFVIS.2004.1
Gibson, H., Faith, J., and Vickers, P. (2013). A survey of two-dimensional graph layout techniques for information visualisation. Inf. Vis. 12, 324–357. doi:10.1177/1473871612455749
Gomes, J., Darsa, L., Costa, B., and Velho, L. (1999). Warping and morphing of graphical objects (Morgan Kaufmann).
Gross, M., Sprenger, T., and Finger, J. (1997). “Visualizing information on a sphere,” in Proceedings of VIZ ’97: Visualization conference, information visualization symposium and parallel rendering symposium, 11–16. doi:10.1109/INFVIS.1997.636759
Hachul, S., and Jünger, M. (2006). “An experimental comparison of fast algorithms for drawing general large graphs,” in Graph drawing, 235–250. doi:10.1007/11618058_22
Hart, S. G. (2006). Nasa-task load index (NASA-TLX); 20 Years later. Proc. Hum. Factors Ergonomics Soc. Annu. Meet. 50, 904–908. doi:10.1177/154193120605000909
Hart, S. G., and Staveland, L. E. (1988). Development of NASA-TLX (task load index): Results of empirical and theoretical research. Adv. Psychol. 52, 139–183. doi:10.1016/S0166-4115(08)62386-9
Heer, J., and Robertson, G. (2007). Animated transitions in statistical data graphics. IEEE Trans. Vis. Comput. Graph. 13, 1240–1247. doi:10.1109/tvcg.2007.70539
Henry, J. A., and Polys, N. F. (2010). The effects of immersion and navigation on the acquisition of spatial knowledge of abstract data networks. Procedia Comput. Sci. 1, 1737–1746. doi:10.1016/j.procs.2010.04.195
Herman, I., Melancon, G., and Marshall, M. (2000). Graph visualization and navigation in information visualization: A survey. IEEE Trans. Vis. Comput. Graph. 6, 24–43. doi:10.1109/2945.841119
Hong, S.-H., and Murtagh, T. (2005). “Visualisation of large and complex networks using PolyPlane,” in Graph drawing. Editor J. Pach (Springer Berlin Heidelberg), 471–481. doi:10.1007/978-3-540-31843-9_49
Huang, Y-J., Fujiwara, T., Lin, Y-X., Lin, W-C., and Ma, K-L. (2017). “A gesture system for graph visualization in virtual reality environments,” in 2017 IEEE pacific visualization symposium (PacificVis), 41–45. doi:10.1109/PACIFICVIS.2017.8031577
Hurter, C., Riche, N. H., Pahud, M., Ofek, E., Drucker, S., Lee, B., et al. (2017). “Into the mixed reality data sphere: Mapping user’s movements to data exploration tools,” in Proceedings of the immersive analytics workshop, 1–4.
Jeong, C.-S., and Pang, A. (1998). “Reconfigurable disc trees for visualizing large hierarchical information space,” in Proceedings IEEE symposium on information visualization, 19–25. (Cat. No.98TB100258). doi:10.1109/INFVIS.1998.729555
Jetter, H.-C., Schröder, J.-H., Gugenheimer, J., Billinghurst, M., Anthes, C., Khamis, M., et al. (2021). “Transitional interfaces in mixed and cross-reality: A new frontier?,” in ISS ’21: Interactive surfaces and spaces, 46–49. doi:10.1145/3447932.3487940
Joos, L., Jaeger-Honz, S., Schreiber, F., Keim, D. A., and Klein, K. (2022). Visual comparison of networks in VR. IEEE Trans. Vis. Comput. Graph. 1, 3651–3661. doi:10.1109/TVCG.2022.3203001
Joshi, P., Tien, W. C., Desbrun, M., and Pighin, F. (2006). “Learning controls for blend shape based realistic facial animation,” in ACM SIGGRAPH 2006 courses, 17. –es. doi:10.1145/1185657.1185857
Kawabe, T., and Miura, K. (2006). Representation of dynamic events triggered by motion lines and static human postures. Exp. Brain Res. 175, 372–375. doi:10.1007/s00221-006-0673-6
Kawabe, T., Yamada, Y., and Miura, K. (2007). Memory displacement of an object with motion lines. Vis. Cogn. 15, 305–321. doi:10.1080/13506280600591036
Kennedy, R. S., Lane, N. E., Berbaum, K. S., and Lilienthal, M. G. (1993). Simulator sickness questionnaire: An enhanced method for quantifying simulator sickness. Int. J. Aviat. Psychol. 3, 203–220. doi:10.1207/s15327108ijap0303_3
Keskin, C., and Vogelmann, V. (1997). “Effective visualization of hierarchical graphs with the cityscape metaphor,” in NPIV ’97: Proceedings of the 1997 workshop on New paradigms in information visualization and manipulation, 13–14. doi:10.1145/275519.275531
Kijima, R., and Ojika, T. (1997). “Transition between virtual environment and workstation environment with projective head mounted display,” in Annual international symposium on virtual reality (IEEE), 130–137. doi:10.1109/vrais.1997.583062
Kim, H., and Francis, G. (1998). A computational and perceptual account of motion lines. Perception 27, 785–797. doi:10.1068/p270785
Kister, U., Klamka, K., Tominski, C., and Dachselt, R. (2017). GraSp: Combining spatially-aware mobile devices and a display wall for graph visualization and interaction. Comput. Graph. Forum 36, 503–514. doi:10.1111/cgf.13206
Kotlarek, J., Kwon, O.-H., Ma, K.-L., Eades, P., Kerren, A., Klein, K., et al. (2020). “A study of mental maps in immersive network visualization,” in 2020 IEEE pacific visualization symposium (PacificVis), 1–10. doi:10.1109/PacificVis48177.2020.4722
Kraus, M., Klein, K., Fuchs, J., Keim, D. A., Schreiber, F., and Sedlmair, M. (2021). The value of immersive visualization. IEEE Comput. Graph. Appl. 41, 125–132. doi:10.1109/MCG.2021.3075258
Kwon, O.-H., and Ma, K.-L. (2020). A deep generative model for graph layout. IEEE Trans. Vis. Comput. Graph. 26, 665–675. doi:10.1109/TVCG.2019.2934396
Kwon, O.-H., Muelder, C., Lee, K., and Ma, K.-L. (2016). A study of layout, rendering, and interaction methods for immersive graph visualization. IEEE Trans. Vis. Comput. Graph. 22, 1802–1815. doi:10.1109/TVCG.2016.2520921
Kwon, O.-H., Muelder, C., Lee, K., and Ma, K.-L. (2015). “Spherical layout and rendering methods for immersive graph visualization,” in 2015 IEEE pacific visualization symposium (PacificVis), 63–67. doi:10.1109/PACIFICVIS.2015.7156357
Langner, R., Satkowski, M., Büschel, W., and Dachselt, R. (2021). “Marvis: Combining mobile devices and augmented reality for visual data analysis,” in Conference on human factors in computing systems (CHI), 1–17. doi:10.1145/3411764.3445593
Lee, B., Cordeil, M., Prouzeau, A., Jenny, B., and Dwyer, T. (2022). “A design space for data visualisation transformations between 2D and 3D in mixed-reality environments,” in Proceedings of the 2022 CHI conference on human factors in computing systems (Association for Computing Machinery), 1–14. CHI ’22. doi:10.1145/3491102.3501859
Lee, B., Plaisant, C., Parr, C. S., Fekete, J.-D., and Henry, N. (2006). “Task taxonomy for graph visualization,” in Proceedings of the 2006 AVI workshop on beyond time and errors: Novel evaluation methods for information visualization (New York, NY, USA: Association for Computing Machinery), 1–5. BELIV ’06. doi:10.1145/1168149.1168168
Lu, J., and Si, Y.-W. (2020). Clustering-based force-directed algorithms for 3D graph visualization. J. Supercomput. 76, 9654–9715. doi:10.1007/s11227-020-03226-w
Mahmood, T., Butler, E., Davis, N., Huang, J., and Lu, A. (2018). “Building multiple coordinated spaces for effective immersive analytics through distributed cognition,” in International symposium on big data visual and immersive analytics (BDVA), 1–11. doi:10.1109/BDVA.2018.8533893
Malik, K., and Choudhary, S. (2016). “A fuzzy integrated genetic method for information persistent 3D to 2D graph transformation,” in 2016 fourth international conference on parallel, distributed and grid computing (PDGC), 270–275. doi:10.1109/PDGC.2016.7913158
Marriott, K., Schreiber, F., Dwyer, T., Klein, K., Riche, N. H., Itoh, T., et al. (2018). Immersive analytics, 11190. Springer.
Maurer, F., Anslow, C., Jorge, J., and Sousa, M. (2022). “Enhancing cross-reality applications and user experiences,” in Avi 2022: Proceedings of the 2022 international conference on advanced visual interfaces, 1–3. doi:10.1145/3531073.3535256
Milgram, P., Takemura, H., Utsumi, A., and Kishino, F. (1995). “Augmented reality: A class of displays on the reality-virtuality continuum,” in Photonics for industrial applications, 282–292. doi:10.1117/12.197321
Munzner, T. (1997). “H3: Laying out large directed graphs in 3D hyperbolic space,” in Proceedings of VIZ ’97: Visualization conference, information visualization symposium and parallel rendering symposium, 2–10. doi:10.1109/INFVIS.1997.636718
Nacenta, M. A., Gutwin, C., Aliakseyeu, D., and Subramanian, S. (2009). There and back again: Cross-display object movement in multi-display environments. Human–Computer Interact. 24, 170–229. doi:10.1080/07370020902819882
Nishimoto, A., and Johnson, A. E. (2019). “Extending virtual reality display wall environments using augmented reality,” in Symposium on spatial user interaction, 1–5. doi:10.1145/3357251.3357579
Pointecker, F., Friedl, J., Schwajda, D., Jetter, H.-C., and Anthes, C. (2022). “Bridging the gap across realities: Visual transitions between virtual and augmented reality,” in 2022 IEEE international symposium on mixed and augmented reality (ISMAR), 827–836. doi:10.1109/ISMAR55827.2022.00101
Prouzeau, A., Lhuillier, A., Ens, B., Weiskopf, D., and Dwyer, T. (2019). “Visual link routing in immersive visualisations,” in International conference on interactive surfaces and spaces (ISS), 241–253. doi:10.1145/3343055.3359709
Reipschläger, P., and Dachselt, R. (2019). “DesignAR: Immersive 3D-modeling combining augmented reality with interactive displays,” in International conference on interactive surfaces and spaces (ISS), 29–41. doi:10.1145/3343055.3359718
Reipschläger, P., Flemisch, T., and Dachselt, R. (2020). Personal augmented reality for information visualization on large interactive displays. IEEE Trans. Vis. Comput. Graph. 27, 1182–1192. doi:10.1109/TVCG.2020.3030460
Riegler, A., Anthes, C., Jetter, H.-C., Heinzl, C., Holzmann, C., Herbert, J., et al. (2020). “Cross-virtuality visualization, interaction and collaboration,” in International workshop on cross-reality (XR) interaction Co-located with 14th ACM international conference on interactive surfaces and spaces, 1–4.
Robertson, G. G., Mackinlay, J. D., and Card, S. K. (1991). “Cone trees: Animated 3D visualizations of hierarchical information,” in Proceedings of the SIGCHI conference on human factors in computing systems, 189–194. doi:10.1145/108844.108883
Santos, E. D., Hong, J., and Isenberg, T. (2022). “A design space for linked 2D and 3D visual representations,” in VIS 2022-posters of IEEE conference on visualization and visual analytics, 1–3.
Schulz, H.-J., Hadlak, S., and Schumann, H. (2009). “Point-based tree representation: A new approach for large hierarchies,” in 2009 IEEE pacific visualization symposium, 81–88. doi:10.1109/PACIFICVIS.2009.4906841
Schwajda, D., Pointecker, F., Böss, L., and Anthes, C. (2021). “Transforming graph-based data visualisations from planar displays into augmented reality 3D space,” in ISS’21 workshop proceedings: ”Transitional interfaces in mixed and cross-reality: A new frontier?”. Editors H.-C. Jetter, J.-H. Schröder, J. Gugenheimer, M. Billinghurst, C. Anthes, M. Khamiset al. 1–5. doi:10.18148/kops/352-2-1kugqssauin8a2
Seraji, M. R., and Stuerzlinger, W. (2022a). “Hybridaxes: An immersive analytics tool with interoperability between 2d and immersive reality modes,” in 2022 IEEE international symposium on mixed and augmented reality adjunct (ISMAR-Adjunct), 155–160. doi:10.1109/ISMAR-Adjunct57072.2022.00036
Seraji, M. R., and Stuerzlinger, W. (2022b). “Xvcollab: An immersive analytics tool for asymmetric collaboration across the virtuality spectrum,” in 2022 IEEE international symposium on mixed and augmented reality adjunct (ISMAR-Adjunct), 146–154. doi:10.1109/ISMAR-Adjunct57072.2022.00035
Spur, M., Tourre, V., Moreau, G., and Le Callet, P. (2022). Virtual data sphere: Inverse stereographic projection for immersive multi-perspective geovisualization. ISPRS Ann. Photogrammetry, Remote Sens. Spatial Inf. Sci. 4, 235–242. doi:10.5194/isprs-annals-v-4-2022-235-2022
Tripathi, S., Dehmer, M., and Emmert-Streib, F. (2014). NetBioV: an R package for visualizing large network data in biology and medicine. Bioinformatics 30, 2834–2836. doi:10.1093/bioinformatics/btu384
Urribarri, D., Castro, S. M., and Martig, S. R. (2013). Gyrolayout: A hyperbolic level-of-detail tree layout. J. Univers. Comput. Sci. 19, 132–156. doi:10.3217/jucs-019-01-0132
Wagner Filho, J. A., Rey, M. F., Freitas, C. M. D. S., and Nedel, L. (2018). “Immersive visualization of abstract information: An evaluation on dimensionally-reduced data scatterplots,” in 2018 IEEE conference on virtual reality and 3D user interfaces (VR), 483–490. doi:10.1109/VR.2018.8447558
Walker, J. Q. (1990). A node-positioning algorithm for general trees. Softw. Pract. Exp. 20, 685–705. doi:10.1002/spe.4380200705
Wang, N., and Maurer, F. (2022). “A design space for single-user cross-reality applications,” in Proceedings of the 2022 international conference on advanced visual interfaces (New York, NY, USA: Association for Computing Machinery), 1–5. AVI 2022. doi:10.1145/3531073.3531116
Ware, C., and Franck, G. (1996). Evaluating stereo and motion cues for visualizing information nets in three dimensions. ACM Trans. Graph. 15, 121–140. doi:10.1145/234972.234975
Wasserman, S., and Faust, K. (1994). Social network analysis: Methods and applications. Cambridge University Press.
Willems, S. (2008). Data Set-Real-World multiechelon supply chains used for inventory optimization. Manuf. Serv. operations Manag. 10, 19–23. doi:10.1287/msom.1070.0176
Wu, S., Byrne, D., and Steenson, M. W. (2020). “Mergereality”: Leveraging physical affordances for multi-device gestural interaction in augmented reality,” in CHI ea ’20: Extended abstracts of the 2020 CHI conference on human factors in computing systems, 1–4. doi:10.1145/3334480.3383170
Yang, Y., Dwyer, T., Marriott, K., Jenny, B., and Goodwin, S. (2020). Tilt map: Interactive transitions between choropleth map, prism map and bar chart in immersive environments. IEEE Trans. Vis. Comput. Graph. 27, 4507–4519. doi:10.1109/tvcg.2020.3004137
Keywords: immersive analytics, cross reality, user studies, cross virtuality, augmented reality, graphs, data visualisation
Citation: Schwajda D, Friedl J, Pointecker F, Jetter H-C and Anthes C (2023) Transforming graph data visualisations from 2D displays into augmented reality 3D space: A quantitative study. Front. Virtual Real. 4:1155628. doi: 10.3389/frvir.2023.1155628
Received: 31 January 2023; Accepted: 14 March 2023;
Published: 28 March 2023.
Edited by:
Yalong Yang, Virginia Tech, United StatesCopyright © 2023 Schwajda, Friedl, Pointecker, Jetter and Anthes. This is an open-access article distributed under the terms of the Creative Commons Attribution License (CC BY). The use, distribution or reproduction in other forums is permitted, provided the original author(s) and the copyright owner(s) are credited and that the original publication in this journal is cited, in accordance with accepted academic practice. No use, distribution or reproduction is permitted which does not comply with these terms.
*Correspondence: Daniel Schwajda, ZGFuaWVsLnNjaHdhamRhQGQtY29kZS5hdA==; Judith Friedl, anVkaXRoLmZyaWVkbEBmaC1vb2UuYXQ=