 Naomi Njue
 Jan Gräf
 Björn Weeser
 Mariana C. Rufino
 Lutz Breuer
 Suzanne R. Jacobs
- 1Research Centre for BioSystems, Land Use and Nutrition (IFZ), Institute for Landscape Ecology and Resources Management (ILR), Justus Liebig University Giessen, Giessen, Germany
- 2Centre for International Forestry Research (CIFOR), Nairobi, Kenya
- 3School of Natural Resource and Environmental Management, University of Kabianga, Kericho, Kenya
- 4Centre for International Development and Environmental Research, Justus Liebig University Giessen, Giessen, Germany
- 5Lancaster Environment Centre, Lancaster University, Lancaster, United Kingdom
Catchments are complex systems, which require regular monitoring of hydro-chemical parameters in space and time to provide comprehensive datasets. These are needed to characterize catchment behavior on a local level, make future projections based on models, implement mitigation measures and meet policy targets. However, many developing countries lack a good infrastructure for hydrological monitoring since its establishment is costly and the required resources are often not available. To overcome such challenges in data scarce regions like Kenya, a participatory citizen science approach can be a promising strategy for monitoring water resources. This study evaluates the potential of using a contributory citizen science approach to explore spatiotemporal turbidity and suspended sediment dynamics in the Sondu-Miriu river basin, western Kenya. A group of 19 citizen scientists was trained to monitor turbidity using turbidity tubes and water levels with water level gauges in six nested subcatchments of the Sondu-Miriu river basin. Over the course of the project, a total of 37 citizen scientists participated and contributed to the overall dataset of turbidity. The sampling effort and data contribution varied from year to year and among participants with the majority of the data (72%) originating from 8 (22%) citizen scientists. Comparison between citizen-scientist collected suspended sediment data and measurements from automated stations showed high correlation (R2 > 0.9) which demonstrates that data collected by citizen scientists can be comparable to data collected using expensive monitoring equipment. However, there was reduced precision of the measurements of suspended sediment concentrations at low and high levels attributed largely to the detection limitations of the turbidity tubes and citizen scientists not capturing major sediment export events. Suspended sediment concentrations were significantly higher downstream (109 ± 94 mg L−1), a subcatchment dominated by agriculture and rangeland with low forest vegetation cover, as compared to a subcatchment with high forest cover (50 ± 24.7 mg L−1). This finding indicates that forest cover is a key landscape feature to control suspended sediment concentrations in the region. Future citizen science projects should focus on motivation and engagement strategies and the application of robust methods with improved detection limits and resolution to advance hydrological monitoring.
Introduction
In the tropics, natural ecosystems and water resources are increasingly threatened by several factors including growing human population, climate change, deforestation, and increased cropping and grazing intensities (Smith et al., 2016; Shupe, 2017; Berihun et al., 2019). Consequently, many tropical forest ecosystems have been subject to disturbances, which vary through time and space. Previous studies have demonstrated the effect of land use change on soil erosion and sediment yield, with conversion of forest to agricultural or grazing land yielding the highest soil loss due to changes in soil properties such as reduced infiltration rates and water retention capacity (Owuor et al., 2018; Stenfert Kroese et al., 2020b). Increased surface runoff may lead to flooding and accelerates sediment transport processes, resulting in amplification of the sediment load in rivers (Pacheco et al., 2014; Owuor et al., 2018). Monitoring of sediment loads in catchments is important for the development of soil erosion management and control strategies, to inform policies for water resources management and for the validation of spatially distributed sediment delivery models (Akrasi, 2005; Kuhnle and Wren, 2005; Gao et al., 2007).
Much of the recent focus in hydrogeochemical research has been on the use of models, remote sensing and high resolution automated monitoring systems to further improve our understanding of ecological systems (Baldyga et al., 2008; Jacobs et al., 2018; Esteves et al., 2019). Although these approaches have been widely used to inform decision making for environmental management, they are expensive and their application within most developing countries is still hampered by poor infrastructure and technical capabilities (Olang and Fürst, 2011; Nardi et al., 2020). As a consequence, relatively few hydrogeochemical datasets exist (Zheng et al., 2017). As the acquisition of field data with high spatial and temporal resolution is very important for sustainable water resource management and governance, this clearly raises the need to explore alternative cost-effective approaches for data collection (Njue et al., 2019; Malthus et al., 2020).
Advances in technology and the rise of robust simple and cheap sensing equipment provides unprecedented opportunities for data collection using citizen science in hydrological sciences and water resources management, especially in data scarce regions (Buytaert et al., 2014; Zheng et al., 2017). Citizen science refers to the involvement of the general public within the scientific research process for the generation of new scientific knowledge (Bonney et al., 2009b; Buytaert et al., 2014). Although citizen science is still uncommon practice in water research, we recognize that its uptake in low-income countries such as Kenya is gradually rising (Njue et al., 2019), especially in monitoring of precipitation, water levels and water quality (Gomani et al., 2010; Kongo et al., 2010; Walker et al., 2016; Weeser et al., 2018). As a scientific method, citizen science is acknowledged to play an important role in delivering valuable and robust environmental data from local to national scales, increasing knowledge of science and reducing monitoring costs (Bonney et al., 2009a; Silvestro et al., 2012; Haklay, 2015). Moreover, citizen observations can provide quality and detailed ground-based data for calibration and validation of satellite-based earth observation and high-resolution automated stations (Fritz et al., 2017; Nardi et al., 2020). Njue et al. (2019) present a comprehensive review on the successful implementation, contribution, and significant growth in application of state-of-the-art citizen science approaches in hydrological monitoring in the past two decades. Looking ahead, citizen science could be used cost-effectively not only to fill data and information gaps, but also to work collaboratively with communities to generate relevant management-oriented knowledge.
This study aimed to evaluate the potential of using citizen science to explore spatiotemporal suspended sediment dynamics using turbidity as a proxy in the Sondu-Miriu river basin in Kenya. The Sondu river originates in the Mau Forest Complex, which is one of Kenya's remaining indigenous tropical montane forests. The Mau Forest Complex experienced a significant loss of 25% forest cover between 1973 to 2013 through illegal logging, forest excisions, charcoal burning and encroachment for settlement and subsistence farming by smallholder farmers (Olang and Kundu, 2011; Otuoma et al., 2012; Swart, 2016; Brandt et al., 2018). Previous studies have linked deforestation in the Mau Forest Complex, to changes in hydrological processes such as changes in flow regimes, soil and water quality deterioration in the catchment (Masese et al., 2012a; Otuoma et al., 2012; Jacobs et al., 2017; Owuor et al., 2018). Masese et al. (2012a) highlight that due to the combined effects of human activities in the Sondu-Miriu river basin, turbidity has more than doubled in 30 years from a mean of 60 NTU in 1988 to 130 NTU in 2012. This could contribute to the accumulation of sediments in Lake Victoria at a rate of 2.3 mm year−1 and its effect on eutrophication (Verschuren et al., 2002; Zhou et al., 2014). Additionally, there has been a growing concern amongst the local officials in the water sector and water resource users on the significant increase in sediment transport in the Sondu river basin, which could be linked to high levels of encroachment (Kinyanjui, 2009).
Being the primary catchment area of the Sondu river, the Mau Forest Complex plays a critical role in the management of water resources, water quality and erosion. The Sondu river is not only important as a source of water for commercial (tea and forestry plantations) as well as smallholder agricultural and domestic use, but also for hydropower production. Improving the knowledge on water flows and suspended sediments dynamics in catchments with hydroelectric power plants is crucial (Esteves et al., 2019). Therefore, the collection of data to evaluate the spatial and temporal variability of sediment loads with the Sondu-Miriu river basin is needed to establish a proper baseline to assess alternative future management strategies. We hypothesized that citizen science is a cost-effective, and robust approach for data collection for sustainable water resource management, as it reduces the costs of suspended sediment monitoring and significantly improves data coverage. To our knowledge, this study presents the first analysis of community-based monitoring of sediment dynamics in a tropical forested catchment in East Africa.
Materials and Methods
Catchment Description
The study was carried out in the Sondu-Miriu river basin (3,450 km2) which originates in the Mau Forest Complex and drains into Lake Victoria at an elevation range of 1,140 to 2,900 m a.s.l (Figure 1A). The temporal rainfall distribution in the basin is driven by the intertropical convergence zone, generally exhibiting a bimodal rainfall pattern. A longer rainy season occurs from April to July, with rainfall peaks in April and May (>250 mm per months) in the upper part of the catchment, and a shorter rainy season between October and December. During the dry season in January and February the area receives the lowest amount of rainfall (<75 mm per months). The annual average rainfall ranges from 1,300 mm year−1 in the lowland areas to 1,900 mm year−1 in the highlands. Mean annual temperatures range from 16°C to 22°C (Stephens et al., 1992; Vuai et al., 2012), with a potential evapotranspiration rate of 1,400 to 1,800 per annum at the uplands and lower altitudes, respectively (Krhoda, 1988).
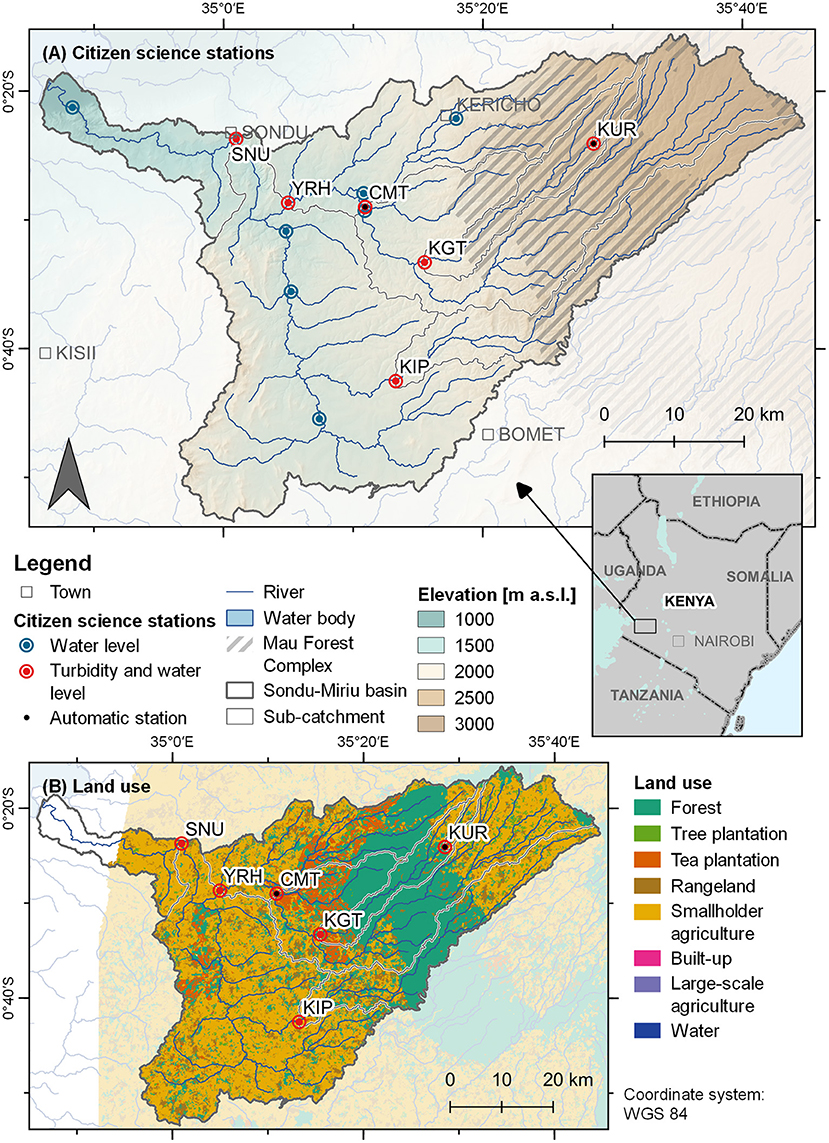
Figure 1. Map of the study area showing (A) elevation (SRTM digital elevation model 30 m resolution; USGS, 2000), citizen science stations and automatic water monitoring network and (B) land use within the Sondu-Miriu River Basin.
The Sondu-Miriu river basin is characterized by diverse land use types. The upper highland zone is dominated by small-scale farming in the eastern part and indigenous forest and woodlands, which are part of the Mau Forest Complex, in the central part (Figure 1B). From the edge of the forest to the west, the land opens up to a rich upland agricultural area characterized by commercial tea and tree plantations. Moving downstream to the lower midland zone, a mixed land use pattern comprising of smallholder agriculture predominate with more settlements. In this area most of the natural vegetation has been replaced by exotic tree species interplanted with crops (Jaetzold and Schmidt, 1983; Masese et al., 2012b). The lateral and longitudinal distribution of the riparian zones varies in terms of their structure, with severely degraded flood plains in some sites and those adjacent to agricultural land dominated by exotic tree species such as Eucalyptus spp. The riparian zones adjacent to the tea estates are well-maintained with dense native vegetation forming a buffer up to 30 m distance (Njue et al., 2016). Farming of crops such as maize, beans and potatoes as well as livestock keeping by smallholder farmers plays an important role in the area for both subsistence and economic purposes.
Generally, the soils are well-drained, deep (>1.8 m), fine textured with humic topsoil of high agricultural potential (Jaetzold and Schmidt, 1983). The predominant soils are humic Nitisols in the upper zones and Acrisols in the middle and Regasolos in the lower zones. Mollic Andosols, Cambisols, Phaeozems, Planosols, Vertisols, and Ferralsols are found in smaller proportions (Sombroek et al., 1982; Jaetzold and Schmidt, 1983; Ouma et al., 2011; Vuai et al., 2012) (Table 1).
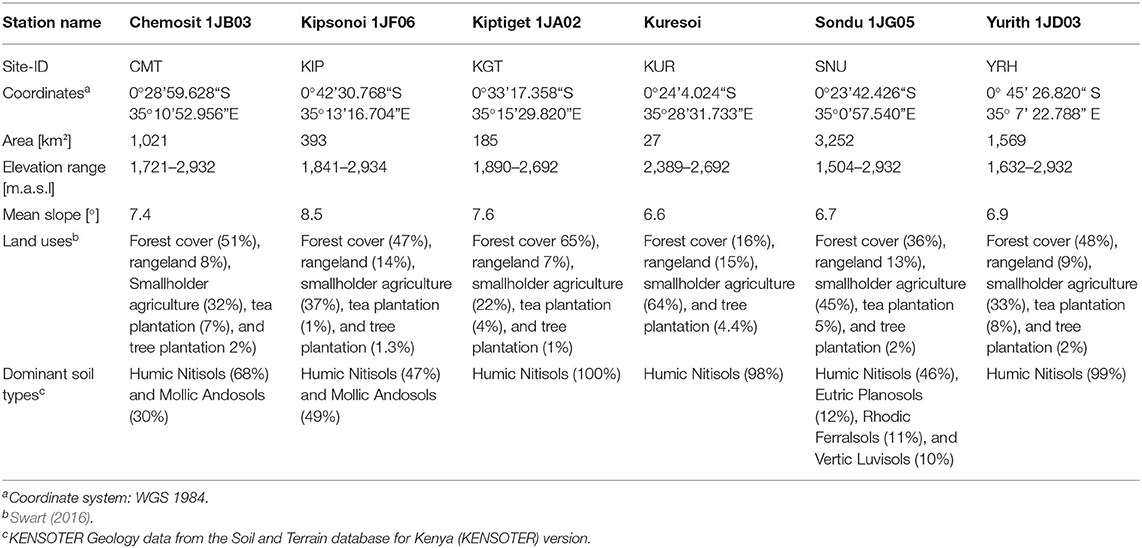
Table 1. Catchment characteristics of the monitoring subcatchments in the Sondu-Miriu river basin, Kenya.
Citizen Science Recruitment and Training
The study was designed as a “contributory” citizen science monitoring program, i.e., a scientist-directed program with citizen scientists primarily contributing to data collection (Bonney et al., 2009a). We selected six monitoring sites for turbidity monitoring out of the existing 13 sites for citizen science water level monitoring described in Weeser et al. (2018) (Figure 1A). During selection, we considered the accessibility and proximity to potential citizen scientists. Physical characteristics for the sites and their corresponding subcatchments are provided in Table 1.
With the help of local administration and Water Resource Users Associations (WRUAs), sensitization meetings with the local community members were conducted at the selected sites. WRUAs were considered a good entry point to reach the community members as these are community groups formed out of local water users to promote sustainable and equitable water use through management and conservation of water resources (Richards and Syallow, 2018). The aim of the sensitization meetings was to promote the project and identify potential participants who would volunteer in the water quality monitoring program. To understand the local knowledge, level of awareness and perception of the local community on water quality and supply, sensitization meetings allowed interactive discussions between citizens and scientists. Besides, a conceptual model of a river system representation in a poster was used to help the participants understand the basic concepts of what a catchment is and how it generally works. Beyond contributing data for scientific purposes, the participants were sensitized on the importance of community-based monitoring in generating data to inform policy, conservation and land management at local level.
Following the sensitization meetings, 19 citizen scientists, ~3 participants per site (21% female and 79% male), were recruited from the local community based on their interest and willingness to participate and contribute to the monitoring program. Even though participation was open to all community members, several factors may have influenced the citizen's decision to participate in the project and this could explain why more men participated than women. The majority of the citizen scientists were between 25 and 34 years old (42.1%, n = 8) with 21.1% (n = 4) of the participants between 45 and 54 years. Respectively, 15.8% (n = 3) and 10.5% (n = 2) were above 55 years and below 24 years. 31.6% (n = 6) of the participants had primary education, 52.6%, (n = 10) had secondary level of education, and 15.8% (n = 3) were college educated (e.g., vocational training and University) (Table 2).
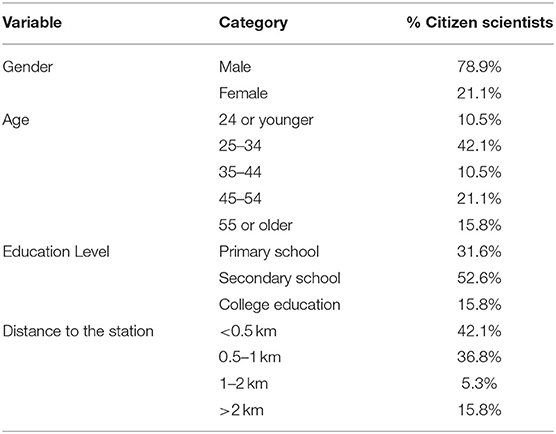
Table 2. Diversity in gender, age, education level, and distance to the monitoring station of the 19 trained citizen scientists.
At each site, a 1-day training session was conducted during which the participants were informed about the research design, and trained on sample collection and measurement procedures, data recording and submission Following training, multiple test measurements were made by the team of participants and compared to those taken by instructors. Each citizen scientist was equipped with a turbidity tube, water-sampling device, and an instruction manual in simple language. To avoid communication barriers the trainings were carried out in Swahili. Moreover, the measurement process was explained in the manual using pictures and instructions written in English as well as Swahili. Citizen scientists were encouraged to send water level and turbidity data at least twice per week. To encourage sustained engagement, we implemented a reimbursement of cell phone credit worth US$ 0.50 monthly (equivalent to 50 text messages) to the participants to compensate the costs incurred by sending the text message.
Field Data Acquisition and Transmission
Citizens measured turbidity using a modified Wagtech turbidity tube (Total Ex-Works Wagtech Projects, Thatcham UK). The viewing disk of the turbidity tube was modified to a yellow background colored with a black checker pattern to increase visibility. Turbidity was measured by filling the turbidity tube with river water, collected off the riverbank without disturbing the sediment, until the pattern on the disk fixed at the bottom of the tube was no longer visible when viewed from above. Turbidity was then estimated by reading the water level in the tube against the scale on the turbidity tube with values ranging from 5 to 500 TU (see details on calibration of turbidity tubes given below). In cases where the bottom was clearly visible when the turbidity was full, the turbidity reading was recorded as zero to indicate that the measurements were below the detection limit of the turbidity tube. Although Mitchell et al. (2007) advises to take the upper mark when the water level falls between two scale marks, this approach seems to underestimate suspended solid concentrations. Instead, we used a second commonly used approach which is to estimate a fractional value between the two scale marks, assuming a linear scale. In addition to turbidity, citizen scientists took water level data by reading the value from a water level gauge installed at the site.
After taking the measurements, the citizen scientists sent a text message containing the records and a site-specific ID using their mobile phones to the central database. The submitted data was then parsed by a script (using open source programming languages—Python and JavaScript) and interpreted to associate measurements with the specific monitoring station and parameter. Further information on data transmission and processing is detailed in Weeser et al. (2018). Additionally, the participants recorded data onto a standard form in the field. The data collection started in September 2017 and is still ongoing. For the present study we compiled and processed the dataset collected up to September 2019, covering a representative range of hydrological variations coinciding with seasonal changes in the Sondu-Miriu river basin.
Analysis of Level of Engagement
To gain a deeper understanding of the citizen scientists' participation pattern over time we used several measures. These include counting the total valid data records of individual participants submitted over the monitoring period from September 2017 to September 2019, analyzing the participation of each participant per site over time, classification of activity of participants, and computing the corresponding Gini coefficient using the approach frequently used to determine inequality of income (Atkinson, 1970). The latter approach has been applied in other citizen science projects to evaluate participants' contributions (Sauermann and Franzoni, 2015; Scott and Frost, 2017). A Gini coefficient is based on the Lorenz curve, which indicates the cumulative data contribution (y-axis) that is made by a cumulative share of participants (x-axis). A 45° line corresponds to total equality, i.e., all participants contribute the same amount of data. The Gini coefficient was then calculated as the ratio of the area between the 45° line and the Lorenz curve over the total area under the 45° line. A Gini coefficient of 0 expresses perfect equality, i.e., equal sampling among participants during the entire monitoring period, whereas a coefficient of 1 expresses maximal unequal sampling effort among participants (Atkinson, 1970).
To provide insight into individual's micro-level participation pattern, we categorized the degree of participation into very active, active, moderate, and less active participation, based on the frequency of participation over time and total data contributions. The very active participants are defined as those that sampled more intensively over a longer period (at least 20 months over a minimum of 25 consecutive months), characterized by more monthly contribution (at least 8 measurements per month) and a dataset exceeding 100 records. Active participants are those that contributed data consistently on multiple days in a month (at least four measurements per month) during the first 10 months after inception and characterized by a dataset ranging from 50 to 100 records. Moderately active participants are those that contributed data occasionally with few very active months (contributed at least 2–4 measurements in active months) and characterized by a dataset ranging from 20 to 50 records. Less active participants are those whose participation was infrequent (had not contributed data for over 12 months continuously after their initial month of participation) and of low intensity (contributed 1–2 measurements in active months), with a dataset of <20 records over the monitoring period.
Calibration
Calibration of the turbidity tubes was conducted and a relationship between turbidity and suspended sediments concentrations (SSC) was established from all the datasets obtained from the six citizen science monitoring stations and two automated monitoring stations, respectively. This was achieved by preparing suspensions covering a range of suspended sediment concentrations using fine sediments collected from different locations in the riverbed at each sampling site. We took the site-specific samples to account for potential differences in the physical and geochemical characteristics of the catchment and have a reasonable representation of the sediment transported in the catchment. The fine sediment material collected was first sieved to remove gravel and particles larger than 0.5 mm. Then a suspension was prepared in a bucket using the fine sediment material and river water. Further separation was done after 100 s, corresponding to a theoretical grain size of >50 μm following Stoke's law (Equation 1) by decanting the suspension in another bucket. The decanted suspension was used for the calibration. The settling time was calculated using the equation:
Where t is the settling time, η is the fluid viscosity [kg/ms], h is the settling depth [m], ρl is the liquid density [kg/m3], ρs is the particle density [kg/m3], g is the acceleration due to gravity [m/s2], and X is the particle diameter [m].
To obtain the required range of turbidity and suspended sediment concentrations, dilutions were made from the main suspension using clear water. The unit scale of the turbidity tube ranging from 5 to 500 TU was used to guide the calibration process. For each stepwise dilution, the suspension was homogenized by stirring the suspension continuously to prevent settling of sediments, filled in the tubes and the tubes' turbidity was recorded. We then calibrated the suspension in two ways. In the first one, 250 mL of the suspension was taken for the analysis of the suspended sediment concentration (mg L−1), which was determined gravimetrically, to determine the relationship between turbidity and SSC (Gray et al., 2000; Anderson and Davie, 2004). In a second approach, we measured the turbidity using the spectro::lyser installed at the two monitoring sites at KUR and CMT. The turbidity values recorded with the turbidity tube and spectro::lyser were calibrated against suspended sediment concentrations for each site using empirically derived linear regression models to allow for statistical prediction of these parameters.
Data Validation
Two sites (KUR and CMT) were located next to automatic monitoring stations measuring turbidity in FTU (formazin turbidity unit) using a UV-Vis based sensor (spectro::lyser, SCAN Messtechnik, Vienna, Austria) and water level with a radar-based sensor (VEGAPULS WL61, VEGA Grieshaber KG, Schiltach, Germany) at 10-min interval. Stenfert Kroese et al. (2020a) provide a detailed description of the stations. Turbidity data from the sensors were calibrated following the same approach as described in Section Data Validation. These data were used to evaluate the accuracy of the citizen-science data using a linear regression model. For each data point in the citizen science dataset, the corresponding measurement at the same day and time (±10 min) was obtained from the automated stations. Following the assumption that citizen scientists would not measure after sunset, measurements received by the SMS server past 6 pm were omitted to control sources of variability between the actual time the measurement was taken and when it was submitted, as this may account for differences when comparing the two datasets. Additionally, measurements which were taken at the same time by different participants but did not match or those that did not have a valid measurement from the automated station were excluded.
Quality Control and Assurance
Our study adopted multiple quality control measures to ensure the production of valid data that can yield both scientific and educational outcomes as proposed by (Wiggins et al., 2011). This involved developing simple and standardized data collection protocols and monitoring tools (manual containing instructions and water sampling equipment) that were essential for the process. Further, we trained the participants before embarking on the monitoring program and tracked their performance through follow-up meetings once per month. Additional quality control measures include replication through multiple measurements by the same participant and by having 3 or 4 participants per site to reduce sampling error and bias, submission of data to the central database along with field data sheets for verification, as well as manual screening and identification of outliers in the dataset. Furthermore, the citizen science generated data was compared and validated with the data recorded by the spectro::lyser sensor of the automated stations.
Due to the low number of cases of data replication, we filtered outliers by visually inspecting of the time series data and removed spurious data points. From over 1,300 measurements, 80 (6%) measurements contained invalid data and were not included for further analysis. The invalid data were due errors associated with typing, omitting of site-ID or sending the measurement to a wrong code e.g., submitting water level data using the code for turbidity.
Statistical Analyses
The suspended sediment concentrations were tested for normality using Q-Q plots and the Shapiro-Wilk test (P < 0.05) which revealed non-normal distribution of data. Therefore, all tests used in this study are non-parametric. To test for significant differences in the suspended sediment concentrations among different sites, the Mann-Whitney U test was used at P < 0.05. Spearman's correlation coefficients were calculated to identify the strength and direction of significant relationships (P < 0.05) between SSC concentrations and explanatory variables.
Results and Discussion
Relationship Between Turbidity and Suspended Sediment Concentration
To visualize the relationship between suspended sediment concentrations and the measured turbidity values from both turbidity tubes and automated stations measurements, the calibration dataset was pooled to obtain one rating curve for the turbidity tube and one for the automated stations. In the view of the potential loss of information through pooling of the data from the six subcatchments, we further compared the resulting regression statistics and found no significant difference between the slopes for each site-specific calibration (P > 0.1). Pooling data allows to establish one common calibration which can be used in case turbidity tubes are used in additional so far not measured subcatchments. The relationship between turbidity and suspended sediment concentrations showed a strong linearity (Figure 2). The strong relationship indicates a high predictability of SSC from turbidity tube readings and automated stations. Studies conducted to evaluate the use of turbidity tubes to predict total suspended solids concentrations in streams in northeast Ohio revealed also a highly predictive correlation (R2 = 0.896) (Anderson and Davie, 2004). Similarly, Stenfert Kroese et al. (2020a) reported a strong correlation between turbidity readings (FTU) and suspended sediment concentrations for the automated stations used in this study (R2 = 0.98).
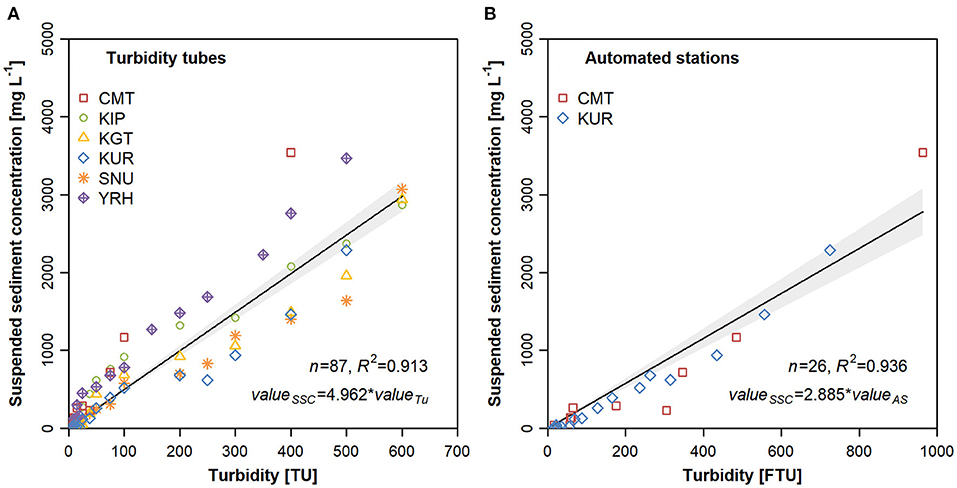
Figure 2. Relationship between suspended sediment concentrations (SSC) (mg L−1) and turbidity measurements using (A) turbidity tubes (Tu) at the six monitoring sites and (B) automated station (AS) at two monitoring sites (KUR and CMT) in the Sondu-Miriu river basin, Kenya.
Validation of Citizen Science Data
A comparison between citizen scientist collected data and measurements obtained with automated stations at KUR and CMT showed high correlation of 0.95 and 0.94, with a root mean square error (RMSE) of 40.2 and 33.1 mg L−1, respectively (Figure 3). However, citizen scientists measurements at KUR tended to deviate from the 1:1 slope to a great extent and the suspended sediment concentration was found to be more likely to be underestimated at higher concentrations (>50 mg L−1, P < 0.05), a bias observed in other citizen science datasets as well (Ho et al., 2020). For data comparability and quality between participants, the relative difference between suspended sediment data collected with the turbidity tubes by the two most active participants per site and the data measured by the automated station was calculated (Figure 4). The results show that the citizen scientists at KUR underestimated SSC by ~30% and generally overestimated low SSC values at CMT, but there was no significant difference in measurements between the participants (P > 0.05). Other studies suggest that turbidity tube readings can over- or underestimate actual turbidity values for particular locations due to site-specific characteristics such as particle size, composition of particulate matter, lighting conditions and error between different observers (Dorea and Simpson, 2011; Rügner et al., 2013; Scott and Frost, 2017). We found no significant difference between the citizen scientists' data and automated stations data at CMT (P > 0.05), indicating consistency in suspended sediment concentrations between the two methods. Scott and Frost (2017) reported a good relationship between turbidity measurements taken by volunteers using turbidity tubes and lab measurements of total suspended solids (R2 = 0.68). This is an indication that measurements taken by citizen scientists using turbidity tubes can provide useful information on the concentration of suspended sediments in rivers in the Sondu-Miriu catchment, as found elsewhere (Anderson and Davie, 2004).
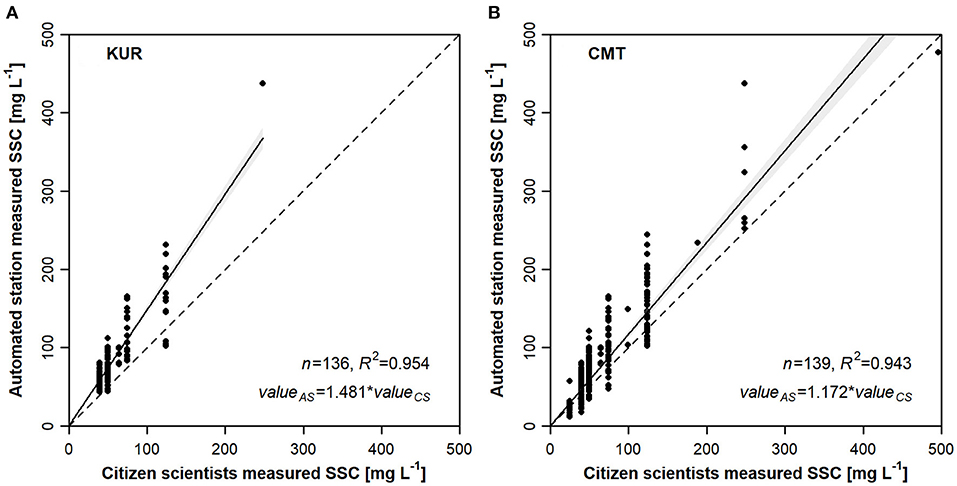
Figure 3. Comparison of the suspended sediment concentration (mg L−1) calculated based on calibrated turbidity measurements collected by citizen scientist and automated stations between September 2017 and September 2019 for (A) KUR and (B) CMT in the Sondu-Miriu river basin, Kenya. The dashed line represents the 1:1 relationship.
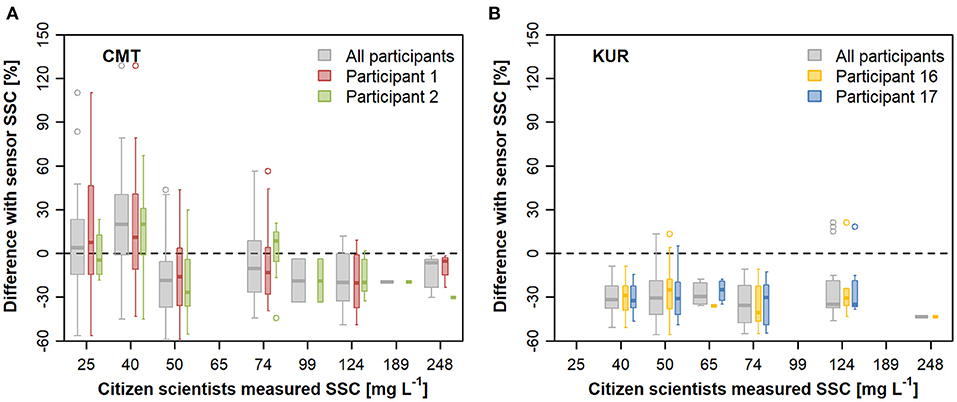
Figure 4. Relative difference between citizen scientists measured SSC (mg L−1) using turbidity tubes and the SSC (mg L−1) obtained from turbidity data recorded by an in situ UV-Vis sensor at the corresponding automated station for (A) CMT and (B) KUR. The gray boxplots show the relative difference for all participants at a given site. Participant number corresponds to the participant ID shown in Figure 6.
Our results indicate that the lower detection limit for SSC under field conditions for our turbidity tubes is about 25 mg L−1. Anderson and Davie (2004) reported that an accurate estimation of SSC in the lower ranges (10–20 mg L−1) is more difficult due to low repeatability owing to the detection limits of the turbidity tubes. Also, the scale on the turbidity tube, especially for larger values, is so rough that some detail is lost at this range. A similar observation was reported by the Forest Water Watch project in Toronto, Canada (Scott and Frost, 2017). Additionally, only very few SSC values >200 mg L−1 were recorded by the citizen scientists, thus failing to capture major sediment export events, a sampling bias frequently reported with citizen science approaches (Thornhill et al., 2016; Miguel-Chinchilla et al., 2019). We attribute this to individual preferences of citizen scientist as high SSCs are likely correlated with increased water levels, rainfall and “bad weather.” It is very likely that citizens simply avoid sampling under these conditions. This could have resulted in the underestimation of SSC from each of the monitored subcatchment by an unknown proportion (Ziegler et al., 2014; Dutton et al., 2018).
Rapid developments in technology and rise of low-cost robust sensors with improved detection limits and resolution could be suitable for citizen science studies to complement already existing crowdsourcing efforts (Buytaert et al., 2014; Scott and Frost, 2017). Recently, an improved quantification of both turbidity and concentration of suspended particular matter by use of smartphone applications such as HydroColor has been successfully tested in Australia and USA to monitor inland waters (Leeuw and Boss, 2018; Malthus et al., 2020) and in Myanmar to monitor Ayeyarwady river (Thatoe Nwe Win et al., 2019). Other studies have demonstrated working methods using digital cameras in Wisconsin for water quality mapping (Compas and Wade, 2018).
Participation Rate
Sustained engagement and generating the required participation levels in citizen science are of primary importance in contributing to data quality and should therefore be carefully considered (Scott and Frost, 2017; Moor et al., 2019; Serret et al., 2019). To evaluate this, we used data on the participation of the citizen scientists from the six monitoring sites. We noticed that the number of participants, of which 19 participated in 1-day training meetings held at the monitoring sites, increased to 37 during the project. Unlike the original 19 participants, these 18 “new” citizen scientists were not followed up intensively during the project. We assume that some of the 18 “new” participants borrowed the tubes and received training from the original participants during their weekly sampling and contributed to the dataset out of intrinsic motivation. This is consistent with other research that reported on citizen science behaviors as a potential avenue for recruiting new members to the program and diffusion of knowledge, for example the Wabash Blitz volunteer experience (Church et al., 2019). Alternatively, the original participants changed their cellphone numbers during the monitoring period and were consequently considered as “new” participants. However, since none of the “new” participants showed a sudden and strong activity in the middle or toward the end of the study period, it is unlikely that such cases occurred as the trained participants consistently contributed most of the data each month. Additionally, there are those participants who contributed data occasionally during the training, and/or monthly sensitization meetings.
The sampling effort and data contribution varied over time with noticeable spikes (Sauermann and Franzoni, 2015). Figure 5A reveals that the highest level of participation was recorded during early stages of the project with October 2017 having the highest number of measurements (n = 101) followed by a decline in the subsequent months. This could be attributed to the initial novelty when the project activity started and the motivation of the community to learn a new skill (Raddick et al., 2009; Rotman et al., 2012). The monthly spikes can be explained by subsequent growing interest among participants as they became more experienced in the monitoring, new participants who joined later in the project phase or by monthly sensitization meetings undertaken by the project to encourage engagement. All of the participants at sites KUR, CMT and KIP that contributed large numbers of readings lived within 1 km distance from the monitoring station and visited the river more often as they depend on river water for domestic use (Table 3). In contrast, reduced motivation over time due to limited ease of access and proximity to monitoring stations could be associated to the low participation rate thus a smaller amount of data at sites SNU, and YRH where 4 out of 6 of the participants lived more than 2 km away. Besides, one of the participants at SNU mentioned that monitoring water level was easy as the staff gauges alongside signboards were installed at designated gauging station, whereas the water quality measurements required bringing own equipment to the site. A reducing interest in long-term citizen science based research is a typical pattern found in other projects as well. Volunteer Lake Monitors in Minnesota and Alabama Water Watch programs reported an overall increase in number of dropouts after the 1–3 years of the monitoring program (Klang and Heiskary, 2000; Deutsch and Ruiz-Córdova, 2015). Notwithstanding, the last phase of the project was characterized by a more stable monitoring effort as compared to other phases with an average rate data contribution of 25 measurements per month over all the sites.
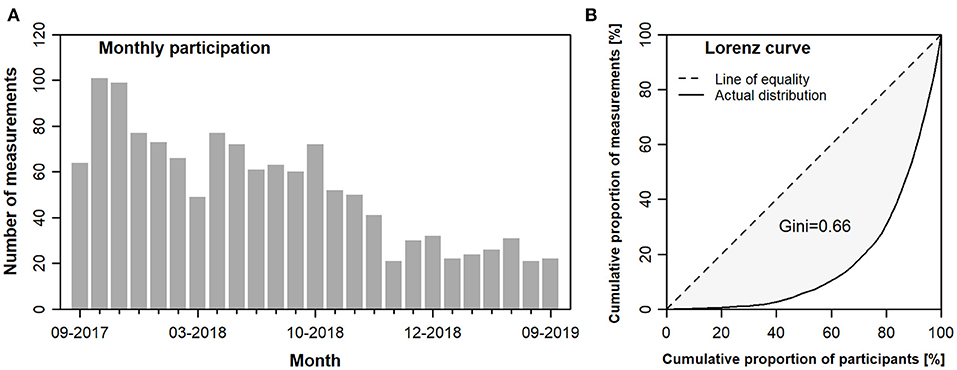
Figure 5. Participation of citizen scientists in data collection and cumulative for the monitoring period from September 2017 to September 2019 in the Sondu basin, Kenya: (A) total number of measurements per month (B) Lorenz curve representing inequality in data collection by all participants.
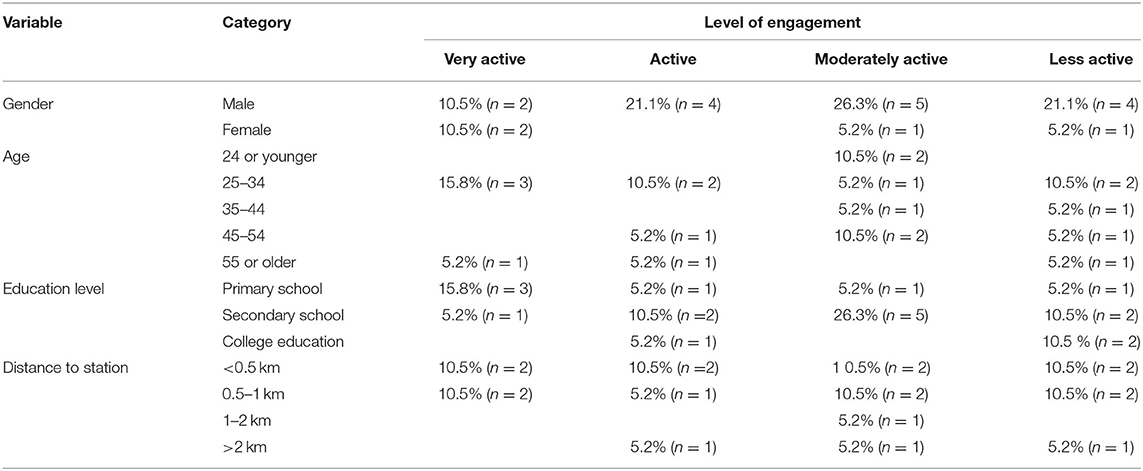
Table 3. Demographics of the 19 trained citizen scientists in relation to the level of engagement based on the total number of valid measurements contributed over the entire monitoring period between September 2017 to September 2019 (Very active: >100, active: 50–100, moderately active: 20–50, less active: <20).
As noted by Wilkinson (2008), participation follows a power law of distribution in which a small number of very active participants account for most of the activity. This is reflected in the Gini coefficient of 0.66 (Figure 5B). While still being relatively high and indicating the dominance of a few participants providing most of the data, our Gini coefficient is somewhat lower than those reported for other projects such as the Toronto Forest Water Watch project and Zooinverse with Gini coefficients of 0.84 and 0.85, respectively (Sauermann and Franzoni, 2015; Scott and Frost, 2017). Analyzing individual-level total data contribution, we find that the very active participants (11%, n = 4) and active participants (11%, n = 4) contributed 72% of the data. The remaining data were collected by moderately active members (19%, n = 7), and less active participants (59%, n = 22), most of whom we presume belong to the group of new participants. Of all the participants, four (11%) contributed data consistently for the entire monitoring period (25 months), indicating a long term-commitment from participants residing near to the monitoring locations. 35% (n = 13) of the participants dropped out of the program after 1–2 months of monitoring, while 30% of the participants monitored for a period of 11–25 months (Figure 6). The greatest proportion of participants with the highest level of engagement were between 25 and 34 years with primary education, even though most of the citizen scientists had secondary school education (Table 3). The findings resonates with other studies that observed a similar pattern in which younger (<35 years) and lower educated people showed active participation and long-term commitment in citizen science projects (Brouwer and Hessels, 2019; Weeser et al., 2021). Nevertheless, even occasional participants can successfully contribute to the monitoring program as most contributions in citizen science are attained by returning participation (Sauermann and Franzoni, 2015).
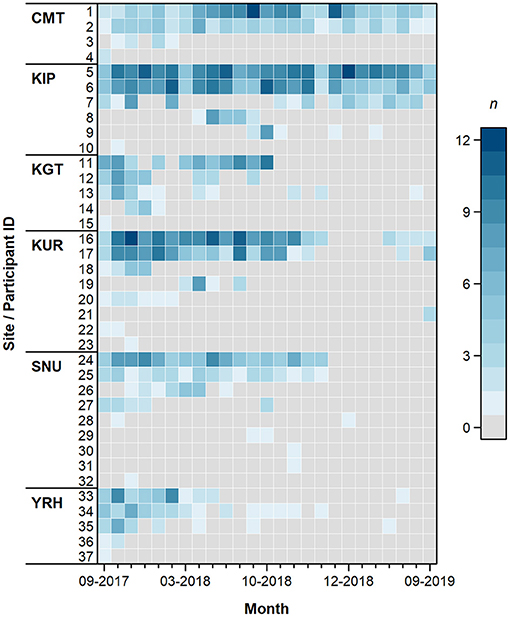
Figure 6. Temporal distribution of data collected by all participants at all the monitoring sites for the monitoring period from September 2017 to September 2019. Level of engagement is based on the number of measurements (n) contributed per month.
Method of Engagement
In addition to generating relevant research data and increasing scientific knowledge, designing, and building a citizen science project requires the consideration of social aspects to sustain user motivation and achieve project goals (Shirk et al., 2012; Domroese and Johnson, 2017). The decline in participation rate and drop out of citizen scientists in the study could have been contributed by the cost of 0.01 USD involved in the transmission of data (Weeser et al., 2021). Additionally, a delay in the reimbursement of credit after submission of data, as this was done at the end of the month, could have demotivated participants thus resulting in declining participation (Wald et al., 2016). Other studies have identified financial incentives as a significant barrier for participation in developing countries where citizen scientists expect to derive income from their engagement (Hobbs and White, 2012; Buytaert et al., 2014). Another challenge in engaging long-term participation could be attributed to the disconnect between the projects objectives and needs of the community as well as interests of the participating group (Wald et al., 2016; Church et al., 2019). According to Golumbic et al. (2020), identifying and addressing a community need can ease the challenging process of participant retention and support sustained engagement.
To minimize barriers for participation we kept the method of sending data as simple as possible. As mobile phone coverage and usage become a more established method of communication in East Africa (Krell et al., 2020), we chose the text message service since it is easy to use, user-friendly, stable, and inexpensive (Weeser et al., 2018). Delivery of feedback is a fundamental element of a successful citizen science program (Brouwer et al., 2018). In this study we incorporated an automated feedback built into the central server to provide an immediate feedback to the citizen scientists and appreciation message of “Thank you” based on the participant's measurements. Such an engagement strategy has a positive influence that could keep the citizen scientists motivated as it acknowlegdes their contribution and indicates the level of activity (Lowry and Fienen, 2013; Weeser et al., 2018). Additionally, two meetings at two sites (KUR and SNU) were organized to communicate preliminary results to the citizen scientists and to other local community members. This provided a platform for interactive feedback between the researchers, citizen scientists and community members after which some participants would be motivated and encouraged to continue sending data. Majority of the volunteers who participated in the water level monitoring program in the same catchment reported that such meetings were powerful means to reach out to the community and engage motivated volunteers (Weeser et al., 2021). Furthermore, visualization and communication of results through meetings or other virtual platforms such as web-based technologies could incentivise citizen scientists for further engagement as they can directly gain from participation (Buytaert et al., 2014; Golumbic et al., 2020).
Spatial and Temporal Trends of Suspended Sediment Concentrations
Suspended sediment concentrations in the Sondu-Miriu river basin ranged from 25 to 496 mg L−1 with an average of 75 ± 56 mg L−1. The data revealed significant differences among sites (P < 0.05). The suspended sediment concentrations were significantly higher at SNU than at all other sites (109 ± 94 mg L−1) while KGT had the lowest SSC (50 ± 25 mg L−1), (P < 0.05) (Figure 7). The proportion of smallholder agriculture (r = 0.11) and catchment area (r = 0.17) were positively but weakly correlated with SSC concentrations (P < 0.05). There is a large body of literature that shows a tight relationship between land use and erosion rates. Particularly, agriculture is associated with increased erosion rate due to arable practices, loss of soil structure and reduced forest cover (Ou et al., 2016; Poudel, 2016; Tanaka et al., 2016), that limit infiltration rates and soil hydraulic conductivity properties in the catchment (Nadal-Romero et al., 2018; Owuor et al., 2018). Earlier studies in the neighboring Mara river basin found that unregulated livestock grazing and agricultural land conversion may have increased erosion and contributed to the higher than expected sediment yields from the catchment (Dutton et al., 2018). Stenfert Kroese et al. (2020a) observed that agriculture and unpaved tracks, which are pathways for people and livestock to the streams, in a smallholder catchment in the Sondu-Miriu river basin could be another driving force for the total sediment load into rivers, due to more overland flow. The presence of intact riparian zones, characterized by mixed dense indigenous vegetation, and commercial tea plantation and forest plantation practices around KGT may explain the low suspended sediment concentrations. In contrast, the longitudinal quality of the riparian zone at SNU is degraded with limited ground cover and disturbed banks due to cultivation of crops and plantation of woodlots with exotic tree species. Forests and riparian buffer zones can act as a filter, controlling and decreasing the sediment load by surface runoff (Mello et al., 2018). Similar effects were reported in previous studies that found forested watersheds to have lower suspended sediment concentrations as compared to agricultural landscapes (Tu, 2013; Zhang et al., 2017; Mello et al., 2018; Stenfert Kroese et al., 2020a). Contrasting the effect of land use, we have no clear explanation for the positive correlation with catchment size. Even though increasing catchment area is correlated with larger suspended sediment loads (Göransson et al., 2013; López-Tarazón and Estrany, 2017), we would have expected higher SSC with smaller catchment size, due to higher stream velocities, as well as larger variability and extremes of discharge.
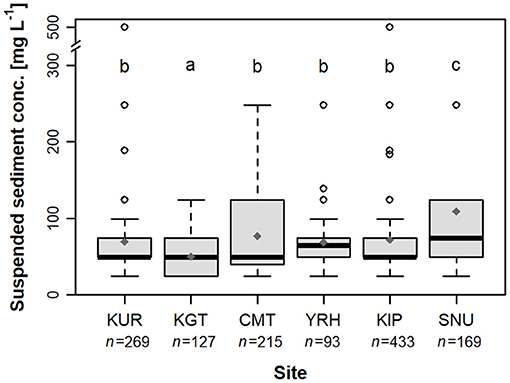
Figure 7. Variation in suspended sediment concentrations across the monitoring sites for the sampling period September 2017 to September 2019. The lower and upper lines of the boxplots correspond to the 1st and 3rd quantile (Q1 and Q3), respectively, while the solid horizontal line inside the box represents the median value (Q2). The lower and upper whiskers show the minimum and maximum values within 1.5 times the interquartile range, while the circle markers represent extreme values outside of that range. Significant differences among sites are indicated with different letters (P < 0.05).
Visual assessment of the hydrological time series data shows seasonal variability in both suspended sediment concentration and water level (Figure 8). YRH was omitted from the analysis as it had a short time series because the installation of water level gauge and monitoring of the water level started later in March 2018. The time series of citizen science generated water level and SSC data at sites KUR and CMT show similar trends with the data from the automated station in relation to high and low flow conditions (Figures 8A,C). Nevertheless, the citizen scientists did not manage to capture the same degree of variability in SSC concentrations, especially during the rainy season. Peak SSC concentrations were reached in early to mid-rainy season (in the months of April-July for long rains and September to October for short rains), in some instances prior to peak flow, and decreased in the transition from rainy to dry season (in the months of December-March). The higher concentrations of suspended sediments during the rainy season and the lower concentrations in the dry season in this study are consistent with other rivers studied in the Mau Forest Complex (Dutton et al., 2018; Stenfert Kroese et al., 2020a). Also notable are the considerable high SSC even in times when flows were consistently lower in March and May 2019 at site CMT and KIP. This could be due to the time lapse between the rains and their respective effect on the concentration and water level (Göransson et al., 2013). Other studies have reported similar results showing that the SSC did not necessarily change with discharge values which is an indication that other factors besides rainfall such as natural and anthropogenic disturbances control the SSC in small catchments (Ouellet-Proulx et al., 2016; Rodríguez-Blanco et al., 2018). Stenfert Kroese et al. (2020a), in a study in the same catchment, reported that the impulse response between the peaks of discharge and sediment concentration was in general longer compared to the rainfall peak.
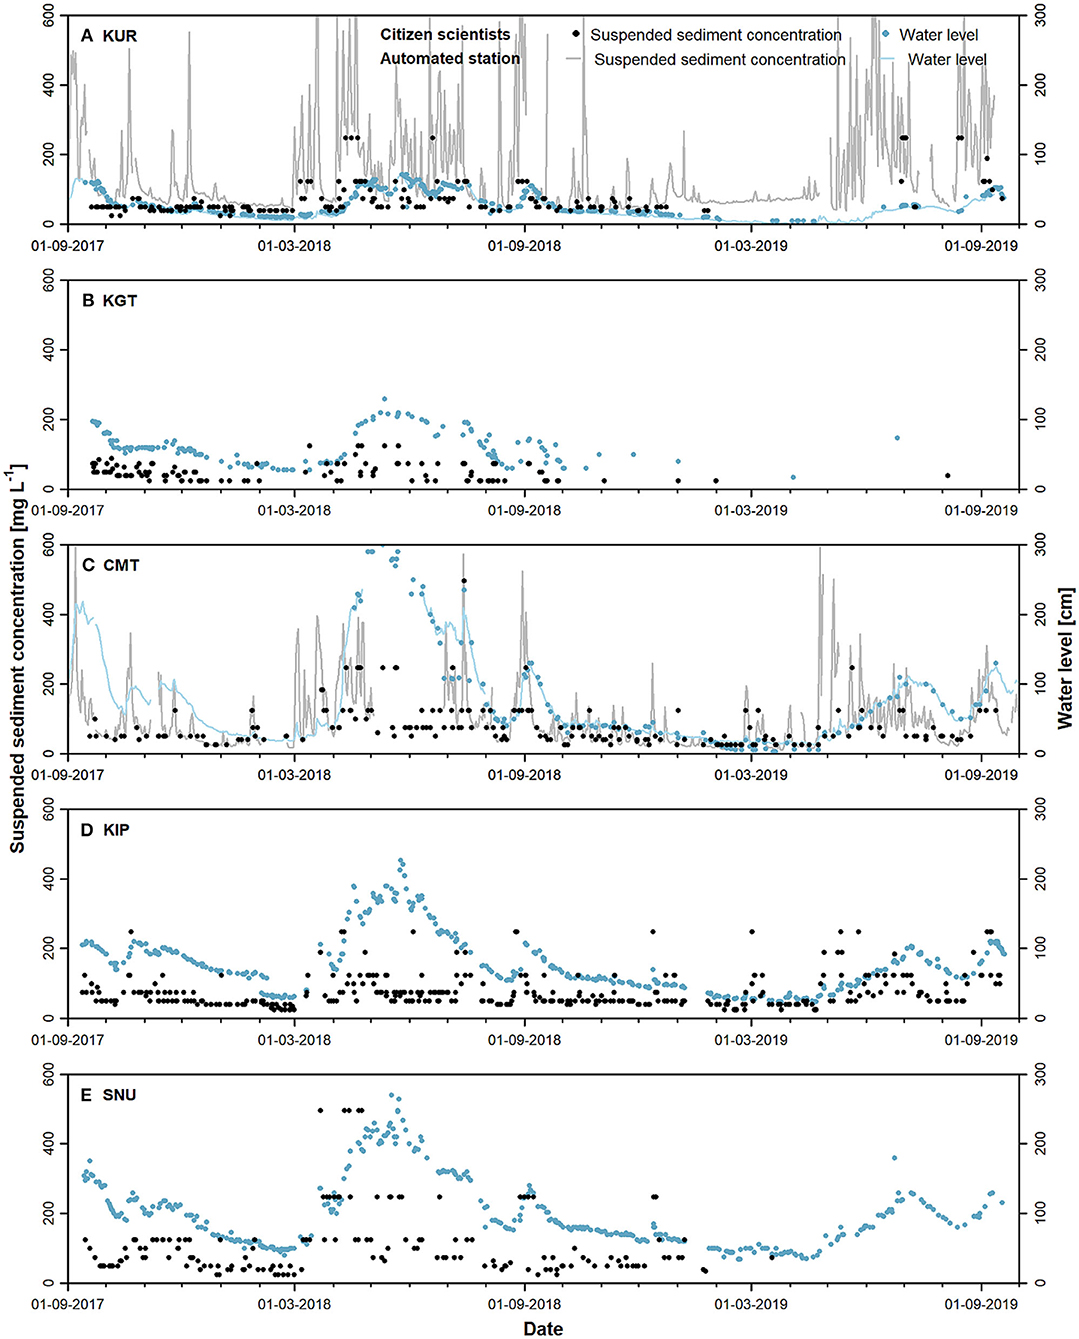
Figure 8. Time series of suspended sediment concentration and observed water level transmitted by citizen scientists at five sites and measured by automated stations at sites KUR and CMT in the Sondu-Miriu river basin over the monitoring period between September 2017 to September 2019: (A) KUR, (B) KGT, (C) CMT, (D) KIP, (E) SNU.
Overall, citizen science project in Kenya indicate a promising new approach for recording water quality data in a remote tropical environment. The study also reveals that, when appropriately used, turbidity tubes can be an effective and inexpensive monitoring tool to estimate relative sediment concentrations from different catchments. The total cost for setting up and operating the entire citizen science based network for 1 year cost ~$10,000 (including cost for the purchasing of sampling materials, meetings and on-site visits, and maintenance of the data server). In contrast, setting up an automated station at one site cost ~$50,000, which is much more expensive as compared to operating a citizen-science approach. Furthermore, extra costs incur annually for security and regular maintenance of automated stations, despite of malfunctioning of sophisticated analytical instruments due to harsh environmental conditions in tropical ecosystems.
Conclusion
This study evaluated the potential of citizen science to monitor suspended sediment concentrations in a remote tropical river basin using turbidity measured with turbidity tubes as a proxy. The citizen science generated data showed a good relationship with the automated measurements of suspended sediment concentrations, which reveals that turbidity tubes can be an effective and inexpensive tool to estimate relative differences in suspended sediment concentrations between catchments with contrasting conditions. This is at least the case under low to moderate water levels. Limitations such as sampling biases attributed to underestimation and the precision of measurements due to low repeatability owing to the detection limits of the turbidity tubes were observed. Notwithstanding, understanding the error and bias associated with citizen science generated data in estimating suspended sediments, the data can be used to provide baseline information on concentrations and support implementation of catchment and land use best management practices. Where the purpose of the data is to calculate sediment yields, further investigation through extensive sampling and increased spatial and temporal resolution is recommended. The possibilities of sampling even extreme events might be even more difficult. On the one hand, because it is difficult to take representative water samples from the middle of stream where sediment loads are likely highest and, on the other hand, because the willingness of the citizens to voluntarily work outside under extreme weather conditions is low.
Despite the limitations of the data collected with the turbidity tubes, the data provide good insights of the spatial and temporal dynamics of sediment concentrations in the Sondu-Miriu river basin. Our findings highlight the forest cover as a key landscape feature as low levels of suspended sediment concentrations were recorded in areas with high forest cover. In contrast, suspended sediment concentrations in the downstream subcatchment dominated with agriculture and rangeland was significantly higher as compared to other subcatchments upstream, indicative of the impacted state of the river ecosystems in the Sondu-Miriu river basin.
Prospective future works should consider employing smartphone applications and robust sensors with improved detection limits and resolution that are suitable for citizen science studies in order to increase the precision of concentration measurements, allow for higher sampling rates and less subjective readings. We particularly see an advantage of those systems that will allow contact-free, remote measurements of the river through taking pictures or video-taping from remote places such as a bridge.
Finally, long-term participation of citizen scientist remains a challenge. While the participation and sampling equality rates were comparable to other citizen science projects, only 11% of the participants remained engaged for the full monitoring period, an indication of a high dropout rate. However, both long-term and short-term monitoring efforts from the participants can increase the spatial and temporal coverage of the overall dataset. Increased collaboration between researchers and the citizen scientists through interactive feedback and communication strategies could be an incentive to promote sustained participation. This study emphasizes the need for further empirical research on the social processes within the context of citizen science in low-income regions to understand in depth the motivations and engagement dynamics to minimize barriers and improve overall participation.
Overall, the results indicate that citizen science is no panacea but is a promising new cost effective approach that affords a unique opportunity for monitoring hydrological and water quality data in a remote tropical montane rainforest environment.
Data Availability Statement
The original contributions presented in the study are included in the article/Supplementary Material, further inquiries can be directed to the corresponding author/s.
Author Contributions
NN, JG, LB, BW, SJ, and MR designed the study. NN, JG, and BW implemented the study. NN analyzed the data and drafted the manuscript. SJ, BW, MR, and LB reviewed and edited the manuscript. All co-authors read the manuscript.
Funding
We thank the German Federal Ministry for Economic Cooperation and Development (Grants 81195001 Low Cost methods for monitoring water quality to inform upscaling of sustainable water management in forested landscapes in Kenya and Grant 81206682 The Water Towers of East Africa: policies and practices for enhancing co-benefits from joint forest and water conservation) for generously providing financial support, and the German Science Foundation DFG (BR2238/23-1) for co-funding this research. This work is a contribution to the CGIAR programme on Forest, Trees and Agroforestry led by the Center for International Forestry Research (CIFOR). We also thank the German Academic Exchange Service (DAAD) in collaboration with National Research Fund (NRF), Kenya for the scholarship award.
Conflict of Interest
The authors declare that the research was conducted in the absence of any commercial or financial relationships that could be construed as a potential conflict of interest.
Acknowledgments
The participation of citizen scientists and Water Resource Users Associations (WRUAs) of the Sondu-Miriu river basin was very crucial for the success of this research and is greatly appreciated. We would also like to thank Zacchaeus Kemboi (GIZ) as well as the officers of the Water Resources Authority (WRA) for their support in the implementation of the program.
Supplementary Material
The Supplementary Material for this article can be found online at: https://www.frontiersin.org/articles/10.3389/frwa.2021.656770/full#supplementary-material
References
Akrasi, S. A. (2005). The assessment of suspended sediment inputs to Volta Lake. Lakes Reserv. Res. Manag. 10, 179–186. doi: 10.1111/j.1440-1770.2005.00272.x
Anderson, P., and Davie, R. D. (2004). Use of transparency tubes for rapid assessment of total suspended solids and turbidity in streams. Lake Reser. Manag. 20, 110–120. doi: 10.1080/07438140409354355
Atkinson, A. B. (1970). On the measurement of inequality. J. Eco. Theory 2, 244–263. doi: 10.1016/0022-0531(70)90039-6
Baldyga, T. J., Miller, S. N., Driese, K. L., and Gichaba, C. M. (2008). Assessing land cover change in Kenya's Mau Forest region using remotely sensed data. Afr. J. Ecol. 46, 46–54. doi: 10.1111/j.1365-2028.2007.00806.x
Berihun, M. L., Tsunekawa, A., Haregeweyn, N., Meshesha, D. T., Adgo, E., Tsubo, M., et al. (2019). Exploring land use/land cover changes, drivers and their implications in contrasting agro-ecological environments of Ethiopia. Land Use Policy 87:104052. doi: 10.1016/j.landusepol.2019.104052
Bonney, R., Ballard, H. L., Jordan, R., McCallie, E., Phillips, T. B., Shirk, J. L., et al. (2009a). Public Participation in Scientific Research: Defining the Field and Assessing Its Potential for Informal Science Education. Washington, D.C: Center for Advancement of Informal Science Education (CAISE).
Bonney, R., Cooper, C. B., Dickinson, J., Kelling, S., Phillips, T. B., Rosenberg, K. V., et al. (2009b). Citizen science: a developing tool for expanding science knowledge and scientific literacy. BioScience 59, 977–984. doi: 10.1525/bio.2009.59.11.9
Brandt, P., Hamunyela, E., Herold, M., De Bruin, S., Verbesselt, J., and Rufino, M. C. (2018). Sustainable intensification of dairy production can reduce forest disturbance in Kenyan montane forests. Agriculture, ecosystems and environment 265, 307–319.
Brouwer, S., and Hessels, L. K. (2019). Increasing research impact with citizen science: the influence of recruitment strategies on sample diversity. Public Underst. Sci. 28, 606–621. doi: 10.1177/0963662519840934
Brouwer, S., Paul, W. J. J., van der, W., Merijn, S., Maarten, C., and Jos, F. (2018). Public participation in science: the future and value of citizen science in the drinking water research. Water 10:284. doi: 10.3390/w10030284
Buytaert, W., Zulkafli, Z., Grainger, S., Acosta, L., Alemie, T. C., Bastiaensen, J., et al. (2014). Citizen science in hydrology and water resources: opportunities for knowledge generation, ecosystem service management, and sustainable development. Front. Earth Sci. 2:26. doi: 10.3389/feart.2014.00026
Church, S. P., Payne, L. B., Peel, S., and Prokopy, L. S. (2019). Beyond water data: benefits to volunteers and to local water from a citizen science program. J. Environ. Planning Manag. 62, 306–326. doi: 10.1080/09640568.2017.1415869
Compas, E. D., and Wade, S. (2018). Testing the waters: a demonstration of a novel water quality mapping system for citizen science groups. Citizen Sci Theory Practice 3:124. doi: 10.5334/cstp.124
Deutsch, W. G., and Ruiz-Córdova, S. S. (2015). Trends, challenges, and responses of a 20-year, volunteer water monitoring program in Alabama. Ecol. Soc. 20:314. doi: 10.5751/ES-07578-200314
Domroese, M. C., and Johnson, E. A. (2017). Why watch bees? Motivations of citizen science volunteers in the Great Pollinator Project. Biol. Conserv. 208, 40–47. doi: 10.1016/j.biocon.2016.08.020
Dorea, C. C., and Simpson, M. R. (2011). Turbidity tubes for drinking water quality assessments. J. Water Sanit. Hyg. Dev. 1, 233–241. doi: 10.2166/washdev.2011.058
Dutton, C. L., Subalusky, A. L., Anisfeld, S. C., Njoroge, L., Rosi, E. J., and Post, D. M. (2018). The influence of a semi-arid sub-catchment on suspended sediments in the Mara River, Kenya. PLoS ONE 13:e0192828. doi: 10.1371/journal.pone.0192828
Esteves, M., Legout, C., Navratil, O., and Evrard, O. (2019). Medium term high frequency observation of discharges and suspended sediment in a Mediterranean mountainous catchment. J. Hydrol. 568, 562–574. doi: 10.1016/j.jhydrol.2018.10.066
Fritz, S., Fonte, C. C., and See, L. (2017). The Role of Citizen Science in Earth Observation. Rem. Sensing. 9:357.
Gao, P., Pasternack, G. B., Bali, K. M., and Wallender, W. W. (2007). Suspended-sediment transport in an intensively cultivated watershed in southeastern California. Catena 69, 239–252. doi: 10.1016/j.catena.2006.06.002
Golumbic, Y. N., Baram-Tsabari, A., and Koichu, B. (2020). Engagement and communication features of scientifically successful citizen science projects. Environ. Commun. 14, 465–480. doi: 10.1080/17524032.2019.1687101
Gomani, M. C., Dietrich, O., Lischeid, G., Mahoo, H., Mahay, F., Mbilinyi, B., et al. (2010). Establishment of a hydrological monitoring network in a tropical African catchment: an integrated participatory approach. Phys. Chem. Earth, Parts A/B/C 35, 648–656. doi: 10.1016/j.pce.2010.07.025
Göransson, G., Larson, M., and Bendz, D. (2013). Variation in turbidity with precipitation and flow in a regulated river system – river Göta Älv, SW Sweden. Hydrol. Earth Syst. Sci. 17, 2529–2542. doi: 10.5194/hess-17-2529-2013
Gray, J., Glysson, G., Turcios, M., and Schwarz, E. (2000). Comparability of Suspended-Sediment Concentration and Total Suspended Solids Data. US Geological Survey Water-Resources Investigations Report 00-4191 20 Reston, Virginia, USA.
Haklay, M. (2015). Citizen Science and Policy: A European Perspective. Washington, DC: Woodrow Wilson International Center for Scholars.
Ho, S. Y.-F., Xu, S. J., and Lee, F. W.-F. (2020). Citizen science: an alternative way for water monitoring in Hong Kong. PLoS ONE 15, e0238349. doi: 10.1371/journal.pone.0238349
Hobbs, S. J., and White, P. C. L. (2012). Motivations and barriers in relation to community participation in biodiversity recording. J. Nat. Conserv. 20, 364–373. doi: 10.1016/j.jnc.2012.08.002
Jacobs, S. R., Breuer, L., Butterbach-Bahl, K., Pelster, D. E., and Rufino, M. C. (2017). Land use affects total dissolved nitrogen and nitrate concentrations in tropical montane streams in Kenya. Sci. Total Environ. 603–604, 519–532. doi: 10.1016/j.scitotenv.2017.06.100
Jacobs, S. R., Weeser, B., Guzha, A. C., Rufino, M. C., Butterbach-Bahl, K., Windhorst, D., et al. (2018). Using high-resolution data to assess land use impact on nitrate dynamics in east african tropical montane catchments. Water Resour. Res. 54, 1812–1830. doi: 10.1002/2017WR021592
Jaetzold, R., and Schmidt, H. (1983). Farm Management Handbook of Kenya. Volume II: Natural Conditions and Farm Management Information, Part B Central Kenya (Rift Valley and Central Provinces). Nairobi: Ministry of agriculture, Kenya, in cooperation with the German Agricultural Team (GAT) of the GTZ.
Kinyanjui, M. J. (2009). The effect of human encroachment on forest cover, composition and structure in the western blocks of the mau forest complex (Unpublished Ph D thesis). Department of Natural Resources of Egerton University, Kenya.
Klang, J. L., and Heiskary, S. (2000). “Minnesota methods for analyzing, applying and disseminating volunteer lake monitoring data,” in NWQMC National Monitoring Conference 2000, April 25-27, 2000 (Austin, TX: Monitoring for the Millennium) (The Council), 1.
Kongo, V. M., Kosgei, J. R., Jewitt, G. P. W., and Lorentz, S. A. (2010). Establishment of a catchment monitoring network through a participatory approach in a rural community in South Africa. Hydrol. Earth Syst. Sci. 14, 2507–2525. doi: 10.5194/hess-14-2507-2010
Krell, N. T., Giroux, S. A., Guido, Z., Hannah, C., Lopus, S. E., Caylor, K. K., et al. (2020). Smallholder farmers' use of mobile phone services in central Kenya. Clim. Dev. 13, 1–13. doi: 10.1080/17565529.2020.1748847
Krhoda, G. O. (1988). The impact of resource utilization on the hydrology of the Mau Hills forest in Kenya. Mount. Res. Dev. 8, 193–200. doi: 10.2307/3673447
Kuhnle, R. A., and Wren, D. G. (2005). “Cross-stream variations in suspended sediment transport over dunes, implications for sampling,” in Proceedings of the Federal Interagency Sediment Monitoring Instrument and Analysis Research Workshop (Flagstaff, AZ: Geological Survey Circular).
Leeuw, T., and Boss, E. (2018). The HydroColor app: above water measurements of remote sensing reflectance and turbidity using a smartphone camera. Sensors 18:256. doi: 10.3390/s18010256
López-Tarazón, J. A., and Estrany, J. (2017). Exploring suspended sediment delivery dynamics of two Mediterranean nested catchments. Hydrol. Proc. 31, 698–715. doi: 10.1002/hyp.11069
Lowry, C. S., and Fienen, M. N. (2013). CrowdHydrology: crowdsourcing hydrologic data and engaging citizen scientists. GroundWater 51, 151–156. doi: 10.1111/j.1745-6584.2012.00956.x
Malthus, T. J., Ohmsen, R., Woerd, H. J., and van der (2020). An evaluation of citizen science smartphone apps for inland water quality assessment. Rem. Sensing 12:1578. doi: 10.3390/rs12101578
Masese, F. O., Mwasi, B. N., Etiegni, L., and Raburu, P. O. (2012a). Effects of Deforestation on Water Resources: Integrating Science and Community Perspectives in the Sondu-Miriu River Basin, Kenya. INTECH Open Access Publisher Available online at: http://cdn.intechopen.com/pdfs-wm/35539.pdf (accessed August 31, 2016).
Masese, F. O., Raburu, P. O., Mwasi, B. N., and Etiegni, L. (2012b). “Effects of deforestation on water resources: integrating science and community perspectives in the Sondu-Miriu River Basin, Kenya,” in New Advances and Contributions to Forestry Research (Rijeka: InTech), 1–18.
Mello, K., de Valente, R. A., Randhir, T. O., dos Santos, A. C. A., and Vettorazzi, C. A. (2018). Effects of land use and land cover on water quality of low-order streams in Southeastern Brazil: Watershed versus riparian zone. CATENA 167, 130–138. doi: 10.1016/j.catena.2018.04.027
Miguel-Chinchilla, L., Heasley, E., Loiselle, S., and Thornhill, I. (2019). Local and landscape influences on turbidity in urban streams: a global approach using citizen scientists. Freshwater Sci. 38, 303–320. doi: 10.1086/703460
Mitchell, A., Brodie, J., and Faithful, J. (2007). Testing simple sediment and nutrient methods for landholder use. ACTFR Report No. 07/06, Townsville, Australia: Australian Centre for Tropical Freshwater Research.
Moor, T. D., Rijpma, A., and López, M. P. (2019). Dynamics of engagement in citizen science: results from the “yes, i do!”-project. Citizen Sci. Theory Practice 4:38. doi: 10.5334/cstp.212
Nadal-Romero, E., Peña-Angulo, D., and Regüés, D. (2018). Rainfall, run-off, and sediment transport dynamics in a humid mountain badland area: long-term results from a small catchment. Hydrol. Proc. 32, 1588–1606. doi: 10.1002/hyp.11495
Nardi, F., Cudennec, C., Abrate, T., Allouch, C., Annis, A., Assumpção, T. H., et al. (2020). Citizens AND HYdrology (CANDHY): conceptualizing a transdisciplinary framework for citizen science addressing hydrological challenges. Hydrol. Sci. J. doi: 10.1080/02626667.2020.1849707
Njue, N., Koech, E., Hitimana, J., and Sirmah, P. (2016). Influence of land use activities on riparian vegetation, soil and water quality: an indicator of biodiversity loss, South West Mau Forest, Kenya. Open J. Forestry 06, 373–385. doi: 10.4236/ojf.2016.65030
Njue, N., Kroese, J. S., Gräf, J., Jacobs, S. R., Weeser, B., Breuer, L., et al. (2019). Citizen science in hydrological monitoring and ecosystem services management: state of the art and future prospects. Sci. Total Environ. 693:133531. doi: 10.1016/j.scitotenv.2019.07.337
Olang, L. O., and Fürst, J. (2011). Effects of land cover change on flood peak discharges and runoff volumes: model estimates for the Nyando River Basin, Kenya. Hydrol. Proc. 25, 80–89. doi: 10.1002/hyp.7821
Olang, L. O., and Kundu, P. M. (2011). Land Degradation of the Mau Forest Complex in Eastern Africa: A Review for Management and Restoration Planning. Available online at: http://etd-library.ku.ac.ke/handle/123456789/11626 (accessed August 29, 2016).
Otuoma, J., Langat, D., Maina, J., Maina, G., Maina, J., and Mwanje, P. (2012). Effects of Watershed Degradation on Hydrological Functions in the Sondu River Catchment IUFRO – FORNESSA Regional Congress, World Agroforestry Centre, Nairobi, Kenya.
Ou, Y., Wang, X., Wang, L., and Rousseau, A. N. (2016). Landscape influences on water quality in riparian buffer zone of drinking water source area, Northern China. Environ. Earth Sci. 75:114. doi: 10.1007/s12665-015-4884-7
Ouellet-Proulx, S., St-Hilaire, A., Courtenay, S. C., and Haralampides, K. A. (2016). Estimation of suspended sediment concentration in the Saint John River using rating curves and a machine learning approach. Hydrol. Sci. J. 61, 1–14. doi: 10.1080/02626667.2015.1051982
Ouma, K. O., Mungai, N. W., Vuai, S. a,. H., and Ibembe, J. D. (2011). “Spatial-temporal variation of nitrogen, phosphorus and sediments in surface runoff and adjacent river system in Sondu-Miriu basin, Kenya,” in Natural Resources Management and Land Use. Proceedings of the Cluster Workshop, Nairobi, Kenya, 30th November - 2nd December 2011, 147–157. Available online at: https://www.cabdirect.org/cabdirect/abstract/20133300843 (accessed July 13, 2017).
Owuor, S. O., Butterbach-Bahl, K., Guzha, A. C., Jacobs, S., Merbold, L., Rufino, M. C., et al. (2018). Conversion of natural forest results in a significant degradation of soil hydraulic properties in the highlands of Kenya. Soil Tillage Res. 176, 36–44. doi: 10.1016/j.still.2017.10.003
Pacheco, F. A. L., Varandas, S. G. P., Sanches Fernandes, L. F., and Valle Junior, R. F. (2014). Soil losses in rural watersheds with environmental land use conflicts. Sci. Total Environ. 485–486, 110–120. doi: 10.1016/j.scitotenv.2014.03.069
Poudel, D. D. (2016). Surface water quality monitoring of an agricultural watershed for nonpoint source pollution control. J. Soil Water Conserv. 71, 310–326. doi: 10.2489/jswc.71.4.310
Raddick, M. J., Bracey, G., Gay, P. L., Lintott, C. J., Murray, P., Schawinski, K., et al. (2009). Galaxy zoo: exploring the motivations of citizen science volunteers. Astronomy Education Review. 9:010103–1 doi: 10.3847/AER2009036
Richards, N., and Syallow, D. (2018). Water resources users associations in the mara basin, kenya: pitfalls and opportunities for community based natural resources management. Front. Environ. Sci. 6:138. doi: 10.3389/fenvs.2018.00138
Rodríguez-Blanco, M. L., Taboada-Castro, M. M., and Taboada-Castro, M. T. (2018). Long-term suspended sediment concentrations and loads from a relatively undisturbed agroforested catchment in the northwest of the Iberian Peninsula. Water 10:1302. doi: 10.3390/w10101302
Rotman, D., Preece, J., Hammock, J., Procita, K., Hansen, D., Parr, C., et al. (2012). “Dynamic changes in motivation in collaborative citizen-science projects,” in Proceedings of the ACM 2012 Conference on Computer Supported Cooperative Work, Washington, USA: Seattle, 217–226. doi: 10.1145/2145204.2145238
Rügner, H., Schwientek, M., Beckingham, B., Kuch, B., and Grathwohl, P. (2013). Turbidity as a proxy for total suspended solids (TSS) and particle facilitated pollutant transport in catchments. Environ. Earth Sci. 69, 373–380. doi: 10.1007/s12665-013-2307-1
Sauermann, H., and Franzoni, C. (2015). Crowd science user contribution patterns and their implications. Proc. Natl. Acad. Sci. U.S.A. 112, 679–684. doi: 10.1073/pnas.1408907112
Scott, A. B., and Frost, P. C. (2017). Monitoring water quality in Toronto's urban stormwater ponds: assessing participation rates and data quality of water sampling by citizen scientists in the FreshWater Watch. Sci. Total Environ. 592, 738–744. doi: 10.1016/j.scitotenv.2017.01.201
Serret, H., Deguines, N., Jang, Y., Lois, G., and Julliard, R. (2019). Data quality and participant engagement in citizen science: comparing two approaches for monitoring pollinators in France and South Korea. Citizen Sci. Theory Practice 4:22. doi: 10.5334/cstp.200
Shirk, J., Ballard, H., Wilderman, C., Phillips, T., Wiggins, A., Jordan, R., et al. (2012). Public participation in scientific research: a framework for deliberate design. Ecol. Soc. 17:229. doi: 10.5751/ES-04705-170229
Shupe, S. M. (2017). High resolution stream water quality assessment in the Vancouver, British Columbia region: a citizen science study. Sci. Total Environ. 603, 745–759. doi: 10.1016/j.scitotenv.2017.02.195
Silvestro, F., Gabellani, S., Giannoni, F., Parodi, A., Rebora, N., Rudari, R., et al. (2012). A hydrological analysis of the 4 November 2011 event in Genoa. Natu. Hazards Earth Syst. Sci. 12, 2743–2752. doi: 10.5194/nhess-12-2743-2012
Smith, P., House, J. I., Bustamante, M., Sobock,á, J., Harper, R., Pan, G., et al. (2016). Global change pressures on soils from land use and management. Global Change Biol. 22, 1008–1028. doi: 10.1111/gcb.13068
Sombroek, W. G., Braun, H. M. H., and Van der Pouw, B. J. A. (1982). Exploratory Soil Map and Agro-Climatic Zone Map of Kenya, 1980. Scale 1: 1,000,000. Nairobi, Kenya: Kenya Soil Survey.
Stenfert Kroese, J., Batista, P. V. G., Jacobs, S. R., Breuer, L., Quinton, J. N., and Rufino, M. C. (2020b). Agricultural land is the main source of stream sediments after conversion of an African montane forest. Sci. Rep. 10:14827. doi: 10.1038/s41598-020-71924-9
Stenfert Kroese, J., Jacobs, S. R., Tych, W., Breuer, L., Quinton, J. N., and Rufino, M. C. (2020a). Tropical montane forest conversion is a critical driver for sediment supply in east african catchments. Water Resour. Res. 56:e2020WR027495. doi: 10.1029/2020WR027495
Stephens, W., Othieno, C. O., and Carr, M. K. V. (1992). Climate and weather variability at the Tea Research Foundation of Kenya. Agricult. Forest Meteor. 61, 219–235. doi: 10.1016/0168-1923(92)90051-5
Swart, R. (2016). Monitoring 40 years of land use change in the Mau forest complex, Kenya: a land use change driver analysis.
Tanaka, M. O., de Souza, A. L. T., Moschini, L. E., and de Oliveira, A. K. (2016). Influence of watershed land use and riparian characteristics on biological indicators of stream water quality in southeastern Brazil. Agricult. Ecosyst. Environ. 216, 333–339. doi: 10.1016/j.agee.2015.10.016
Thatoe Nwe Win, T., Bogaard, T., and van de Giesen, N. (2019). A low-cost water quality monitoring system for the ayeyarwady river in myanmar using a participatory approach. Water 11:1984. doi: 10.3390/w11101984
Thornhill, I., Loiselle, S., Lind, K., and Ophof, D. (2016). The citizen science opportunity for researchers and agencies. BioScience 66, 720–721. doi: 10.1093/biosci/biw089
Tu, J. (2013). Spatial variations in the relationships between land use and water quality across an urbanization gradient in the watersheds of northern Georgia, USA. Environ. Manag. 51, 1–17. doi: 10.1007/s00267-011-9738-9
USGS (2000). Shuttle Radar Topography Mission (SRTM) 1 Arc-Second Global Reston. Virginia: U. S. Geological Survey.
Verschuren, D., Johnson, T. C., Kling, H. J., Edgington, D. N., Leavitt, P. R., Brown, E. T., et al. (2002). History and timing of human impact on Lake Victoria, East Africa. Proc. R. Soc. London B Biol. Sci. 269, 289–294. doi: 10.1098/rspb.2001.1850
Vuai, S. A. H., Ibembe, J. D., and Mungai, N. (2012). Spatial Variation 0f Nutrients in Sondu-Miriu and Simiyu-Duma Rivers: Implication on Sources and Factors Influencing their Transportation into the Lake Victoria. J. Earth Sci. Climate Change 3:2. doi: 10.4172/2157-7617.1000119
Wald, D. M., Longo, J., and Dobell, A. R. (2016). Design principles for engaging and retaining virtual citizen scientists. Conserv. Biol. 30, 562–570. doi: 10.1111/cobi.12627
Walker, D., Forsythe, N., Parkin, G., and Gowing, J. (2016). Filling the observational void: scientific value and quantitative validation of hydrometeorological data from a community-based monitoring programme. J. Hydrol. 538, 713–725. doi: 10.1016/j.jhydrol.2016.04.062
Weeser, B., Gräf, J., Njue, N. K., Cerutti, P., Rufino, M. C., Breuer, L., et al. (2021). Crowdsourced water level monitoring in kenya's sondu-miriu basin—who is “the crowd”?. Front. Earth Sci. 8:602422. doi: 10.3389/feart.2020.602422
Weeser, B., Stenfert Kroese, J., Jacobs, S. R., Njue, N., Kemboi, Z., Ran, A., et al. (2018). Citizen science pioneers in Kenya – A crowdsourced approach for hydrological monitoring. Sci. Total Environ. 631–632, 1590–1599. doi: 10.1016/j.scitotenv.2018.03.130
Wiggins, A., Newman, G., Stevenson, R. D., and Crowston, K. (2011). Mechanisms for data quality and validation in citizen science. in 2011 IEEE Seventh International Conference on e-Science Workshops (IEEE) Stockholm, Sweden, 14–19.
Wilkinson, D. M. (2008). “Strong regularities in online peer production,” in Proceedings of the 9th ACM conference on Electronic Commerce EC '08. (New York, NY, USA: Association for Computing Machinery), 302–309. doi: 10.1145/1386790.1386837
Zhang, Y., Ma, R., Hu, M., Luo, J., Li, J., and Liang, Q. (2017). Combining citizen science and land use data to identify drivers of eutrophication in the Huangpu River system. Sci. Total Environ. 584–585, 651–664. doi: 10.1016/j.scitotenv.2017.01.093
Zheng, H., Hong, Y., Long, D., and Jing, H. (2017). Monitoring surface water quality using social media in the context of citizen science. Hydrol. Earth Syst. Sci. 21, 949–961. doi: 10.5194/hess-21-949-2017
Zhou, M., Brandt, P., Pelster, D., Rufino, M. C., Robinson, T., and Butterbach-Bahl, K. (2014). Regional nitrogen budget of the Lake Victoria Basin, East Africa: syntheses, uncertainties and perspectives. Environ. Res. Lett. 9:105009. doi: 10.1088/1748-9326/9/10/105009
Keywords: catchment, citizen science, suspended sediments, turbidity, Sondu-Miriu river basin, Mau Forest Complex
Citation: Njue N, Gräf J, Weeser B, Rufino MC, Breuer L and Jacobs SR (2021) Monitoring of Suspended Sediments in a Tropical Forested Landscape With Citizen Science. Front. Water 3:656770. doi: 10.3389/frwa.2021.656770
Received: 21 January 2021; Accepted: 18 May 2021;
Published: 11 June 2021.
Edited by:
Alex de Sherbinin, Columbia University, United StatesReviewed by:
Melissa Haeffner, Portland State University, United StatesSiong Fong Sim, Universiti Malaysia Sarawak, Malaysia
Marc Schwientek, University of Tübingen, Germany
Copyright © 2021 Njue, Gräf, Weeser, Rufino, Breuer and Jacobs. This is an open-access article distributed under the terms of the Creative Commons Attribution License (CC BY). The use, distribution or reproduction in other forums is permitted, provided the original author(s) and the copyright owner(s) are credited and that the original publication in this journal is cited, in accordance with accepted academic practice. No use, distribution or reproduction is permitted which does not comply with these terms.
*Correspondence: Suzanne R. Jacobs, c3V6YW5uZS5yLmphY29ic0B6ZXUudW5pLWdpZXNzZW4uZGU=