 Amir H. Kohanpur
 Yu Chen2
 Albert J. Valocchi
- 1Department of Civil and Environmental Engineering, University of Illinois at Urbana-Champaign, Champaign, IL, United States
- 2Los Alamos National Laboratory (DOE), Los Alamos, NM, United States
Direct numerical simulation and pore-network modeling are common approaches to study the physics of two-phase flow through natural rocks. For assessment of the long-term performance of geological sequestration of CO2, it is important to model the full drainage-imbibition cycle to provide an accurate estimate of the trapped CO2. While direct numerical simulation using pore geometry from micro-CT rock images accurately models two-phase flow physics, it is computationally prohibitive for large rock volumes. On the other hand, pore-network modeling on networks extracted from micro-CT rock images is computationally efficient but utilizes simplified physics in idealized geometric pore elements. This study uses the lattice-Boltzmann method for direct numerical simulation of CO2-brine flow in idealized pore elements to develop a new set of pore-level flow models for the pore-body filling and snap-off events in pore-network modeling of imbibition. Lattice-Boltzmann simulations are conducted on typical idealized pore-network configurations, and the interface evolution and local capillary pressure are evaluated to develop modified equations of local threshold capillary pressure of pore elements as a function of shape factor and other geometrical parameters. The modified equations are then incorporated into a quasi-static pore-network flow solver. The modified model is applied on extracted pore-network of sandstone samples, and saturation of residual trapped CO2 is computed for a drainage-imbibition cycle. The modified model yields different statistics of pore-level events compared with the original model; in particular, the occurrence of snap-off in pore-throats is reduced resulting in a more frontal displacement pattern along the main injection direction. Compared to the original model, the modified model is in closer agreement with the residual trapped CO2 obtained from core flow experiments and direct numerical simulation.
1. Introduction
Physics of two-phase flows in natural rocks plays an important role in addressing many current issues in subsurface water and energy resource assessment. In particular, capture and geological storage of carbon dioxide (CO2) in deep saline reservoirs is being studied as a potential technology to reduce emission of greenhouse gases from industrial sources including conventional power plants. Pore-scale modeling is necessary to understand fundamental behavior of CO2-brine flow and obtain macroscopic flow properties needed for field-scale studies using reservoir simulation. Direct numerical simulation (DNS) methods and pore-network (PN) modeling are common approaches to study such flow systems in natural rocks because experimental methodologies are difficult to implement, time-consuming, and expensive. On one hand, DNS solves directly the Navier-Stokes equations from detailed 3D images of rock. Recent advances in X-ray computed tomography (CT) scanning has provided high resolution images needed to reconstruct the 3D pore structure of rock. This non-destructive technology is now able to produce images of pore space and fluids in real rocks at micron resolution for larger rock samples compared to its early days (Andrä et al., 2013; Blunt et al., 2013; Wildenschild and Sheppard, 2013; Schlüter et al., 2014; Bultreys et al., 2016; Balcewicz et al., 2021). On the other hand, PN modeling extracts a simplified network of pore elements from the real geometry of pore spaces and solves the Navier-Stokes equations in the simplified geometry.
Although PN modeling is more computationally efficient compared with DNS due to simplifications of the pore structure and governing flow equations, conventional PN models have some challenges in simulation of imbibition and residual trapping of CO2 where pore filling processes are important (Blunt, 2017). Estimation of residual trapped CO2 is important for assessing the long-term storage capacity and safety of geological sequestration since it impacts the predicted fate and distribution of the CO2 plume in the reservoir. Theoretical and numerical studies in addition to experimental observations have shown that capillary trapping plays a key role in CO2 plume migration (Juanes et al., 2010; MacMinn et al., 2010; Pentland et al., 2011; Krevor et al., 2015; Rasmusson et al., 2018).
CO2-brine flow is usually considered to be capillary-dominated in real-world applications. Therefore, capillary forces determine the interface movement, flow, and trapping throughout the pore space, and hence so-called quasi-static PN models that neglect viscous forces are suitable. In general, if the viscous forces are comparable with the capillary forces, then a dynamic PN model is needed that includes more physics with the added expense of model complexity and computational costs (Joekar-Niasar and Hassanizadeh, 2012). However, quasi-static PN is more computationally efficient and describes pore-level events through the local threshold capillary pressure of pore elements. The competition among these events in CO2-brine flow determines the invasion pattern and saturation of phases. Thus, the accuracy of calculated residual trapping is dependent on the accuracy of the defined pore-level flow models and pre-solved equations of local threshold capillary pressure of events in pore elements.
There are several PN modeling studies on real rock samples that focus on the physics of CO2 and brine flow and residual trapping of CO2. Mahabadi et al. (2020) studied immiscible displacement patterns during drainage with a dynamic PN model by varying capillary number (Ca) and viscosity ratio (M). They also examined the effect of pore-throat size distribution and PN connectivity on a sandy sediment for different sets of Ca and M. Matching their findings with properties of a typical CO2-brine flow system (Ca ≃ 10−5 and M ≃ 10 − 15), the dominant displacement pattern is capillary fingering and CO2 saturation at the end of drainage is roughly 0.50 − 0.60, an important quantity since it is the starting point for simulation of imbibition. Rasmusson et al. (2018) used a quasi-static PN model of CO2-brine flow on Heletz sandstone to investigate the sensitivity of residual trapping of CO2 to several parameters such as advancing contact angle and average connection number (number of pore-throats connected to a pore-body). They found that PNs with higher average connection number, higher advancing contact angle, and lower aspect ratio have smaller amount of trapped CO2. They also obtained the initial-residual saturation curves of CO2 for different drainage-imbibition scenarios. In addition, Hefny et al. (2020) applied quasi-static PN modeling on a highly permeable sandstone from a depleted oil field to study residual trapping of CO2 and obtain characteristic curves during drainage-imbibition cycle. They investigated the effect of initial brine saturation at the reversal point from drainage to imbibition on residual trapping and relative permeabilities. They also found that smaller contact angle values (more brine-wet rock) lead to higher trapped amount of CO2 at the end of imbibition process. These PN modeling studies have mainly used existing pore-level models in conventional PN flow solvers to study residual trapping of CO2. An in-depth investigation of pore-level events in PN modeling of CO2-brine flow can shed light on the physics and prediction of residual trapping of CO2.
Ever since the early generation of two-phase flow PN models, there have been attempts to improve pore-level flow models during drainage and imbibition processes for better understanding of pore-scale displacement and prediction of core-scale properties of interest. Lenormand et al. (1983) first described pore-scale displacement mechanisms during drainage and imbibition from a 2D micromodel experiment. These mechanisms, namely, piston-type, snap-off, and pore-body filling, are widely used in PN flow solvers. For example, Raeini et al. (2018) developed a capillary-dominated PN flow solver that includes the concept of half-throats, several corners in pore elements, and new formulations of pore-level events. The solver was verified experimentally by Bultreys et al. (2020) using measured contact angle and based on the evolution of fluid distributions and flow paths during imbibition.
There are several studies that focus on pore-level events of PN modeling and using DNS for improvement, such as proposing new cross sections of pore elements, flow properties in pore-throats, local capillary pressure relations, corner flow behavior, and so on. Xie et al. (2017) used the lattice-Boltzmann (LB) method, a well-known and widely applied DNS approach, to simulate individual pores with triangular cross section to develop empirical terms to describe viscous coupling in oil-water flow. They incorporated these terms into a quasi-static PN solver that provided a more accurate prediction of relative permeability curves. In another study, Zhao et al. (2020) applied LB for real pore-throat cross sections to modify conductance and local threshold capillary pressure terms in a conventional PN model. Then, they simulated drainage through sandstones using quasi-static PN model to compute flow properties, namely, macroscopic capillary pressure curve, absolute permeability, and relative permeability. Suh et al. (2017) used a morphological analysis technique along with LB simulation on different irregular pore-throat cross sections to establish a correlation between effective shape factor and local capillary pressure. They validated their method by comparing macroscopic capillary pressure with experimental data for the water retention curve. Ruspini et al. (2017) also investigated geometrical features of the pore elements, and introduced a new model of pore-body filling to investigate capillary trapping of non-wetting phase in water-wet rocks. The model incorporated geometrical characteristics of the pore-body, spatial location of connecting filled pore-throats, and wetting properties. They studied residual trapping, imbibition relative permeability, and capillary pressure curves from PN modeling of different sandstone samples.
Other DNS approaches have also been applied on pore elements to improve conventional PN models. Miao et al. (2017) proposed a new description of pore elements to avoid geometry simplifications of conventional PN models by using circularity, convexity, and elongation of voxelized pores. They carried out finite element simulations to obtain single-phase flow conductance and approximate the relationship between pore shape parameters and hydraulic conductance. Shams et al. (2018) incorporated viscous coupling effects into flow conductance of triangular tubes for different wettability conditions with the aid of finite volume simulation. They investigated the flow in the center and corners of a capillary tube and related pore geometry, viscosity ratio, wetting phase saturation, and wettability to the flow conductance term. Tang et al. (2018) carried out volume-of-fluid two-phase flow simulations using the commercial Fluent software on various tube cross sections to investigate the effect of contact angle on meniscus behavior and local capillary pressure in individual pores based on Young-Laplace equation. Thus, DNS methods are capable of improving pore-level events of PN modeling, and can be used in pore-scale modeling of residual trapping of CO2.
In this work, we apply LB simulation as a DNS method on various geometric PN configurations that encompass a small collection of connected pore-bodies and pore-throats, in order to evaluate local threshold capillary pressure during the imbibition process. Then, we propose a modified model of imbibition events. The modified model is then incorporated into a quasi-static PN flow solver that can be applied on extracted PNs from natural rocks (Dong and Blunt, 2009; Raeini et al., 2018) or on larger PNs from upscaling approaches (Aghaei and Piri, 2015; Kohanpur and Valocchi, 2020), thereby resulting in more realistic macroscopic characteristic curves. We apply the modified PN model for two sandstones to evaluate residual trapping in a drainage-imbibition cycle of CO2-brine flow, and compare the results with experimental and DNS data. The goal is to take advantage of the relative strengths of both modeling approaches and combine them into a new set of equations for incorporation into conventional PN models that can provide more physically-based estimates of residual trapping, as well as other continuum properties.
The organization of the rest of this paper is as follows. Section 2 explains the physics of two-phase flow processes for pore-level events in PN modeling. Section 3 discusses the defined PN configurations and the LB and PN simulation methods. In section 4, the main results from LB simulations of pore-body filling and snap-off are discussed (section 4.1). Then, the modified model is presented and incorporated into the quasi-static PN flow model, and applied on real rock samples (section 4.2). Finally, the conclusions are summarized in section 5.
2. Pore-Network Processes
2.1. Drainage and Imbibition
In geological storage of CO2, the pore space of a saline aquifer is initially filled with brine as the wetting phase. Injection of CO2, as the non-wetting phase into the pore space is a drainage process where the macroscopic capillary pressure and overall saturation of CO2 increases. As the macroscopic capillary pressure drops, brine fills the pore space gradually during the imbibition process. Due to wettability, the entire CO2 will not be displaced by the brine and some gets trapped across the pore space at the end of imbibition. This phenomenon is called residual trapping of CO2, which is favorable for long-term CO2 sequestration. In a field-scale CO2 injection operation, the flow rates will decrease away from injection well, and therefore, one can assume capillary forces dominate and drive the flow (Kopp et al., 2009).
In quasi-static PN modeling of drainage and imbibition processes, the macroscopic capillary pressure is gradually changed to control the direction of invasion. On one hand, capillary pressure is increasing incrementally during drainage process which allows non-wetting CO2 to displace the brine in the center of pores through piston-type displacement while brine resides in the corners and crevices. Based on Young-Laplace equation, wider pore-throats are invaded first in drainage followed by invasion of narrower pore-throats.
On the other hand, the imbibition process occurs after the drainage process, which has left residual brine in the corners of pore-bodies and throats due to wettability. Macroscopic capillary pressure decreases incrementally by increasing brine pressure which allows brine to displace CO2 through different displacement events, namely, piston-type displacement, pore-body filling, and snap-off (Lenormand et al., 1983). The occurrence and frequency of these events generally depend on the local capillary pressure in a pore element, the topology of brine and CO2 (connection number and filling), wettability (contact angle), pore irregularity (shape factor), and relative size of pore-body with respect to neighboring pore-throats (aspect ratio).
In the low capillary number condition of CO2-brine flow, the assumption of local capillary equilibrium is valid which relates the curvature of interface in any pore at any time to the local capillary pressure based on the Young-Laplace equation. This assumption is the basis of quantifying the local threshold capillary pressure of different displacement events through the shape of interface in pore elements.
2.2. Pore-Level Events
Piston-type displacement is a common event in both drainage and imbibition processes. In this event, the invading phase displaces the defending phase from the center of pore element. In drainage, if CO2 pressure is high enough (i.e., local capillary pressure passes the threshold) in the pore element, it displaces brine through its terminal meniscus from the center of pore element. Figure 1A shows schematically how CO2 (in white) is advancing through the center of a rectangular tube and pushing brine (in blue). The threshold capillary pressure depends on the wettability and geometry of the pore element through the Young-Laplace equation, which for a circular tube pore element is:
In Equation (1), Pc is the local threshold capillary pressure, σ is interfacial tension, θ is contact angle between phases, and r is the radius of the cross section of the tube. In imbibition, brine displaces CO2 from the center of tube when capillary pressure falls below the threshold. Related equations for rectangular and triangular cross sections are more complex than Equation (1) and can be found in Valvatne (2004).
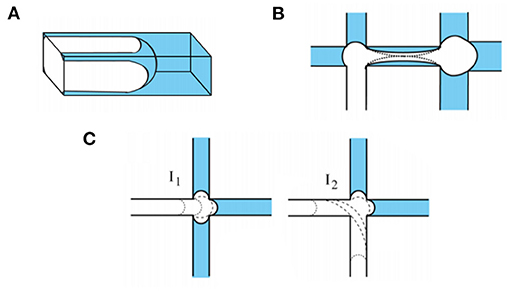
Figure 1. Schematic representation of (A) piston-type displacement during drainage process in a rectangular tube, (B) snap-off in pore-throat during imbibition process, and (C) pore-body filling, I1 and I2 events, during imbibition process. CO2 is shown in white and brine is shown in blue (Images from Rasmusson et al., 2018).
Snap-off is an important pore-level event that usually causes trapping of non-wetting phase. The injected CO2 occupies the center of pore elements at the end of drainage process while brine resides in the corners as connected layers throughout the PN. As the brine pressure increases and the imbibition process starts, these layers swell and increase the CO2 saturation gradually. If the brine layer is not connected to any adjacent brine-filled elements and swelling continues, at some point brine layers from corners meet and create an unstable state. This leads to snap-off where brine spontaneously fills the center of pore element. Snap-off in a pore-throat that does not have adjacent brine-filled elements disconnects CO2 in adjacent pore-bodies which translates into either partial filling or trapping in the following states of the PN, and impacts the distribution of CO2 throughout the PN. Figure 1B shows schematically how the progress of brine layer swelling in a pore-throat can lead to snap-off and cause trapping in the pore-body on the right.
Pore-body filling is another type of imbibition event that occurs in different orders based on connectivity of the non-wetting phase. When the capillary pressure decreases during imbibition, the invading brine starts with filling narrower pore-throats and displacing CO2 to the available adjacent elements, which are pore-bodies filled with CO2. Depending on the connection number of the pore-body and number of CO2-filled adjacent pore-throats, different scenarios of pore-body filling can occur. Figure 1C shows a schematic representation of two scenarios (I1 and I2 events) for a pore-body with connection number of 4. In refers to a pore-body filling where there are n connected pore-throats filled with CO2 that allows an escape path during the invasion of brine into the pore-body. For a pore-body with connection number of zcn, n can be between 0 and zcn − 1.
The important feature of In events is that their local threshold capillary pressure can be different depending on the filling scenario, since the interface curvature during invasion is different. For example in Figure 1C, the I1 event has smaller radius of curvature (i.e., higher capillary pressure) than I2 based on the drawn dash lines referring to the next pore-level steps.
If only a single connected pore-throat is filled with CO2 (I1 event), the displacement process will be similar to piston-type displacement. The complexity of modeling is for higher order events (In, n from 2 to zcn − 1) where the exact location and curvature of the interface in the pore-body is not clear. There are several studies in the literature proposing different parametric models by taking into account geometry-based and statistics-based parameters in the model (Blunt, 1998; Hughes and Blunt, 2000). For example, Blunt (1998) proposed a model based on the generic form of Pc in piston-type displacement and modified it with a parametric term to describe Pc of higher order In events:
In Equation (2), Ai is the model parameter chosen correlated with the inverse of absolute permeability of the PN, and xi is a random number between zero and one. More details on pore-level events during drainage and imbibition processes can be found in Valvatne and Blunt (2004), Blunt et al. (2013), and Blunt (2017).
2.3. Competition of Events
The imbibition process in a PN flow model consists of a series of pore-level events in pore elements based on their local threshold capillary pressure that controls the timing and location of events. These events compete with one another in determining the invasion pattern and distribution of phases during imbibition. Therefore, the prediction of CO2 distribution and trapping is highly dependent on the specific occurrences of these events. A change in the local threshold capillary pressure causes change in the order of displacement events which leads to a different pattern of phases, relative permeability, and residual trapping.
The topology of the brine phase also matters to determine the type of event during imbibition. If the adjacent element has brine at its center, the piston-type or pore-body filling would occur if the local threshold capillary pressure is already reached. Snap-off, however, does not require adjacent filled elements since it starts with swelling of brine in corners which is assumed present throughout the PN.
Geometrical and topological parameters of a PN play an important role in the equations of local threshold capillary pressure, and hence, competition of pore-level events during imbibition and residual trapping of CO2. Some of these key PN parameters are as following:
• Shape factor: This summarizes the irregularities of the pores into one parameter in pore elements. The half-angle values of a triangular pore element can be obtained based on the shape factor (Patzek and Silin, 2000). These half-angle values are involved in the local threshold capillary pressure (Pc) relations of different pore events. In this study, different defined shape factors of the cross section are considered to evaluate the effect of shape factor on imbibition pore-level events.
• Aspect ratio: The aspect ratio of a pore-body is the ratio of its radius to the radius of its connected pore-throats (a = rp/rt). This parameter can also be expressed using average radius of multiple connected pore-throats to a pore-body. The competition of threshold Pc of pore-body filling and snap-off events is correlated with aspect ratio. This competition can be quantified by the ratio of their threshold Pc (Blunt, 2017). Generally, higher aspect ratio values results in more snap-off events compared with pore-body filling events. In this study, typical aspect ratio values from extracted PNs of natural rocks are used to define PN configurations.
• Connection number: The number of connected pore-throats to a pore-body is its connection number. It can be averaged across all pore-bodies of the PN as the average connection number of network that represents the connectivity of porous medium. Although connection number is not explicitly used in threshold Pc relations, it is also correlated with trapping of CO2. Higher connectivity generally implies more potential pore-throats for the CO2 to escape from the invaded pore-bodies during imbibition process.
3. Methodology
3.1. Pore-Network Configurations
We aim to apply DNS of two-phase flow using the LB code developed by Chen et al. (2018) on pore elements of PNs extracted from natural rocks to assess the physical assumptions used for pore-level events during imbibition. Therefore, the geometry of simulations consists of typical pore-bodies and pore-throats of extracted PNs with sufficient grid resolution to capture the interface and corner flow. We define a PN configuration as a small number of interconnected pore-throats and pore-bodies that is designed for investigation of pore-level events in the pore element of interest. We limit this study to two common types of PN configurations due to computational costs of LB simulations:
• PTP configuration: This refers to a pore-throat connecting two adjacent pore-bodies. The pore-throat is the focus of this configuration to investigate corner flow, piston-type displacement, or snap-off. The pore-bodies can be connected to inlet and outlet reservoirs of non-wetting and wetting fluids or additional pore elements. We study the PTP configuration to capture the interface in the cross section of the pore-throat and find the threshold Pc right before snap-off occurs.
• TPT configuration: This refers to a pore-body defined between two or more connecting pore-throats. The pore-throats can be directly connected to the inlet and outlet reservoirs or other pore-bodies. The pore-body is the focus of this configuration to investigate the filling process via different number of pore-throats and simulate pore-body filling during imbibition.
Conventional quasi-static PN models can use pore elements with different cross sections; triangle, square, circle are considered here as they are commonly used. The shape factor (G) is a dimensionless geometrical parameter that is used in assigning familiar geometries to the cross section of a tube-shape pore element (Patzek and Silin, 2000). It is defined as:
In Equation (3), A is the cross-sectional area, V is the volume, and L is the length of the tube-shape pore element with an arbitrary cross section. Our experience from studying extracted PNs of various sandstone cores shows that the triangular cross section comprises the majority of pore elements of PNs. Shape factor of triangular elements can vary in a range from 0 (slit-shape) to 0.0481 (equilateral).
In this study, we select three shape factor values equal to 0.020, 0.030, 0.040 for the designed PN configurations to represent a reasonable range, while limiting the number of required LB simulations. These three shape factor values represent three different triangular cross sections which are characterized by their corner half-angles (β1, β2, β3). We use an algorithm introduced by Patzek and Silin (2000) to determine three corner half-angles of each shape factor G to define triangular cross sections of pore elements. The resulting β's (with the convention of β1 < β2 < β3) for each shape factor are as following:
• G = 0.020: , , and .
• G = 0.030: , , and .
• G = 0.040: , , and .
As discussed in section 2.2, pore-body filling event can occur in different scenarios depending on the number of adjacent CO2-filled pore elements. These scenarios can be defined with different TPT configurations based on the number of connecting pore-throats to the pore-body of configuration, which will be addressed in section 4.1.1.
3.2. Lattice-Boltzmann Method
The lattice-Boltzmann (LB) method is used for DNS for the idealized pore element geometry noted above. Use of LB for DNS on voxelized pore geometry is now well established, and its popularity is due to its favorable computational features (Ahrenholz et al., 2008; Chen et al., 2019). The LB is a so-called mesoscopic method that can simulate fluid mass and momentum balance. The fluid is represented by particles with probability of moving in different directions along a predefined lattice. The LB method is based on streaming and collision of a set of fluid particle distribution functions (PDF) on a lattice. The no-slip boundary conditions on solid surfaces are implemented by simply switching the directions of the particles on the surface nodes, the so-called bounce-back scheme. Among several LB schemes for simulating multiphase flows, the color-fluid model (Gunstensen et al., 1991; Grunau et al., 1993) is capable of producing a relatively sharp interface between immiscible phases and capturing their interface evolution. The color-fluid model is also able to incorporate high viscosity ratios due to its independent control of the surface tension and viscosity which makes it quite relevant to CO2-brine flow system where viscosity ratio is about 10–15. On the other hand, it has limitations on the density ratio and a large absolute value of color gradient may produce numerical instabilities (Ramstad et al., 2019).
We use a variant of the multiple relaxation time (MRT) color-fluid LB simulator (Tölke, 2002; Tölke et al., 2006; Chen et al., 2018). In this model, each phase has its own set of PDFs and the discrete Boltzmann equation is solved for each phase. We consider two sets of the D3Q19 PDFs, i.e., a 3D model with 19 velocities, representing the two fluid phases, referred to as the fluids r (CO2) and b (brine), which follow the collision-streaming procedure for the PDF:
In Equation (4), is the standard LB collision operator, is the perturbation step that generates the surface tension effect, and is the recoloring step that separates the two fluids. The collision operators and are constructed under the MRT framework that increases stability and accuracy of the model (d'Humieres, 2002; Tölke et al., 2006). The macroscopic quantities of flow, such as fluid velocity and pressure, are computed by calculating the moments of the PDFs. More details of our in-house code are given by Chen et al. (2018).
In the present work, we carry out LB simulations of CO2-brine flow system on idealized PN configurations. The fluid properties and flow conditions are listed in Table 1, which are realistic for CO2-brine flow and similar parameters used in Kohanpur et al. (2020), except for the contact angle which comes from an experimental study by Dalton et al. (2018). We simulate the drainage process followed by the imbibition process with inlet velocity and outlet pressure boundary conditions. More details on implementation of boundary conditions can be found in Chen et al. (2019).
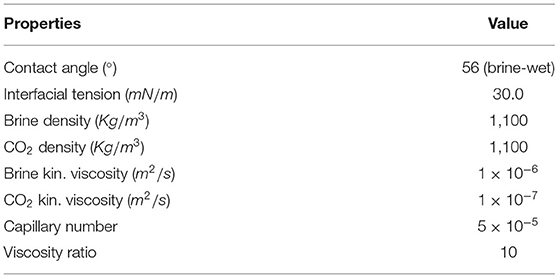
Table 1. Properties of CO2-brine flow system.
Th capillary number is defined as the ratio of viscous forces over capillary forces () where μnw is dynamic viscosity of CO2, V is the average inlet velocity, and σ is the interfacial tension between CO2 and brine. For the LB simulations, capillary number equal to 5 × 10⁻⁵ is used, which is relatively small to guarantee a capillary-dominated flow consistent with field injection conditions and the assumptions of the quasi-static PN model. Unfortunately, even smaller values of capillary number can be computationally expensive to reach steady-state with potential numerical instabilities and spurious velocities in LB simulation.
3.3. Quasi-Static Pore-Network Model
The quasi-static PN flow simulation is an efficient tool to characterize CO2-brine flow properties. As noted previously, for field-scale carbon capture and storage (CCS), the velocity is low (with the exception of a local region near the injection well) and hence the capillary number is relatively small, justifying the assumption of capillary-dominated flow and use of a quasi-static PN model. In this work, we conduct drainage and imbibition simulations using the publicly available PN flow codes of Valvatne and Blunt (2004) and Raeini et al. (2018). We incorporate modified equations for imbibition pore-level events (which are presented in sections 4.1.1 and 4.1.2) into the PN flow solver of Raeini et al. (2018), which is then applied to extracted PNs from real rock images to obtain residual trapping of CO2 and other quantities of interest during the drainage-imbibition process. The detailed procedure of the PN flow solver is described in Valvatne (2004) and Raeini (2013).
4. Results
4.1. Lattice-Boltzmann Simulation
The PN configuration types listed in section 3.1 are used as the geometry of LB simulations where each voxel of the image is converted to a lattice unit. It is standard practice in LB simulation to use dimensionless parameters normalized with lattice units and then convert to physical units when needed. A lattice unit can be either pore (0-value) or wall (1-value), and the set of PDFs of each phase is computed. At each stage of the LB drainage and imbibition simulations, the fluid-fluid interface location and the local capillary pressure need to be computed. The interface location can be distinguished with the order parameter (ϕ) in the color-fluid LB model:
In Equation (5), ρr and ρb are fluid densities of red and blue fluids in lattice unit, respectively. The density of each phase is computed by the zeroth moment of the respective PDFs. Therefore, ϕ ≈ 1 refers to the presence of red fluid (CO2) while ϕ ≈ −1 represents the presence of blue fluid (brine) (Chen et al., 2018). The location of interface is where ϕ ≈ 0. in the color-fluid LB model the fluid interface is diffuse and spread over several lattice units, but if fine grids are used then a relatively sharp interface results. In practice, we use the cut-off of 5% for ϕ to specify the location of each fluid.
In order to evaluate local capillary pressure in pore elements, one should compute average pressure of each phase in the pore volume. In the color-fluid LB method, the ideal gas equation-of-state is assumed which allows calculation of fluid pressure from the density. The order parameter is used to detect the location of phases and the interface. To compute the pressure of the pure red and blue fluid phases, lattice points should be far enough away from where the order parameter is close to zero. The pressure of red and blue fluids can be averaged based on the total density of the respective fluid of a calculation volume (e.g., pore-body).
In Equations 6 and 7, the summation is over the lattice points of a defined calculation volume with nr and nb lattice units of red and blue fluids, respectively. Thus, the local capillary pressure (Pc) in the calculation volume can be obtained using the difference in the average pressure of fluids.
In Equation (8), Pc is the calculated average local capillary pressure within the calculation volume of interest.
This procedure to calculate the local capillary pressure is validated on a simple piston-type displacement in a cylindrical tube, as illustrated in Figure 2A, where boundary conditions of velocity (inlet) and constant pressure (outlet) are implemented, and CO2 (shown in red) moves upward and displaces brine (transparent) in the tube. We use the resulting density of fluids to obtain the pressure distribution in each fluid to calculate the local capillary pressure during the filling process. The calculation volume is marked with two green planes. Figure 2B shows a cross-sectional view through the center of the tube. The radius of interface (r′) can be captured and used in the Young-Laplace equation to evaluate local capillary pressure, which is denoted the cross-sectional approach. This approach can be utilized in simple geometries and is preferred wherever the radius of interface can be captured. However, this is not always the case for 3D LB simulations on more complex PN configurations such as for pore-body filling events in triangular elements where the interface can have a 3D complex shape. In such cases, the LB density-based approach can be used to evaluate Pc.
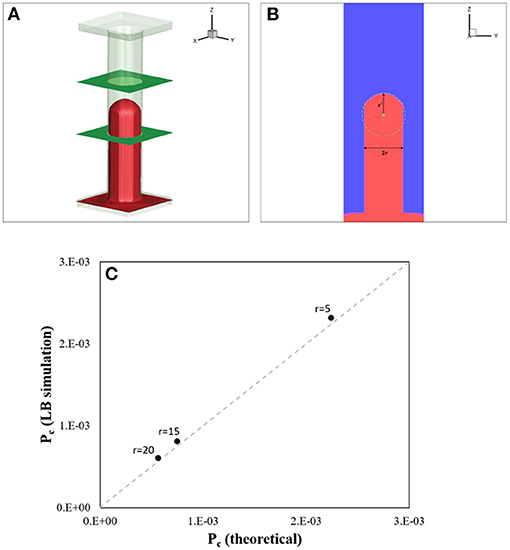
Figure 2. A validation of LB simulation on a simple piston-type displacement in a cylindrical tube for calculation of local capillary pressure: (A) CO2 is in red, brine is transparent, and the green planes define the bounds of calculation volume. (B) Cross-sectional view parallel to yz-plane through the center of tube to capture the radius of interface. (C) Comparison of calculated Pc from LB simulation and theoretical Pc from Young-Laplace equation on different radii of a cylindrical tube.
In Figure 2C, the resulting Pc from LB simulation of the simple piston-type displacement in a cylindrical tube is calculated and compared with the theoretical values based on Young-Laplace equation for different radii (r = 5, r = 15, r = 20 in lattice units). The results show a good agreement (less than 10% error), thereby giving us confidence in the procedure for calculation of Pc based on the order parameter and densities in lattice unit is feasible in 3D LB simulations.
In following sections 4.1.1 and 4.1.2, we present the LB simulation results on PN configurations plus the modified models of pore-body filling and snap-off events during imbibition process that will be incorporated in quasi-static PN flow solver.
4.1.1. Simulation of Pore-Body Filling
Three different TPT configurations with different shape factors but equal radius of inscribed circle and connection number of 4, shown in Figure 3, are studied to model the I1, I2, and I3 pore-body filling events during imbibition. Based on our experience, the average connection number of PNs from various rock samples is usually within the range of 3–5. Therefore, the choice of connection number of 4 is reasonable. In addition, having 4 connecting pore-throats allows us to include pore-body filling events up to order 3. As explained in section 2.2, lower orders of pore-body filling have higher threshold Pc and are hence more favorable than higher order pore-body filling (I4+) during imbibition. The higher orders of pore-body filling usually have a small number of occurrences and are hence less important with respect to trapping of non-wetting phase. Thus, we focus on lower orders of pore-body filling in the LB simulations and investigate key factors in the filling process such as shape factor and corner half-angles.
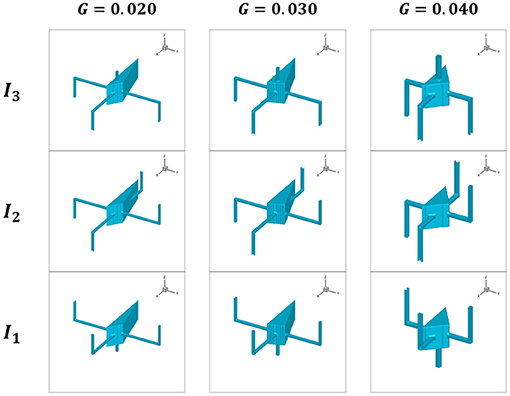
Figure 3. Pore-body filling configurations for the three studied shape factors G = 0.020, G = 0.030, and G = 0.040 during I1, I2, and I3 events.
The cross section of the pore-body is defined as a triangle with three different shape factors with their corresponding corner half-angles. The cross section of pore-throats in all cases is square to reduce the complexity and ensure a simultaneous invasion from different connecting pore-throats across different configurations. This is achieved by designing configurations in a way that all pore-throats have the same cross section and path length from the inlet or outlet reservoirs to the pore-body, as depicted in Figure 3. An example of such a configuration is illustrated from different views in Figure 4A, which is designed for modeling I1 event with G = 0.040 for the pore-body. The inscribed radii of all pore-throats are equal and the geometric aspect ratio between pore-body and pore-throat is 5 in all configurations.
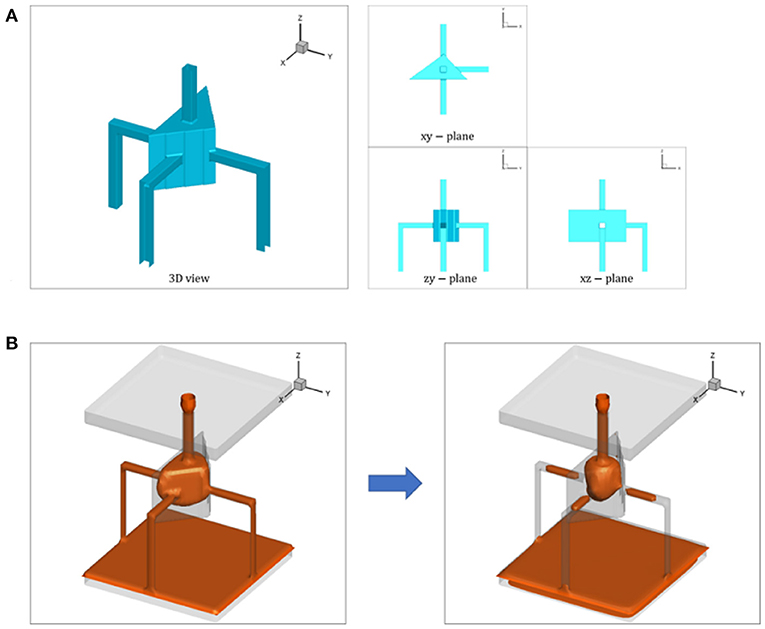
Figure 4. Pore-body filling configuration for the shape factor of G = 0.040 designed for modeling I1 event: (A) The equal length and cross section of pore-throats provide the desired simultaneous invasion. (B) LB simulation of pore-body filling during drainage (left) and imbibition (right) processes. CO2 is shown in red and brine is transparent.
In LB flow simulation of these configurations, the inlet reservoir is connected to bottom pore-throats and the outlet reservoir is connected to top pore-throats, and the flow is always in +z (upward) direction. Initially, drainage is simulated which results in CO2 occupying the center of pore elements until steady-state saturation. Then, brine is injected from the same inlet reservoir to displace the CO2 from the pore-body. The boundary conditions in both drainage and imbibition are prescribed velocity at the inlet and fixed pressure for the outlet. Figure 4B shows an example of LB simulation of pore-body filling during drainage and imbibition processes on a triangular TPT configuration, shown in Figure 4A, with the shape factor of G = 0.040 during I1 event.
Since the pore-body filling event is a dynamic process, we can track the saturation of CO2 in the pore-body in order to specify the relevant time step for the evaluation of threshold Pc. We choose the saturation of 0.50, when half of the CO2 is displaced, as the time step to calculate the threshold Pc, using the procedure described earlier. The procedure is applied on all configuration of Figure 3 and the corresponding Pc is computed. The normalized capillary pressure in a pore-body () is defined as:
In Equation (9), rp is the inscribed radius of pore-body and σ is the surface tension. This definition makes the analysis more straightforward since the conversion from lattice unit to physical unit is not necessary.
Based upon the LB simulations, we propose modifying the conventional models (e.g., Valvatne and Blunt, 2004) for the local threshold capillary pressure of pore-body filling event with some new parameters as:
In Equation (10), the subscript i refers to the order of pore-body filling event. Cfi is defined as the filling factor that comes from the analysis of LB simulations of PN configurations. is defined as effective aspect ratio of the pore-body which is similar to the classic definition of geometric aspect ratio but it considers just the invading pore-throats rather than all connecting ones. Therefore, can be a function of the filling event and it involves the radius of invading pore-throat during the pore-body filling event. The second term on the right hand side of Equation (10) is the main difference between our proposed model and conventional model. For example, Valvatne and Blunt (2004) chose a term proportional to K−1/2 where K is the absolute permeability of PN. We consider the effective aspect ratio and shape factor to include the effect of the order of pore-body filling event and pore-body shape factor on local threshold capillary pressure, which will result in a different filling factor.
In order to use this modified model, one needs to know Cfi for different orders of filling events for different pore-body shape factors. We consider Cf1 = 0 the same as in conventional models. In order to evaluate Cf2 and Cf3, we define the ratio of of events with respect to as:
If we combine Equations (10–12), the filling factors can be described as:
Therefore, by having of different events from LB simulation, one can compute the corresponding fi1 and use Equations (13) and (14) to obtain the filling factors of the modified model.
Table 2 presents the resulting normalized local capillary pressure of pore-body filling events (I1, I2, I3) for the studied shape factors. The is used to calculate the capillary pressure ratio (fi1) and the filling factor (Cfi), as listed in Table 2 as well. The resulting fi1 from the modified model is slightly higher than conventional model which translates into higher local threshold capillary pressure that makes pore-body filling event more favorable during imbibition process.
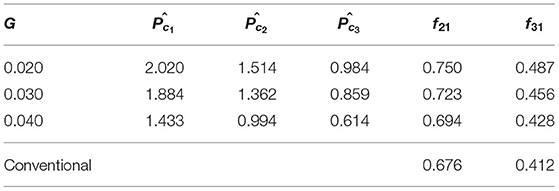
Table 2. The resulting normalized local capillary pressure () and filling capillary pressure ratios (fi1) defined in the modified pore-body filling model from LB simulations on PN configurations.
The results in Table 2 are used to describe the filling factor as a function of shape factor and incorporate it into a quasi-static PN flow solver where pore-body filling events of I2 and I3 are modified with Equation (10), accordingly.
4.1.2. Simulation of Snap-Off
Three different shape factors, G = 0.020, G = 0.030, G = 0.040, with triangular cross sections in a PTP configuration, as shown in Figure 5A, are studied to investigate the threshold Pc during snap-off events. In each configuration, ratios involvolving the diameter and length of pore-body and pore-throat are defined as lt/2rt = 10 and rp/rt = 5. The focus is the cross section of the center of the pore-throat. We first perform a drainage simulation with receding contact angle (10°) followed by imbibition with advancing contact angle (60°). These values are based on Morrow's contact angle hysteresis model (Morrow, 1975) for intrinsic contact angle of 56° that comes from an experimental CO2-brine flow study by Dalton et al. (2018) on a Berea sandstone sample. The model relates the intrinsic contact angle to receding and advancing ones. The boundaries are connected to bounding pore-bodies and a pressure-driven flow is implemented in the LB simulation.
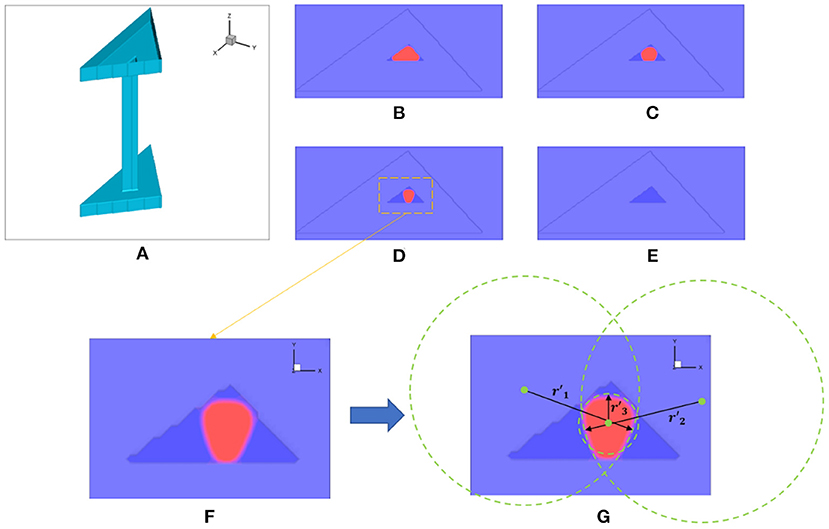
Figure 5. (A) PTP configuration with G = 0.040 defined for assessing the snap-off event in pore-throat. Evolution of cross section of a pore-throat with G = 0.040 from LB simulation during snap-off event: (B) beginning of imbibition, (C) moving the interface toward the center, (D) before snap-off, (E) and after snap-off. (F) Higher resolution of pore-throat cross section before snap-off. (G) Cross-sectional approach in evaluation of capillary pressure based on the radius of curvature of three corners.
We use the local threshold capillary pressure of a snap-off event in a similar format to conventional snap-off models, but with a new correction factor:
In Equation (15), Ci is defined as the snap-off factor and is defined similar to Equation (9) (rp replaced with rt). In conventional models (Valvatne and Blunt, 2004), Ci can be described in terms corner half-angles:
In Equation (16), β1 and β2 are defined as the two smaller corner half-angles of a triangular cross section (Patzek and Silin, 2000).
However, we carry out LB simulation for different shape factors to find Ci as a function of G. The drainage invasion of CO2 into the PTP configurations is implemented first. Then, the gradual imbibition of brine is implemented via an incremental increase of brine pressure. This allows the brine in corners to expand gradually prior to snap-off in the pore-throat, as shown in the pore-throat cross section in Figures 5B–E.
A cross-sectional analysis is applied on the results from LB simulation to obtain the radius of curvature in each corner, as illustrated in Figures 5F,G, during the snap-off event. The minimum radius among the three is substituted into the Young-Laplace equation () to evaluate the local threshold capillary pressure of the pore-throat:
In Equation (17), refers to the calculated radius of curvature in each corner of the pore-throat, as shown in Figure 5G. On the other hand, by defining the local capillary pressure of snap-off in the form of Equation (15), one can relate the correction factor of Ci to the radius of curvature r′ from LB simulation results:
In Equation (18), rt refers to the inscribed radius of the pore-throat (a purely geometrical parameter) while r′ refers to the minimum radius of curvature of the interface right before the snap-off event in the pore-throat (determined from LB simulation results).
Table 3 presents the resulting snap-off factors from LB simulation on PTP configurations for the three studied shape factors. The snap-off factors from modified model are slightly smaller than factors from conventional model for all studied shape factors. This results in higher local threshold capillary pressure for snap-off events in the modified model as well. Although only three shape factors are considered, covering a range from 0.020 to 0.040 with linear interpolation used to fill in, based on our experience with different types of rock samples, this range of shape factor is sufficient to include the majority of both pore-bodies and pore-throats across various PNs of different samples.
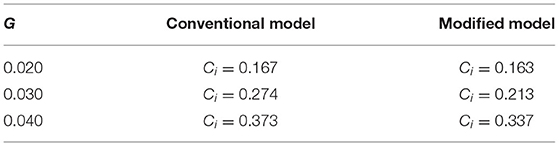
Table 3. The resulting snap-off factor (Ci) as a function of shape factor from LB simulations on PTP configurations compared with the conventional model.
4.2. Modified Pore-Network Modeling Results
4.2.1. Rock Sample and Extracted Pore-Network
In this section, two natural rock samples of Berea sandstone and Mt. Simon sandstone are selected to investigate residual trapping of CO2 after a drainage-imbibition cycle. The former sample was the focus of an experimental study of measurement of contact angle between CO2 and brine by Dalton et al. (2018). The latter sample was the focus of a rock characterization study and CO2-brine flow simulation with different modeling approaches by Kohanpur et al. (2020). The core plugs of both samples were scanned at the micro-CT imaging facility at the National Energy Technology Laboratory (NETL) which produced a series of grayscale scans. These scans are processed through several steps of image processing in Fiji (Schindelin et al., 2012) to filter and smooth images in order to distinguish existing image phases (solid, pores, CO2, brine) from each other via thresholding algorithms. Table 4 presents relevant information for the studied sandstone samples. We report flow simulation results from the Berea sandstone sample, shown in Figure 6A, in detail here. For brevity, the results from the Mt. Simon sandstone sample are presented in the Supplementary Material.
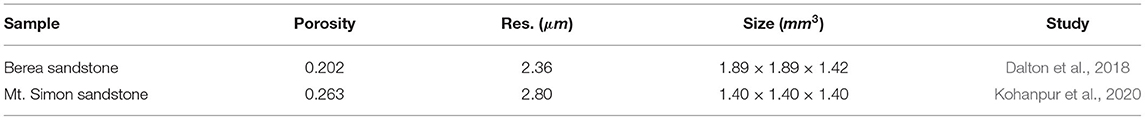
Table 4. Selected samples for pore-network modeling of CO2-brine flow after a drainage-imbibition cycle.
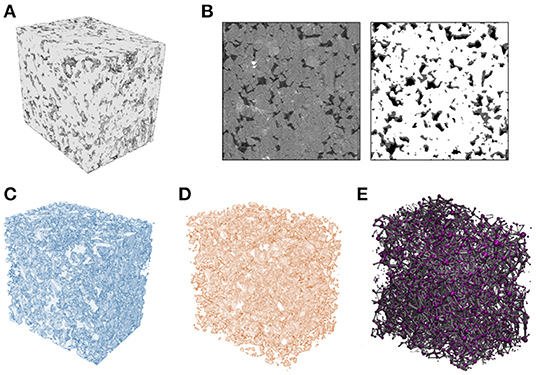
Figure 6. (A) 3D representation of the Berea sandstone sample. (B) A slice of micro-CT images: left image is the raw grayscale slice and right image is the ternary segmented slice where solid part is in white, CO2 is in black, and brine is in gray. (C) 3D representation of the pore structure. (D) 3D representation of residual trapped CO2 after imbibition process. (E) Extracted pore-network of the Berea sandstone sample from maximal-ball algorithm.
Dalton et al. (2018) used a fractional flow experimental apparatus to perform a drainage-imbibition cycle of CO2-brine flow on the Berea sandstone sample. They scanned post-imbibition micro-CT images to measure residual CO2. Figure 6B shows an example of post-imbibition grayscale image and its corresponding segmented image which consists of three phases: solid in white, CO2 in black, brine in gray. This is obtained by a ternary segmentation implemented in Fiji, which entails two sequential binary segmentation on dry scans and post-imbibition scans, respectively, in order to obtain their differences and extract the distribution of CO2.
Figure 6C shows the 3D representation of the pore structure, and Figure 6D shows the residual trapped CO2 after imbibition in the Berea sandstone sample. Saturation of residual of trapped CO2 is equal to the ratio of the number of CO2 voxels in Figure 6D to the number of pore voxels in Figure 6C. The resulting experimental residual CO2 saturation after imbibition is 0.331 for the Berea sandstone sample based on this processing of the micro-CT images.
Dalton et al. (2018) also provided the distribution of contact angle by using measurements on the captured interface from 2D micro-CT images. The contact angle average (55.9°) and standard deviation (15.5°) come from measurement on 40 different 2D micro-CT images located in different parts of the core. More details can be found in Dalton et al. (2018). The average value of 55.9° is used as the contact angle in our LB and PN simulations.
We use the PN extraction code based on Maximal Ball (MB) algorithm from Dong and Blunt (2009) and Raeini et al. (2017) to obtain corresponding PNs of the rock images. The algorithm was originally introduced by Silin and Patzek (2006) where the entire 3D voxelized pore space is searched to find the largest possible voxelized spheres, known as MBs. This PN extraction tool can provide the inherent randomness of pore structure in real rocks with a wide range of connection numbers for pore-bodies. More details of this PN extraction tool can be found in Dong and Blunt (2009). The output of this code is geometrical and topological information of pore-bodies and pore-throats including the location, radius, volume, length, total length, and shape factor. Figure 6E shows extracted PN of the Berea sandstone sample. This PN has 6207 pore-bodies and 10160 pore-throats with the average connection number of 3.18. The computed absolute permeability of the PN is 455 mD using the Valvatne and Blunt (2004) PN flow solver.
As mentioned earlier, the shape factor (Equation 3) in PN models is a metric of irregularities of the pore space of pore elements. Figure 7 shows the shape factor distribution of pore-bodies (left plot) and pore-throats (right plot) in the extracted PN of the Berea sandstone sample. The distribution in both follows approximately a normal distribution with the average of 0.0298 and 0.0312 and standard deviation of 0.0078 and 0.0064 for pore-bodies and pore-throats, respectively. Therefore, these distributions justify the selected values of shape factors in PN configurations studied in section 3.1.
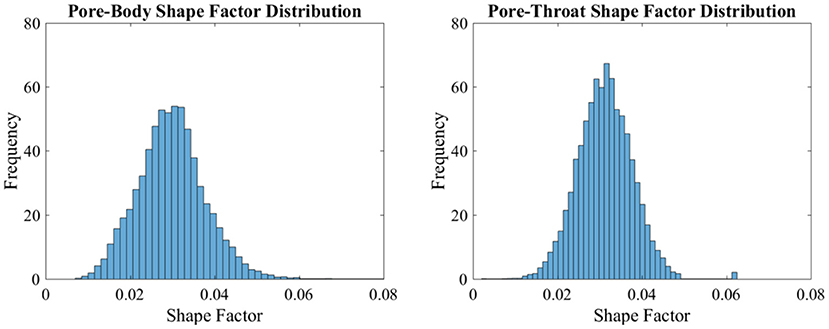
Figure 7. Shape factor distribution of pore elements in the extracted pore-network of Berea sandstone sample: (left) pore-body shape factor distribution, (right) pore-throat shape factor distribution.
Next, we present detailed results from the CO2-brine flow simulation with properties listed in Table 1. We use a modified PN flow solver that is based on Raeini et al. (2018) but with its imbibition threshold Pc equations of pore-body filling and snap-off events replaced with the new pore-level models described in sections 4.1.1 and 4.1.2. Then, the outputs from the modified PN flow solver are compared with those from the original PN flow solver that uses conventional models, and the predicted residual trapped CO2 are compared with the experimental value from Dalton et al. (2018). Results for residual trapping of CO2 after a drainage-imbibition cycle are discussed in section 4.2.2, and the statistics of pore-level events during imbibition are investigated in section 4.2.3.
4.2.2. Residual Trapping
In quasi-static PN flow simulation, the saturation at the end point of the drainage process is needed as the start point of the imbibition process. The resulting saturation of trapped non-wetting phase at the end of imbibition follows a hysteretic behavior that depends on the initial saturation in the imbibition process. Therefore, the PN flow solver can be used to compute a so-called trapping curve that gives residual trapped CO2 as a function of the initial CO2 saturation at the start of imbibition; this is similar to Land's initial-residual trapping model (Land, 1968).
In Figure 8, the residual trapping curve of CO2-brine flow for the Berea sandstone sample is compared between the original and modified PN models. When the initial CO2 saturation is higher, the resulting residual saturation of CO2 is about 0.48 for the original PN model and 0.44 for the modified PN model. However, this difference is negligible when the initial CO2 saturation is smaller. In both models, a full drainage process leaves a relatively small saturation of brine (i.e., more CO2) in the PN, mainly in corners and small or isolated pore elements. Figure 8 shows that a full drainage process is followed by an imbibition process with more trapped CO2. On the other hand, for smaller values of initial CO2 saturation, the resulting residual saturation of CO2 decreases i.e., less trapping of CO2 which is consistent with experimental observations (Niu et al., 2015).
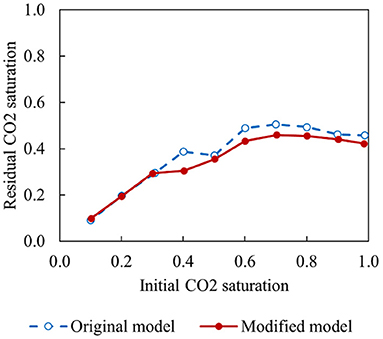
Figure 8. Residual trapping curve from pore-network modeling of CO2-brine flow on the Berea sandstone sample.
Unfortunately the experimental study of Dalton et al. (2018) did not report the saturation at the drainage end point. Therefore, in order to choose a proper drainage end point for the Berea sandstone sample, we perform LB simulation of drainage on the full rock image. In addition, imbibition is also simulated to obtain a DNS prediction of residual trapped CO2 for comparison with the experimental value and prediction from PN flow simulation.
The LB simulations of drainage and imbibition on the 3D rock images were conducted with contact angle of 55.9° and capillary number of 5 × 10⁻⁶ to obtain the saturation at the end of drainage and residual trapped CO2 at the end of imbibition. Figure 9 shows the resulting distribution of CO2 at the end of drainage and imbibition processes. The corresponding CO2 saturation at the end of these processes are and , respectively. We therefore use as the end point of drainage in the PN flow solver. Then, we simulate imbibition to estimate residual CO2 saturation from PN and compare the result with the LB result: .
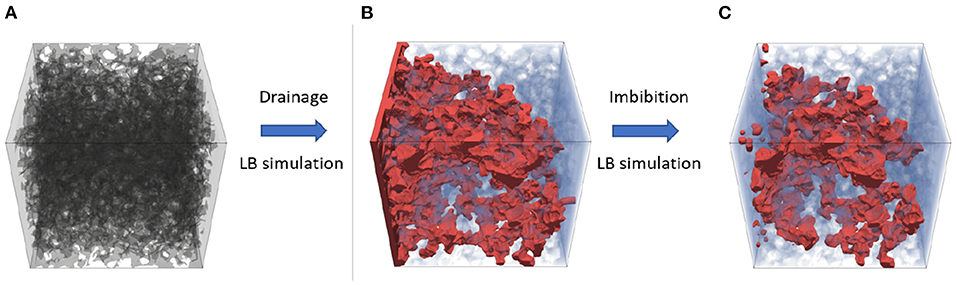
Figure 9. LB simulations of drainage and imbibition processes on the Berea sandstone sample to obtain end point saturations. (A) pore space of the sample (B) end of drainage process (C) end of imbibition process. CO2 is shown in red. Brine is not rendered.
The resulting residual trapping of CO2 after imbibition is presented in Table 5 where the modified PN model is compared with the original PN model. The residual saturation of CO2 is also compared with an experimental value based on analysis of volume ratio of CO2 in micro-CT images rendered in Figure 6D. The modified model predicts residual saturation of trapped CO2 in excellent agreement with the experimental value while the error from the original model is about 27%.
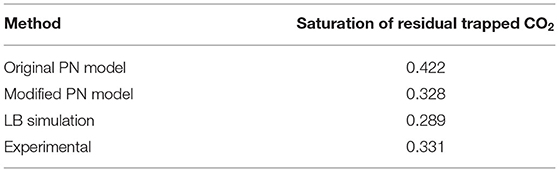
Table 5. Comparison of the original and modified pore-network flow models on the Berea sandstone sample based on predicted saturation of residual trapping of CO2 after a drainage-imbibition cycle.
4.2.3. Statistics of Pore-Level Events
In each step of imbibition process, piston-type displacement, pore-body filling, and snap-off occur in pore elements of the PN. These pore-level events determine the invasion pattern and residual trapping during imbibition. The saturation of residual trapped CO2 is the summation of trapped CO2 saturation in all pore elements of PN. One approach to study the effect of changes in the model is to track the frequency and statistics of pore-level events on the same PN. The cumulative statistics of these events for the original and modified PN model during imbibition steps on the Berea sandstone sample are presented in Figure 10. As seen from the results, the modified model predicts higher number of pore-body filling events (14.8% more) and piston-type displacement in pore-throats (17.2% more). On the hand, it predicts a smaller number of snap-off events compare to the original model (9.6% less). Snap-off event is the mechanism that contributes the most to trapping since it disconnects CO2 in adjacent pore-bodies and leads to isolated trapped CO2 bubbles in the PN. Thus, the decrease in number of snap-off events in the modified model for this sample is expected to result in less trapping of CO2 and smaller saturation of residual trapped CO2.
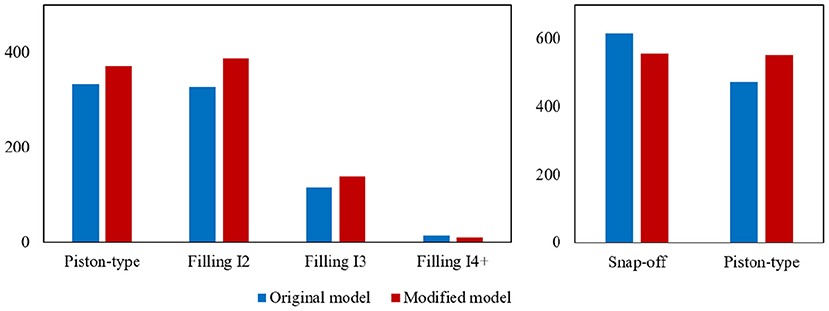
Figure 10. Statistics of number of pore-level events during imbibition process in pore-bodies (left) pore-throats (right) of the Berea sandstone sample.
In terms of invasion pattern, this can translate into a more frontal pattern due to more piston-type displacements in the modified model, which implies less chance of trapping CO2. This is also in agreement with reported residual saturation in Table 5. Thus, the modified model outperforms the original model and predicts residual trapping in better agreement with the experimental and LB simulation predictions.
In the Mt. Simon sandstone sample (see Supplementary Material), the modified model also predicts that the residual trapped CO2 is closer to the reference value, which is from LB simulation, than the original model. However, the discrepancy between PN modeling and LB predictions are about 20%. This can be due to higher heterogeneity of pore structure in the Mt. Simon sandstone sample compare to the Berea sandstone sample.
It is worth mentioning that different statistics of pore-level events results in a different invasion pattern that corresponds to different average flow rates across the PN. This means that the modified PN solver gives different relative permeability values at each saturation point. The relative permeability curves of CO2-brine flow on the studied Berea sandstone sample are reported in details in Kohanpur (2020). Therefore, use of the modified PN method would yield different relative permeability curves for CO2 and brine in a field-scale simulator which would lead to different long-term movement and storage of CO2 in a reservoir.
5. Summary and Conclusions
The pore-scale physics of CO2-brine flow plays a key role for predicting the amount and fate of residual trapped CO2 in geological storage of CO2 in deep saline reservoirs. The description of this flow system in the form of pore-level flow models through pore-bodies and pore-throats of an extracted PN from micro-CT images of real rock is a practical approach to obtain important pore-scale properties during a drainage-imbibition cycle. However, this description can be improved by more specific and accurate relations for CO2-brine flow that can be derived from DNS methods. This study presented a new set of pore-level flow models during pore-body filling and snap-off events of the imbibition process in PN modeling of CO2-brine flow. LB simulations were carried out on several typical idealized PN configurations and the local capillary pressure was evaluated to develop modified equations for local threshold capillary pressure of pore elements as a function of shape factor. We also defined effective aspect ratio of pore-body filling as a new parameter in the modified model, which was not proposed in other models in the literature.
The modified equations of local threshold capillary pressure were incorporated into a widely available quasi-static PN flow solver. This modified model resulted a new pattern of invasion during imbibition due to a different order of competing pore-level events compare to the original model. We applied the modified model on extracted PNs of Berea and Mt. Simon sandstone samples to obtain saturation of residual trapped CO2 after a drainage-imbibition cycle. The statistics of pore-level imbibition events changed by replacing the original model with the modified model. The occurrence of snap-off in pore-throats was reduced which means a more frontal displacement pattern across the sample. As a result, our modified model was in closer agreement than the original model based on the comparison of the residual trapped CO2 with reference data from experimental and LB simulation approaches.
Additional future work could include comparing predicted residual trapping of CO2 with other experimental data or high resolution DNS methods. Also, the effect of lattice resolution and capillary number in LB simulations of PN configurations requires further study. This may lead to some changes in the proposed modified model such as new values for factors reported in Tables 2, 3. A preliminary study is discussed in Kohanpur (2020) on one shape factor and can be extended to more shape factors and other PN configurations.
Finally, we note that the core idea of this study was to combine DNS with PN to improve the physical representation of key pore-level events, while preserving the computational efficient of quasi-static PN. In this work, we focused on pore-body filling and snap-off events which have an important impact on residual trapping of CO2. This framework can be applied to improve estimation of other quantities of interest such as relative permeability and effective diffusion.
Data Availability Statement
The raw data supporting the conclusions of this article will be made available by the authors, without undue reservation.
Author Contributions
All authors listed have made a substantial, direct, and intellectual contribution to the work and approved it for publication.
Funding
This work was supported by the Center for Geologic Storage of CO2, an Energy Frontier Research Center funded by the U.S. Department of Energy (DOE), Office of Science, Basic Energy Sciences (BES), under Award # DE-SC0C12504. Simulations for this research are part of the Blue Waters sustained-petascale computing project, which is supported by the National Science Foundation (awards OCI-0725070 and ACI-1238993) the State of Illinois, and as of December 2019, the National Geospatial-Intelligence Agency. Blue Waters is a joint effort of the University of Illinois at Urbana-Champaign and its National Center for Supercomputing Applications.
Conflict of Interest
The authors declare that the research was conducted in the absence of any commercial or financial relationships that could be construed as a potential conflict of interest.
Publisher's Note
All claims expressed in this article are solely those of the authors and do not necessarily represent those of their affiliated organizations, or those of the publisher, the editors and the reviewers. Any product that may be evaluated in this article, or claim that may be made by its manufacturer, is not guaranteed or endorsed by the publisher.
Supplementary Material
The Supplementary Material for this article can be found online at: https://www.frontiersin.org/articles/10.3389/frwa.2021.710160/full#supplementary-material
References
Aghaei, A., and Piri, M. (2015). Direct pore-to-core up-scaling of displacement processes: dynamic pore network modeling and experimentation. J. Hydrol. 522, 488–509. doi: 10.1016/j.jhydrol.2015.01.004
Ahrenholz, B., Tölke, J., Lehmann, P., Peters, A., Kaestner, A., Krafczyk, M., et al. (2008). Prediction of capillary hysteresis in a porous material using lattice-boltzmann methods and comparison to experimental data and a morphological pore network model. Adv. Water Resour. 31, 1151–1173. doi: 10.1016/j.advwatres.2008.03.009
Andrä, H., Combaret, N., Dvorkin, J., Glatt, E., Han, J., Kabel, M., et al. (2013). Digital rock physics benchmarks–part i: Imaging and segmentation. Comput. Geosci. 50, 25–32. doi: 10.1016/j.cageo.2012.09.005
Balcewicz, M., Siegert, M., Gurris, M., Ruf, M., Krach, D., Steeb, H., et al. (2021). Digital rock physics: a geological driven workflow for the segmentation of anisotropic ruhr sandstone. Front. Earth Sci. 9:493. doi: 10.3389/feart.2021.673753
Blunt, M. J. (1998). Physically-based network modeling of multiphase flow in intermediate-wet porous media. J. Petrol. Sci. Eng. 20, 117–125. doi: 10.1016/S0920-4105(98)00010-2
Blunt, M. J. (2017). Multiphase Flow in Permeable Media: A Pore-Scale Perspective. Cambridge, MA: Cambridge University Press.
Blunt, M. J., Bijeljic, B., Dong, H., Gharbi, O., Iglauer, S., Mostaghimi, P., et al. (2013). Pore-scale imaging and modelling. Adv. Water Resour. 51, 197–216. doi: 10.1016/j.advwatres.2012.03.003
Bultreys, T., De Boever, W., and Cnudde, V. (2016). Imaging and image-based fluid transport modeling at the pore scale in geological materials: a practical introduction to the current state-of-the-art. Earth Sci. Rev. 155, 93–128. doi: 10.1016/j.earscirev.2016.02.001
Bultreys, T., Singh, K., Raeini, A. Q., Ruspini, L. C., Øren, P.-E., Berg, S., et al. (2020). Verifying pore network models of imbibition in rocks using time-resolved synchrotron imaging. Water Resour. Res. 56, e2019WR026587. doi: 10.1029/2019WR026587
Chen, Y., Li, Y., Valocchi, A. J., and Christensen, K. T. (2018). Lattice boltzmann simulations of liquid CO2 displacing water in a 2D heterogeneous micromodel at reservoir pressure conditions. J. Contam. Hydrol. 212, 14–27. doi: 10.1016/j.jconhyd.2017.09.005
Chen, Y., Valocchi, A. J., Kang, Q., and Viswanathan, H. S. (2019). Inertial effects during the process of supercritical CO2 displacing brine in a sandstone: lattice boltzmann simulations based on the continuum-surface-force and geometrical wetting models. Water Resour. Res. 55, 11144–11165. doi: 10.1029/2019WR025746
Dalton, L. E., Klise, K. A., Fuchs, S., Crandall, D., and Goodman, A. (2018). Methods to measure contact angles in scco2-brine-sandstone systems. Adv Water Resour. 122, 278–290. doi: 10.1016/j.advwatres.2018.10.020
d'Humieres, D. (2002). Multiple-relaxation-time lattice boltzmann models in three dimensions. Philos. Trans. R. Soc. Lond. A 360, 437–451. doi: 10.1098/rsta.2001.0955
Dong, H., and Blunt, M. J. (2009). Pore-network extraction from micro-computerized-tomography images. Phys. Rev. E 80, 036307. doi: 10.1103/PhysRevE.80.036307
Grunau, D., Chen, S., and Eggert, K. (1993). A lattice boltzmann model for multiphase fluid flows. Phys. Fluids A 5, 2557–2562. doi: 10.1063/1.858769
Gunstensen, A. K., Rothman, D. H., Zaleski, S., and Zanetti, G. (1991). Lattice boltzmann model of immiscible fluids. Phys. Rev. A 43, 4320. doi: 10.1103/PhysRevA.43.4320
Hefny, M., Qin, C., Saar, M. O., and Ebigbo, A. (2020). Synchrotron-based pore-network modeling of two-phase flow in nubian sandstone and implications for capillary trapping of carbon dioxide. arXiv preprint arXiv:2004.06792. doi: 10.1016/j.ijggc.2020.103164
Hughes, R. G., and Blunt, M. J. (2000). Pore scale modeling of rate effects in imbibition. Trans. Porous Media 40, 295–322. doi: 10.1023/A:1006629019153
Joekar-Niasar, V., and Hassanizadeh, S. (2012). Analysis of fundamentals of two-phase flow in porous media using dynamic pore-network models: a review. Crit. Rev. Environ. Sci. Technol. 42, 1895–1976. doi: 10.1080/10643389.2011.574101
Juanes, R., MacMinn, C. W., and Szulczewski, M. L. (2010). The footprint of the CO2 plume during carbon dioxide storage in saline aquifers: storage efficiency for capillary trapping at the basin scale. Trans. Porous Media 82, 19–30. doi: 10.1007/s11242-009-9420-3
Kohanpur, A. H. (2020). Improving capabilities of pore-scale modeling of multiphase flow for geological storage of 2. (Ph.D. thesis). University of Illinois at Urbana-Champaign.
Kohanpur, A. H., Rahromostaqim, M., Valocchi, A. J., and Sahimi, M. (2020). Two-phase flow of CO2-brine in a heterogeneous sandstone: characterization of the rock and comparison of the lattice-boltzmann, pore-network, and direct numerical simulation methods. Adv. Water Resour. 135, 103469. doi: 10.1016/j.advwatres.2019.103469
Kohanpur, A. H., and Valocchi, A. J. (2020). Pore-network stitching method: a pore-to-core upscaling approach for multiphase flow. Trans. Porous Media 135, 659–685. doi: 10.1007/s11242-020-01491-0
Kopp, A., Class, H., and Helmig, R. (2009). Investigations on co2 storage capacity in saline aquifers: Part 1. dimensional analysis of flow processes and reservoir characteristics. Int.J. Greenhouse Gas Control 3, 263–276. doi: 10.1016/j.ijggc.2008.10.002
Krevor, S., Blunt, M. J., Benson, S. M., Pentland, C. H., Reynolds, C., Al-Menhali, A., et al. (2015). Capillary trapping for geologic carbon dioxide storage-from pore scale physics to field scale implications. Int. J. Greenhouse Gas Control 40, 221–237. doi: 10.1016/j.ijggc.2015.04.006
Land, C. S. (1968). Calculation of imbibition relative permeability for two-and three-phase flow from rock properties. Soc. Petrol. Eng. J. 8, 149–156. doi: 10.2118/1942-PA
Lenormand, R., Zarcone, C., and Sarr, A. (1983). Mechanisms of the displacement of one fluid by another in a network of capillary ducts. J. Fluid Mech. 135, 337–353. doi: 10.1017/S0022112083003110
MacMinn, C. W., Szulczewski, M. L., and Juanes, R. (2010). Co2 migration in saline aquifers. part 1. capillary trapping under slope and groundwater flow. J. Fluid Mech. 662, 329-351. doi: 10.1017/S0022112010003319
Mahabadi, N., van Paassen, L., Battiato, I., Yun, T. S., Choo, H., and Jang, J. (2020). Impact of pore-scale characteristics on immiscible fluid displacement. Geofluids 2020:5759023. doi: 10.1155/2020/5759023
Miao, X., Gerke, K. M., and Sizonenko, T. O. (2017). A new way to parameterize hydraulic conductances of pore elements: a step towards creating pore-networks without pore shape simplifications. Adv. Water Resour. 105, 162–172. doi: 10.1016/j.advwatres.2017.04.021
Morrow, N. R. (1975). The effects of surface roughness on contact: angle with special reference to petroleum recovery. J. Can. Petrol. Technol. 14, 42–53. doi: 10.2118/75-04-04
Niu, B., Al-Menhali, A., and Krevor, S. C. (2015). The impact of reservoir conditions on the residual trapping of carbon dioxide in berea sandstone. Water Resour. Res. 51, 2009–2029. doi: 10.1002/2014WR016441
Patzek, T. W., and Silin, D. B. (2000). Shape factor and hydraulic conductance in noncircular capillaries. i. one-phase creeping flow. J. Colloid Interface Sci. 236, 295–304. doi: 10.1006/jcis.2000.7413
Pentland, C. H., El-Maghraby, R., Iglauer, S., and Blunt, M. J. (2011). Measurements of the capillary trapping of super-critical carbon dioxide in berea sandstone. Geophys. Res. Lett. 38:L06401. doi: 10.1029/2011GL046683
Raeini, A. Q. (2013). Modelling multiphase flow through micro-CT images of the pore space (Ph.D. thesis). Imperial College London.
Raeini, A. Q., Bijeljic, B., and Blunt, M. J. (2017). Generalized network modeling: network extraction as a coarse-scale discretization of the void space of porous media. Phys. Rev. E 96, 013312. doi: 10.1103/PhysRevE.96.013312
Raeini, A. Q., Bijeljic, B., and Blunt, M. J. (2018). Generalized network modeling of capillary-dominated two-phase flow. Phys. Rev. E 97, 023308. doi: 10.1103/PhysRevE.97.023308
Ramstad, T., Berg, C. F., and Thompson, K. (2019). Pore-scale simulations of single-and two-phase flow in porous media: approaches and applications. Trans. Porous Media 130, 77–104. doi: 10.1007/s11242-019-01289-9
Rasmusson, K., Rasmusson, M., Tsang, Y., Benson, S., Hingerl, F., Fagerlund, F., et al. (2018). Residual trapping of carbon dioxide during geological storage–insight gained through a pore-network modeling approach. Int. J. Greenhouse Gas Control 74, 62–78. doi: 10.1016/j.ijggc.2018.04.021
Ruspini, L., Farokhpoor, R., and Øren, P. (2017). Pore-scale modeling of capillary trapping in water-wet porous media: a new cooperative pore-body filling model. Adv. Water Resour. 108, 1–14. doi: 10.1016/j.advwatres.2017.07.008
Schindelin, J., Arganda-Carreras, I., Frise, E., Kaynig, V., Longair, M., Pietzsch, T., et al. (2012). Fiji: an open-source platform for biological-image analysis. Nat. Methods 9, 676–682. doi: 10.1038/nmeth.2019
Schlüter, S., Sheppard, A., Brown, K., and Wildenschild, D. (2014). Image processing of multiphase images obtained via x-ray microtomography: a review. Water Resour. Res. 50, 3615–3639. doi: 10.1002/2014WR015256
Shams, M., Raeini, A. Q., Blunt, M. J., and Bijeljic, B. (2018). A study to investigate viscous coupling effects on the hydraulic conductance of fluid layers in two-phase flow at the pore level. J. Colloid Interface Sci. 522, 299–310. doi: 10.1016/j.jcis.2018.03.028
Silin, D., and Patzek, T. (2006). Pore space morphology analysis using maximal inscribed spheres. Physica A 371, 336–360. doi: 10.1016/j.physa.2006.04.048
Suh, H. S., Kang, D. H., Jang, J., Kim, K. Y., and Yun, T. S. (2017). Capillary pressure at irregularly shaped pore throats: Implications for water retention characteristics. Adv. Water Resour. 110, 51–58. doi: 10.1016/j.advwatres.2017.09.025
Tang, Y., Min, J., Zhang, X., and Liu, G. (2018). Meniscus behaviors and capillary pressures in capillary channels having various cross-sectional geometries. Chin. J. Chem. Eng. 26, 2014–2022. doi: 10.1016/j.cjche.2018.04.031
Tölke, J. (2002). Lattice boltzmann simulations of binary fluid flow through porous media. Philos. Trans. R. Soc. Lond. A 360, 535–545. doi: 10.1098/rsta.2001.0944
Tölke, J., Freudiger, S., and Krafczyk, M. (2006). An adaptive scheme using hierarchical grids for lattice boltzmann multi-phase flow simulations. Comput. Fluids 35, 820–830. doi: 10.1016/j.compfluid.2005.08.010
Valvatne, P. H. (2004). Predictive pore-scale modelling of multiphase flow (Ph.D. thesis). Department of Earth Science and Engineering, Imperial College London London.
Valvatne, P. H., and Blunt, M. J. (2004). Predictive pore-scale modeling of two-phase flow in mixed wet media. Water Resou.r Res. 40:W07406. doi: 10.1029/2003WR002627
Wildenschild, D., and Sheppard, A. P. (2013). X-ray imaging and analysis techniques for quantifying pore-scale structure and processes in subsurface porous medium systems. Adv. Water Resour. 51, 217–246. doi: 10.1016/j.advwatres.2012.07.018
Xie, C., Raeini, A. Q., Wang, Y., Blunt, M. J., and Wang, M. (2017). An improved pore-network model including viscous coupling effects using direct simulation by the lattice boltzmann method. Adv. Water Resour. 100, 26–34. doi: 10.1016/j.advwatres.2016.11.017
Keywords: pore-network (PN) modeling, lattice-boltzmann, residual trapping, CO2 storage and sequestration, pore-scale modeling
Citation: Kohanpur AH, Chen Y and Valocchi AJ (2022) Using Direct Numerical Simulation of Pore-Level Events to Improve Pore-Network Models for Prediction of Residual Trapping of CO2. Front. Water 3:710160. doi: 10.3389/frwa.2021.710160
Received: 15 May 2021; Accepted: 07 December 2021;
Published: 04 January 2022.
Edited by:
Anna L. Herring, The Australian National University, AustraliaReviewed by:
Zhe Li, Australian National University, AustraliaMarcio Carvalho, Pontifical Catholic University of Rio de Janeiro, Brazil
Nicole Vorhauer-Huget, Otto von Guericke University Magdeburg, Germany
Copyright © 2022 Kohanpur, Chen and Valocchi. This is an open-access article distributed under the terms of the Creative Commons Attribution License (CC BY). The use, distribution or reproduction in other forums is permitted, provided the original author(s) and the copyright owner(s) are credited and that the original publication in this journal is cited, in accordance with accepted academic practice. No use, distribution or reproduction is permitted which does not comply with these terms.
*Correspondence: Amir H. Kohanpur, a29oYW5wdTJAaWxsaW5vaXMuZWR1; Albert J. Valocchi, dmFsb2NjaGlAaWxsaW5vaXMuZWR1