 Andrew Roseboro
 Maria Nariné Torres
 Zhenduo Zhu
 Alan J. Rabideau1,2
- 1Department of Civil, Structural and Environmental Engineering, University at Buffalo, Buffalo, NY, United States
- 2Research and Education in Energy, Environment and Water Institute, University at Buffalo, Buffalo, NY, United States
Combined sewer overflows (CSOs) release pollutants collected in urban runoff into local waterways, impacting both aquatic life and human health. The impact of climate change on precipitation may result in an increase in the frequency and magnitude of heavy precipitation events, with a corresponding increase in CSO discharges. The installation of Green Infrastructure (GI) such as Porous Pavements (PP) is a resilient approach to mitigate CSO events. However, an understanding of the impact of climate change on CSO events and the effectiveness of GI practices is crucial for designing sustainable urban stormwater management systems. Using the Storm Water Management Model (SWMM), the performance of PP as a CSO abatement strategy was studied for the city of Buffalo, New York, USA. This paper used the Intensity-Duration-Frequency (IDF) curves for current (1970–1999) and future (2070–2099) design rainfall scenarios, with four rainfall durations (1, 6, 12, and 24 hours) and four return periods (2, 10, 50, and 100 years). The simulation results show that (1) current 100-year events generate CSO volumes similar to predicted 50-year events; (2) CSO volumes could increase by 11–73% in 2070–2099 compared to 1970–1999 when no GI intervention is performed; and (3) the installation of PP can reduce 2–31% of future CSO volume. This case study demonstrates the regional CSO challenges posed by climate change and supports the use of GI as a mitigation strategy.
Introduction
Land cover change from its natural state to impervious surfaces resulting from urbanization introduces an array of disturbances to the hydrological cycle (Saier, 2007). Impervious surfaces, such as concrete or asphalt, prevent infiltration, encourage urban runoff, preclude natural groundwater recharge, and increase the occurrence of flash flooding (WMO and GWP, 2008; Huong and Pathirana, 2013), among other negative impacts. To protect city dwellers from the alterations to the hydrological cycle and its consequences (i.e., flooding and exposure to pollutants such as viruses, chemicals, and suspended solids carried by runoff), sewer systems collect and convey stormwater away from cities (USEPA, 2014). A very common type of sewer system in old urban areas is the combined sewer system (CSS), a network of pipes that collects both stormwater and wastewater and expels excess untreated water volumes into nearby water bodies. These discharges, known as combined sewer overflows (CSOs), transport washed-off atmospheric and urban surface pollutants along with the debris buildup in the CSS during dry weather periods and cause multiple adverse effects (e.g., WMO and GWP, 2008; Botturi et al., 2020).
In the USA, the Environmental Protection Agency (EPA) provides guidance to municipalities on managing CSO discharges and complying with the National Pollutant Discharge Elimination System (NDPES) through a CSO Control Policy. This CSO Control Policy details methods for handling discharge violations, including regular maintenance of the sewer system, prohibiting CSOs during dry weather, and requiring local long-term control plans (LTCPs). With control targets in place, the municipality must research alternatives for reducing the impact of CSOs to water quality and include climate change uncertainties in their LTCPs (NYSDEC, 2021).
Green stormwater infrastructure (hereinafter referred to as green infrastructure, GI) has become a popular method for mitigating the hydrological impacts of urbanization and climate change (Alves et al., 2016; Joshi et al., 2021). GI practices, also often referred to as Best Management Practices and Sustainable Urban Drainage Systems (SUDS) (see Fletcher et al., 2015 for a terminology discussion), such as rain barrels, green roofs, porous pavements, etc., are known for being a cost-effective alternative to the traditional means of stormwater management, especially when considering its co-benefits (USEPA, 2014). It is well-accepted that GI plays a key role in promoting climate change resilience when implemented strategically in an urban area (Shirgira et al., 2019). GI abates stormwater issues in extreme precipitation events by capturing and temporarily storing runoff volumes, reducing the volume and number of CSOs, and promoting flood prevention (Foster et al., 2011). Previous studies have also been conducted on the implementation and effectiveness of GI under non-extreme precipitation events. Ghodsi et al. (2021) modeled GI in a typical year in Buffalo, New York, USA (precipitation levels within 5% of a 78-year average), resulting in up to a 24% reduction in CSO volume from residential rain barrel and commercial cistern implementation. A simulation of GI (bioretention and green roofs) in an urban catchment in Salt Lake City, Utah, USA, resulted in a 35%, 45%, and 43% reduction in surface runoff from the baseline in dry, average, and wet years, respectively (Feng et al., 2016). Webber et al. (2020) evaluated runoff reduction performance across multiple rainfall scenarios and found that more intense rainfall events (associated with a lower probability of occurrence) make GI interventions less effective in surface runoff reduction.
Porous pavements (PP) work well on large, uneven surfaces like streets and parking lots, but parking lots are generally preferred due to lighter traffic (Woods-Ballard et al., 2007). PP can also improve water quality by filtering contaminants before they reach surrounding waterbodies, prevents ponding of rainwater, and improves snow and ice melting (Buffalo Sewer Authority, 2018). Therefore, we selected PP for this case study. Previous studies have analyzed PP and other forms of GI and their impact on reducing runoff or CSO events. Alyaseri and Zhou (2016) tested three forms of PP (permeable concrete, permeable asphalt, and permeable pavers) in St. Louis, Missouri and found a reduction in runoff of 36%, 13%, and 46%, respectively. The test study area covered an area of 2.9 acres and the flow of stormwater was measured and recorded manually. In the Upper Qing catchment in Beijing, China, Randall et al. (2019) modeled a combination of green roofs, rain gardens, and PP. These GI had the potential to increase the ratio of captured annual rainfall volume from 60 to 82%.
Many studies have focused on the effects of climate change and growing urban infrastructure on CSOs. Nie et al. (2009) found, in their case study of the Veumdalen Catchment in Fredrikstad (Norway), a larger number of flooding events and total volume flooding from manholes, surcharging sewer nodes, basement flooding, and an increased CSO volume resulting from heavier precipitation due to climate change. Tavakol-Davani et al. (2016) found in an analysis of a Toledo, Ohio (USA) watershed that climate change will increase CSO frequency, volume, and duration by 18%, 12%, 17%, respectively. Salerno et al. (2018) found in their case study for the Lambro Basin in northern Italy that total phosphorus loading levels from CSOs would double if urban imperiousness increased 20% and their climate change scenarios for rainfall intensity were realized.
Because climate change introduces uncertainties and challenges to stormwater management, long-term plans must consider local precipitation scenarios and their likelihood of occurrence to build resilient urban drainage systems. The effects of climate change are local and change in severity for different latitudes of the globe making previous studies hardly generalizable or transferrable. As a result, local strategies to increase the resiliency to climate change must be derived from site-specific studies assessing how the urban drainage and its future expansions (i.e., projected sewer system expansions and GI features) will respond to future precipitation events.
This study quantifies and compares CSO volumes under current and future storms for the city of Buffalo, NY. This work uses the best available representation of the city of Buffalo drainage system and focuses on the performance of PP as a CSO abatement strategy under climate change scenarios. To do so, PP implementation in all parking lots of the city and climate change scenarios are simulated to (1) estimate the efficiency of these structures in controlling CSO and (2) shed light on how the climate change issue can be addressed by resilient GI approach using PP.
Methodology
This study analyzes CSO volumes for the city of Buffalo for two timeframes: the 1970–1999 period (a representation of the current condition) and the projected 2070–2099 period. The event-based rainfalls were modeled in SWMM and included four storm durations (1, 6, 12, and 24 hours) and four return periods (2, 10, 50, and 100 years). The precipitation events were designed with the Intensity-Duration-Frequency (IDF) curves built by Cornell University's Northeast Regional Climate Center (NRCC) (Degaetano and Castellano, 2017), using the Chicago method (Keifer and Chu, 1957).
Study Area
The Buffalo Sewer Authority (BSA) of the city of Buffalo manages collecting and treating wastewater and CSOs. The city has 53 CSO outfalls and approximately 1,368 km of sewer lines, of which 1,271 km (93%) are combined sewers. During the last years, the BSA has deployed GI structures throughout the city area, including PP, rain barrels, downspouts disconnections, and vacant land restoration, with notable results (Buffalo Sewer Authority, 2018). For example, the city replaced 16 acres of asphalt and concrete with planters and porous materials, preventing 7.2 thousand cubic meters of runoff from entering the sewer system during a typical rainfall event (Buffalo Sewer Authority, 2018).
The city of Buffalo's previous work with GI is best described in the BSA's Raincheck program (Buffalo Sewer Authority, 2018, 2019). The advancement toward GI has been progressive and increasingly committed to public engagement, encouraging voluntary GI installation, initiating fees for impervious surface construction, and improving education on the benefits of GI (Buffalo Sewer Authority, 2019). Currently, the city counts on a Long Term Control Plan and a GI Master Plan for CSO discharges abatement, which includes site analysis for potential GI installation sites and the prioritization of five CSO outfalls and sewer basins for GI retrofitting (Buffalo Sewer Authority, 2018).
The City of Buffalo Urban Hydrologic Model
Storm Water Management Model (SWMM) is widely utilized in research applications to simulate the rainfall-runoff process and the behavior of GI features (e.g., Macro et al., 2019; Yang et al., 2020). An urban hydrologic model for the city of Buffalo has been developed by Arcadis on behalf of the Buffalo Sewer Authority using SWMM (Arcadis, 2018). The city of Buffalo SWMM model provides a detailed representation of the city's drainage system, including 9,201 conduits, 59,796 sub-catchments, and 53 CSO outfalls (see Figure 1). The model was calibrated and validated using measured flow data at 112 flow meters for the period of September 2016 to June 2017 (Arcadis, 2018).
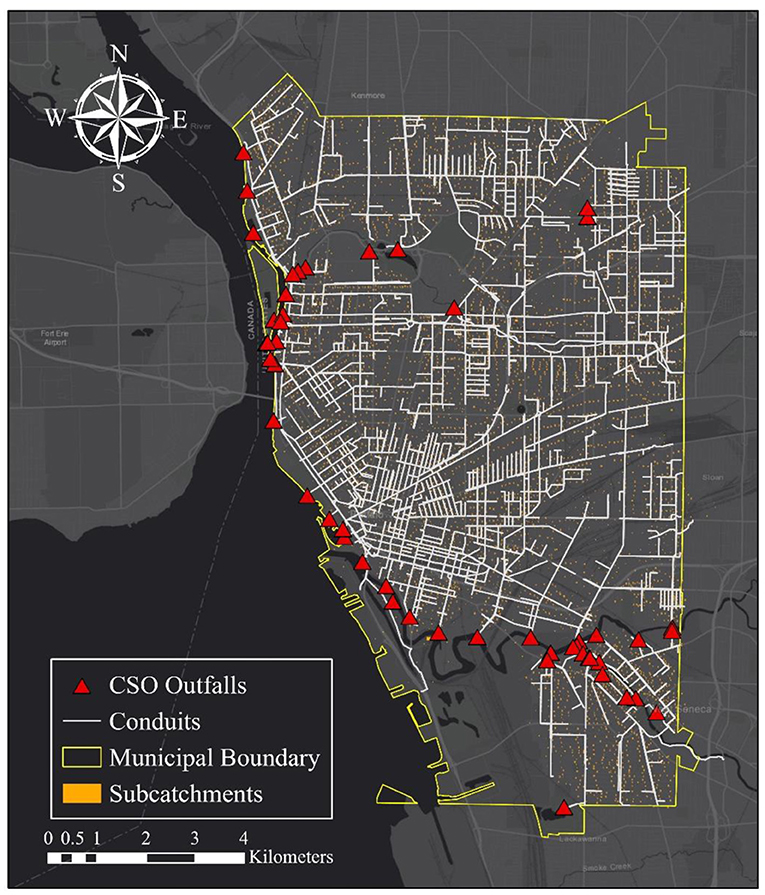
Figure 1. City of Buffalo's SWMM Model—conduits, sub-catchments, and CSO outfalls.
Modeling Porous Pavements
In this study, we explored the impact of placing PP at its maximum capacity in the parking lots of the city, i.e., replacing all parking lots with PP. Among the 59,796 sub-catchments (68,835 acres) represented in the SWMM model, 2,682 are parking lots (with an area of 6.89 km2, 2.6% of the total area). These parking lots receive, besides the rainfall falling directly on its surface, the runoff from 3,298 roofs (with an area of 7.63 km2, 2.9% of the total). Table 1 specifies the parameters used for modeling PP in SWMM (Torres et al., 2021). The area of the PP was adjusted to cover the surface area of the original parking sub-catchment.

Table 1. SWMM parameter values used for modeling PP.
Rainfall Scenarios
Data for the IDF curves were extracted from the Coordinated Regional Climate Downscaling Experiment (CORDEX) and Coupled Model Intercomparison Project Phase 5 (CMIP5). CORDEX simulations included regional climate models (RCMs) with 50-km gridded resolution ran through CMIP5 atmospheric-oceanic general circulation models (AOGCMs) (Degaetano and Castellano, 2017). Daily precipitation estimates extracted from four CORDEX model combinations and 25 CMIP5 models provide one historical and two future climate scenarios (greenhouse gas trajectories representative concentration pathway 4.5 and 8.5, or RCP4.5 and RCP8.5). The future climate scenarios refer to different magnitudes of net radiative forcing expected by 2,100 (compared to pre-industrial settings). Three downscaling methods (dynamic, delta, and analog) were used to estimate future precipitation as the resolution of global climate models (GCMs) were too coarse for Degaetano and Castellano's study. Bias correction factors were implemented for these downscaling methods. In the dynamic and analog methods bias correction factors were developed from a comparison of historical downscaled recurrence interval (also known as return period) precipitation and observed recurrence interval precipitation. The delta method uses raw data from the CMIP5 project for daily precipitation, so historical bias was only determined for the dynamical and analog approaches (Degaetano and Castellano, 2014).
This study used data provided by NRCC's precipitation observation station located at the Buffalo-Niagara International Airport in Cheektowaga, New York, USA. Thirty-two separate design rainfalls (see Table 2) were used: four storm durations (1, 6, 12, and 24 hours), four return periods (2, 10, 50, and 100 years), and two timeframes (current: 1970–1999 and future: 2070–2099). The four durations and four return periods were selected to represent two extremes and two intermediate scenarios in each category. The current timeframe IDF curves utilize measurement data in their calculations and therefore were selected to provide a baseline. For the future timeframe, the 2070–2099 time period was selected as it is the IDF projection provided by NRCC. RCP8.5 was also selected for this timeframe. These two factors combined allow for analysis of the worst-case scenario available. With two GI installations (with and without PP) used, 64 simulations were performed.
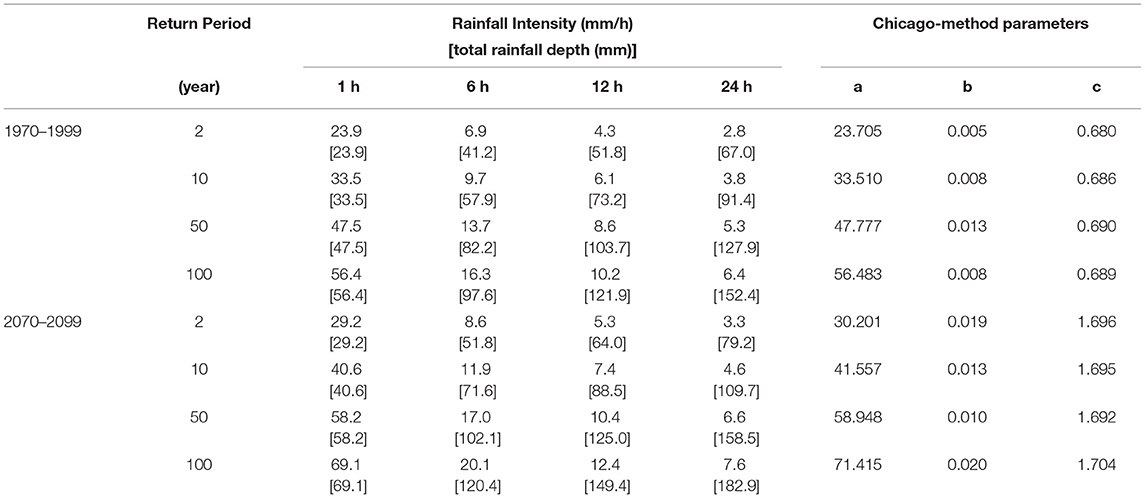
Table 2. Rainfall intensity [total rainfall depth] per timeframe, return period, and duration and associated Chicago method rainstorm parameters.
Implementation of the design storm scenarios were accomplished using Computational Hydraulics International (CHI)'s PCSWMM (CHI, 2021). Incorporation of NRCC IDF curves into PCSWMM's raingage editor resulted in the rainfall intensity in Table 2. The Chicago Method (Keifer and Chu, 1957) parameters (a, b, and c) were fitted by PCSWMM. These parameters and the Chicago Method equations (see Appendix) were used to develop time series of rainfall intensity (i.e., hyetographs). Figure 2 shows the design hyetographs for the four return periods (with a 1-h duration). The Appendix also shows the hyetographs of 32 scenarios (16 graphs with two hyetographs apiece, representing the different timeframes).
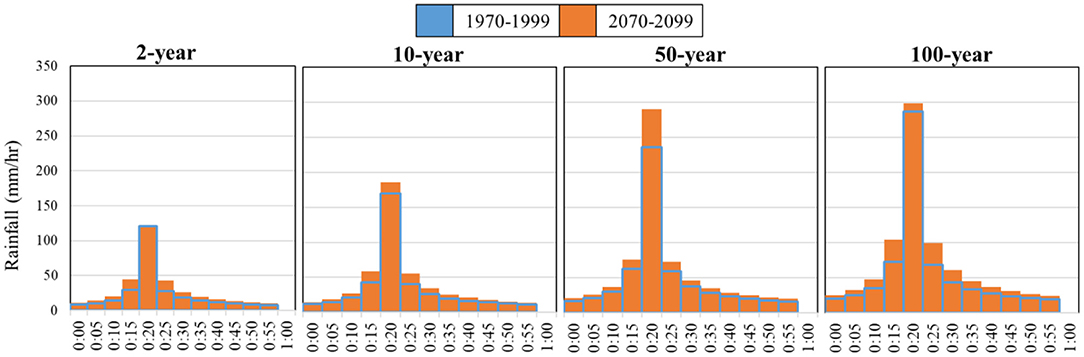
Figure 2. One-h design storm hyetographs of 2-, 10-, 50-, 100-year return period from left to right. Period 1970–1999 in blue hollow columns and period 2070–2099 in orange solid columns.
Results and Discussion
Climate Change Impact—CSO Total Volume Comparison Between Current and Future Scenarios
Total CSO volume (53 outfalls, refer to Figure 1) was calculated for the current and future timeframes, both with and without PP implementations, as shown in Figure 3. Figure 3 is composed of 16 sub-figures, from top to bottom increasing return periods [2 (a), 10 (b), 50 (c), 100 years (d)] and from left to right increasing rainfall durations (1, 6, 12, and 24 hours). Scenarios with PP are represented with solid columns and the original condition (without PP) with stripped columns. The timeframe 1970–1999 is shown in orange, and the projected timeframe 2070–2099 is in dark gray. Under all return periods and rainfall durations, CSO total volume under future scenario (2070–2099) is higher than that under current scenario (1970–1999). The largest increase in CSO volume magnitude corresponds to the 100-year return period and 24-h duration scenario.
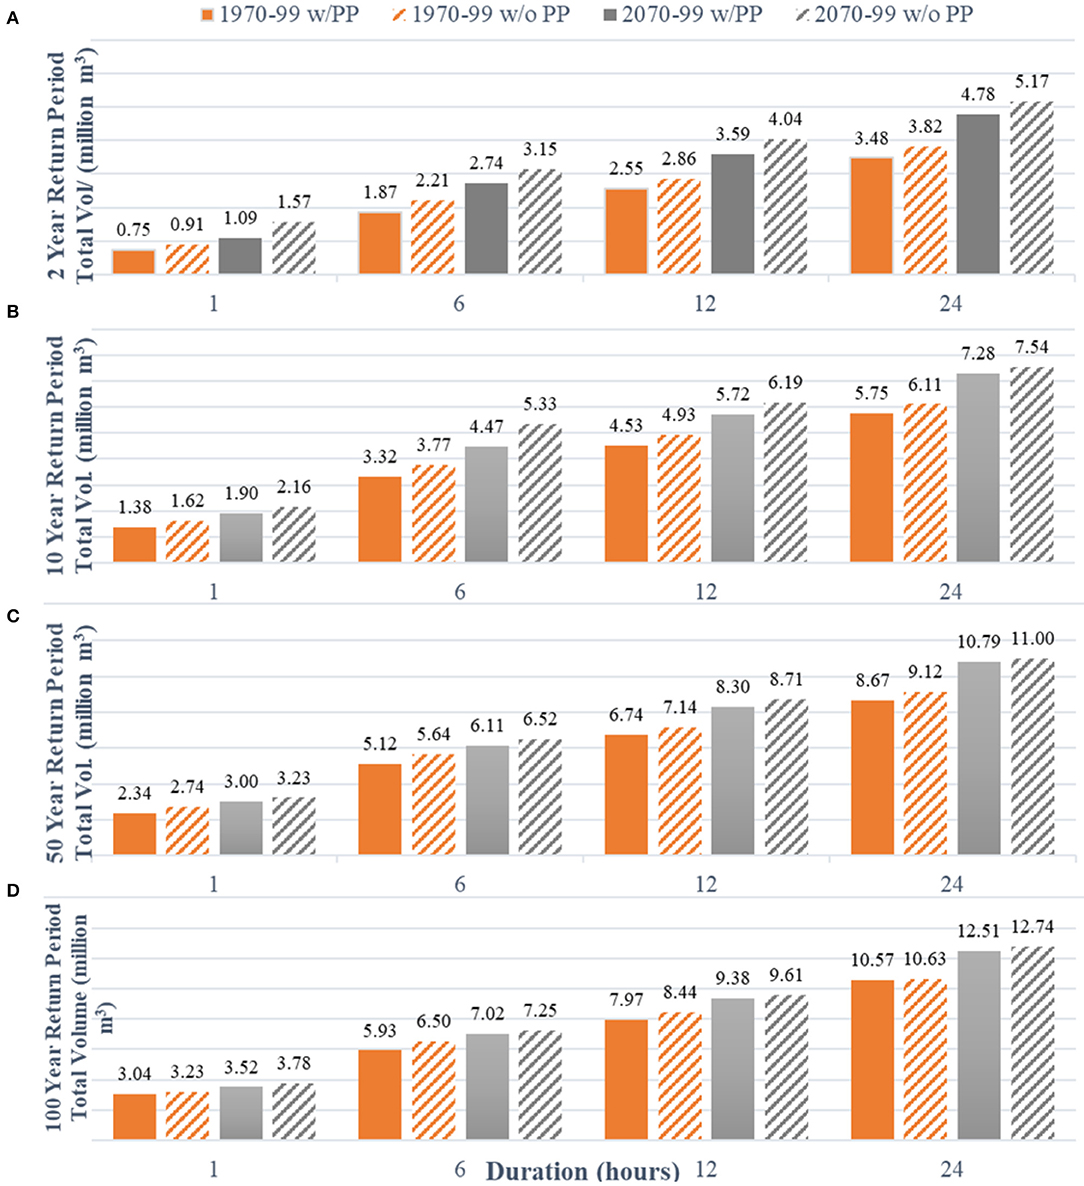
Figure 3. Total CSO volumes in million m3 for the 16 scenarios. Four durations, two timeframes, two installments -with or without PP, and four return periods. (A) 2-years. (B) 10-years. (C) 50-years. (D) 100-years.
Table 3 summarizes the CSO volume increase in percentage from 1970–1999 to 2070–2099, without PP (i.e. baseline condition). The percent increase is between 11 and 73%, with the largest difference occurring under the 2-year return period and 1-h duration scenario. It shows that the difference between current and future scenarios, in terms of percent increase, is more prominent in a shorter return period. In the 2-year return period, the percent increase ranges from 35–73%, while the 100-year return period results in an 11–20% increase in CSO volume. The results showed that while the CSO volume is linearly correlated with the magnitude of rainfall event, the relation is different among the periods of 1970–1999 and 2070–2099 and varies also with the duration and return period.
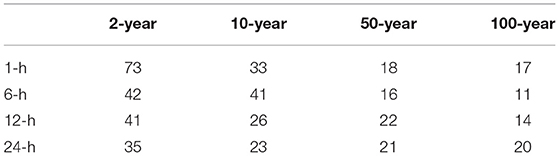
Table 3. Percent increase (%) in CSO total volume from the 1970–1999 to 2070–2099 scenarios without PP.
GI Mitigation Impact—CSO Total Volume Comparison Between w/ and w/o PP
Figure 4 shows the comparison of total CSO volumes using the two timeframes without PP (solid lines) and the future condition with PP (dotted line). As expected, as duration and return period increases, CSO volume increases regardless of the scenario analyzed. As can be observed on the increasing width of the shaded areas, i.e., the difference between the upper (2079–2099 w/o PP) and lower bounds (1979–1999 w/o PP), the absolute differences in CSO volumes between the current and future timeframes generally increase with the rainfall duration. Figure 4 also shows that the total CSO volumes under 50-year and 2070–2099 timeframe scenarios exceed those under 100-year and 1970–1999 timeframe scenarios, for all rainfall durations, which shows that in terms of CSO volume, the current 100-year event may be a 50-year event in the future if no CSO mitigation strategies are undertaken. Regarding CSO volumes under 1-h rainfall duration scenarios, the future 2-year return period can be almost the same as the current 10-yr return period, indicating considerable potential impact of climate change. Also, it is worth mentioning that PP deployment alone in this study cannot completely neutralize the increases in CSO volume due to climate change (i.e., dotted line is always above the lower solid line with the same return period). More actions such as other types of GI should be considered.
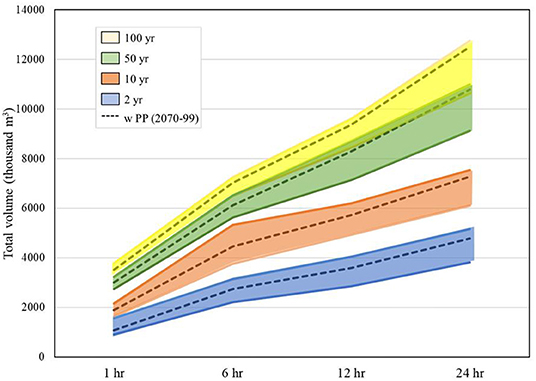
Figure 4. Comparison of total CSO volumes under different scenarios. Shaded areas are the volumetric differences per return period bounded by CSO volumes under 2070–2099 timeframe (upper border) and 1970–1999 timeframe (lower border). Dotted lines represent the PP deployment scenarios for the 2070–2099 timeframe.
It is expected that the deployment of PP will reduce the CSO volume (Alyaseri and Zhou, 2016). The total CSO volume differences between the original condition (i.e., no PP) and with PP deployment in all parking lots can range between 60 and 572 thousand cubic meters for the 1970–1999 timeframe, and between 212 and 859 thousand cubic meters for the 2070–2099 timeframe, exhibiting, in general, larger reductions for the future timeframe than the current. However, we did not find consistently higher or lower reduction volumes for the same duration and return period between the two timeframes, which indicates that the effectiveness of PP on CSO reduction varies upon rainfall patterns (duration and intensity).
When analyzing the effectiveness of PP on CSO reduction for each timeframe separately in Table 4, CSO volume reduction percent generally decreases as rainfall duration and return period increase. Also, the larger the rainfall event, the smaller the impact of PP in the outfall volume. This is also evident from Figure 4, the dotted lines of the 100- and 50-year are closer to the upper bound (2070–2099 timeframe) compared to the 2- and 10-year return periods. Previous studies have also shown that GI has lower performances for larger rainfall events (Cook et al., 2019; Vaillancourt et al., 2019), since the GI soil and media may reach saturation, hence providing less storage capacity. Webber et al. (2020) also found the trend of diminishing effectiveness of GI in reducing flood peak as events become more intense, i.e., associated with a lower probability of occurrence.
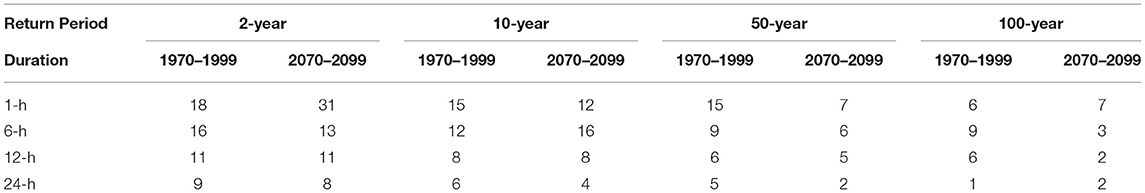
Table 4. Percent decrease (%) in CSO total volume from the w/o PP to w/PP scenarios (w/o PP: without porous pavements; w/ PP: with porous pavements).
Spatial Distribution of CSO Volume Reduction Among CSO Outfalls
Results above are summaries of the aggregated Buffalo system CSO outfalls, i.e., resulting volumes and volume reductions summing up the 53 CSO outfalls of the city. These aggregations provide the global impact of placing PP in all parking lots of the city, but do not capture differential reductions among CSO outfalls. When comparing the outfalls individually, there are outfalls whose CSO volume are completely eliminated, while there are some outfalls where the volume remains undisturbed after PP is deployed. Additionally, even for the same CSO outfall, the percentage reductions varied for different return periods and rainfall durations. To investigate spatial distributions, we examined the CSO volume reduction of all outfalls using all durations and return periods. High variability was observed among return periods and for the same duration, and among durations for the same return period. An example of the latter is shown in Figure 5, which shows the CSO volume reduction (in thousand cubic meters) spatial distribution for the 1-h duration, 1979–1999 timeframe, and four return periods.
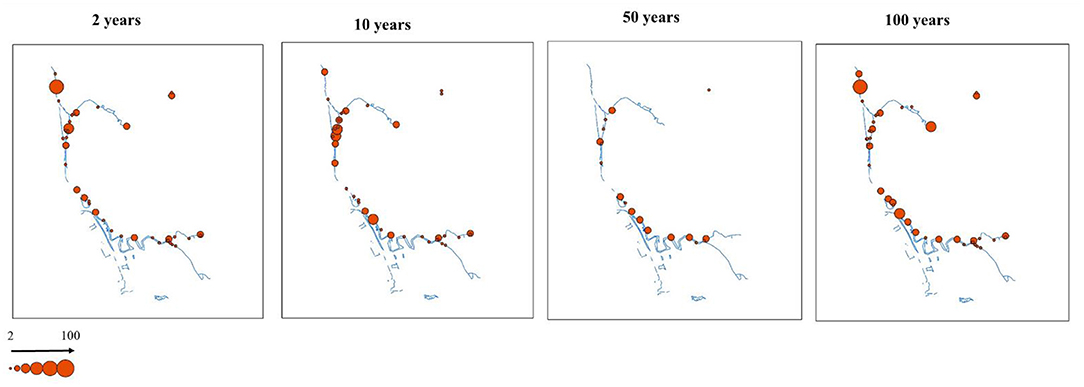
Figure 5. Spatial distribution of CSO volume reductions in thousand m3 among all outfalls for 1-h rainfall duration and different return periods (timeframe 1979–1999). A larger circle size indicates larger reduction.
For a single CSO outfall, there is no observable trend (no increasing or decreasing of volume reduction for increasing return periods). This result goes in line with our aggregated finding that CSO reduction relies heavily upon rainfall patterns (duration and intensity) but also points out that the complexity of the sewer system makes individual CSO outfalls behave differently. It is possible that a reduction in a CSO outfall could increase the volume in another interconnected outfall. Note that in Figure 5, outfalls missing in one (or more) return period sub-figures indicate no reduction for that return period. For example, some CSO outfalls in the northwest of the city have no reduction for the 50 years return period, have large reductions for the 2 and 100 years return periods, and smaller reductions for the 10 years return period. To better analyze these patterns, Figure 6 shows the CSO volume reduction for the 5 prioritized CSO outfalls referred to in Study area, for all durations and return periods under the 1970–1999 timeframe.
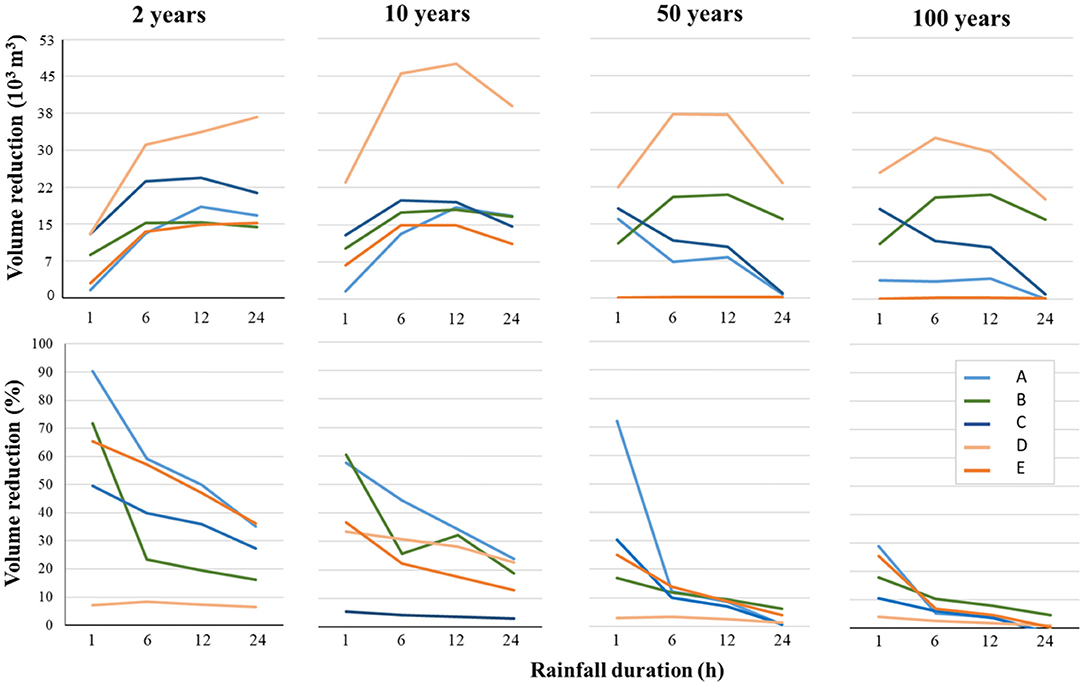
Figure 6. Volume (thousand m3) reductions when porous pavements are placed in all parking lots for the five prioritized CSO outfalls using the timeframe 1970–1999.
Figure 6 shows that while for some return periods a CSO outfall volume reduction seems to increase with increasing duration, the opposite occurs for a different return period. Observe, for instance, the outfall C (dark blue color in Figure 6): the volume reduction increases with increasing durations for the 2 and 10 years return periods and decreases with increasing durations for larger return periods (50 and 100 years). When observing each CSO outfall independently, we consistently find smaller percentage reductions with increasing return periods, which is consistent with our aggregated findings in Spatial distribution of CSO volume reduction among CSO outfalls.
Conclusion
The urban hydrologic model for the city of Buffalo was used to predict the volume of CSO events as influenced by climate change and PP installation. From a series of simulated intensity-duration-frequency curves, the highest RCP (RCP 8.5) was selected to provide a worst-case climate changed scenario. The simulations showed that the current (1970–1999)'s 100-year storm will generate CSO volumes comparable to the future (2070–2099)'s 50-year storm due to the more intense precipitation and resulting runoff. Overall, predicted CSO volumes increased by 11–73% for the different storm events influenced by climate change. Additional simulations showed that the installation of PP can reduce 2–31% of CSO volume under the studied design storms. PP was generally more effective for CSO reduction, under storm events with a smaller return period and shorter rainfall duration.
Data Availability Statement
The original contributions presented in the study are included in the article/Supplementary Material, further inquiries can be directed to the corresponding author.
Author Contributions
AR: conceptualization, methodology, formal analysis, data curation, writing—original draft, and visualization. MT: methodology, software, formal analysis, writing—original draft, and visualization. ZZ: methodology, formal analysis, writing—original draft, and writing and editing, and supervision. AR: funding acquisition, resources, writing review, writing and editing, and supervision. All authors contributed to the article and approved the submitted version.
Conflict of Interest
The authors declare that the research was conducted in the absence of any commercial or financial relationships that could be construed as a potential conflict of interest.
Publisher's Note
All claims expressed in this article are solely those of the authors and do not necessarily represent those of their affiliated organizations, or those of the publisher, the editors and the reviewers. Any product that may be evaluated in this article, or claim that may be made by its manufacturer, is not guaranteed or endorsed by the publisher.
Acknowledgments
We would like to thank the Buffalo Sewer Authority for their financial support and for providing the SWMM model and supporting information. We would also like to thank Computational Hydraulics International (CHI) for providing a university grant to use the PCSWMM model support system. The opinions and findings presented in this paper are only those of the authors and do not represent the opinions of the BSA. Computational resources used in this work were maintained by the Center for Computational Research at the University at Buffalo (Center for Computational Research, 2021).
Supplementary Material
The Supplementary Material for this article can be found online at: https://www.frontiersin.org/articles/10.3389/frwa.2021.725174/full#supplementary-material
References
Alves, A., Sanchez, A., Vojinovic, Z., Seyoum, S., Babel, M., and Brdjanovic, D. (2016). Evolutionary and holistic assessment of green-grey infrastructure for CSO reduction. Water (Switzerland) 8:402. doi: 10.3390/w8090402
Alyaseri, I., and Zhou, J. (2016). Stormwater volume reduction in combined sewer using permeable pavement: city of St. Louis. J. Environ. Eng. 142:04016002. doi: 10.1061/(ASCE)EE.1943-7870.0001056
Arcadis (2018). Collection System Model Update Report - Revised., Buffalo, NY: Buffalo Sewer Authority.
Botturi, A., Ozbayram, E. G., Tondera, K., Gilbert, N. I., Rouault, P., Caradot, N., et al. (2020). Combined sewer overflows : a critical review on best practice and innovative solutions to mitigate impacts on environment and human health. Crit. Rev. Environ. Sci. Technol. 0, 1–34. doi: 10.1080/10643389.2020.1757957
Buffalo Sewer Authority (2018). Raincheck 1.0: The First Generation of Green Infrastructure in Buffalo. Available online at: https://raincheckbuffalo.org/app/uploads/2018/05/Buffalo_Sewer_Authority_RainCheck1.0_Spring2018_SinglesReduced.pdf (accessed June 11, 2021).
Buffalo Sewer Authority (2019). Raincheck 2.0: The next generation of green infrastructure in Buffalo. Available online at: https://raincheckbuffalo.org/app/uploads/2019/05/190515-RC2-OpportunityReport_sml.pdf (accessed June 11, 2021).
Center for Computational Research University at Buffalo. (2021). Available online at: http://hdl.handle.net/10477/79221 (accessed June 11, 2021).
CHI (2021). PCSWMM. Available online at: http://www.chiwater.com/Software/PCSWMM/index.asp (accessed August 1, 2021).
Cook, L. M., VanBriesen, J. M., and Samaras, C. (2019). Using rainfall measures to evaluate hydrologic performance of green infrastructure systems under climate change. Sustain. Resilient Infrastruct. 0, 1–25. doi: 10.1080/23789689.2019.1681819
Degaetano, A. T., and Castellano, C. M. (2014). Downscaled Projections of Extreme Rainfall in New York State Technical Document. Ithaca, NY: Cornell University. 1–25.
Degaetano, A. T., and Castellano, C. M. (2017). Future projections of extreme precipitation intensity-duration- frequency curves for climate adaptation planning in New York State. Climate Serv. 5, 23–35. doi: 10.1016/j.cliser.2017.03.003
Feng, Y., Burian, S., and Pomeroy, C. (2016). Potential of green infrastructure to restore predevelopment water budget of a semi-arid urban catchment. 542, 744–755. doi: 10.1016/j.jhydrol.2016.09.044
Fletcher, T. D., Shuster, W., Hunt, W. F., Ashley, R., Butler, D., Arthur, S., et al. (2015). SUDS, LID, BMPs, WSUD and more – The evolution and application of terminology surrounding urban drainage. Urban Water J. 12, 525–542. doi: 10.1080/1573062X.2014.916314
Foster, J., Lowe, A., and Winkelman, S. (2011). The value of green infrastructure for urban adaptation. Center Clean Air Policy 750, 1–52. http://ccap.org/assets/The-Value-of-Green-Infrastructure-for-Urban-Climate-Adaptation_CCAP-Feb-2011.pdf
Ghodsi, S. H., Zhu, Z., Gheith, H., Rabideau, A. J., Torres, M. N., and Meindl, K. (2021). Modeling the effectiveness of rain barrels, cisterns, and downspout disconnections for reducing combined sewer overflows in a City-Scale watershed. Water Resour. Manage. 35, 2895–2908. doi: 10.1007/s11269-021-02875-7
Huong, H. T. L., and Pathirana, A. (2013). Urbanization and climate change impacts on future urban flooding in Can Tho city, Vietnam. Hydrol. Earth Syst. Sci. 17, 379–394. doi: 10.5194/hess-17-379-2013
Joshi, P., Leitão, J. P., Maurer, M., and Bach, P. M. (2021). Not all SuDS are created equal: Impact of different approaches on combined sewer overflows. Water Res. 191:116780. doi: 10.1016/j.watres.2020.116780
Keifer, C. J., and Chu, H. H. (1957). Synthetic storm pattern for drainage design. J. Hydraulics Div. 83, 1–25.
Macro, K., Matott, L. S., Rabideau, A., Ghodsi, S. H., and Zhu, Z. (2019). OSTRICH-SWMM: a new multi-objective optimization tool for green infrastructure planning with SWMM. Environ. Modell. Softw. 113, 42–47. doi: 10.1016/j.envsoft.2018.12.004
Nie, L., Lindholm, O., Lindholm, G., and Syversen, E. (2009). Impacts of climate change on urban drainage systems - a case study in Fredrikstad, Norway. Urban Water J. 6, 323–332. doi: 10.1080/15730620802600924
NYSDEC (2021). CSO Long Term Control Plan (LTCP). Available online at: https://www.dec.ny.gov/chemical/48985.html (accessed August 1, 2021).
Randall, M., Sun, F., Zhang, Y., and Jensen, M. B. (2019). Evaluating sponge city volume capture ratio at the catchment scale using SWMM. J. Environ. Manage. 246, 745–757. doi: 10.1016/j.jenvman.2019.05.134
Saier, M. H. (2007). Climate change 2007 synthesis report. Water Air Soil Pollut. 181, 1–2. doi: 10.1007/s11270-007-9372-6
Salerno, F., Viviano, G., and Tartari, G. (2018). Urbanization and climate change impacts on surface water quality: enhancing the resilience by reducing impervious surfaces. Water Res. 144, 491–502. doi: 10.1016/j.watres.2018.07.058
Shirgira, E., Kheyroddin, R., and Behzadfar, M. (2019). Defining urban green infrastructure role in analysis of climate resiliency in cities based on landscape ecology theories. TeMa J. Land Use Mobility Environ. 12, 227–247. doi: 10.6092/1970-9870/6250
Tavakol-Davani, H., Goharian, E., Hansen, C. H., Tavakol-Davani, H., Apul, D., and Burian, S. J. (2016). How does climate change affect combined sewer overflow in a system benefiting from rainwater harvesting systems? Sustain. Cities Soc. 27, 430–438. doi: 10.1016/j.scs.2016.07.003
Torres, M. N., Rabideau, A., Ghodsi, S. Y., Zhu, Z., and Mattot, L. (2021). Porous Pavements Spatial Placement Impact on Combined Sewer Overflows. Buffalo, NY: University at Buffalo (SUNY).
USEPA (2014). Greening CSO plans : Planning and Modeling Green Infrastructure for Combined Sewer Overflow (CSO) Control. 7–8.
Vaillancourt, C., Duchesne, S., and Pelletier, G. (2019). Hydrologic performance of permeable pavement as an adaptive measure in urban areas: case studies near Montreal, Canada. J. Hydrol. Eng. 24:05019020. doi: 10.1061/(ASCE)HE.1943-5584.0001812
Webber, J. L., Fletcher, T. D., Cunningham, L., Fu, G., Butler, D., and Burns, M. J. (2020). Is green infrastructure a viable strategy for managing urban surface water flooding? Urban Water J. 17, 598–608.
Woods-Ballard, B., Kellagher, R., Martin, P., Jefferies, C., Bray, R., Shaffer, P., et al. (2007). The SuDS Manual. London: CIRIA. 697.
Keywords: climate change, porous pavements, combined sewer overflow, green infrastructure, sustainable urban drainage system
Citation: Roseboro A, Torres MN, Zhu Z and Rabideau AJ (2021) The Impacts of Climate Change and Porous Pavements on Combined Sewer Overflows: A Case Study of the City of Buffalo, New York, USA. Front. Water 3:725174. doi: 10.3389/frwa.2021.725174
Received: 15 June 2021; Accepted: 12 August 2021;
Published: 08 September 2021.
Edited by:
Daniel Jato-Espino, Valencian International University, SpainReviewed by:
Erik Porse, California State University, Sacramento, Sacramento, United StatesSumit Purohit, Pacific Northwest National Laboratory (DOE), United States
Copyright © 2021 Roseboro, Torres, Zhu and Rabideau. This is an open-access article distributed under the terms of the Creative Commons Attribution License (CC BY). The use, distribution or reproduction in other forums is permitted, provided the original author(s) and the copyright owner(s) are credited and that the original publication in this journal is cited, in accordance with accepted academic practice. No use, distribution or reproduction is permitted which does not comply with these terms.
*Correspondence: Maria Nariné Torres, bXRvcnJlc2NAYnVmZmFsby5lZHU=