 Daniel L. Weller1,2
 Claire M. Murphy3
 Stephanie Johnson4
 Hyatt Green1Edward M. Michalenko4Tanzy M. T. Love2
 Laura K. Strawn3*
- 1Department of Environmental and Forest Biology, SUNY College of Environmental Sciences and Forestry, Syracuse, NY, United States
- 2Department of Biostatistics and Computational Biology, University of Rochester, Rochester, NY, United States
- 3Department of Food Science and Technology, Virginia Tech, Blacksburg, VA, United States
- 4Onondaga Environmental Institute, Syracuse, NY, United States
Fecal contamination of surface water has been associated with multiple enteric disease outbreaks and food recalls. Thus, it is important to understand factors associated with fecal contamination of agricultural water sources. Since fecal indicator bacteria (FIB) were used to monitor surface water for potential fecal contamination, the purpose of the present study was to characterize associations between environmental factors, and (i) FIB (E. coli, Enterococcus, and coliform) levels, and (ii) host-specific fecal marker detection. This study used data collected from 224 sites along 3 waterways, which spanned an urban-rural gradient around Syracuse, New York. Between 2008 and 2017, 2,816 water samples were collected, and E. coli, Enterococcus, and/or coliform concentrations were enumerated. Thirty-one samples were also tested for human and ruminant microbial source-tracking markers. Water quality (e.g., turbidity, nitrate) and weather data were also collected for each site. Univariable Bayesian regression was used to characterize the relationship between each microbial target and land use, water quality, and weather factor. For each model, probability of direction and region of practical equivalence overlap (ROPE) were calculated to characterize the association's direction and strength, respectively. While levels of different FIB were not correlated with each other, FIB levels were associated with environmental conditions. Specifically, FIB levels were also positively associated with temperature, nutrient and sediment levels. Log10 E. coli levels increased by 0.20 (CI = 0.11, 0.31) and log10 Enterococcus levels increased by 0.68 (CI = 0.08, 1.24) for each log10 increase in salinity and nitrate, respectively. These findings may indicate that similar processes drove microbial, sediment, and nutrient contamination of the sampled watersheds. While fecal contamination was strongly associated with land use, the direction of association varied between FIBs and the buffer distance used to calculate land use metrics. E. coli levels and human marker detection were positively associated with percent pasture cover within 122, 366, and 1,098 m of the sampling site, while Enterococcus and coliform levels were only associated with pasture cover within 1,098 m (not 122 or 366 m). Ruminant markers were positively associated with pasture cover within 122 m, but not 366 or 1,098 m. These findings highlight the importance of considering (i) adjacent land use (and associated non-point sources of contamination) when developing strategies for managing fecal hazards associated in agricultural and recreational water, and (ii) spatial scale (e.g., 122 vs. 1,098 m) when developing these strategies.
Introduction
Fecal contamination of surface water represents a public health hazard, and threatens the economic and recreational value of waterbodies (Rabinovici et al., 2004; Dwight et al., 2005; Given et al., 2006; DeFlorio-Barker et al., 2017; U.S. Environmental Protection Agency SIM., 2018; Calderón-Arrieta et al., 2019). Indeed, fecal contamination of agricultural or recreational water has been identified as the probable cause of multiple enteric disease outbreaks (Ackers et al., 1998; Wachtel et al., 2002; Johnson, 2006; Greene et al., 2008; Barton Behravesh et al., 2011; Food Drug Administration, 2019, 2020). For example, a 2008 multistate Salmonella outbreak in the United States was traced back to the use of contaminated water to irrigate hot peppers in 2008. While this outbreak caused 1,200 salmonellosis cases, it also cost tomatoes growers $25 million in the US, as tomatoes were originally misidentified as the food vehicle, before hot peppers were eventually identified (Barton Behravesh et al., 2011; Ribera et al., 2012). Similarly, researchers estimate that enteric illness attributable to recreational water exposures costs $1,220 per 1,000 recreators, or ~$2.2–$3.7 billion annually in the US (DeFlorio-Barker et al., 2017; U.S. Environmental Protection Agency SIM., 2018). Due to the substantial economic burden and threats of disease associated with fecal contamination of surface water sources, there is considerable interest in mitigating fecal inflows into waterbodies. However, effective mitigation of fecal inflows, requires identifying point and non-point sources of fecal contamination and understanding spatiotemporal variation in these inflows, and in surface water quality. Multiple studies have been conducted to link impaired surface water quality, as indicated by fecal indicator bacteria (FIB) levels, with specific point and non-point sources, and to understand the processes that drive contaminant movement from sources to surface water bodies. For instance, a study that intensively surveyed water quality within an Iowa watershed found that levels of E. coli, a FIB, were positively associated with agricultural land use near the sampling site (Pandey et al., 2012). Conversely, a study that monitored FIB levels in Pennsylvania streams found that FIB levels were positively and strongly associated with urban proximal land use, but only weakly associated with agricultural land use at the watershed scale (Duris et al., 2013). Multiple studies have also shown that stream sediments can act as in-channel stores for FIB, and that disturbance of these sediments (e.g., during storm events) can re-introduce the bacteria into the water column (Nagels et al., 2002; Muirhead et al., 2004). However, resuspension may be affected by waterway-specific characteristics, including flow rate and sediment size (Zhou et al., 2017; Fluke et al., 2019). Similarly, potential point and non-point sources of fecal contamination will vary between and within waterways. As a result, it is difficult to adapt the findings of these and other studies to develop effective, practicable strategies for mitigating fecal contamination for individual waterways since (i) potential sources can differ substantially between waterways, or even between reaches in the same waterway, (ii) fecal contamination is driven by complex processes that are affected by the environmental heterogeneity inherent to freshwater environments (Weller et al., 2020a). Many of the streams that pass-through Syracuse, New York (NY) and flow into Onondaga Lake illustrate the difficulties associated with identifying strategies for optimally mitigating fecal contamination. Three of these streams, Onondaga Creek, Ley Creek and Harbor Brook (Figure 1), are listed as impaired by the NY State Department of Environmental Conservation (https://www.dec.ny.gov/chemical/31290.html) due to excess microbial, nutrient, ammonia and/or turbidity levels, and have been the focused of remediation efforts for more than 30 years (Ganley et al., 1982). Onondaga Creek was identified in the mid-1990s as being responsible for most of the fecal coliform loads and combined sewer overflow (CSO) flows entering Onondaga Lake (Steven, 1996), and the dominant source for sediments entering the lake (Prestigiacomo et al., 2007). Despite long-term monitoring efforts and attempts at remediation in these waterways (e.g., by reducing CSOs; Ganley et al., 1982; Effler et al., 2009; Walker et al., 2013), impairment remains a problem, and as a result, recreational uses, including swimming and fishing, are limited or prohibited in these waterways. For example, monitoring efforts between 2000 and 2007 showed that fecal coliform concentrations in Onondaga Creek exceeded NY State water quality standards on 16% (34/215) and 75% (162/215) of dry weather days at a rural and urban sampling site, respectively (https://static.ongov.net/WEP/AMP/DATA_DOWNLOAD_AREA/NYSDEC%20Data%20Request/Microbial%20Trackdown%20Study/MTS%20Reports/MTS%20Phase%203%20Final%20Report/MTS%20Phase%203%20Final%20Report_4-11-19.pdf). Such findings indicate that combined CSO discharge is not solely responsible for bacteria release to Onondaga Creek, or other Syracuse-area waterways. Data from other monitoring efforts in the area supported this conclusion and found that fluctuations in fecal coliform bacteria levels could not be explained by precipitation-driven discharges alone, and that there appeared to be a strong spatial signal in the data with bacterial concentrations being substantially higher within, compared to outside, the Syracuse city limits (https://www.oei2.org/microbial-trackdown-study/). Indeed, dry weather release was identified as a significant factor, and it was hypothesized that dry weather discharge was the product of an aging sewer system due to broken pipes, poor cross linkages, or illicit connections. Such a hypothesis is consistent with the literature (Ahmed et al., 2005; Sowah et al., 2014, 2017; Weller et al., 2020b), as multiple studies have linked septic system density, sewer system age, and distance to discharge sites/septic systems with ground and surface water impairment. Therefore, this study aimed to (i) identify potential sources of fecal contamination in urban and rural reaches of Onondaga Creek, Ley Creek, and Harbor Brook (Syracuse, NY area waterways), and (ii) characterize associations between microbial indicators of fecal contamination and environmental factors (e.g., weather, nutrient levels), and (iii) provide recommendations on how to prioritize mitigation efforts to maximize restoration efforts.
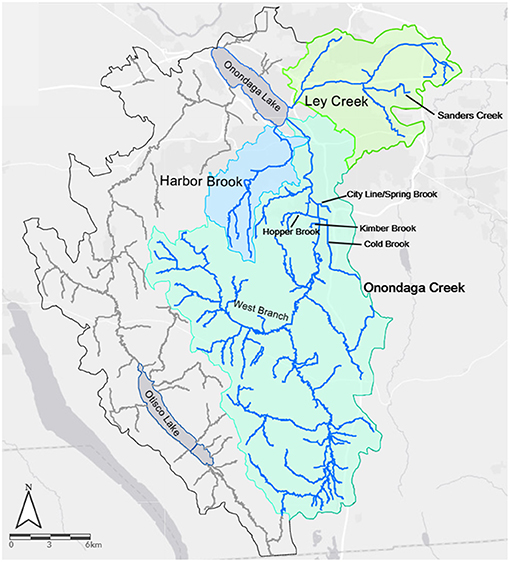
Figure 1. Location and watersheds for the three streams (Harbor Brook, Ley Creek, and Onondaga Creek), and the tributaries of these streams, that were sampled in the present study. Note: Cold Brook and City Line/Spring Brook were treated as a single waterway.
Materials and Methods
Study Design and Water Collection Sites
The data reported here were generated as part of a three-phase collection. During the first phase of sampling (No of Samples = 189; June 11 to October 8, 2014), sampling occurred irrespective of ambient or antecedent weather conditions; phases two and three were conducted to reflect dry weather (i.e., sampling was only conducted if <0.20 cm of rain fall during the preceding 48 h). Three waterways were the main focus of sampling (Figure 1): Ley Creek (No. of samples tested for ≥1 microbial targets (N) = 291; Number of sites where these samples were collected (S) = 58], Onondaga Creek (N = 1,700; S = 109), and Harbor Brook (N = 612; S = 38; Figure 2). Additionally, 1 tributary of Ley Creek [Sanders Creek (N = 1; S = 1)], and 4 tributaries of Onondaga Creek [Cold Brook (N = 34; S = 6), Hopper Brook (N = 48; S = 8), Kimber Brook (N = 4; S = 1), and West Branch (N = 126; S = 3); Figure 1] were sampled.
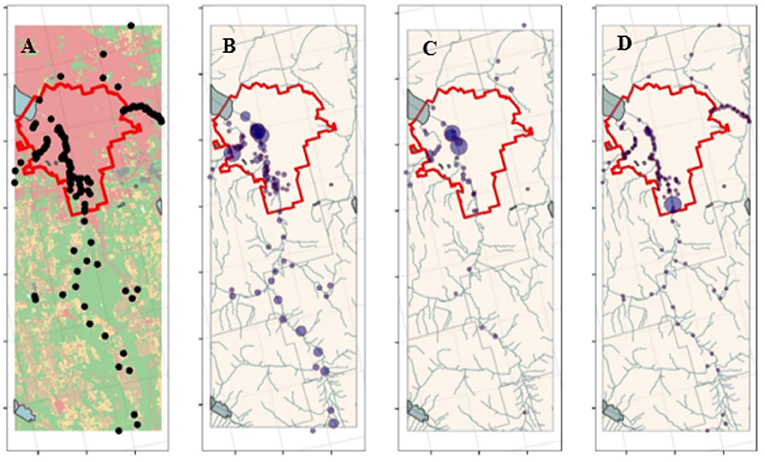
Figure 2. (A) Developed (red), forest-wetland (green), pasture (yellow), crop (brown), and water (blue) cover in the study area; dots show sampling sites. In (B–D), the size of the dots is proportional to E. coli, Enterococcus, and fecal coliform levels, respectively, in each sample. Since this was a longitudinal study, locations were jittered to facilitate visualization of levels in samples collected at the same site but different times. The red lines show the Syracuse, NY city limits; sites inside these limits were considered urban; all other sites were considered rural.
All sampled waterways follow a gradient from rural areas dominated by agriculture and forested to outlets on Onondaga Lake, which are located in the urban core of Syracuse, NY. The watersheds for the three waterways are 35 km2 (Harbor Brook), 76 km2 (Ley Creek), and 285 km2 (Onondaga Creek), representing 5, 10, and 49% of the Onondaga Lake drainage area, respectively (Figure 1). Sample site locations along each waterway were selected to ensure accessibility for samplers, and to ensure both rural and urban sites were represented. A subset of samples (N = 31) were collected for microbial source-tracking marker (MST) analysis between August 2015 and August 2017 from Cold Brook (N = 8), Harbor Brook (N = 10), Hopper Brook (N = 10), and Onondaga Creek (N = 3). The sites used to collect MST data were selected to reflect sites where (i) more than one fecal source appeared to be present, including human and non-human (e.g., agricultural inputs, wetlands or ponds with large waterfowl populations), (ii) where past source-tracking efforts have been unable to identify sources of fecal contamination, and (iii) where fecal coliforms were consistently high during routine monitoring efforts. Samples from these sites were only tested for MST presence if fecal coliforms in a concomitantly collected sample were ≥ 200 cfu/100 mL.
To characterize the impact of land use in the area immediately around each sample collection site the proportion of land within 122, 366, and 1,098 m of each site under pasture-hay, cropland, forest-wetland, and developed (>20% impervious) cover was determined [for an example of the code used see: https://github.com/wellerd2/Calculating-land-use-land-cover-and-landscape-structure-parameters] (Rehmann and Soupir, 2009). Briefly, land use data was extracted from the National Land Cover database (https://www.mrlc.gov/national-land-cover-database-nlcd-2016) for the relevant year, and buffer distance. Buffer distances were selected based on Leafy Green Marketing Agreement (https://lgmatech.com/wp-content/uploads/2020/08/CA-LGMA-Metrics-August-2020_Final_Clean_9-18-20.pdf) recommended buffers from the location of any adjacent land uses that are likely to present a food safety risk (Table 7 from Crop Land and Water Sources Adjacent Land Uses). For example, the recommended distance from cropland to a concentrated animal feeding operation (CAFO) with >1,000 head is ~1,200 feet (366 m). We selected this buffer, and buffers 1/3 smaller (122 m) and larger (1,098 m) to obtain land use data. Additionally, to compare water quality between rural vs. urban areas, sites were characterized as urban if they were within the boundaries of the city of Syracuse (Figure 2). It is also important to note that four of the five sites to the north of the city limits, while in a predominantly developed landscape are in patches of non-developed land cover. However, recognizing that dichotomizing into rural vs. urban oversimplifies that complex landscape around Syracuse, separate analyses using the amount of developed cover around the site were also implemented.
Sample Collection and Analysis
Each site was sampled up to twice a month between May and November, with samples being collected annually from 2008 to 2017 (except 2010 or 2011). Sampling within each waterway was performed in a downstream to upstream manner to avoid sampling the same slug of water. All samples were collected at the same time, varying volumes outlined were collected in different bottles for the various assays including microbiological, physiochemical, and nutrient/sediment analyses.
For microbiological analysis, direct grab samples were collected from the centerline of the waterway by submerging a sterilized 150-mL plastic bottle just below the water surface. Approximately 125 mL of each water sample was transferred to a sterilized and pre-preserved (with sodium thiosulfate) 150-mL coliform bottle. Approximately 10 mL of each water sample was transferred to a 25-mL glass vial for chloride analysis (see below). When samples were collected for MST analysis, a separate 1-L grab sample was also obtained using the direct grab method. Total coliform, fecal coliform, E. coli and/or Enterococcus levels were enumerated using the 125-mL sample <8 h after collection. FIB and total coliform levels were enumerated by the Onondaga County Health Department (a certified laboratory) using NY State Department of Health standard methods (Supplementary Table 1). Separately, samples collected for MST detection were processed <24 h after collection by the Wadsworth Laboratory (NY State Department of Health, Albany, NY; New York State Department of Environmental Conservation, 2017). Briefly, after undergoing anerobic enrichment to select for members of Bacteroidales (Green et al., 2012, 2014, 2019), separate PCR-screens were performed, for host-specific avian (Lu et al., 2008; Green et al., 2012), canid (New York State Department of Environmental Conservation, 2017), human (Bernhard and Field, 2000a; Shanks et al., 2007, 2009; Green et al., 2014), and ruminant fecal markers (Bernhard and Field, 2000b; Supplementary Table 1).
At each sampling event, data were also collected on physicochemical water quality parameters and weather factors. Data on water temperature, pH, dissolved oxygen, specific conductance, and turbidity were collected in situ using a YSI 650 MDS handheld device (YSI Inc., Yellow Springs, OH, USA) equipped with a 6600 or 6820-V2 multi-parameter water quality probe. Chloride was measured in situ using a Hach™ pocket colorimeter. To enumerate nutrient and sediment levels, a separate 7.6 L sample was collected from the same location, and at the same time as the sample used to enumerate FIB levels. The 7.6 L sample was divided into separate 1 and 0.5 L aliquots for nutrient and sediments analysis, respectively (Supplementary Table 1). It is important to note that not all parameters were measured in all samples (e.g., due to equipment malfunctions, availability of staff, time conflicts, feasibility of obtaining samples; S2). Weather data (air temperature, rainfall, relative humidity, and wind speed) for each sampling event were obtained from the Network for Environmental and Weather Applications (NEWA). Data was obtained using the weather station closest to each sampling site location (http://newa.cornell.edu/).
Statistical Analysis
All analyses were performed using R version 3.6.2 (R Foundation for Statistical Computing, Vienna, Austria). For all analyses, all data were log10-transformed. While 2,816 samples were collected, not all analytes were enumerated in all samples; as a result, 5-point summaries and proportion of missingness were calculated for each variable (Supplementary Tables 2, 5, 6).
Bayesian mixed models were developed to (i) characterize spatial and temporal patterns in log10 FIB levels, and human and ruminant MST markers presence, and (ii) identify environmental factors associated with log10 FIB levels or probability of MST detection. Log-linear Bayesian mixed models were developed when the outcome was log10 E. coli, Enterococcus, fecal coliform, or total coliform levels, while Bayesian linear mixed models were developed when the outcome was probability of human or ruminant MST detection. To characterize spatial and temporal patterns, models were developed with fixed effects of elevation, latitude, longitude, rurality (i.e., if the sample was collected inside or outside Syracuse, NY city-limits), and waterway, and of year and month, respectively. For models with a spatial fixed effect, month was included as a random effect, while waterway was included as a random effect for models with temporal fixed effects.
To identify relationships between fecal indicators and environmental factors, Bayesian mixed models were developed with random effects of month and waterway. These models included a single fixed effect for land use (proportion of land within 122, 366, or 1,098 m of the sampling site under crop, pasture-hay, forest-wetland or developed cover), weather (air temperature at sampling and 0–3 d before sampling, rainfall 0–1, 1–2, and 2–3 d before sampling, and wind speed 0–1 d before sampling), or water quality parameters (log10 chloride, conductivity, total dissolved solids, nitrate, total organic carbon, total phosphorous, salinity, total suspended solids, and turbidity levels as well as pH). Since not all analytes were measured in all samples, models were implemented only if there were at least 20 pairwise observations for both the microbial target and environmental factor of interest (Supplementary Tables 5, 6). Due to the large number of samples tested for fecal coliforms (N = 2,658) compared to the other FIBs, fecal coliform models could be implemented for all covariates considered here. Conversely, Enterococcus models could not be implemented with chloride, total dissolved solids, total organic carbon, or total phosphorous as the explanatory variables.
Models were fit using the brms package, uninformative priors, 3 chains, and thinning set to 10 (Bürkner, 2017, 2018). While the number of iterations per chain was set to 5,000 (burn-in of 2,500) for most models, there were convergence issues for a subset of models (Bürkner, 2017, 2018). For those models with convergence issues, the number of iterations per chain and burn-in iterations were increased per the package author's recommendation (Bürkner, 2017, 2018). The median, mean, maximum a posteriori (MAP), and 89% credibility interval for the effect estimates were calculated using the bayestestR package (Makowski et al., 2019a). Bayesian credibility intervals are not interpreted in the same way as frequentist confidence intervals. Instead the 89% credibility interval indicates the highest probability portion of the posterior distribution of possible effect estimates and should be interpreted as: “Given the observed data, the effect estimate has a 89% probability of falling between x and y” (Makowski et al., 2019a).
Unlike frequentist regression models, Bayesian models are not based on assessing statistical significance; instead, Bayesian models offer a probabilistic (more flexible) view of the parameters and their corresponding uncertainty. As such, Bayesian analyses are more robust to small sample size, do not rely on a researcher-specified p-value threshold, and are less prone to Type I errors compared to frequentist approaches. Therefore, rather than concluding that an association is present when the P-value is below a certain threshold, conclusions can be drawn by determining if the parameter is outside of a range of practically negligible effect. This measure, called the ROPE percentage, indicates the magnitude of effect, and is calculated by determining the percent overlap between the 89% credibility interval and the range of practically no effect. Thus, the closer the ROPE percentage is to 0, the more confident we can be that the given factor has a substantial effect on FIB levels or probability of MST detection. Specifically, we use the following cutoffs for ROPE interpretation: >99% ~ negligible effect, >97.5% ~ probably negligible effect, between 2.5 and 97.5% ~ uncertain effect, <2.5% ~ non-negligible effect, <1% ~ significant effect (Makowski et al., 2019a). Associations in Bayesian regression can also be assessed using the probability of direction (PD), which is an index of if a positive or negative effect exists regardless of if that effect is negligible or non-negligible. The PD correlates strongly with frequentist P-values with PD values near 1.0 indicating greater certainty that the effect of the factor is truly positive or negative (i.e., indicates confidence in the direction of the association (Makowski et al., 2019a,b). Specifically, PD values of 0.95, 0.975, 0.995, and 0.9995 correspond to two-sided frequentist P-values of 0.10, 0.05, 0.01, and 0.001, respectively (Makowski et al., 2019a,b). The ROPE and PD measures are independent, and a factor can have a high PD, but low ROPE value, indicating high certainty in the direction of a negligible effect. The inverse would indicate that the parameter has a non-negligible (or substantial) effect, but the direction of that effect is unclear. Overall, PD and ROPE can be used in conjunction to make a statement of the form, “the effect of the given factor has a probability of PD of being negative/positive, and can be considered as significant/nonsignificant (Makowski et al., 2019a).” Measures of (PS) were also calculated, and indicate the probability that the parameter's effect is above a given threshold, representing a negligible effect in the median's direction; this is a unidirectional equivalence test that indicates if the effect is both non-negligible, and in a given direction (Makowski et al., 2019a,b). Values should be larger than 0.5 to indicate practical significance; a cut-off of 0.75 was used here to be conservative. Based on the recommended cut-offs and interpretations for PD, PS, and ROPE, we determined that with PS >0.50, PD >0.75, and ROPE <0.25 warranted reporting here.
Results and Discussion
For the 2,816 samples collected, microbial and physicochemical water quality parameters were summarized in Supplementary Table 2. In total, E. coli, Enterococcus, total coliform, and fecal coliform levels were enumerated in 281, 288, 96, and 2,658 samples, respectively. The average log10 concentration (CFU/100-mL) of E. coli, Enterococcus, total coliform, and fecal coliform levels were 2.2 [Standard Deviation (SD) = 0.9; Range = −0.3, 4.2), 2.0 (SD = 0.9; Range = −0.3, 5.0), 3.0 (SD = 1.0; Range = −0.3, 4.2), and 2.5 (SD = 0.8; Range = −0.4, 7.2), respectively (Supplementary Table 2). Similar summaries of physicochemical water quality in the present study can be found in Supplementary Table 2. For example, average total suspended solids was 7.0 mg/L (SD = 110.5; Range = 1.0, 2,077.0; Supplementary Table 2).
Lack of Association Between MST Markers and FIB May Indicate Multiple Sources of Contamination
Fecal coliform levels were positively associated with Enterococcus and total coliform levels (Table 1, Supplementary Table 3). While E. coli levels were associated with levels of other FIB, land use and spatial factors, such as rurality, that were positively associated with fecal coliform and Enterococcus levels tended to be negatively associated with E. coli levels, and vice versa (Tables 1–3). Of the 31 samples tested for host-specific microbial source tracking markers (MST), 22 (71%) and 11 (35%) samples were positive for human and ruminant markers. Detection of human markers were positively associated with detection of ruminant markers (PD = 0.91; PS = 0.80); however, the magnitude of this effect is uncertain (ROPE = 0.16; Supplementary Table 3). Additionally, neither marker was associated with levels of any of the other microbial targets considered here (PS <0.50, PD <0.95, and ROPE >0.025). This may indicate that (i) human and ruminant fecal contamination were coming from the same sources, (ii) that sources of FIB were different from sources of human and ruminant contamination, and/or (iii) that other host-specific sources of contamination not tested here were driving fecal contamination in the present study. For example, past studies have found that FIBs, such as E. coli can naturalize and survive in non-host environments (e.g., algal mats, water, soil; (Hendricks, 1967; Byappanahalli et al., 2003; Ksoll et al., 2007; Nautiyal et al., 2010; Goto and Yan, 2011; NandaKafle et al., 2018)). As a result, FIB levels may not reflect recent fecal contamination events, resulting in a lack of association between host-specific markers and FIB levels. It is also interesting to note that the findings reported here are inconsistent with a previous study conducted on Onondaga Creek (NY, US), which found a significant positive association between human marker detection and Enterococcus levels, and a significant inverse association between detection of human and ruminant markers (Green et al., 2019). This discrepancy may be due to the fact that this former study collected samples from Onondaga Creek in 2015, while the present study represents a larger number of waterways and a longer sampling period (2008–2017). Water quality is known to vary over space and time, and to vary by the spatial scale of analysis (e.g., Goyal et al., 1977; Pandey et al., 2012; Partyka et al., 2018a; Fluke et al., 2019; Weller and Jordan, 2020; Weller et al., 2020b). It may also indicate that processes driving fecal contamination differ for each of the watersheds sampled here, complicating detection of watershed-specific patterns of contamination (which were the focus of the previous study on Onondaga Creek, NY, US). However, since only three samples from Onondaga Creek and 31 samples total were tested for MST markers, examining watershed-specific patterns of association were outside the scope of the study reported here, and should be investigated in future studies on Onondaga Lake, and other watersheds.
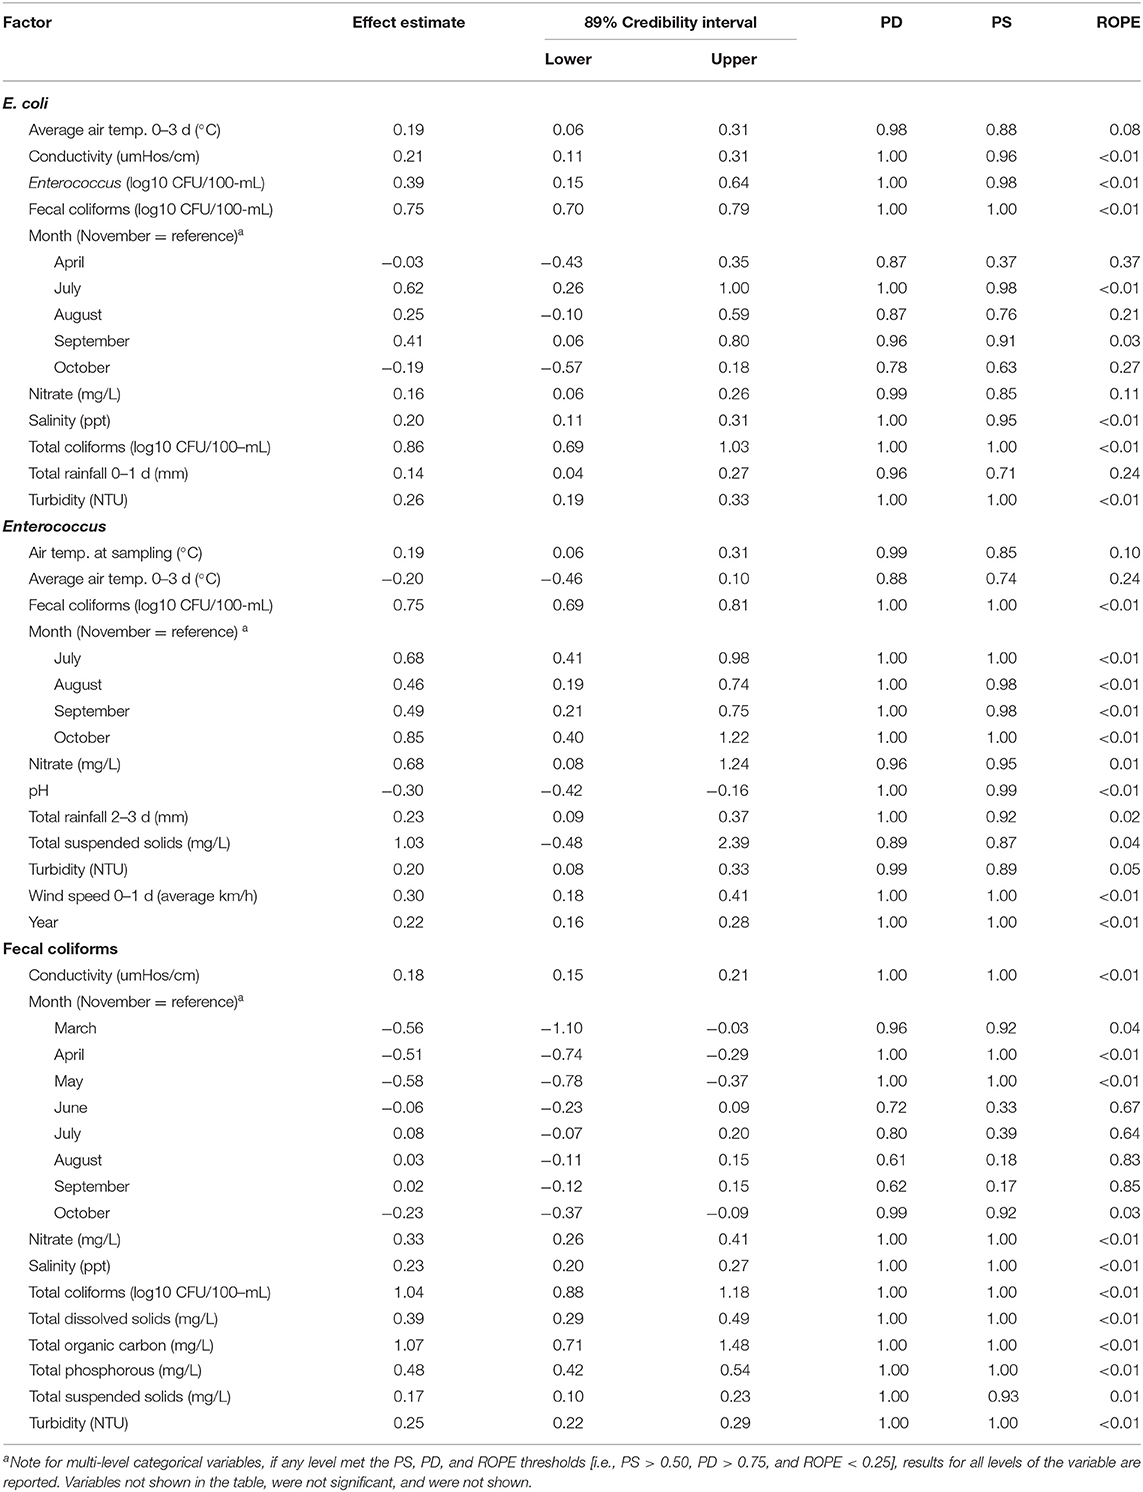
Table 1. Results of Bayesian mixed models where there was evidence of a positive or negative association [i.e., practical significance (PS) > 0.50, probability of direction (PD) > 0.75, and overlap with region of practical equivalence (ROPE) < 0.25] between log10 FIB levels, and either temporal, water quality, or weather features.
Presence and Strength of Association Between FIB Levels and Adjacent Land Use Was Dependent on the Size of the Buffer Used to Calculate Land Use Parameters
The distribution of FIB was non-uniform with Enterococcus and fecal coliform levels being higher and E. coli levels being lower, on average, within the city of Syracuse, NY, compared to outside it (i.e., urban vs. rural samples; Figure 1; Table 2); neither the probability of detecting human or ruminant MST markers were associated with rurality (Supplementary Table 3). In fact, while E. coli levels were, on average, 0.35 log10 CFU/100-mL (89% Credibility Interval [CI] = −0.61, 0.00; PF = 0.94; ROPE = 0.10) lower, and Enterococcus and fecal coliform levels were, on average, 0.32 log CFU/100-mL (CI = 0.13, 0.52; PD = 0.99; ROPE < 0.01) and 0.51 log CFU/100-mL (CI = 0.44, 0.59; PD = 1.00; ROPE < 0.01) higher in samples collected from urban, compared to rural sites. Since latitude increased and elevation decreased along the rural-urban gradient, it is not surprising that fecal coliforms and Enterococcus were positively associated with latitude and negatively associated with elevation (Syracuse, NY is farther north and at a lower elevation, than surrounding rural areas), while the reverse patterns were observed for E. coli, and human and ruminant MST markers (Table 2). Overall, these patterns are also consistent with the land use associations observed here. Specifically, the only association between land use and E. coli levels was a positive association with pasture cover (Table 3), which mirrors the positive association between probability of detecting human and ruminant MST markers and pasture cover (Supplementary Table 4). Conversely, Enterococcus and fecal coliform levels were negatively associated with agricultural land uses and forest-wetland cover, but positively associated with developed cover (Table 3). Interestingly, while the presence and magnitude of the association between E. coli levels and pasture cover appeared robust to buffer size, the associations between Enterococcus and fecal coliform levels and pasture cover, and between ruminant detection and pasture cover were only evident for 1,098 and 122 m buffers, respectively (Table 3, Supplementary Table 4). The relationship between total coliform levels and cropland, human marker detection, and cropland, and ruminant marker detection and developed and forest-wetland cover also seemed dependent on buffer size. Thus, while there were associations between specific land uses and each fecal indicator, these associations appeared dependent on the scale of analysis. This is not unexpected, as a previous study that examined nutrient pollution in Maryland waterways also found that spatial scale of analysis affected model results (Weller and Jordan, 2020). Similarly, a study in Arkansas, US that characterized associations between E. coli levels and riparian land use found that the size and area of the riparian buffer affected the change-point (i.e., the point within the land use parameter that demarcates a significant change in E.coli levels; (Scott et al., 2017)). Since the buffers used here were selected to replicate the recommended distance between large livestock operations (>1,000 head) and agricultural water sources in the Leafy Green Marketing Agreement (i.e., 366 m), this finding has direct implications for produce safety, and highlights the importance of considering spatial scale (e.g., using 122, 366, or 1,098 m buffers), when developing strategies and/or guidance for identifying potential fecal contamination risks.
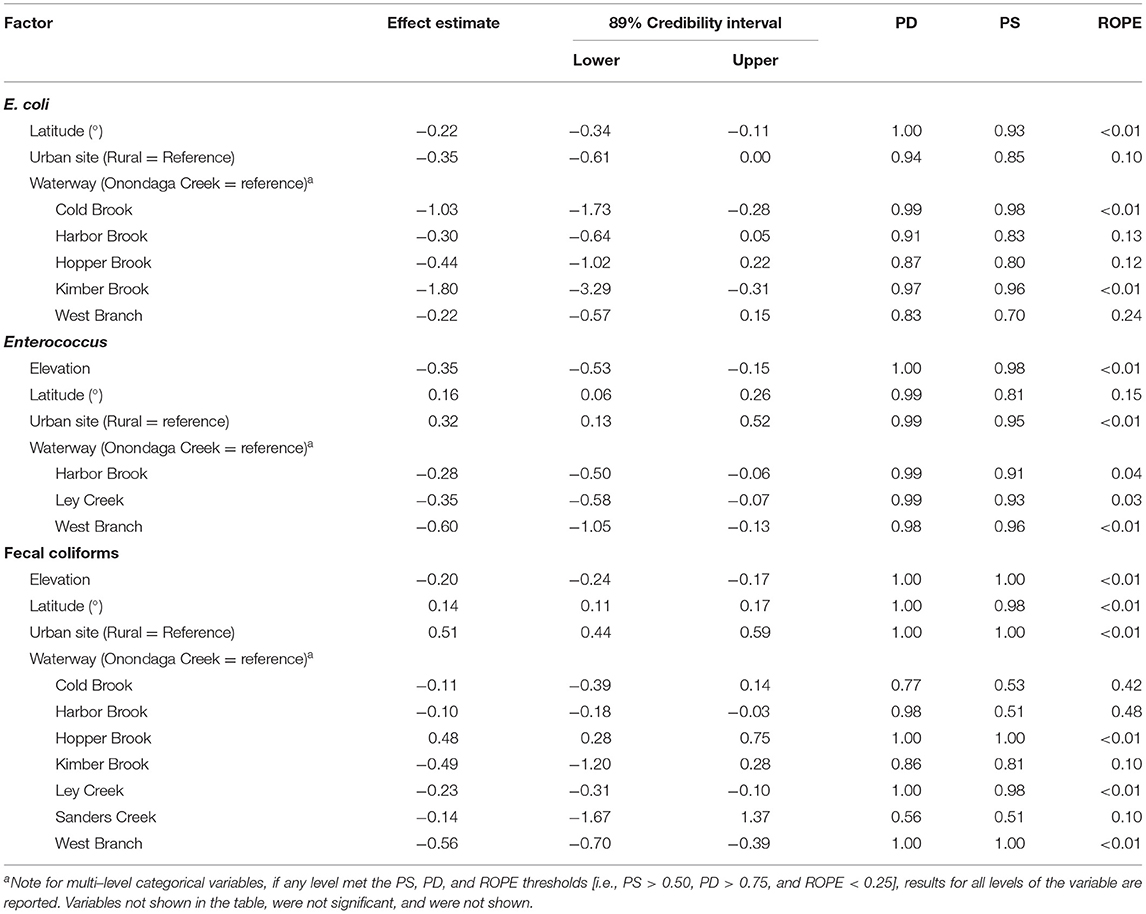
Table 2. Results of Bayesian mixed models where there was evidence of a positive or negative association [i.e., practical significance (PS) > 0.50, probability of direction (PD) > 0.75, and overlap with region of practical equivalence (ROPE) < 0.25] between log10 FIB levels, and spatial features.
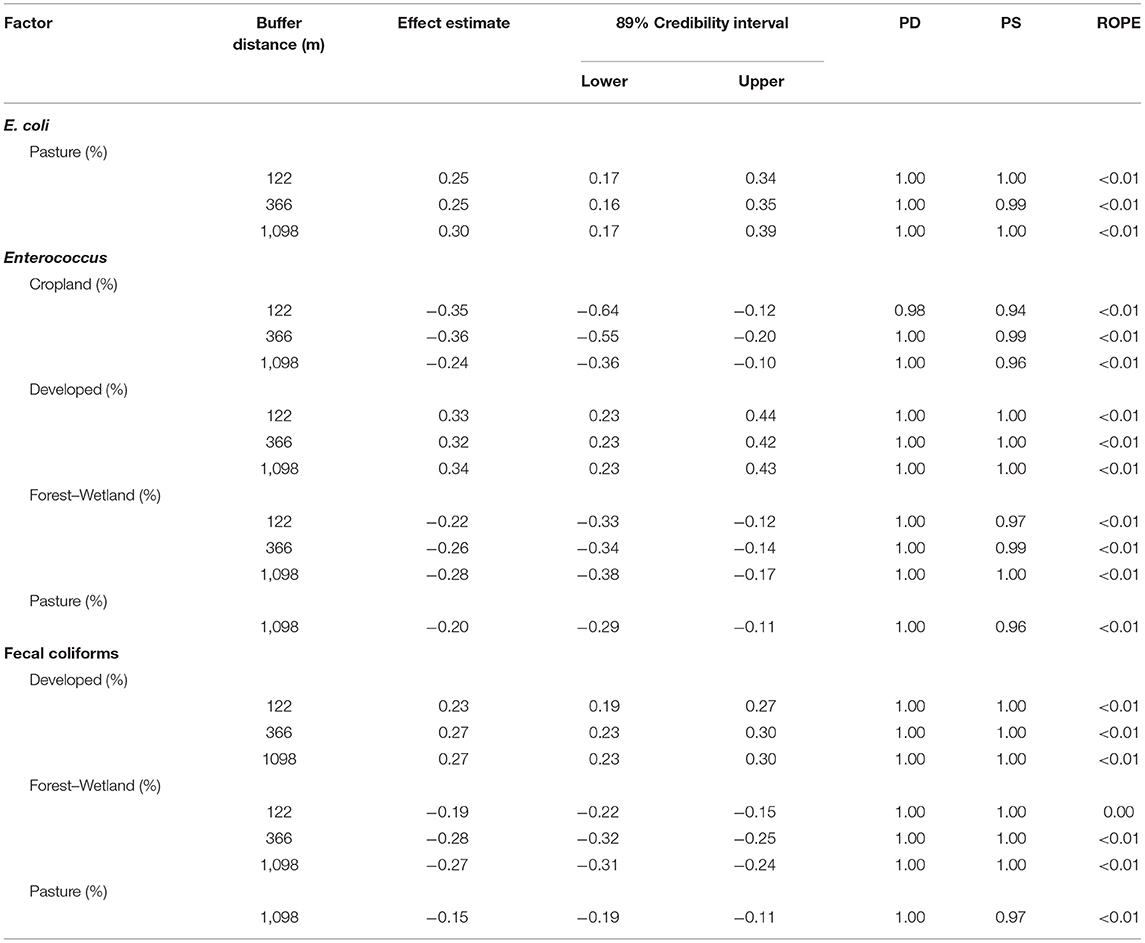
Table 3. Results of Bayesian mixed models where there was evidence of a positive or negative association [i.e., practical significance (PS) > 0.50, probability of direction (PD) > 0.75, and overlap with region of practical equivalence (ROPE) < 0.25] between log10 FIB levels, and the percent of buffer around each sampling site under crop, developed, forest–wetland or pasture cover.
Regardless of the scale for analysis, the study reported here identified strong associations between adjacent land use and fecal contamination, which is consistent with past studies conducted in the Northeastern US, and other areas (Shiels and Guebert, 2010; Wilkes et al., 2011; Duris et al., 2013; Scott et al., 2017; Wu, 2019; Weller et al., 2020b). For instance, we found that E. coli levels increased by 0.30 (89% CI = 0.17, 0.39; PD = 1.00; ROPE <0.01) log10 CFU/100-mL for each percent increase in pasture cover within 1,098 m of the sampling site (Table 1); this positive linear association is consistent with the findings of the aforementioned Arkansas (US) study (Scott et al., 2017). Conversely, Enterococcus and fecal coliform levels both decreased as pasture cover increased, but increased as developed cover increased (Table 1). Given the pattern of land use associations observed here, our findings suggest that the sources of Enterococcus and fecal coliform contamination differ from sources of E. coli or MST markers, with the former coming from developed areas, and the latter from agricultural areas. While we would expect human markers to be associated with urban areas and developed land uses, the association between human markers and agricultural land uses and rural areas may indicate the presence of human fecal contamination sources in rural hinterlands. For example, areas within Syracuse are on municipal water and sewer, while the rural areas to the south largely utilize septic; as such one source of fecal contamination in rural areas may be failing septic. While such a hypothesis is supported by past studies conducted in Queensland, Australia (Ahmed et al., 2005), Georgia, US (Sowah et al., 2014, 2017), Michigan, US (Verhougstraete et al., 2015), and New York, US (Rao et al., 2015), data on the age, location, and density of rural fecal contamination sources, such as septic systems, were not available and this could not be investigated in the present study. This highlights a specific research gap, the impact and source of rural fecal contamination, that future studies in the Onondaga Creek Watershed should address.
Despite differences in land use associations for the various fecal indicators, levels of all indicators were higher in Onondaga Creek, compared to the other waterways sampled (Table 2, Supplementary Table 3). For instance, E. coli levels in Kimber Brook were almost 2 log10 (89% CI = −3.29, −0.31; PD = 0.97; ROPE<0.01) lower, on average, than levels in Onondaga Creek. These findings support previous studies' conclusions that Onondaga Creek was responsible for most of the bacterial and sediment loads entering Onondaga Lake (Steven, 1996; Prestigiacomo et al., 2007). Given the consistency across fecal indicators, including the host-specific markers, this suggests that, independent of land use near each sampling site, fecal contamination patterns varied between the waterways sampled here with Onondaga Creek being more impaired than the other waterways. Thus, while this finding is not surprising, it is important for guiding efforts to mitigate fecal contamination of surface waters that flow into Onondaga Lake. Specifically, since waterways sampled here drain into Onondaga Lake, this finding suggests that mitigation efforts should target Onondaga Creek, as opposed to Ley Creek, Harbor Brook, or Hopper Brook.
Nutrient and Sediment Pollution Were Associated With FIB Contamination, Which May Indicate Shared Contamination Sources or Similar Processes for Transporting Contaminants From Source to Waterway
All FIB tested for in the present study were positively associated with nutrient (e.g., nitrate, phosphorous), chemical (e.g., salinity, conductivity), or sediment (e.g., turbidity, total suspended solid) contamination. For example, the concentration of E. coli, Enterococcus, and fecal coliforms increased by 0.16 (CI = 0.06, 0.26; PD = 0.99; ROPE = 0.11), 0.68 (CI = 0.08, 1.24; PD = 0.96; ROPE = 0.01), and 0.33 (CI = 0.26, 0.41; PD = 1.00; ROPE < 0.01) log10 CFU/100-mLs, respectively, for each log10 increase in nitrate levels (Table 1, Supplementary Table 3). Similar patterns were observed for conductivity, salinity, total organic carbon, total phosphorous, total dissolved solids, total suspended solids, and turbidity (Table 1). In fact, Enterococcus and fecal coliform levels increased by ~1 log for each log10 increase in total suspended solid levels (89% CI = −0.48, 2.39; PD = 0.89; ROPE = 0.03) and for each log10 increase in total organic carbon levels (89% CI = 0.71, 1.48; PD = 1.00; ROPE < 0.01), respectively (Table 1). The discovery of positive associations between physicochemical and microbial water quality parameters is consistent with the previous studies (Soupir et al., 2010; Viau et al., 2011; Wilkes et al., 2011; Rao et al., 2015; Verhougstraete et al., 2015). For example, a survey of 64 Michigan, US rivers found that nutrient levels were able to account for 48% of variance in E. coli levels (Verhougstraete et al., 2015). Additionally, a study that identified factors associated with detection of parasites of fecal origin in an Ontario, Canada watershed, found that Giardia detection was associated with both conductivity and total phosphorous levels (Wilkes et al., 2011). Viau et al. surveyed the microbial and physicochemical quality of Hawaiian streams, and found evidence of positive associations between multiple microbial and physicochemical parameters, including E. coli and total phosphorous levels, and between enterococci levels and turbidity (Viau et al., 2011). In fact, a positive association has been repeatedly identified between microbial water quality and turbidity levels in studies conducted in different water types (e.g., reservoirs, canals, ponds), regions (e.g., the Northeastern and Southeastern US, Ecuador), and where different study designs were used (e.g., microbial targets, sampling strategies; (Viau et al., 2011; Francy et al., 2013; Rao et al., 2015; Topalcengiz et al., 2017; Partyka et al., 2018b; Weller et al., 2020a)). Given the reproducibility of the turbidity-microbial water quality relationship, multiple studies have suggested using turbidity as a supplemental indicator for identifying when a waterway may be contaminated by FIB. Overall, the positive association between microbial water quality (e.g., FIB levels), and nutrient (e.g., nitrate) and sediment (e.g., turbidity) levels in this and other studies, may indicate that similar processes are driving microbial, sediment and nutrient contamination. Such a conclusion is supported by literature on sources, fate, and transport of microbial, nutrient, and sediment contaminants. For instance, it is well-established in the scientific literature that rain events facilitate the release and transport of microbes, nutrients, and sediment from sources to surface waterways (Nagels et al., 2002; Muirhead et al., 2004; Zhou et al., 2017; Fluke et al., 2019). Indeed, rainfall antecedent of sampling events, and wind speed (a proxy for storm events) were associated with elevated FIB levels in this and previous studies (Francy et al., 2013). Additionally, the reported study also highlights that even though sampling in phases two and three of the present study only occurred during dry weather, bacterial pollution was still persistent in sampled waterways. Moreover, bacteria are often bound to particles, with one study reporting that 49% of all Enterococci detected were attached to soil or manure particles (Soupir et al., 2010), and streambed sediments have been repeatedly identified as an in-channel store for FIBs, whose resuspension can result in elevated FIB levels in the water column (Goyal et al., 1977; Muirhead et al., 2004; Rehmann and Soupir, 2009; Kim et al., 2010; Zhou et al., 2017). Thus, differential persistence of FIBs in streambed sediments, may account for the lack of correlation between FIB groups in the present study. From an applied perspective, these findings suggest that strategies to mitigate fecal contamination may concurrently reduce nutrient and sediment contamination; this is of specific interest for land managers in the Syracuse (NY, US) area, given the aforementioned interest in improving the quality of water entering Onondaga Lake; as well as, in regions with similarly impaired waterways.
Conclusion
This study aimed to (i) identify potential sources of fecal contamination in urban and rural reaches of Onondaga Creek, Ley Creek, and Harbor Brook (Syracuse, NY area waterways), (ii) characterize associations between microbial indicators of fecal contamination and environmental factors (e.g., weather, nutrient levels), and (iii) provide recommendations on how to prioritize mitigation efforts to maximize restoration efforts. Briefly, the present study failed to find evidence of an association between FIB levels and host-specific MST markers. Additionally, land use and spatial factors, such as rurality, that were positively associated with fecal coliform and Enterococcus levels tended to be negatively associated with E. coli levels, and vice versa. These two findings may suggest multiples sources of fecal contamination in the sampled streams. Conversely, the study reported here also found evidence of strong associations between FIB levels, and nutrient and sediment levels in the sampled waterways, which may indicate shared contamination sources or similar processes for transporting contaminants from source to waterway. Given the aforementioned interest in improving the quality of water entering Onondaga Lake, this finding is of particular interest from an applied perspective, as it suggests efforts to reduce fecal contamination may reduce nutrient and sediment contamination. Lastly, this study found that FIB levels were not uniform over space, with levels being (i) higher in Onondaga Creek, compared to all other waterways, and (ii) strongly associated with adjacent land use. These findings highlight the importance of considering adjacent land use and stream-to-stream differences when developing strategies for managing fecal hazards in agricultural and recreational water when developing watershed management plans. Specifically, our finding suggests that mitigation efforts should focus on Onondaga Creek, as opposed to Ley Creek, Harbor Brook, or Hopper Brook. By focusing on the most impaired waterway entering Onondaga Lake, rather than all waterways, this type of targeted strategy may provide a way to maximize funds and water quality simultaneously.
Data Availability Statement
The original contributions presented in the study are included in the article/Supplementary Material, further inquiries can be directed to the corresponding author/s.
Author Contributions
SJ and EM conceived of the study, designed the data collection protocols, and led data collection efforts. DW and LS developed the statistical analysis plan. DW analyzed the data with support from TL. CM developed the data summaries. All authors contributed to manuscript preparation and revision.
Funding
This work was supported by Onondaga Environmental Institute (OEI). Manuscript preparation and data analyses were supported by the National Institute of Environmental Health Sciences of the National Institutes of Health (NIH) under award number T32ES007271, and Specialty Crops Research Initiative project 2019-51181-30016 from the United States Department of Agricultural (USDA) National Institute of Food and Agriculture.
Author Disclaimer
Any opinions, findings, conclusions, or recommendations expressed in this publication are those of the author(s) and do not necessarily reflect the view of the NIH and USDA.
Conflict of Interest
The authors declare that the research was conducted in the absence of any commercial or financial relationships that could be construed as a potential conflict of interest.
Publisher's Note
All claims expressed in this article are solely those of the authors and do not necessarily represent those of their affiliated organizations, or those of the publisher, the editors and the reviewers. Any product that may be evaluated in this article, or claim that may be made by its manufacturer, is not guaranteed or endorsed by the publisher.
Acknowledgments
We are grateful for the laboratory assistance of all technicians at the Onondaga County Health Department (Syracuse, NY) and Wadsworth Laboratory, NY State Department of Health (Albany, NY). Additionally, we are thankful for staff and experts at the Onondaga Environmental Institute.
Supplementary Material
The Supplementary Material for this article can be found online at: https://www.frontiersin.org/articles/10.3389/frwa.2021.741676/full#supplementary-material
References
Ackers, M., Mahon, B., Leahy, E., Goode, B., Damrow, T., Hayes, P., et al. (1998). An outbreak of Escherichia coli O157, H7. infections associated with leaf lettuce consumption. J Infect Dis 177:1588–1593. doi: 10.1086/515323
Ahmed, W., Neller, R., and Katouli, M. (2005). Evidence of septic system failure determined by a bacterial biochemical fingerprinting method. J. Appl. Microbiol. 98, 910–920. doi: 10.1111/j.1365-2672.2004.02522.x
Barton Behravesh, C., Mody, R. K., Jungk, J., Gaul, L., Redd, J. T., Chen, S., et al. (2011). 2008 outbreak of Salmonella Saintpaul infections associated with raw produce. N. Engl. J. Med. 364, 918–927. doi: 10.1056/NEJMoa1005741
Bernhard, A. E., and Field, K. G. (2000a). Identification of nonpoint sources of fecal pollution in coastal waters by using host-specific 16S ribosomal DNA genetic markers from fecal anaerobes. Appl. Environ. Microbiol. 66, 1587–1594. doi: 10.1128/AEM.66.4.1587-1594.2000
Bernhard, A. E., and Field, K. G. (2000b). A PCR assay to discriminate human and ruminant feces on the basis of host differences in Bacteroides-Prevotella genes encoding 16S rRNA. Appl. Environ. Microbiol. 66, 4571–4574. doi: 10.1128/AEM.66.10.4571-4574.2000
Bürkner, P. C. (2017). brms: An R package for Bayesian multilevel models using Stan. J. Stat. Softw. 80, 1–28. doi: 10.18637/jss.v080.i01
Bürkner, P. C. (2018). Advanced Bayesian multilevel modeling with the R package brms. R J. 10, 395–411. doi: 10.32614/RJ-2018-017
Byappanahalli, M. N., Shively, D. A., Nevers, M. B., Sadowsky, M. J., and Whitman, R. L. (2003). Growth and survival of Escherichia coli and enterococci populations in the macro-alga Cladophora (Chlorophyta). FEMS Microbiol. Ecol. 46, 203–211. doi: 10.1016/S0168-6496(03)00214-9
Calderón-Arrieta, D., Caudill, S. B., and Mixon, F. G. (2019). Valuing recreational water clarity and quality: evidence from hedonic pricing models of lakeshore properties. Appl. Econ. Lett. 26, 237–244. doi: 10.1080/13504851.2018.1458187
DeFlorio-Barker, S., Wade, T. J., Jones, R. M., Friedman, L. S., Wing, C., and Dorevitch, S. (2017). Estimated costs of sporadic gastrointestinal illness associated with surface water recreation: a combined analysis of data from NEEAR and CHEERS studies. Environ. Health Perspect. 125, 215–222. doi: 10.1289/EHP130
Duris, J. W., Reif, A. G., Krouse, D. A., and Isaacs, N. M. (2013). Factors related to occurrence and distribution of selected bacterial and protozoan pathogens in Pennsylvania streams. Water Res. 47, 300–314. doi: 10.1016/j.watres.2012.10.006
Dwight, R. H., Fernandez, L. M., Baker, D. B., Semenza, J. C., and Olson, B. H. (2005). Estimating the economic burden from illnesses associated with recreational coastal water pollution - a case study in Orange County, California. J. Environ. Manage. 76, 95–103. doi: 10.1016/j.jenvman.2004.11.017
Effler, S. W., O'Donnell, S. M., Prestigiacomo, A. R., O'Donnell, D. M., Matthews, D. A., Owens, E. M., et al. (2009). Tributary plunging in an urban lake (Onondaga Lake): drivers, signatures, and implications. JAWRA J. Am. Water Resour. Assoc. 45, 1127–1141. doi: 10.1111/j.1752-1688.2009.00348.x
Fluke, J., González-Pinzón, R., and Thomson, B. (2019). Riverbed sediments control the spatiotemporal variability of E. coli in a highly managed, Arid River. Front Water 1:4. doi: 10.3389/frwa.2019.00004
Food and Drug Administration (2019). Investigation Summary: Factors Potentially Contributing to the Contamination of Romaine Lettuce Implicated in the Fall 2018. Multi-State Outbreak of E. coli O 157, H7. Silver Spring, MD: Food and Drug Administration.
Food and Drug Administration (2020). Outbreak Investigation of E. coli: Romaine from Salinas, California. Washington, DC: Food and Drug Administration.
Francy, D. S., Stelzer, E. A., Duris, J. W., Brady, A. M. G. G., Harrison, J. H., Johnson, H. E., et al. (2013). Predictive models for Escherichia coli concentrations at inland lake beaches and relationship of model variables to pathogen detection. Appl. Environ. Microbiol. 79, 1676–1688. doi: 10.1128/AEM.02995-12
Ganley, R. C., Kirsch, G. N., Oliver, A. J., Karanik, J. M., and Ott, R. R. (1982). Cost-effective program for combined sewer overflow abatement. J. Water Pollut. Control Fed. 54, 1215–1223.
Given, S., Pendleton, L. H., and Boehm, A. B. (2006). Regional public health cost estimates of contaminated coastal waters: a case study of gastroenteritis at southern California beaches. Environ. Sci. Technol. 40, 4851–4858. doi: 10.1021/es060679s
Goto, D. K., and Yan, T. (2011). Genotypic diversity of Escherichia coli in the water and soil of tropical watersheds in Hawaii. Appl. Environ. Microbiol. 77, 3988–3997. doi: 10.1128/AEM.02140-10
Goyal, S. M., Gerba, C. P., Melnick, J. L., Bonsdorff, C.-., H. von Torvela, N., Heikinheimo, A., et al. (1977). Occurrence and distribution of bacterial indicators and pathogens in canal communities along the Texas coast. Appl. Environ. Microbiol. 34, 139–149. doi: 10.1128/aem.34.2.139-149.1977
Green, H., Weller, D. D. L., Johnson, S., and Michalenko, E. (2019). Microbial source-tracking reveals origins of fecal contamination in a recovering watershed. Water 11:2162. doi: 10.3390/w11102162
Green, H. C., Dick, L. K., Gilpin, B., Samadpour, M., and Field, K. G. (2012). Genetic markers for rapid PCR-based identification of gull, Canada goose, duck, and chicken fecal contamination in water. Appl. Environ. Microbiol. 78, 503–510. doi: 10.1128/AEM.05734-11
Green, H. C., Haugland, R. A., Varma, M., Millen, H. T., Borchardt, M. A., Field, K. G., et al. (2014). Improved HF183 quantitative real-time PCR assay for characterization of human fecal pollution in ambient surface water samples. Appl. Environ. Microbiol. 80, 3086–3094. doi: 10.1128/AEM.04137-13
Greene, S. K., Daly, E. R., Talbot, E. A., Demma, L. J., Holzbauer, S., Patel, N. J., et al. (2008). Recurrent multistate outbreak of Salmonella Newport associated with tomatoes from contaminated fields, 2005. Epidemiol. Infect. 136, 157–165. doi: 10.1017/S095026880700859X
Hendricks, C. (1967). Multiplication and growth of selected enteric bacteria in clear mountain stream water. Water Res. 1, 567–576. doi: 10.1016/0043-1354(67)90039-5
Johnson, S. (2006). The Ghost Map: The Story of London's Most Terrifying Epidemic–and How It Changed Science, Cities, and the Modern World. New York, NY: Penguin Books.
Kim, J.-. W, Pachepsky, Y. A., Shelton, D. R., and Coppock, C. (2010). Effect of streambed bacteria release on E. coli concentrations: monitoring and modeling with the modified SWAT. Ecol. Modell. 221, 1592–1604. doi: 10.1016/j.ecolmodel.2010.03.005
Ksoll, W. B., Ishii, S., Sadowsky, M. J., and Hicks, R. E. (2007). Presence and sources of fecal coliform bacteria in epilithic periphyton communities of Lake Superior. Appl. Environ. Microbiol. 73, 3771–3778. doi: 10.1128/AEM.02654-06
Lu, J., Santo Domingo, J. W., Lamendella, R., Edge, T., and Hill, S. (2008). Phylogenetic diversity and molecular detection of bacteria in gull feces. Appl. Environ. Microbiol. 74, 3969–3976. doi: 10.1128/AEM.00019-08
Makowski, D., Ben-Shachar, M. S., Chen, S. H. A., and Lüdecke, D. (2019b). Indices of effect existence and significance in the bayesian framework. Front. Psychol. 10:2767. doi: 10.3389/fpsyg.2019.02767
Makowski, D., Ben-Shachar, M. S., and Lüdecke, D. (2019a). bayestestR: Describing effects and their uncertainty, existence and significance within the bayesian framework software. J. Open Source Softw. 4:1541. doi: 10.21105/joss.01541
Muirhead, R. W., Davies-Colley, R. J., Donnison, A. M., and Nagels, J. W. (2004). Faecal bacteria yields in artificial flood events: quantifying in-stream stores. Water Res. 38, 1215–1224. doi: 10.1016/j.watres.2003.12.010
Nagels, J. W., Davies-Colley, R. J., Donnison, A. M., and Muirhead, R. W. (2002). Faecal contamination over flood events in a pastoral agricultural stream in New Zealand. Water Sci. Technol. 45, 45–52. doi: 10.2166/wst.2002.0408
NandaKafle, G., Christie, A. A., Vilain, S., and Brözel, V. S. (2018). Growth and extended survival of Escherichia coli O157, H7. in soil organic matter. Front. Microbiol. 9:762. doi: 10.3389/fmicb.2018.00762
Nautiyal, C. S., Rehman, A., and Chauhan, P. S. (2010). Environmental Escherichia coli occur as natural plant growth-promoting soil bacterium. Arch. Microbiol. 192, 185–193. doi: 10.1007/s00203-010-0544-1
New York State Department of Environmental Conservation (2017). LAKE GEORGE BEACH Pollution Source Investigation. Albany, NY: New York State Department of Environmental Conservation.
Pandey, P. K., Soupir, M. L., Haddad, M., and Rothwell, J. J. (2012). Assessing the impacts of watershed indexes and precipitation on spatial in-stream E. coli concentrations. Ecol. Indic. 23, 641–652. doi: 10.1016/j.ecolind.2012.05.023
Partyka, M. L., Bond, R. F., Chase, J. A., and Atwill, E. R. (2018a). Spatial and temporal variability of bacterial indicators and pathogens in six California reservoirs during extreme drought. Water Res. 129, 436–446. doi: 10.1016/j.watres.2017.11.038
Partyka, M. L., Bond, R. F., Chase, J. A., and Atwill, E. R. (2018b). Spatiotemporal variability in microbial quality of western US agricultural water supplies: a multistate study. J. Environ. Qual. 47, 939–948. doi: 10.2134/jeq2017.12.0501
Prestigiacomo, A. R., Effler, S. W., O'Donnell, D., Hassett, J. M., Michalenko, E. M., Lee, Z., et al. (2007). Turbidity and suspended solids levels and loads in a sediment enriched stream: implications for impacted lotic and lentic ecosystems. Lake Reserv. Manag. 23, 231–244. doi: 10.1080/07438140709354012
Rabinovici, S. J. M., Bernknopf, R. L., Wein, A. M., Coursey, D. L., and Whitman, R. L. (2004). Economic and health risk trade-offs of swim closures at a Lake Michigan Beach. Environ. Sci. Technol. 38, 2737–2745. doi: 10.1021/es034905z
Rao, G., Eisenberg, J., Kleinbaum, D., Cevallos, W., Trueba, G., Levy, K., et al. (2015). Spatial variability of Escherichia coli in rivers of northern coastal ecuador. Water 7, 818–832. doi: 10.3390/w7020818
Rehmann, C. R., and Soupir, M. L. (2009). Importance of interactions between the water column and the sediment for microbial concentrations in streams. Water Res. 43, 4579–4589. doi: 10.1016/j.watres.2009.06.049
Ribera, L. A., Palma, M. A., Paggi, M., Knutson, R., Masabni, J. G., and Anciso, J. (2012). Economic analysis of food safety compliance costs and foodborne illness outbreaks in the United States. Horttechnology 22, 150–156. doi: 10.21273/HORTTECH.22.2.150
Scott, E. E., Leh, M. D. K., and Haggard, B. E. (2017). Spatiotemporal variation of bacterial water quality and the relationship with pasture land cover. J. Water Health 15, 839–848. doi: 10.2166/wh.2017.101
Shanks, O. C., Kelty, C. A., Sivaganesan, M., Varma, M., and Haugland, R. A. (2009). Quantitative PCR for genetic markers of human fecal pollution. Appl. Environ. Microbiol. 75, 5507–5513. doi: 10.1128/AEM.00305-09
Shanks, O. C., Santo Domingo, J. W., Lu, J., Kelty, C. A., and Graham, J. E. (2007). Identification of bacterial DNA markers for the detection of human fecal pollution in water. Appl. Environ. Microbiol. 73, 2416–2422. doi: 10.1128/AEM.02474-06
Shiels, D. R., and Guebert, M. (2010). Implementing landscape indices to predict stream water quality in an agricultural setting: An assessment of the Lake and River Enhancement (LARE) protocol in the Mississinewa River watershed, East-Central Indiana. Ecol. Indic. 10, 1102–1110. doi: 10.1016/j.ecolind.2010.03.007
Soupir, M. L., Mostaghimi, S., and Dillaha, T. (2010). Attachment of Escherichia coli and enterococci to particles in runoff. J. Environ. Qual. 39, 1019–1027. doi: 10.2134/jeq2009.0296
Sowah, R., Zhang, H., Radcliffe, D., Bauske, E., and Habteselassie, M. Y. Y. (2014). Evaluating the influence of septic systems and watershed characteristics on stream faecal pollution in suburban watersheds in Georgia, USA. J. Appl. Microbiol. 117, 1500–1512. doi: 10.1111/jam.12614
Sowah, R. A., Habteselassie, M. Y., Radcliffe, D. E., Bauske, E., and Risse, M. (2017). Isolating the impact of septic systems on fecal pollution in streams of suburban watersheds in Georgia, United States. Water Res. 108, 330–338. doi: 10.1016/j.watres.2016.11.007
Steven, W. E. (1996). Limnological and Engineering Analysis of a Polluted Urban Lake: Prelude to Environmental Management of Onondaga Lake. New York, NY: Springer.
Topalcengiz, Z., Strawn, L. K., Danyluk, M. M. D., Webster, L., and Gorski, L. (2017). Microbial quality of agricultural water in Central Florida. PLoS ONE 12:e0174889. doi: 10.1371/journal.pone.0174889
U.S. Environmental Protection Agency SIM. (2018). Microbial Source Tracking: How Did That get in There? EPA Sci Matters Newsl. Washington, DC: USEPA.
Verhougstraete, M. P., Martin, S. L., Kendall, A. D., Hyndman, D. W., and Rose, J. B. (2015). Linking fecal bacteria in rivers to landscape, geochemical, and hydrologic factors and sources at the basin scale. Proc. Natl. Acad. Sci. U.S.A. 112, 10419–10424. doi: 10.1073/pnas.1415836112
Viau, E. J., Goodwin, K. D., Yamahara, K. M., Layton, B. A., Sassoubre, L. M., Burns, S. L., et al. (2011). Bacterial pathogens in Hawaiian coastal streams—Associations with fecal indicators, land cover, and water quality. Water Res. 45, 3279–3290. doi: 10.1016/j.watres.2011.03.033
Wachtel, M. R., Whitehand, L. C., and Mandrell, R. E. (2002). Prevalence of Escherichia coli associated with a cabbage crop inadvertently irrigated with partially treated sewage wastewater. J. Food Prot. 65, 471–475. doi: 10.4315/0362-028X-65.3.471
Walker, W. W., Walker, J. D., and Eng, M. (2013). Analysis of Fecal Coliform Data from Onondaga Lake Tributaries prepared for Upstate Freshwater Institute and Onondaga County Department of Water Environment Protection. Syracuse, NY: Wiley.
Weller, D., Belias, A., Green, H., Roof, S., and Wiedmann, M. (2020b). Landscape, water quality, and weather factors associated with an increased likelihood of foodborne pathogen contamination of New York streams used to source water for produce production. Front. Sustain. Food Syst. 3:124. doi: 10.3389/fsufs.2019.00124
Weller, D., Brassill, N., Rock, C., Ivanek, R., Mudrak, E., Roof, S., et al. (2020a). Complex interactions between weather, and microbial and physicochemical water quality impact the likelihood of detecting foodborne pathogens in agricultural water. Front. Microbiol. 11:134. doi: 10.3389/fmicb.2020.00134
Weller, D. E., and Jordan, T. E. (2020). Inexpensive spot sampling provides unexpectedly effective indicators of watershed nitrogen status. Ecosphere 11:e03224. doi: 10.1002/ecs2.3224
Wilkes, G., Edge, T. A., Gannon, V. P. J., Jokinen, C., Lyautey, E., Neumann, N. F., et al. (2011). Associations among pathogenic bacteria, parasites, and environmental and land use factors in multiple mixed-use watersheds. Water Res. 45, 5807–5825. doi: 10.1016/j.watres.2011.06.021
Wu, J. (2019). Linking landscape patterns to sources of water contamination: Implications for tracking fecal contaminants with geospatial and Bayesian approaches. Sci. Total Environ. 650, 1149–1157. doi: 10.1016/j.scitotenv.2018.09.087
Keywords: fecal indicator bacteria, Escherichia coli, Enterococcus, fecal source tracking, Bayesian regression, water quality
Citation: Weller DL, Murphy CM, Johnson S, Green H, Michalenko EM, Love TMT and Strawn LK (2022) Land Use, Weather, and Water Quality Factors Associated With Fecal Contamination of Northeastern Streams That Span an Urban-Rural Gradient. Front. Water 3:741676. doi: 10.3389/frwa.2021.741676
Received: 15 July 2021; Accepted: 15 November 2021;
Published: 24 February 2022.
Edited by:
Pengfei Zhang, City College of New York (CUNY), United StatesReviewed by:
Cheng Yan, China University of Geosciences Wuhan, ChinaGregory O'Mullan, Queens College (CUNY), United States
Doris Yoong Wen Di, University of Hawaii at Manoa, United States
Copyright © 2022 Weller, Murphy, Johnson, Green, Michalenko, Love and Strawn. This is an open-access article distributed under the terms of the Creative Commons Attribution License (CC BY). The use, distribution or reproduction in other forums is permitted, provided the original author(s) and the copyright owner(s) are credited and that the original publication in this journal is cited, in accordance with accepted academic practice. No use, distribution or reproduction is permitted which does not comply with these terms.
*Correspondence: Laura K. Strawn, THN0cmF3bkB2dC5lZHU=