 Serena Ceola
 Alessio Domeneghetti
 Guy J. P. Schumann
- 1Department of Civil, Chemical, Environmental, and Materials Engineering, Alma Mater Studiorum Università di Bologna, Bologna, Italy
- 2School of Geographical Sciences, University of Bristol, Bristol, United Kingdom
- 3Research and Education Department, RSS-Hydro, Dudelange, Luxembourg
River floods are one of the most devastating extreme hydrological events, with oftentimes remarkably negative effects for human society and the environment. Economic losses and social consequences, in terms of affected people and human fatalities, are increasing worldwide due to climate change and urbanization processes. Long-term dynamics of flood risk are intimately driven by the temporal evolution of hazard, exposure and vulnerability. Although needed for effective flood risk management, a comprehensive long-term analysis of all these components is not straightforward, mostly due to a lack of hydrological data, exposure information, and large computational resources required for 2-D flood model simulations at adequately high resolution over large spatial scales. This study tries to overcome these limitations and attempts to investigate the dynamics of different flood risk components in the Murray-Darling basin (MDB, Australia) in the period 1973–2014. To this aim, the LISFLOOD-FP model, i.e., a large-scale 2-D hydrodynamic model, and satellite-derived built-up data are employed. Results show that the maximum extension of flooded areas decreases in time, without revealing any significant geographical transfer of inundated areas across the study period. Despite this, a remarkable increment of built-up areas characterizes MDB, with larger annual increments across not-flooded locations compared to flooded areas. When combining flood hazard and exposure, we find that the overall extension of areas exposed to high flood risk more than doubled within the study period, thus highlighting the need for improving flood risk awareness and flood mitigation strategies in the near future.
Introduction
Economic losses and social consequences associated with riverine inundations appear to increase worldwide and the intensification of extreme hydrological events due to climate change is often pointed out as the main cause (de Moel et al., 2011; Barnes, 2017; IPCC, 2021). Yet urban growth, flood mitigation infrastructures and increasing human presence and activity in floodplains rule, in a similar way, flood risk, as they contribute to shape the origin and location of flood events as well as the elements at risk (Gupta et al., 2015; Duan et al., 2016; Merz et al., 2021; Tellman et al., 2021). River floods are driven by prolonged rainfall periods that induce high water levels overtopping river embankments, thus inundating nearby locations. Flood risk analyzes cascading impacts on society and the environment. More specifically, actual flood risk results from the superposition of three components (IPCC, 2012), such as hazard (i.e., frequency of occurrence of flood events), exposure (i.e., elements at risk, including direct and indirect damages, people, capital investment, and land or property value), and vulnerability (i.e., the capacity to deal with flood events), which separately can control and impact different dynamics of flood risk evolution (Merz et al., 2010, 2021; Ceola et al., 2014; Domeneghetti et al., 2015). Future projections of increasing population and economic activities on river floodplains as derived from socioeconomic growth scenarios, as well as increasing heavy rainfall estimates associated to climate variability and change, will likely result in increasing flood risk (Hirabayashi et al., 2013; Winsemius et al., 2016; Kam et al., 2021). As a consequence, it is crucial to unravel long-term dynamics of flood risk and its components.
Several methods have been developed both at local and global scales to allow for a detailed assessment of flood hazard, either based on traditional hydrological and hydraulic models (Bates et al., 2010; Yamazaki et al., 2011; Pappenberger et al., 2012; Winsemius et al., 2013; Rudari et al., 2015; Sampson et al., 2015; Dottori et al., 2016; Schumann et al., 2016) or innovative DEM-based (digital elevation model) techniques (Lee et al., 2017; Samela et al., 2017; Tavares da Costa et al., 2020). Typically, flood models simulate inundated areas based on the probability of exceedance of a particular discharge value (i.e., by considering a particular return period) or based on long-term time series of discharge, without accounting for detailed topographic features along floodplains. To overcome this issue, which may result in an approximate identification of the actual flood spatial extension, and thus exposed people and assets, Bates et al. (2010) and Schumann et al. (2016) proposed to assess flood hazard by accounting for detailed floodplain topography. Similarly, Tellman et al. (2021), contributed to estimate the actual flood extent and population exposure for several flood events occurred between 2000 and 2018 by employing high-resolution satellite imagery. Both approaches provide new standards and are expected to improve the accuracy of local and global flood models, our knowledge about how climate, human, land changes interact with flood dynamics, as well as the development of effective flood management strategies.
In order to assess flood exposure, several population and built-up datasets recently released are typically employed (Ceola et al., 2014; Leyk et al., 2019; Bernhofen et al., 2021). These include e.g., gridded population of the world (Center for International Earth Science Information Network (CIESIN), 2016), global human settlement layer (Corbane et al., 2018), global urban footprint (Palacios-Lopez et al., 2019), Facebook's High Resolution Settlement Layer (Facebook Connectivity Lab, and Center for International Earth Science Information Network (CIESIN), 2016), WorldPop (Lloyd et al., 2019), but also unconventional datasets such as nighttime lights (NOAA - Earth Observation Group, 2016). These datasets present different spatial and temporal resolutions and coverage, which are not always suited for an effective assessment of long-term flood exposure dynamics (Leyk et al., 2019; Bernhofen et al., 2021).
The assessment of flood vulnerability, which depends on economic, social, demographic, cultural, institutional and governance factors, is typically the most challenging task. People can alter the hydrologic regime, including extremes such as floods and droughts (Viglione et al., 2016), and in turn these extremes can also shape human society (Ridolfi et al., 2020). It is well-acknowledged that previous flooding experience, income and education control risk perception and influence flood memory and thus flood vulnerability (Jonkman and Kelman, 2005; EU Floods Directive, 2007; Kreibich et al., 2011; Garde-Hansen et al., 2017; Aerts et al., 2018), though it is difficult to quantify and model it. Some attempts are available from the scientific literature, e.g., FLOPROS, a global database of flood protection standards used as a proxy of flood vulnerability (Scussolini et al., 2016), or comparative estimations of observed vs. modeled data (Tanoue et al., 2016), yet further efforts are needed.
Therefore, unraveling long-term dynamics of both flood risk and its components is critical and crucial to allow for an effective flood management, by planning investments in adaptation strategies and improving people awareness of flood risk (Duan et al., 2016; Merz et al., 2021). However, a comprehensive long-term analysis of flood risk components is not straightforward, mostly due to a lack of hydrological data, exposure information, and large computational resources required for 2-D flood model simulations at adequately high resolution over large spatial scales. This study tries to overcome these limitations and attempts to investigate the dynamics of different flood-risk components in the Murray-Darling basin (MDB, Australia) in the period 1973–2014. In particular, we examined long-term dynamics of (i) flood hazard, (ii) flood exposure, (iii) flood memory and (iv) flood risk (see flowchart in Figure 1). More specifically, the spatio-temporal evolution of flood hazard is assessed by means of a large-scale 2-D hydrodynamic model, based on remotely-sensed STRM (Shuttle Radar Topography Mission) data, while for exposure, the Global Human Settlement Layer (GHSL), particularly the built-up area data, provided and distributed by the JRC, is used. As a preventive measure, flood vulnerability is not considered here.
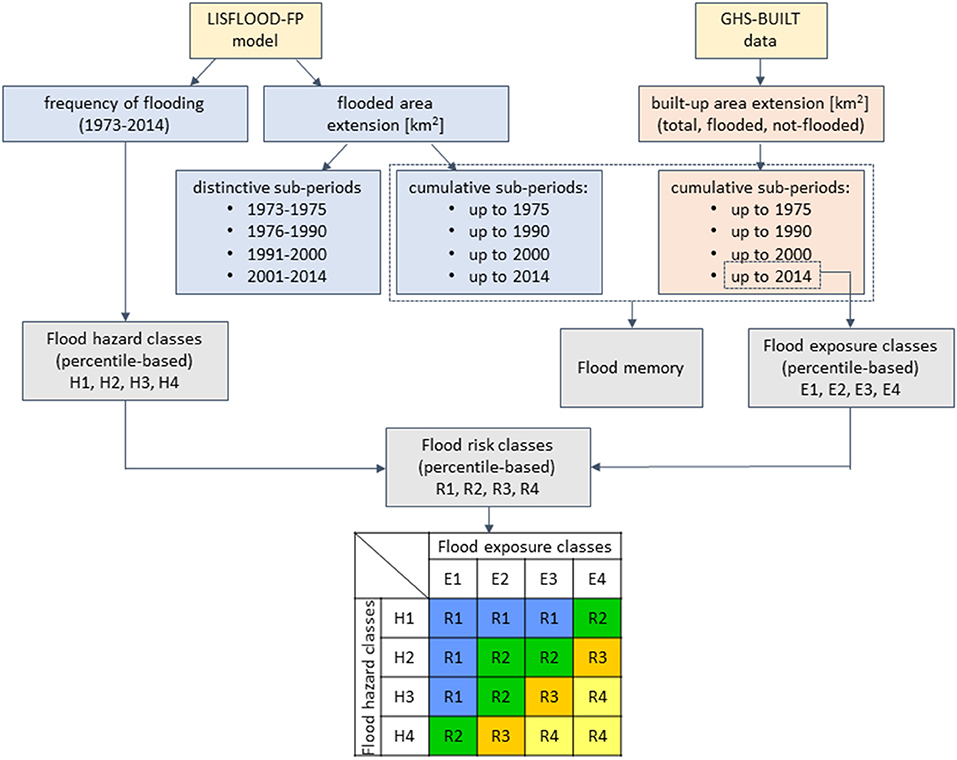
Figure 1. Analysis of long-term flood risk dynamics: research flowchart.
Materials and Methods
Study Area
The study area considered here is the MDB located in the southeastern part of Australia (Figure 2). The MDB is the largest river basin in Australia, with a drainage area of ~106 km2, covering 14% of Australia's land area. The MDB is composed by 22 sub-basins (Murray-Darling Basin Authority, 2020). The MDB provides water to 2.2 million people, typically used for agriculture, drinking and recreation and it is also home to internationally significant wetlands and supports a huge range of endangered species (Murray-Darling Basin Authority, 2020). Given its relevance, several research initiatives and projects focused on MDB water resource management, hydrological extremes and environmental and societal impacts have been recently developed (e.g., Gallant et al., 2012; Heimhuber et al., 2016; Bishop-Taylor et al., 2018).
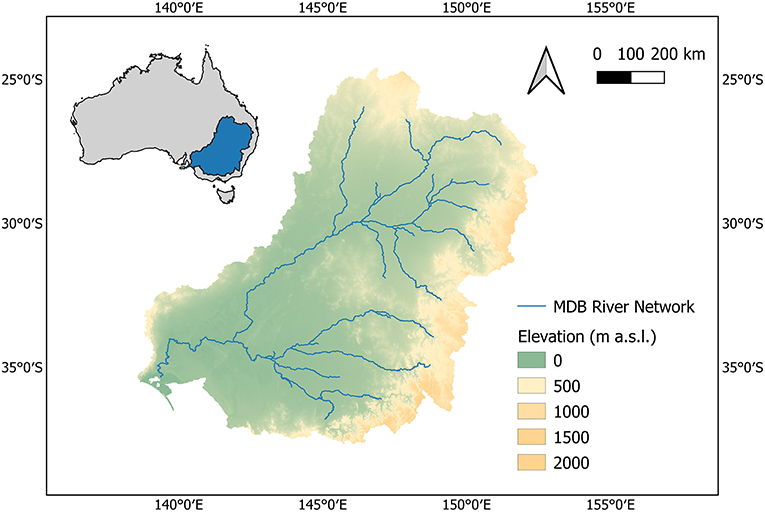
Figure 2. Study area: Location of the Murray Darling Basin, main river network and elevation.
The two main rivers in the MDB, the Murray (2,530 km) and the Darling (2,740 km), are two of Australia's longest rivers. Water in the northern part of MDB runs into the Darling River while water in the southern part of MDB runs into the Murray River. Most of the tributaries in the MDB start in the Great Dividing Range, a series of mountains along the east coast. Then, water flows on flat plains, which cover the majority of the basin area. A pronounced climate gradient characterizes the MDB: from the southeast to the northwest, average annual rainfall decreases (from 1,500 to 300 mm, approximately) and climate variability and evapotranspiration increase (Murray-Darling Basin Authority, 2020). As a consequence, flooding regimes differ significantly across the MDB, with severe flood outbreaks during summer in the northern part of MDB and long flood events driven by rainfall and snowmelt during winter and spring in the southern part of MDB (Bunn et al., 2006; Penton and Overton, 2007). Several catastrophic flood events occurred across the MDB in 1917, 1931, 1952, 1956, 1974, 1993 and 2020 (Murray-Darling Basin Authority, 2020). By chance, our study period includes one of the largest flood events ever occurred across the MDB (i.e., flood event in January 1974, also known as the “big wet”), which was the biggest event in the considered study period.
2-D Hydrodynamic Model for Flood Hazard Assessment
Long-term flood hazard dynamics over the period 1973–2013 has been reconstructed referring to 2-D hydrodynamic simulations performed across the overall MDB. In particular, in this study we retrieve the inundation maps obtained from the continental-scale version of the 2-D hydrodynamic model settled by Schumann et al. (2016) over Australia, specifically applied to the MDB by Grimaldi et al. (2019). The 2-D numerical model (LISFLOOD-FP; Bates et al., 2010) adopts a single explicit finite difference scheme to solve the inertial momentum equation over a regular grid (e.g., raster-based scheme). The model was built from freely available Shuttle Radar Topography Mission (SRTM) data, which was corrected for vegetation canopy height using a global ICESat-1 canopy data set (Simard et al., 2011). Despite the nominal raster resolution, the subgrid channel formulation adopted in the modeling framework (Neal et al., 2012) ensures the capability to reproduce hydraulic dynamics of rivers and floodplains having widths smaller than the adopted grid cell.
All rivers that drain a catchment area >10,000 km2 were explicitly represented in our model. Furthermore, significant flow contributions from smaller tributaries were accounted for as additional inflow points along those major rivers. The model also includes lakes and reservoirs from the Global Lake and Wetland Database (Lehner and Döll, 2004), as well as the evaporative water loss over the MDB based on satellite-sensed daily evaporations estimates (i.e., Global Land Evaporation Amsterdam Model; Martens et al., 2017). Reservoirs and lakes were filled before the simulation was run and were implicitly regulated by the hydrodynamics of the model during simulation. In light of the convincing calibration scores achieved in reproducing past inundations by previous investigations, this study adopts the same model parameters. The reader can refer to Schumann et al. (2016) and Grimaldi et al. (2019) for additional details on model settings, calibration events and modeling assumptions, including also a thorough assessment of uncertainty as influenced by model input, structure and parameters. Flood hazard maps employed in this study are produced at 1 km resolution from January 1973 until July 2013. Outputs from LISFLOOD-FP model simulations are 487 monthly (30 days long) maps of flooded area, flooded water depth, flooded water volume and frequency of flooding. In our analysis, water depth and water volume data are not considered since we are interested only in the identification of flooded locations and their frequency of flooding.
Satellite Data for Flood Exposure Assessment
In order to assess the spatio-temporal evolution of human exposure to floods, we employ the Global Human Settlement Layer (GHSL), a project of the European Commission's Joint Research Centre, which freely provides spatially detailed information on population and settlements (Corbane et al., 2018). In this research, we employ the GHS-BUILT data (at 30 m resolution) that contain a multitemporal information layer on built-up presence as derived from Landsat image collections (GLS1975, GLS1990, GLS2000, and ad-hoc Landsat eight collection 2013/2014), whose values range from 0 (no built-up surface) to 1 (whole built-up surface). In total, four snapshot information on built-up density and distribution are available within the considered study period. Only for comparative purposes, we use the GHS-POP data (at 250 m resolution, Schiavina et al., 2019) that provides the distribution of population, expressed as the number of people per cell for years 1975, 1990, 2000 and 2015. GHS-POP estimates are derived from a spatial disaggregation of CIESIN GPWv4.10 data (Center for International Earth Science Information Network (CIESIN), 2016) based on GHS-BUILT data. In order to perform a coherent superimposition of inundation and built-up data, we aggregate both GHS-BUILT and GHS-POP data at the same resolution as the hydrodynamic model outputs (i.e., 1 km resolution).
Analysis of Long-Term Dynamics of Flood Risk Variables
The temporal evolution of flood risk dynamics from 1973 to 2014 across the MDB is investigated across four sub-periods, whose subdivision depends on the intrinsic temporal availability of built-up data (i.e., 1975, 1990, 2000 and 2014). Inundation maps, as derived from LISFLOOD-FP simulations, are available from January 1973 to July 2013. Since no modeled inundation data is available afterwards (from August 2013 to December 2014), we assume that no flood event occurred during this short time window (i.e., flooded area and frequency of flooding are equal to zero in each grid cell and month), thus slightly underestimating flood hazard.
We assess long-term dynamics of (i) flood hazard, (ii) flood exposure, (iii) flood memory, and (iv) flood risk, as detailed in what follows and schematically shown in Figure 1.
Flood Hazard
Regarding flood hazard (H), we compute the frequency of occurrence of inundation states for each grid cell within the whole study period (1973–2014), by looking at grid cells that were flooded at least one month, as derived from LISFLOOD-FP model simulations (Schumann et al., 2016; Grimaldi et al., 2019). The frequency of occurrence of inundation states is defined as the ratio between the total number of flooded months and the total length of the study period (i.e., 504 months). We categorize these values into four classes, based on the 25th, 50th, 75th and 100th percentiles, where values within the first (0 < H ≤ H25), second (H25 < H ≤ H50), third (H50 < H ≤ H75) and fourth (H75 < H ≤ H100) quartile belong to class H1, H2, H3, and H4, respectively. We also quantify the maximum extension of flooded areas (in km2) and analyze its temporal evolution to identify increasing or decreasing trends. In particular, the maximum extension of flooded area is computed by considering distinct sub-periods (i.e., flooded areas in 1973–1975, 1976–1990, 1991–2000, 2001–2014) and cumulative sub-periods (i.e., flooded areas in 1973–1975, 1973–1990, 1973–2000, 1973–2014). While the first approach allows to detect singularities within the study period (i.e., “flood rich” vs. “flood poor” sub-periods, larger vs. smaller flooded areas), the second one allows to identify possible geographical transfers of flood hazard in time. Finally, for each flood hazard class and for each distinct sub-period we quantify the maximum extension of flooded areas to be employed for the assessment of flood risk dynamics (see section Flood Risk).
Flood Exposure
Concerning flood exposure (E), we quantify the maximum extension of built-up areas (i.e., an indicator of human presence), as derived from GHS-BUILT data (Corbane et al., 2018), and then analyze its temporal trend. Since GHS-BUILT provide built-up data based on cumulative sub-periods (i.e., built-up values until 1975, until 1990, until 2000, and until 2014), we assess the spatial extension at the end of each sub-period. GHS-BUILT values range from 0 to 1, i.e., from no built-up to whole built-up surface, respectively. Based on these features, we compute the maximum extension of built-up area, defined as the sum of built-up values times the grid cell size (in km2). We then disaggregate this result and distinguish between flooded and not flooded built-up locations, by superimposing the geographical location of inundated areas as derived from LISFLOOD-FP model simulations based on cumulative sub-periods. For the sake of completeness, we also evaluate the total number of built-up grid cells, regardless of their built-up value (i.e., by considering any grid cell with GHS-BUILT>0). Similarly to the analysis performed for flood hazard, we define four classes of exposure based on quartile values associated to the most recent built-up data (up to 2014), which embeds all built-up areas in any epoch, i.e., E1 where 0 < E ≤ E25, E2 where E25 < E ≤ E50, E3 where E50 < E ≤ E75, and E4 where E75 < E ≤ E100. We then compute the maximum extension of built-up areas for each exposure class and sub-period, which is functional for the analysis of flood risk dynamics (see section Flood Risk).
Flood Memory
We then analyze flood memory to estimate the temporal evolution of the extension of built-up areas based on antecedent flood hazard conditions (Aerts et al., 2018; Merz et al., 2021). Flood memory is known to influence human resilience to floods, as prolonged periods without significant flood events may increase flood exposure and lead to low risk awareness, which may potentially result in an inadequate response to flood disasters (Garde-Hansen et al., 2017). Here, the goal is to verify if previous flood events may have discouraged the subsequent evolution of built-up areas, thus revealing a flood memory behavior. More specifically, given the overall flooded area in each cumulative sub-period, we quantify the maximum extension of subsequent built-up areas and compute the ratio between flooded built-up areas and cumulative flooded areas (as %). In particular, when considering the flooded area from 1973 to 1975, we look at the built-up evolution in 1975, 1990, 2000 and 2014; when considering the flooded area from 1973 to 1990, we analyze built-up in 1990, 2000 and 2014; and finally, when considering the flooded area from 1973 to 2000, we examine the built-up area in 2000 and 2014.
Flood Risk
We finally analyze the temporal evolution of flood risk (R), here computed by considering concurrent hazard and exposure, whose values are evaluated based on distinct sub-periods. As mentioned before, flood vulnerability is not considered due to lack of reliable data. Starting from the classification of flood hazard and exposure (see section Flood Exposure and Flood Memory), we define four categories of flood risk, as shown in Figure 1. In a given risk category, we consider only those grid cells where concurrent hazard and exposure values are both larger than zero and we quantify flood risk as the maximum extension of built-up areas in each risk category and distinct sub-period.
Results and Discussion
The frequency of occurrence of inundation states across the MDB from 1973 to 2014, as derived from LISFLOOD-FP model simulations, is shown in Figure 3A. Percentile values of the frequency of occurrence of inundation states that characterize flood hazard classes are H25 = 0.03, H50 = 0.12, H75 = 0.50 and H100 = 0.97, showing, among all, that half of the flooded grid cells was inundated on average for ~5 years within the whole study period. The maximum extension of inundated areas based on distinct sub-periods decreases in time (Figure 3C, light blue line), from more than 90,000 km2 (nearly 6.3% of MDB area) to a~75,000 km2 (5% of MDB area). Given the selected percentile-based classification, the maximum extension of flooded areas shows a remarkable reduction in H1 and H2 classes, which identify unfrequently inundated locations likely associated to major flood events (Figure 3B). Conversely, H3 and H4 classes, corresponding to recurring inundation states, are characterized by a slightly decreasing or even invariant pattern in time. In particular, our results suggest that 1973–1975 and 1976–1990 are the most devastating sub-periods, as also confirmed by the absence of increasing trends in the number of flood peaks and flooded areas afterwards (Hu et al., 2018; Merz et al., 2021). When considering cumulative sub-periods (Figure 3C, dark blue line), we do not find any remarkable geographical transfer of flood hazard in time, since the maximum extension of inundated areas does not significantly change in time (i.e., only a feeble increase is detected). This outcome might suggest that inundations occur more frequently in the same locations compared to the past, as influenced for instance by improved risk awareness and structural defenses.

Figure 3. Flood hazard assessment across the MDB from 1973 to 2014. (A) Geographical representation of the frequency of occurrence of inundation states. (B) Temporal evolution of the maximum extension of flooded areas (in km2) in each flood hazard category (percentile-based classification). (C) Temporal evolution of the maximum extension of flooded areas (in km2), as derived from distinct (light blue triangles) and cumulative (dark blue circles) sub-periods.
The maximum extension of built-up areas (i.e., the sum of built-up values times the grid cell size, in km2), as shown in Figure 4A (black line), increases in time from approximately 770 km2 in 1975 to nearly 1,780 km2 in 2014, (i.e., 2.3 times more). Percentile values from the most recent built-up extension that define flood exposure classes are E25 = 9.2·10−4 km2, E50 = 3·10−3km2, E75 = 0.01 km2 and E100 = 0.99. A highly skewed distribution characterizes built-up values. Indeed, the majority of built-up grid cells presents extremely low built-up surfaces and <2.5% of grid cells has at least half of its surface built-up. We also analyze the total number of built-up grid cells, regardless of their built-up values (Supplementary Figure 1), and find that the 2014 value is three times more than the initial one in 1975, meaning that MDB experienced a remarkable conversion from natural land to built-up land. The growth rate of built-up areas is lower than that of the total number of built-up grid cells (i.e., 2.3 vs. 3), proving that new built-up locations are characterized by low built-up values, which are typically found within an urban sprawl context. In particular, when looking at the temporal evolution across flood exposure classes, different relative increments emerge. The relative increment of built-up surfaces is larger in E1 and E2 classes (i.e., 4.5 times), where built-up values are very small, rather than in E3 and E4 classes, characterized by 3.3 and 2.6 relative increments, respectively (Figure 4B).

Figure 4. Flood exposure assessment across the MDB from 1973 to 2014. (A) Temporal evolution of the actual maximum extension of built-up areas (in km2), distinguishing between total (black), flooded (blue) and not-flooded (gray) locations. (B) Temporal evolution of the maximum extension of built-up areas (in km2) in each flood exposure category (percentile-based classification). The inset shows a zoom for classes E1 and E2.
We then disaggregate the maximum extension of built-up areas by distinguishing between flooded vs. not flooded built-up locations, as derived from inundation states based on cumulative sub-periods. The actual maximum extension of built-up area that was flooded at least once feebly increases in time from 1975 to 1990, then remains stable until 2014 (Figure 4A, blue line). The maximum extension of built-up area that did not experience any flood from 1973 to 2014 increases in time from 590 km2 in 1975 to 1636 km2 in 2014 (Figure 4A, gray line), showing the same pattern as the maximum extension of total built-up area. We then quantify the temporal evolution of built-up areas (total, flooded and not-flooded) by using a linear regression model. Average annual increments of built-up areas (in relative terms) are equal to 4.17%/year (R2 = 0.91), 3.2%/year (R2 = 0.90) and 4.29%/year (R2 = 0.91) for total, flooded and not-flooded built-up areas, respectively. Our results confirm that flood exposure increased over the past four decades (Hu et al., 2018; Merz et al., 2021), despite the relative temporal invariance of flood hazard (see Figure 3B, cumulative sub-periods). Not-flooded built-up areas show larger relative annual increments compared to flooded built-up areas, which could possibly drive an increase in flood risk in the near future.
To further support our results, we analyze the total number of people in the MDB, by using GHS-POP data from the GHSL dataset (Schiavina et al., 2019), also differentiating between flooded and not-flooded locations (Supplementary Figure 2). A similar overall pattern is found, thus supporting the use of built-up data as a proxy of human presence. Yet, minor differences between built-up and population datasets emerge. For instance, the marked increment of built-up areas from 1975 to 1990 (higher than subsequent increments) is not observed in population data. This could be explained by a large land conversion up to 1990, not accompanied by a comparable demographic trend. Also, this difference may depend on the intrinsic characteristics of the population dataset, where population data in 1975, 1990 and 2014 was derived from the NASA-CIENSIN Gridded Population of the World dataset (Center for International Earth Science Information Network (CIESIN), 2016) in 2010, by applying an exponential model and by using built-up data.
Since we observe a lower relative increment of built-up areas in previously flooded locations compared to not-flooded built-up areas (i.e., nearly 43% difference within the whole study period), we test if a flood memory behavior can be detected across the MDB. Despite the huge flood event in 1974, a large increment of built-up areas across locations affected by flood events was observed afterwards, thus revealing a very low flood memory behavior (green line in Figure 5). Indeed, historically several flood mitigation structures and water supply dams were built across MDB, which induced people to over rely on structural measures rather than flood risk awareness to reduce human exposure to floods (Cook, 2017). Conversely, when considering the flooded area up to 1990 and 2000, our results seem to suggest a stronger flood memory type behavior (orange and yellow lines in Figure 5), as shown by the lower increase of built-up areas.
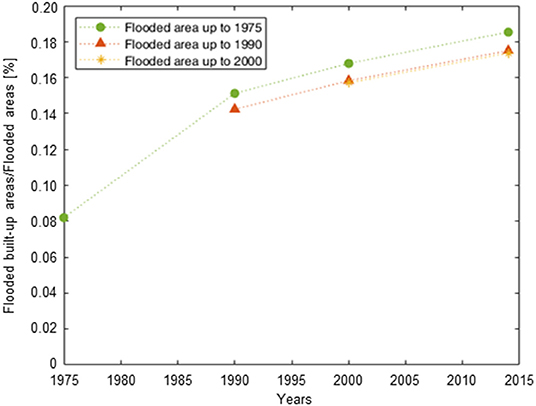
Figure 5. Flood memory assessment across the MDB from 1973 to 2014: temporal evolution of the ratio between built-up areas in previously flooded areas and flooded areas (as %) up to 1975 (green circles), up to 1990 (orange triangles), up to 2014 (yellow stars).
We finally analyze long-term dynamics of flood risk (Figure 6), as categorized values following the percentile-based classification of flood hazard and exposure (Figure 1), and quantify flood risk as the overall extension of built-up areas flooded in a given sub-period. Regardless of flood risk classes, the areas at risk increase in time from 75.34 km2 in 1975 to 136.77 km2 in 2014. Despite the differences in terms of absolute values across risk classes, due to increasing percentages of built-up surface from R1 to R4 (see Figure 1), we find that R1, R2 and R3 classes are characterized by a hump-shaped temporal trend, with a peak in 2000 for R1 and in 1990 for R2 and R3. This outcome might suggest a reduction or a stabilization within the whole study period of the built-up area at risk, for low risk classes. Conversely, class R4 more than doubled its overall built-up area from 1975 to 2014, clearly indicating a marked increase of the areas at high flood risk. This increasing pattern is mainly influenced by increasing built-up areas, since flooded areas decreased in time.

Figure 6. Flood risk assessment, as categorized values derived from the percentile-based classification of flood hazard and exposure, across the MDB from 1973 to 2014: temporal evolution of the overall extension of built-up areas at risk in each flood risk class (in km2), as defined in Figure 1. The inset shows a zoom for classes R1 and R2.
Conclusions
In this study, we coupled a large-scale 2-D hydrodynamic model with remotely sensed built-up data to assess high-resolution long-term dynamics of flood risk and its components in the Murray-Darling Basin (MDB) within a 42-year long time period (from 1973 to 2014). In particular, we analyzed the frequency of occurrence of flood events and the temporal evolution of the maximum extension of flooded areas and built-up areas, the combination of which allows for a detailed assessment of flood exposure, flood memory and flood risk.
The following findings are of importance:
1. The maximum extension of flooded areas decreases in time, without revealing any significant geographical transfer of inundated areas across the study period. In particular, recurrently inundated gridded areas present an invariant pattern in time, whereas a remarkable reduction is typical of infrequently inundated locations.
2. Our analysis shows that the maximum extension of built-up areas increased over the past four decades, even though only <2.5% of built-up grid cells shows at least half of their surface built-up. Larger annual increments of built-up surfaces (in relative terms) are typical of not-flooded built-up locations compared to flooded built-up areas.
3. When testing if previous flood events could have influenced the subsequent built-up expansion, we find a lower increase of built-up areas in previously flooded locations after 1990, which might suggest a flood memory pattern.
4. We finally combine flood hazard and exposure to assess categories of flood risk and find that areas classified at high risk for flood more than doubled their spatial extension during the past 40 years. Conversely, areas at lower risk for flood present an invariant or even decreasing trend in time.
Despite a few limitations (e.g., reservoir dynamics not included in the modeling framework, a simple method for assessing flood memory), our study supports the analysis of long-term dynamics of flood risk and its components at a large scale by combining different perspectives in an innovative way. More specifically, our results clearly point out that long-term dynamics of flood risk across the MDB are mainly driven by the temporal evolution of built-up areas, since flood hazard appears to be more or less invariant in time. Thus, adopting an urban development plan that explicitly incorporates strategies and actions for improving flood risk awareness would seem to be highly beneficial for reducing flood risk in the near future.
Data Availability Statement
The raw data supporting the conclusions of this article will be made available by the authors, without undue reservation.
Author Contributions
GS performed hydraulic simulations. SC performed the analysis and wrote the first draft of the manuscript. AD wrote section 2-D hydrodynamic model for flood hazard assessment of the manuscript. All authors discussed the results, contributed to manuscript revision, conception and design of the study, read, and approved the submitted version.
Conflict of Interest
The authors declare that the research was conducted in the absence of any commercial or financial relationships that could be construed as a potential conflict of interest.
Publisher's Note
All claims expressed in this article are solely those of the authors and do not necessarily represent those of their affiliated organizations, or those of the publisher, the editors and the reviewers. Any product that may be evaluated in this article, or claim that may be made by its manufacturer, is not guaranteed or endorsed by the publisher.
Acknowledgments
The authors gratefully thank Piera Colanzi for preliminary analysis.
Supplementary Material
The Supplementary Material for this article can be found online at: https://www.frontiersin.org/articles/10.3389/frwa.2021.797259/full#supplementary-material
References
Aerts, J. C. J. H., Botzen, W. J., Clarke, K. C., Cutter, S. L., Hall, J. W., Merz, B., et al. (2018). Integrating human behaviour dynamics into flood disaster risk assessment. Nat. Clim. Change 8, 193–199. doi: 10.1038/s41558-018-0085-1
Barnes, J. (2017). The future of the Nile: climate change, land use, infrastructure management, and treaty negotiations in a transboundary river basin. Wiley Interdiscip. Rev. 8:e449. doi: 10.1002/wcc.449
Bates, P. D., Horritt, M. S., and Fewtrell, T. J. (2010). A simple inertial formulation of the shallow water equations for efficient two dimensional flood inundation modelling. J. Hydrol. 387, 33–45. doi: 10.1016/j.jhydrol.2010.03.027
Bernhofen, M. V., Trigg, M. A., Sleigh, P. A., Sampson, C. C., and Smith, A. M. (2021). Global flood exposure from different sized rivers. Nat. Hazards Earth Syst. Sci. 21, 2829–2847. doi: 10.5194/nhess-21-2829-2021
Bishop-Taylor, R., Tulbure, M. G., and Broich, M. (2018). Evaluating static and dynamic landscape connectivity modelling using a 25-year remote sensing time series. Landsc. Ecol. 33, 625–640. doi: 10.1007/s10980-018-0624-1
Bunn, S. E., Thoms, M. C., Hamilton, S. K., and Capon, S. J. (2006). Flow variability in dryland rivers: Boom, bust and the bits in between. River Res. Appl. 22, 179–186. doi: 10.1002/rra.904
Center for International Earth Science Information Network (CIESIN) (2016). Gridded Population of the World, Version 4 (GPWv4): Population Count, NASA Socioeconomic Data and Applications Center (SEDAC) [Dataset]. New York, NY: Columbia University.
Ceola, S., Laio, F., and Montanari, A. (2014). Satellite nighttime lights reveal increasing human exposure to floods worldwide. Geophys. Res. Lett. 41, 7184–7190. doi: 10.1002/2014GL061859
Cook, M. (2017). The Australia Day Floods, January 1974. Environment & Society Portal, Arcadia, 15. Munich: Rachel Carson Center for Environment and Society.
Corbane, C., Florczyk, A., Pesaresi, M., Politis, P., and Syrris, V. (2018). GHS Built-Up Grid, Derived From Landsat, Multitemporal (1975-1990-2000-2014), R2018A. Ispra: European Commission, Joint Research Centre (JRC). Available online at: http://data.europa.eu/89h/jrc-ghsl-10007 (accessed February 06, 2020).
de Moel, H., Aerts, J. C. J. H., and Koomen, E. (2011). Development of flood exposure in the Netherlands during the 20th and 21st century. Global Environ. Change 21, 620–627. doi: 10.1016/j.gloenvcha.2010.12.005
Domeneghetti, A., Carisi, F., Castellarin, A., and Brath, A. (2015). Evolution of flood risk over large areas: quantitative assessment for the Po river. J. Hydrol. 527, 809–823, doi: 10.1016/j.jhydrol.2015.05.043
Dottori, F., Salamon, P., Bianchi, A., Alfieri, L., Hirpa, F. A., and Feyen, L. (2016). Development and evaluation of a framework for global flood hazard mapping. Adv. Water Resour. 94, 87–102. doi: 10.1016/j.advwatres.2016.05.002
Duan, W., He, B., Nover, D., Fan, J., Yang, G., Chen, W., et al. (2016). Floods and associated socioeconomic damages in China over the last century. Nat. Hazards 82, 401–413. doi: 10.1007/s11069-016-2207-2
EU Floods Directive (2007). Directive 2007/60/EC of the European Parliament and of the Council of 23 October 2007 on the Assessment and Management of Flood Risks. Copenhagen: European Environment Agency.
Facebook Connectivity Lab, and Center for International Earth Science Information Network (CIESIN). (2016). High Resolution Settlement Layer (HRSL). Palisades, NY: Center for International Earth Science Information Network.
Gallant, A. J. E., Kiem, A. S., Verdon-Kidd, D. C., Stone, R. C., and Karoly, D. J. (2012). Understanding hydroclimate processes in the Murray-Darling Basin for natural resources management. Hydrol. Earth Syst. Sci. 16, 2049–2068. doi: 10.5194/hess-16-2049-2012
Garde-Hansen, J., McEwen, L., Holmes, A., and Jones, O. (2017). Sustainable flood memory: remembering as resilience. Mem. Stud. 10, 384–405, doi: 10.1177/1750698016667453
Grimaldi, S., Schumann, G. J. P., Shokri, A., Walker, J. P., and Pauwels, V. R. N. (2019). Challenges, opportunities and pitfalls for global coupled hydrologic-hydraulic modeling of floods. Water Resour. Res. 55, 5277–5300. doi: 10.1029/2018WR024289
Gupta, S. C., Kessler, A. C., Brown, M. K., and Zvomuya, F. (2015). Climate and agricultural land use change impacts on streamflow in the upper midwestern United States. Water Resour. Res. 51, 5301–5317. doi: 10.1002/2015WR017323
Heimhuber, V., Tulbure, M. G., and Broich, M. (2016). Modeling 25 years of spatio-temporal surface water and inundation dynamics on large river basin scale using time series of earth observation data, Hydrol. Earth Syst. Sci. 20, 2227–2250, doi: 10.5194/hess-20-2227-2016
Hirabayashi, Y., Mahendran, R., Koirala, S., Konoshima, L., Yamazaki, D., Watanabe, S., et al. (2013). Global flood risk under climate change. Nat. Clim. Change 3, 816–821. doi: 10.1038/nclimate1911
Hu, P., Zhang, Q., Shi, P. J., Chen, B., and Fang, J. Y. (2018). Flood-induced mortality across the globe: spatiotemporal pattern and influencing factors. Sci. Total Environ. 643, 171–182. doi: 10.1016/j.scitotenv.2018.06.197
IPCC (2012). “Glossary of terms,” in Managing the Risks of Extreme Events and Disasters to Advance Climate Change Adaptation. A Special Report of Working Groups I and II of the Intergovernmental Panel on Climate Change. Cambridge University Press, Cambridge, United Kingdom; New York, NY, United States.
IPCC (2021). Climate Change 2021: The Physical Science Basis. Contribution of Working Group I to the Sixth Assessment Report of the Intergovernmental Panel on Climate Change. Cambridge University Press, Cambridge, United Kingdom; New York, NY, United States (in press).
Jonkman, S. N., and Kelman, I. (2005). An analysis of the causes and circumstances of flood disaster deaths. Disasters 29, 75–97. doi: 10.1111/j.0361-3666.2005.00275.x
Kam, P. M., Aznar-Siguan, G., Schewe, J., Milano, L., Ginnetti, J., Willner, S., et al. (2021). Global warming and population change both heighten future risk of human displacement due to river floods. Environ. Res. Lett. 16:044026. doi: 10.1088/1748-9326/abd26c
Kreibich, H., Seifert, I., Thieken, A. H., Lindquist, E., Wagner, K., and Merz, B. (2011). Recent changes in flood preparedness of private households and businesses in Germany. Reg. Environ. Change 11, 59–71. doi: 10.1007/s10113-010-0119-3
Lee, S., Kim, J.-C., Jung, H.-S., Lee, M. J., and Lee, S. (2017). Spatial prediction of flood susceptibility using random-forest and boosted-tree models in Seoul metropolitan city, Korea, Geomatics. Nat. Hazards Risk 8, 1185–1203, doi: 10.1080/19475705.2017.1308971
Lehner, B., and Döll, P. (2004). Development and validation of a global database of lakes, reservoirs and wetlands. J. Hydrol. 296, 1–22, doi: 10.1016/j.jhydrol.2004.03.028
Leyk, S., Gaughan, A. E., Adamo, S. B., de Sherbinin, A., Balk, D., Freire, S., et al. (2019). The spatial allocation of population: a review of large-scale gridded population data products and their fitness for use. Earth Syst. Sci. Data 11, 1385–1409. doi: 10.5194/essd-11-1385-2019
Lloyd, C. T., Chamberlain, H., Kerr, D., Yetman, G., Pistolesi, L., Stevens, F. R., et al. (2019). Global spatio-temporally harmonised datasets for producing high-resolution gridded population distribution datasets. Big Earth Data 3, 108–139. doi: 10.1080/20964471.2019.1625151
Martens, B., Miralles, D. G., Lievens, H., van der Schalie, R., de Jeu, R. A. M., Fernández-Prieto, D., et al. (2017). GLEAM v3: satellite-based land evaporation and root-zone soil moisture. Geosci. Model Dev. 10, 1903–1925. doi: 10.5194/gmd-10-1903-2017
Merz, B., Blöschl, G., Vorogushyn, S., Dottori, F., Aerts, J. C. J. H., Bates, P., et al. (2021). Causes, impacts and patterns of disastrous river floods. Nat. Rev. Earth Environ. 2, 592–609. doi: 10.1038/s43017-021-00195-3
Merz, B., Hall, J., Disse, M., and Schumann, A. (2010). Fluvial flood risk management in a changing world. Nat. Hazards Earth Syst. Sci. 10, 509–527, doi: 10.5194/nhess-10-509-2010
Murray-Darling Basin Authority (2020). Basin Plan Annual Report. Canberra, ACT: Australian Government.
Neal, J., Schumann, G. J.-P., and Bates, P. D. (2012). A subgrid channel model for simulating river hydraulics and floodplain inundation over large and data sparse areas. Water Resour. Res. 48, 1–16,. doi: 10.1029/2012W.R.012514
NOAA - Earth Observation Group (2016). Version 4 DMSP-OLS Nighttime Lights Time Series. Available online at: http://ngdc.noaa.gov/eog/dmsp/downloadV4composites.html (accessed March 09, 2017).
Palacios-Lopez, D., Bachofer, F., Esch, T., Heldens, W., Hirner, A., Marconcini, M., et al. (2019). New perspectives for mapping global population distribution using world settlement footprint products. Sustainability 11:6056. doi: 10.3390/su11216056
Pappenberger, F., Dutra, E., Wetterhall, F., and Cloke, H. (2012). Deriving global flood hazard maps of fluvial floods through a physical model cascade. Hydrol. Earth Syst. Sci. 16, 4143–4156. doi: 10.5194/hess-16-4143-2012
Penton, D., and Overton, I. (2007). “Spatial modelling of floodplain inundation combining satellite imagery and elevation models,” in Paper presented at the MODSIM 2007 International Congress on Modelling and Simulation, Modelling and Simulation Society of Australia and New Zealand CSIRO (Clayton South, VIC).
Ridolfi, E., Albrecht, F., and Di Baldassarre, G. (2020). Exploring the role of risk perception in influencing flood losses over time. Hydrol. Sci. J. 65, 12–20. doi: 10.1080/02626667.2019.1677907
Rudari, R., Silvestro, F., Campo, L., Rebora, N., Boni, G., and Herold, C. (2015). Improvement of the Global Flood Model for the GAR 2015. Geneva: United Nations.
Samela, C., Troy, T. J., and Manfreda, S. (2017). Geomorphic classifiers for flood-prone areas delineation for data-scarce environments. Adv. Water Resour. 102, 13–28. doi: 10.1016/j.advwatres.2017.01.007
Sampson, C. C., Smith, A. M., Bates, P. B., Neal, J. C., Alfieri, L., and Freer, J. E. (2015). A high-resolution global flood hazard model. Water Resour. Res. 51, 7358–7381. doi: 10.1002/2015WR016954
Schiavina, M., Freire, S., and MacManus, K. (2019). GHS population grid multitemporal (1975, 1990, 2000, 2015) R2019A. Ispra: European Commission, Joint Research Centre (JRC). Availablee online at: http://data.europa.eu/89h/0c6b9751-a71f-4062-830b-43c9f432370f (accessed January 14, 2019).
Schumann, G. J.-P., Stampoulis, D., Smith, A. M., Sampson, C. C., Andreadis, K. M., Neal, J. C., et al. (2016). Rethinking flood hazard at the global scale. Geophys. Res. Lett. 43, 249–256, doi: 10.1002/2016GL070260
Scussolini, P., Aerts, J. C. J. H., Jongman, B., Bouwer, L. M., Winsemius, H. C., de Moel, H., et al. (2016). FLOPROS: an evolving global database of flood protection standards. Nat. Hazards Earth Syst. Sci. 16, 1049–1061. doi: 10.5194/nhess-16-1049-2016
Simard, M., Pinto, N., Fisher, J. B., and Baccini, A. (2011). Mapping forest canopy height globally with spaceborne lidar. J. Geophys. Res. 116:G04021. doi: 10.1029/2011JG001708
Tanoue, M., Hirabayashi, Y., and Ikeuchi, H. (2016). Global-scale river flood vulnerability in the last 50 years. Sci. Rep. 6:36021. doi: 10.1038/srep36021
Tavares da Costa, R., Zanardo, S., Bagli, S., Hilberts, A. G. J., Manfreda, S., Samela, C., et al. (2020). Predictive modeling of envelope flood extents using geomorphic and climatic-hydrologic catchment characteristics. Water Resour. Res. 56:e2019WR026453. doi: 10.1029/2019WR026453
Tellman, B., Sullivan, J. A., Kuhn, C., Kettner, A. J., Doyle, C. S., Brakenridge, G. R., et al. (2021). Satellite imaging reveals increased proportion of population exposed to floods. Nature 596, 80–86, doi: 10.1038/s41586-021-03695-w
Viglione, A., Merz, B., Viet Dung, N., Parajka, J., Nester, T., and Blöschl, G. (2016). Attribution of regional flood changes based on scaling fingerprints. Water Resour. Res. 52, 5322–5340, doi: 10.1002/2016WR019036
Winsemius, H., Aerts, J., van Beek, L., Bierkens, M. F. P., Bouwman, A., Jongman, B., et al. (2016). Global drivers of future river flood risk. Nat. Clim. Change 6, 381–385, doi: 10.1038/nclimate2893
Winsemius, H. C., Van Beek, L. P. H., Jongman, B., Ward, P. J., and Bouwman, A. (2013). A framework for global river flood risk assessments. Hydrol. Earth Syst. Sci. 17, 1871–1892. doi: 10.5194/hess-17-1871-2013
Keywords: flood hazard, flood exposure, flood memory, satellite and model data, Murray-Darling basin (MDB), long-term
Citation: Ceola S, Domeneghetti A and Schumann GJP (2022) Unraveling Long-Term Flood Risk Dynamics Across the Murray-Darling Basin Using a Large-Scale Hydraulic Model and Satellite Data. Front. Water 3:797259. doi: 10.3389/frwa.2021.797259
Received: 18 October 2021; Accepted: 21 December 2021;
Published: 17 January 2022.
Edited by:
Mariele Evers, University of Bonn, GermanyReviewed by:
Maurizio Mazzoleni, Uppsala University, SwedenWeili Duan, Xinjiang Institute of Ecology and Geography, Chinese Academy of Sciences (CAS), China
Copyright © 2022 Ceola, Domeneghetti and Schumann. This is an open-access article distributed under the terms of the Creative Commons Attribution License (CC BY). The use, distribution or reproduction in other forums is permitted, provided the original author(s) and the copyright owner(s) are credited and that the original publication in this journal is cited, in accordance with accepted academic practice. No use, distribution or reproduction is permitted which does not comply with these terms.
*Correspondence: Serena Ceola, c2VyZW5hLmNlb2xhQHVuaWJvLml0