 Soham Adla
 Surya Gupta
 Sri Harsha Karumanchi3
 Markus Disse
 Saket Pande
- 1Chair of Hydrology and River Basin Management, TUM School of Engineering and Design, Technical University of Munich, Munich, Germany
- 2Soil and Terrestrial Environmental Physics, Institute of Biogeochemistry and Pollutant Dynamics, Department of Environmental Systems Science, ETH Zurich, Zurich, Switzerland
- 3Kritsnam Technologies Pvt. Ltd., Hyderabad, India
- 4Hydraulics and Water Resources Engineering, Department of Civil Engineering, Indian Institute of Technology Kanpur, Kanpur, India
- 5Department of Water Management, Faculty of Civil Engineering and Geoscience, Delft University of Technology, Delft, Netherlands
Low technology adoption through agricultural extension may be a consequence of providing generic information without sufficient adaptation to local conditions. Data-rich paradigms may be disruptive to extension services and can potentially change farmer-advisor interactions. This study fills a gap in pre-existing, generic advisory programs by suggesting an approach to “diagnose” farm-specific agricultural issues quantitatively first in order to facilitate advisors in developing farm-centric advisories. A user-friendly Farm Agricultural Diagnostics (FAD) tool is developed in Microsoft Excel VBA that uses farmer surveys and soil testing to quantify current agricultural performance, classify farms into different performance categories relative to a localized performance target, and visualize farm performance within a user-friendly interface. The advisory diagnostics approach is tested in Kanpur, representative of an intensively managed rural landscape in the Ganga river basin in India. The developed open-source tool is made available online to generate data-based agricultural advisories. During the field testing in Kanpur, the tool identifies 24% farms as nutrient-limited, 34% farms as water-limited, 27% farms with nutrient and water co-limitations, and the remaining farms as satisfactory compared to the localized performance target. It is recommended to design advisories in terms of water and nutrient recommendations which can fulfill the farm needs identified by the tool. The tool will add data-based value to pre-existing demand based advisory services in agricultural extension programs. The primary users of the tools are academic, governmental and non-governmental agencies working in the agricultural sector, whose rigorous scientific research, soil testing capacity, and direct stakeholder engagement, respectively, can be harnessed to generate more data-based and customized advisories, potentially improving farmer uptake of agricultural advisories.
1. Introduction
Agricultural production and yields in developing countries have been lower than those of developed countries over the past few decades. Amongst its many reasons is the relative underutilization of improved agricultural technologies (Aker, 2011). Agricultural technologies, along with agricultural knowledge are disseminated using agricultural extension services (or advisories) by governments and international organizations to farmers and rural inhabitants worldwide (Anderson and Feder, 2007; Nyarko and Kozári, 2021). Advisories can be crucial to enhance productivity, increase food security, improve rural livelihoods, and promote agriculture as a “pro-poor economic growth engine” (IFPRI, 2020). Particularly for smallholders, agricultural extension can facilitate a break from the vicious cycle of low productivity, vulnerability, and poverty (Davis and Franzel, 2018).
Despite considerable investment and experience over decades (Anderson and Feder, 2007), there has been limited evidence to support the impact of agricultural extension on agricultural knowledge, technology adoption and improved productivity (Aker, 2011). Over time, governments of developed countries have reduced direct investments in agricultural extension (Laurent et al., 2006; Rivera, 2011). Moreover, in the developing world, agricultural extension has been described as “failing” (Government of Malawi, 2000), “moribund” (Eicher, 2001), “in disarray or barely functioning at all” (Rivera et al., 2001), or ineffective in responding to farmer demands and technological challenges (Ahikiriza et al., 2021). Factors like wealth, risk preferences, education, access and affordability of information and learning (Aker, 2011) can result in technology adoption slowing down and becoming more discontinuous, further threatening agricultural productivity (Oduniyi, 2021).
Agricultural extension's transfer-of-technology approach, where farmers are “passive recipients” of uniformly administered advisories (Leeuwis and Van den Ban, 2004), has been criticized due to its negligence of the “locally specific nature of knowledge construction” (Klerkx and Jansen, 2010). New data-rich paradigms in agriculture may also be disruptive to extension services (Nettle et al., 2018) as they change traditional farmer-advisor interactions with complex backend processes of data collation and interpretation (Eastwood et al., 2019).
Globally, this shift toward data-driven extension initiatives is quite evident. In developed countries, such as Australia, New Zealand and Canada, data-driven smart farming has been incorporated into dairy farming (Vasseur et al., 2010; Gargiulo et al., 2018; Rue et al., 2019). Data-based tools have been developed for cropping and viticulture management (Bramley, 2009), evapotranspiration-based irrigation scheduling in the western United States (Bartlett et al., 2015), and irrigation scheduling using automated sensors operating within an IoT-framework (Severino et al., 2018). In developing countries like Afghanistan, the Information and Communication Technologies (ICT) platform “eAfghan” enables extension workers, farmers and other stakeholders to share reliable agricultural extension information (Bell, 2013). The agricultural advisory platform “Farmstack” integrates farm-level data, local weather, input availability and market information in Ethiopia (Digital Green, 2019). In India, advisories about weather and disease forecasts, markets and other information are sent by SMS or voice message alerts by agencies such as the farm science centers (Krishi Vigyan Kendras) (Saravanan, 2010; Das et al., 2016), IFFCO Kissan Sanchar Limited (IKSL) and Reuters Market Light (USAID, 2000; Fafchamps and Minten, 2012).
However, most of these initiatives deliver generic information rather than data-driven advisories customized to the specific farm plot or crop (Ganesan et al., 2013), which is one of the major reasons for low technology adoption through extension services (Aker, 2011). The primary sources that drive decision making about agricultural practices among farmers in developing countries are still their own observations and experimentations, followed by conversations with other farmers (Fafchamps and Minten, 2012). A review of agricultural extension approaches in India reveals that the farmers generally struggle to receive reliable information relevant to them at the right time (Glendenning et al., 2010). Moreover, the lack of adequate interactions between research, extension organizations and the farmers has led to the generation of non-specific advisory services (Feder et al., 2010). Nonetheless, data driven tools utilized for smart farming, including the collection and use of more digital data (Wolfert et al., 2017), sensors measuring animal, plant, soil and water parameters (Rutten et al., 2013; Hostiou et al., 2017; Neethirajan, 2017; Eastwood et al., 2019), and online data platforms, can potentially lead to more effective farmer-advisor interactions through tactical use of data, and administer strategic farm management advisories (Eastwood et al., 2015).
This study aims to address the limitations of generic data-driven extension tools by suggesting an approach to inform advisors to “diagnose” farm-specific agricultural issues more quantitatively. The working assumption for the approach is that yield gaps (the difference between observed yields and region-specific attainable yields) occur either due to nutrient or water related limitation (or co-limitations). This is reasonable for food crops such as wheat, rice and maize in many developing nations such as India (Mueller et al., 2012). Performance related to soil nutrient status can be assessed with soil testing and computing a Soil Quality Index (SQI) indicator which combines multiple soil parameters into a single performance score (Karlen et al., 1997). Performance related to water as a limiting factor to yield gaps can be evaluated using an indicator such as Water Use Efficiency (WUE, in kg/m3) (Van Halsema and Vincent, 2012), which has been applied by irrigation specialists to describe “how effectively water is delivered to crops” and “to indicate the amount of water wasted” (Molden et al., 2010).
The proposed approach estimates the respective farm-level performances of soil nutrient and water indicators, and combines the relative performances of multiple farms in a particular region into an integrated visualization. A corresponding user-friendly Farm Agricultural Diagnostics (FAD) tool was developed using Macro-in-Excel feature of Microsoft Office's Excel software to carry out these calculations, generate a performance-based visualization, and automate agricultural advisory diagnostics. The approach is then applied in a pilot study case representative of intensively managed rural landscapes (IMRLs) in the food critical Ganga river basin of North India.
2. Materials and Methods
2.1. Study Area
The diagnostics approach is tested in a smallholder dominated Intensively Managed Rural Landscape (IMRL) representative of the Ganga River Basin in Kanpur (Bilhaur tehsil, Kanpur Nagar district, Uttar Pradesh), India. The study area (Figure 1) is part of a Critical Zone Observatory created by the Indian Institute of Technology Kanpur in 2016 in the IMRL (Gupta et al., 2017, 2019). It lies between the Lower Ganga Canal distribution system and the Pandu river, a tributary of the Ganga river. Agricultural practices are typically monocropping (with alternating monsoon paddy and winter wheat crops), and flood irrigation is carried out using either canal distributaries which flow into the study region, or using groundwater (GW) abstracted by diesel pumps.
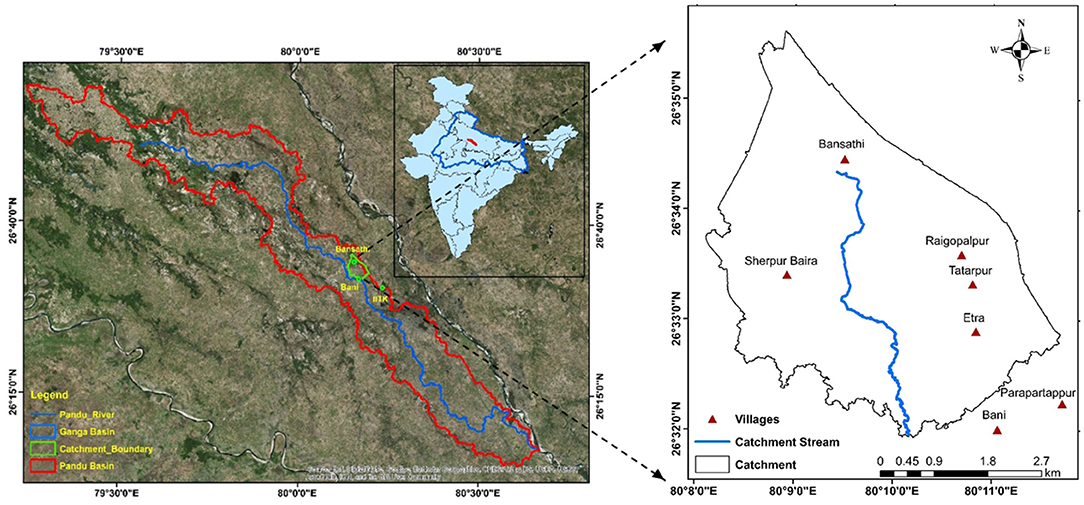
Figure 1. The study area (shown within the green “catchment boundary”) for advisory diagnostics approach, in Kanpur (Uttar Pradesh, India). Image modified from Gupta et al. (2019).
2.2. Validating the Working Assumption Using Farmer Surveys
The working assumption that “yield gaps” can be explained by nutrient-related or water-related limitations (or co-limitations) (Mueller et al., 2012) is validated using inferences from an interview-based survey in the study area. 144 farmer-respondents were interviewed in 2018 through random sampling from the five villages of Bani, Bansathi, Etra, Parapratappur, Raigopalpur, Sherpur Baira and Tatarpur, which had a total population of 8,887 (Government of India, 2011).
Farmers were asked questions about their demands and preferences related to agricultural advisories, to validate whether the impact of nutrient and water limitations on yield gaps (Mueller et al., 2012) is also felt by farmers. Questions aimed to derive the perceived importance of different advisory parameters (input application and irrigation scheduling, weather forecast for rainfall, soil testing), and preferred means of receiving advisory (text message, voice message, phone call). The complete list of questions is included in Section 1 of the Supplementary Material. The developed survey was incorporated into the public domain software package, Census and Survey Processing System (CSPro) (United States Census Bureau, 2000), and the mobile phone application “CSEntry” was used on the field for efficient and convenient data collection.
2.3. Selecting Indicators to Quantify Farm Performance
The performance indicators used to quantify the current performance are based on the two major factors resulting in yield gaps: soil nutrients and water.
2.3.1. Soil Related Performance Indicator: Soil Quality Index (SQI)
Soil Quality Index (SQI) (Karlen et al., 1997) is the performance indicator used to quantify the soil-nutrient status. It is computed as a weighted sum of individual soil parameter scores (or values). The weights are determined based on the literature and expert opinion (Lee et al., 2006). The formula of SQI is given below (Wu and Wang, 2007):
where Wi= weight of the ith parameter
Si= score of the ith parameter (here, the normalized parameter value)
n= number of total parameters
Multi-Criteria Decision Making (MCDM) methods are used to assign weights in SQI computation (Mishra et al., 2015). In this study, the scores and weights are assigned to the soil properties using Analytical Hierarchy Process (AHP) (Saaty, 1977, 1987). It is a widely used MCDM process (Alharthi et al., 2015; Kil et al., 2016) and has been applied to assess and enhance soil quality through improved soil management practices (Kalambukattu et al., 2018; Kumar et al., 2019). AHP can generate indicator weights based on pairwise comparisons of all relevant indicators made by experts, while also reducing biases in the decision-making process by checking for consistency in the decision maker's evaluations. Though the decision maker's subjective involvement in assigning weights or assessing attributes leads to more flexibility, it can lead to different solutions based on different relative prioritizations (Kumar et al., 2017), which reinforces the importance of selecting domain knowledge experts for the approach. Section 2 in the Supplementary Material describes the AHP methodology in further detail.
2.3.2. Water Related Performance Indicator: Water Use Efficiency (WUE)
Water Use Efficiency (WUE, in kg/m3) is defined as the ratio of agricultural production (yield per unit area, kg/ha) to the gross water application or availability at the field (mm), inclusive of both precipitation and irrigation water (Van Halsema and Vincent, 2012).
WUE has been interpreted as a combination of efficiency and productivity ratios (Van Halsema and Vincent, 2012). Its idea is motivated by the need to meet increasing food requirements with limited water resources by maximizing the production per unit of available water (De Fraiture and Wichelns, 2010; De Fraiture et al., 2010; Van Halsema and Vincent, 2012). WUE is used here as a measure of “localized efficiency” (Van Halsema and Vincent, 2012), which is appropriate in the context of this study, since it focuses on the farmer's perspective of the efficient allocation of input water (and consequently economic inputs).
2.4. Data Collection to Compute Performance Indicators
The specific villages chosen for the survey and soil testing were Bani, Bansathi, Etra, Parapratappur, Raigopalpur, Sherpur Baira and Tatarpur. The objective was to capture a range of SQIs and WUEs with a systematic sampling methodology (Fowler, 2014). Further, a GIS database was developed to visualize the survey and soil data. This helped in understanding the spatial spread of the current “problem areas”, which can potentially guide applied research, as well as more targeted delivery of the generated advisory.
2.4.1. Soil Sampling and Testing to Compute SQI
Soil testing was conducted for 100 farmers in 2018 by the Uttar Pradesh State Agricultural Department. Soil samples were collected in the manner recommended by the Department of Agriculture, Cooperation & Farmers Welfare. Government guidelines recommend sample collection on a grid basis with grid area of 2.5 ha for irrigated areas (Kaur et al., 2020). For this study, the spatial resolution was increased substantially by collecting five soil samples from each farm (instead of each 2.5 ha). Five soil samples were collected from the top 15 cm (four from farm corners and one from the center). The samples were subsequently mixed to conduct physio-chemical analyses. The parameters which were tested were physical parameters (pH, EC), macronutrients (SOC, N, P and K), and micronutrients (S and Zn).
2.4.2. Data for Water Use Efficiency (WUE)
Data regarding wheat yield and number of irrigations, corresponding to the previous winter cropping season (rabi 2018, from November to April), were collected from 67 farmers, to generate a database of baseline water related data. Consequently, WUE was computed assuming traditional practices of irrigation depths of 7.5 cm (per irrigation application) for the wheat crop (Prihar et al., 1978) in India. Rainfall over the cropping season was assumed constant for all the farms (since the study area has relatively flat topography with areal coverage of less than 12 km2), and measured monthly rainfall data from November 2017 to April 2018 (total rainfall of 2.2 cm) were used in addition to data about irrigation application and yields reported by farmers during the surveys. WUE was finally computed by dividing the yield values with the gross amount of water applied (total rainfall and cumulative irrigation during the cropping season).
2.5. Integrated Visualization: Quantification and Classification of Overall Farm Performance
A scatter plot is generated combining the two performance indicators, resulting in a depiction of localized farm performance (Figure 2). The axes limits are determined by the ranges of the respective performance indicators obtained in the survey. The plot is subsequently divided based on the median values of the two indicators (derived from the entire farm dataset generated in Section 2.4). There are hence four classes formed, based on their respective performance zones, (i) Zone of satisfactory performance (S, top-right): with both high WUE and SQI, where there is an expectation of high overall performance, (ii) Nutrient limited zone (NL, top-left): with high WUE despite low SQI, and there may be crucial lessons to learn from such farmers, (iii) Water limited zone (WL, bottom-right): low WUE despite high SQI, where there are substantial opportunities to improve the water management practices, and (iv) Zone of co-limitations (NLWL, bottom-left): with both low WUE and SQI, within which there is low overall performance needing more focused advisory dissemination.
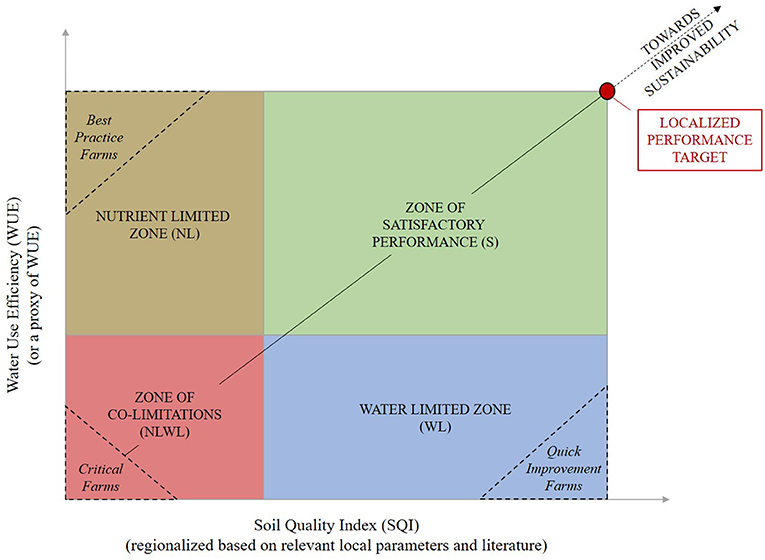
Figure 2. Classification of farms based on the two performance indicators (Soil Quality Index and Water Use Efficiency) associated with major yield gap limitations (nutrient, water, or both).
The top right corner of the scatter chart (red circle) represents a “Localized Performance Target” corresponding to the highest SQI and WUE indicators from the local farms. The emphasis here is that the result-oriented advisory development should be initially prepared to achieve “best” performance based on localized characteristics, and not the “best” performance based on global standards, which is a reasonable approach reported in the literature. For instance, soil quality can only be assessed appropriately within the context of its inherent properties, environmental influences (temperature and precipitation), and of “what the soil is being asked to do” (Andrews et al., 2004).
Further, the sub-categories of “Best Practice Farms,” “Critical Farms” and “Quick Improvement Farms” are proposed (which can be decided subjectively based on the spread of the scatter here shown in the corners for clear representation). “Best Practice Farms,” which despite low SQIs are able to achieve high WUEs through good traditional or modern water management strategies, can be identified to give crucial insights to other farmers, to enable community leadership and knowledge exchange. “Critical Farms,” with both low WUE and SQI would need immediate assistance, and may be prioritized as part of triage-based critical advisory administration. “Quick Improvement Farms,” which have low WUE despite having soils with high SQI, would be expected to show quickest improvements (in WUE) through simple water saving measures due to their pre-existing relative advantage in nutrient status. Additionally, a subjective selection of “High Performance Farms” (the best farms within the S-zone), can help in defining an Intermediate Performance Target which is localized and is based on an average of their respective performance indicators.
A GIS map is created corresponding to this zonal classification which helps in understanding the spatial distribution of the farms.
2.6. Recommendations Based on “Farm Performance Classification” to Customize Advisories
This step is necessary to customize the advisory content to suit a farm's current performance situation (the farm's position in the SQI-WUE plot in Figure 3) toward the realistic goal of the Localized Performance Target (top-right corner in Figure 3). If this target seems heuristically unrealistic, an Intermediate Target may be suggested, which is the average of “High Performance” farms.
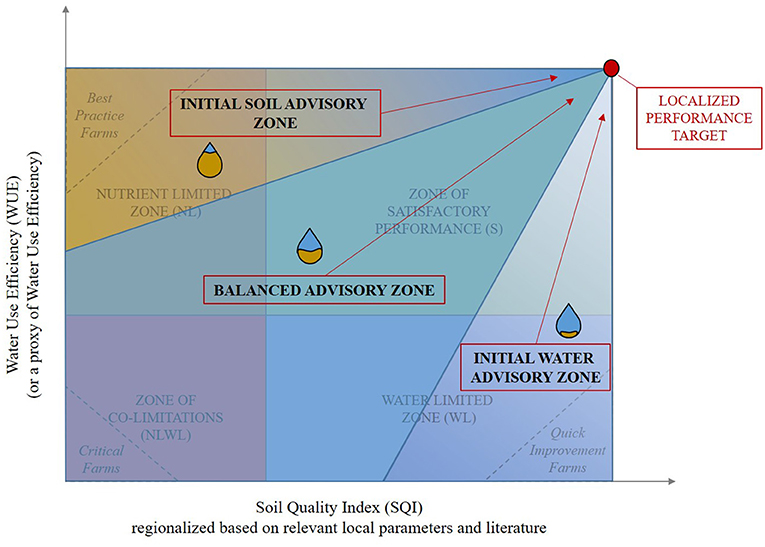
Figure 3. Performance class based advisory recommendations (with varying proportions of “blue” water vs. “brown” soil nutrient advisory “water droplet” content) based on the current situation relative to the Localized Performance Target (top right corner). Zones of water limitation (WL), nutrient limitation (NL), co-limitation (NLWL) and satisfactory performance (S) are shown within which critical farms, quick improvement farms and best practice farms are special sub-categories (introduced in Section 2.5).
For the sake of simplicity, three basic typologies of advisories based on the ratio of focus between water and nutrient related guidance are proposed. The “Initial soil advisory zone” initially focuses on improving soil nutrient properties, the “Initial water advisory zone” initially contains a higher proportion of water management related content, and the “Balanced advisory zone” has a balance of nutrient and water related advisory contents. Each of the zones tends to become a balanced advisory after observing improvements toward better overall performance, as indicated by the red arrows in Figure 3.
2.7. Development of the Farm Agricultural Diagnostics (FAD) Tool
The motivation for developing the FAD tool (Adla, 2021) is to aid agricultural extension service providers and professionals in allied sectors (NGOs, local governments) with a user-friendly tool for conducting agricultural advisory diagnostics. The tool is developed using the Macro-in-Excel Visual Basic for Applications (MEVBA) feature of Microsoft Office Suite's spreadsheet software MS Excel (Roman, 2002). MEVBA has the ability to incorporate scripts which are easy to maintain and also allow for expansion through its modular framework. Its dynamic formatting can be used to make the user interface more interactive, and yet it is a rather familiar software for collaboration (Yang and Ogunkah, 2013). In the FAD tool (Adla, 2021), MEVBA performs AHP calculations in the back-end by extracting data from dynamic input tables resulting in a well-ordered and tidy user interface.
The FAD tool (Adla, 2021) is free, user-friendly, and accessible in terms of its workflow. Its inputs include data for computing the SQI (results of soil quality testing on relevant parameters), heuristics to conduct relative comparisons between different soil quality parameters, and input data for computing WUE (crop yield, rainfall and applied irrigation during the cropping season). Its GUI can be used to generate a classification of the farm performance based on the diagnostics approach introduced in the study, and provide visual aids to promote a better understanding of the reported results. The resultant chart is easily exportable. The Farm-Agricultural-Diagnostics-tool version 1.0 has been archived as a Github repository (Adla, 2021), alongwith details pertaining to its features and operational instructions described using screenshots of the tool (https://github.com/soham-adla/Farm-Agricultural-Diagnostics-tool/blob/main/FAD-v1.0_Instruction-Manual.pdf).
3. Results
3.1. Validating the Working Assumption Using Farmer Surveys
In a reconnaissance survey conducted during 2018, farmers expressed concerns on irrigation amounts and timing. In the detailed survey subsequently undertaken, 141 out of 144 farmers expressed their need for an advisory on irrigation scheduling, and all farmers expressed their need for information on rainfall forecast, fertilizer application, and a need to test their soils regularly. This reinforced the working assumption that the major limiting factors to address yield gaps were soil and water related, as they were identified as major advisory requirements by farmers who are the ultimate beneficiaries of agricultural extension services.
3.2. Quantifying Farm Performance
3.2.1. Soil Related Performance Indicator: Soil Quality Index (SQI)
The final weights assigned to each soil parameter, based on the AHP methodology, are given in Table 1. Once the weights were assigned, the respective parameter values were converted into non-dimensional values lying between 0 and 100%, based on the linear scoring method (Liebig et al., 2001; Kumar et al., 2019) described in Section 2 of the Supplementary Material. The weights were then used in combination with the parameter values to compute the SQI of each soil sample collected (based on Equation 2).
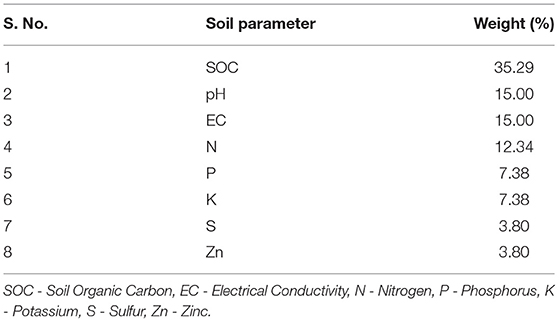
Table 1. Soil parameters and the respective weights assigned to compute SQI.
Figure 4 shows the spatial distribution of the farm scale SQI of 100 farms as part of the GIS database that was developed. Higher values of SQI indicate better soil performance or lower nutrient limitations. Soil properties exhibit spatial variability even at farmland scales (McBratney, 1997), and a comprehensive explanation of this variability would require a historical and current understanding of the physical, chemical and biological processes occurring in the farms (Santra et al., 2008), along with a broad knowledge of land use and management practices (Mouazen et al., 2003). Such a comprehensive database may not be readily available even with advisory institutions. Hence, it is important to conduct soil testing and compute SQI using local expertise as a prerequisite to the proposed advisory diagnostics approach, rather than attempting to address diverse soil quality issues using incomplete information.
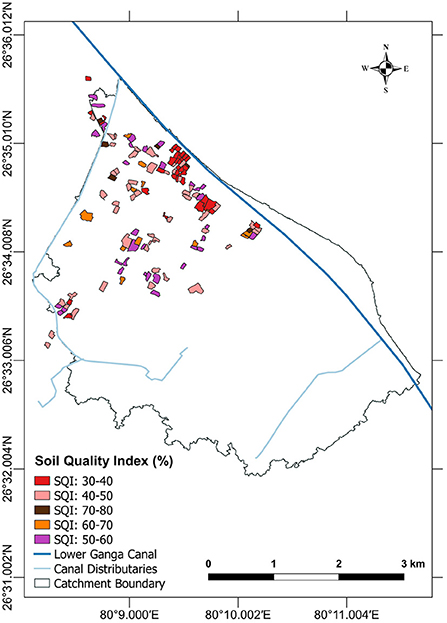
Figure 4. Spatial variability of the soil related performance indicator, Soil Quality Index (SQI), computed with the AHP methodology, using the soil testing results of samples collected from 100 farms in the study area.
3.2.2. Water Related Performance Indicator: Water Use Efficiency (WUE)
The WUE of wheat (calculated using Equation 2) was 1.60 kg/m3 (s = 0.49 kg/m3). Figure 5 illustrates the spatial variability of farm scale WUE for 67 farms, as part of the GIS database that was developed. Higher values of WUE indicate a higher localized efficiency in the application of water at the farm level (Van Halsema and Vincent, 2012). A simplistic observation of the proximity to surface water sources (like canal or canal distributaries, shown in bold and light blue colors, respectively) would not be sufficient to explain the variability in WUE across the farms, since it is impacted by many management factors including variety, sowing date, planting density and row spacing, soil water content at planting, irrigation method and pest management (Howell, 2001). This again reinforces the need to provide data-driven, farm-specific advisories.
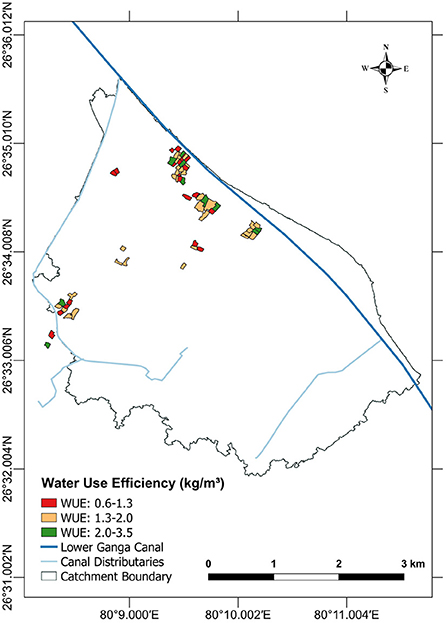
Figure 5. Spatial variability of the water related performance indicator, Water Use Efficiency (WUE), computed using data from 67 farms in the study area.
3.3. Integrated Visualization: Quantifying Overall Farm Performance and Classification
The scatter plot of the farms' performance, developed using surveys and soil testing, is given in Figure 6. Out of the 144 surveyed farms, 100 soil samples were collected, and 67 farmers reported previous year yields and irrigation application data. Hence, 67 farm points are included in the visualization
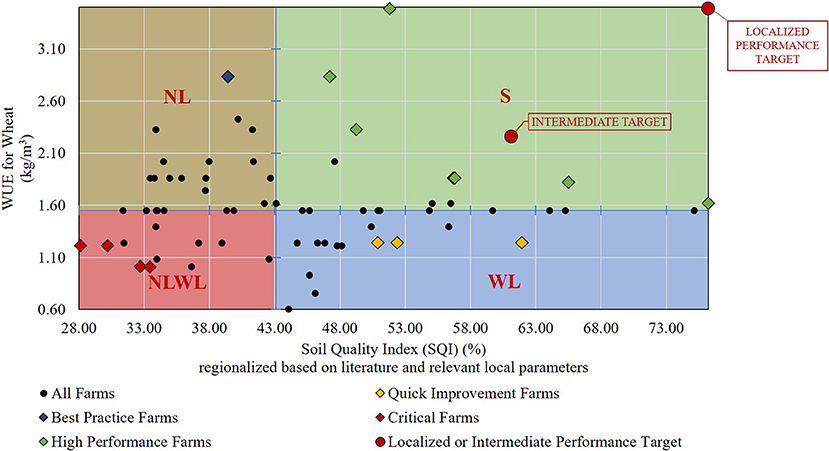
Figure 6. Classification of surveyed farmers (n = 67) based on locally relevant Soil Quality Index (%) and Water Use Efficiency (kg/m3) to aid zonal advisory development. S - “sufficient” farms in terms of limitations to yield gap, WL - “water limited farms,” NL - nutrient limited farms, and NLWL - farms with co-limitations of both water and nutrients. Also shown are farms identified as critical, quick improvement, and best practice farms, and the performance targets.
The extreme values of the SQI were 28.12% and 76.22%, and corresponding values of WUE were 0.61 kg/m3 and 3.48 kg/m3, which represent plot boundaries (X and Y axis extremes, respectively). The median values of SQI and WUE were 43.09% and 1.55 kg/m3, respectively. This led to the Y and X axes passing through these points, respectively and to a relatively evenly distributed percentage of farms across the classes: S (14.9%), NL (23.9%), WL (34.3%), and NLWL (26.9%).
The identification of the special sub-categories of “Best Practice Farms,” “Critical Farms” and “Quick Improvement Farms” was performed as follows. A visual judgment was taken to categorize only one farm into the category of “Best Practice Farms,” whose SQI (39.45%) was 9.5% lower than the median SQI, but WUE (0.28 kg/m3) was 82.5% higher than the median WUE. This may have been due to the fact that though the farm location was relatively upstream to the other farms (and with adequate access to canal irrigation), the farmer chose to irrigate his wheat three times during the season. This was in contrast to the modal and mean values of the number of irrigations in all the farms being 4 and 3.7, respectively. The “Critical Farms” (red diamonds) had both SQI and WUE values below their respective median values within the NLWL region. Four out of the 18 NLWL farms (22.2%) were identified as “Critical Farms,” which could be given prioritized attention through customized advisory services. The “Quick Improvement Farms” (yellow diamonds) had farms whose WUE values were below, and SQI values were above, their respective medians (among the WL datapoints).
The subjectivity in the above categorizations is inherent to model development, and becomes more explicit when stakeholders are included in the modeling process (Srinivasan et al., 2017). It is recommended that advisors take up this process with the active involvement of stakeholder farmers or farmer groups. The categorization of “Best Practice Farms,” “Critical Farms” and “Quick Improvement Farms” has not been incorporated in the corresponding FAD tool (Adla, 2021), and the final outcome of the tool is a visualization with the broader classes (NL, WL, NLWL, and S).
The Localized Performance Target (red circle at the top-right corner of Figure 6) seemed distant from any of the farm's performance. The farm with the best SQI = 76.22% had a WUE = 1.62 kg/m3, and the farm with the best WUE = 3.48 kg/m3 had an SQI = 51.8%. Hence, “High performance farms” were identified through visual inspection (green diamonds), and their average performance tuple (SQI = 61.24%, WUE = 2.26 kg/m3) was designated to be an Intermediate Performance Target.
A GIS map of the spatial variation of farms categorized into the four SQI-WUE classes is presented in Figure 7. An initial visual analysis did not reveal any clear environmental bases explaining the variability of the farm performance classes within the study area. For example, there both WL and NLWL farms in proximity to the Lower Ganga canal, which is counterintuitive since farms adjoining surface water would generally be expected to not be water limited. The explanation of such patterns may require a deeper analysis of the human-water interactions within social, economic and natural systems (Van Emmerik et al., 2014; Srinivasan et al., 2017) which consequently require more holistic and perhaps new data sources including citizen science, new sensing technologies or satellite data products (Buytaert et al., 2014). Particularly in this case, knowledge of previous and current soil and water management practices, access to farm technology, availability of capital may be useful to make explanatory interpretations, which are generally available with government or non-governmental agencies working in the agricultural sector, and were not collected for this study.
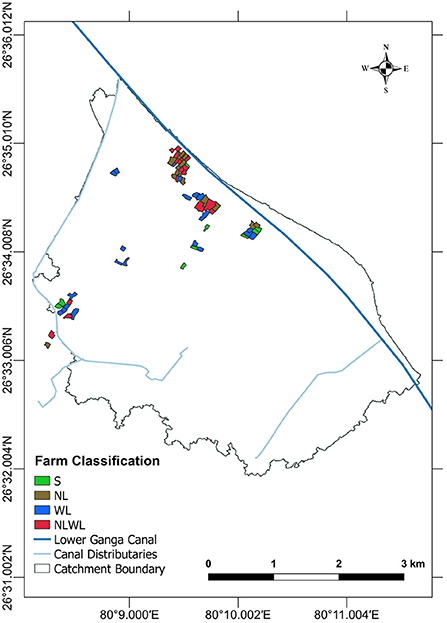
Figure 7. GIS map of farm classification using soil nutrients and water as major limitations contributing to yield gap. S “satisfactory” farms in terms of limitations to yield gap, NL nutrient limited farms, WL water limited farms, and NLWL farms with co-limitations of both nutrients and water.
3.4. “Farm Performance Classification” Based Recommendations to Customize Advisories
The SQI-WUE based classification of the different farms in the study area is given in Figure 8.
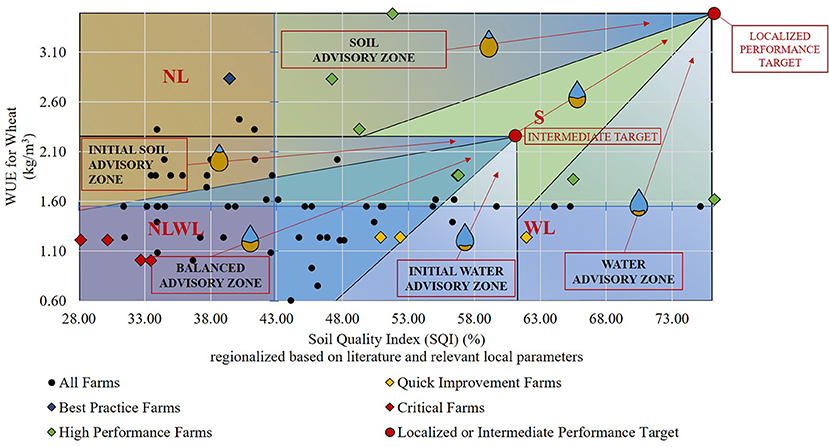
Figure 8. Classification based advisory development in the study area. The Intermediate Target is computed using the average of the “High performance” farms (depicted using green diamonds).
It is desirable to design advisories which would not aim at a performance indicator tuple of SQI = 76.22%, WUE = 3.48 kg/m3, but rather aim for a relatively well performing farm in the region. Hence, the average performance of the “High performance” farms was chosen as an achievable Intermediate Target, e.g., as shown in Figures 6, 8. Once a farm achieves this Intermediate Target, it can aim to achieve the Localized Performance Target. Farms that are already better than this Intermediate Target could get advisories which aim at the Localized Performance Target.
The GIS map already generated (Figure 7) can be used to implement the designed advisories (three types of advisories each for the Intermediate and the Localized Performance Targets) in the region.
4. Discussion
4.1. Contextualizing the Diagnostics Approach Using a Medical Analogy
This study introduces an approach to assess farm performance and diagnose the reasons for yield gaps with a user inspired, data-based approach (Thompson et al., 2013; Sivapalan et al., 2014). The approach limits itself to advisory diagnostics, and does not make recommendations about advisory content or form. A useful analogy to contextualize this approach is the diagnosis and treatment of a patient by a medical doctor, with the help of diagnostic tests, as illustrated in Figure 9.
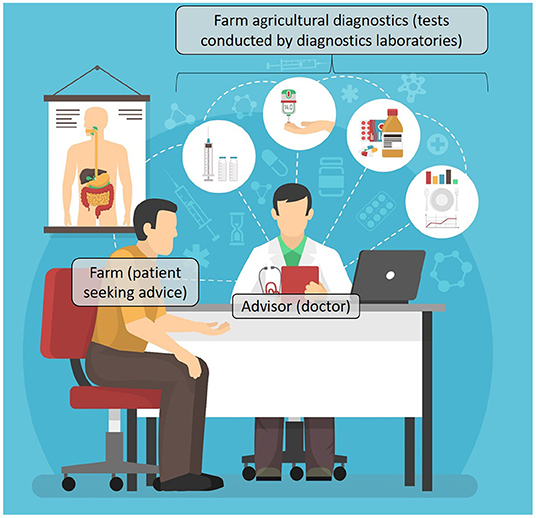
Figure 9. Contextualization of the agricultural diagnostics approach, using a medical analogy, given in parentheses. Image modified from the free-copyright abstract vector created by macrovector (https://www.freepik.com/vectors/abstract).
Every patient is different in terms of their physiological or pathological condition, just like every farm is different in terms of its agricultural condition. A doctor refers their patient to tests conducted by diagnostic laboratories to better ascertain the current state of the patient's physiological condition. An accurate and timely diagnosis, i.e., identification of the patient's problem, leads to “clinical decision making” tailored to a correct understanding of the patient's health problems (Holmboe and Durning, 2014). Likewise, this study's approach is a diagnostic method to better quantify the current condition of a farm, so that an advisor can administer advisories which are more customized to the farm in question. Moreover, public health policy is often influenced by diagnostic data, by altering resource allocation decisions and research priorities (Jutel, 2009). Similar diagnostic data collection and analysis in agriculture also opens up possibilities for applied research which may inform policy makers and implementing agencies to better serve demand-driven needs.
The tool will add data-based diagnostics value to pre-existing demand based advisory services, if used within already existing agricultural extension programs. The primary users of the tools are advisors (analogous to medical doctors), whom it facilitates, to generate more data-based and hence customized advisories, for farmers. In India, the district-level farm science centers (Krishi Vigyan Kendras) are such extension institutions which operate under central or state agricultural universities, the Indian Council of Agricultural Research (ICAR), NGOs, state governments, or public sector undertakings (ICAR, 2015)1. It is their mandate to develop advisories, including the disbursement of “farm advisories using ICT and other media means on varied subjects of interest to farmers” and “assessment of location specific technology modules in agriculture” (ICAR-IASRI, 2021)2.
4.2. Financial and Institutional Implications
The financial and institutional implications of this additional diagnostics process are predominantly related to aspects of soil sampling and testing, management of the data generated from soil testing, farmer surveys, and the tool, and human resource skill development for the relevant extension staff. In developing countries such as India, soil testing is a routine function of the Department of Agriculture, Cooperation & Farmers Welfare (Kaur et al., 2020). State agricultural departments are mandated to develop Soil Health Cards (SHCs), launched for Soil Health Management (SHM) by the Department of Agriculture, Cooperation & Farmers Welfare (Ministry of Agriculture and Farmers Welfare) by the Govt. of India3. The proposed diagnostics approach can build on the strengths of pre-existing soil testing infrastructure and leverage data collection mechanisms through call centers such as the Kisan Call Centre (Ganesan et al., 2013). The financial investment of the diagnostics approach and tool has two major aspects: the infrastructure to support data storage and processing for the agricultural “big data” thus generated (Hashem et al., 2015), and human resource skill development. The sustainable scaling-up and replication of such data-driven diagnostics will require large-scale storage, pre-processing and analysis of data coming from different sources (Hashem et al., 2015; Kamilaris et al., 2017). Though big data management has only recently been incorporated into agriculture (Lokers et al., 2016), the Indian big data analytics sector is expected to record a growth rate of 26% and increase by 14 billion USD from 2020 to 2025 (Reghunadhan, 2020). The Government of India has initiated various big data projects in the agricultural sector - Farmers Portal4 (portal which delivers relevant village/block/city/state level information through text message/email), Agricultural and Processed Food Products Export Development Authority5 (portal which facilitates export of food products, registers farms online, conducts surveys and feasibility studies, aids the collection of test samples, etc.), the Agriculture Portal of www.india.gov.in6 (database on agricultural products, machinery, research, and knowledge resource for government policies and schemes, market prices, etc.), and the Open Government Data Platform India7 (open dataset available for research and analysis) (Shankarnarayan and Ramakrishna, 2020). Additionally, large corporations working in the agri- and allied sector (e.g., Monsanto, Mahindra and Mahindra) have invested substantially in big data in the agribusiness segment (Lane, 2015). However, challenges accompanying big data applications, including privacy, security, data governance, sharing, expense, and data ownership, will also apply to this context, and will need to be addressed appropriately. (Shankarnarayan and Ramakrishna, 2020). The human resource skill development, particularly in subject knowledge and data analytics, can be inculcated through regular ICT trainings, which has been found to improve computer skills and work efficiency (Galanouli et al., 2004), and has been recommended for agricultural extension workers (Nyarko and Kozári, 2021).
4.3. Recommendations for Advisors Using the Tool
The advisory content can be supplemented by incorporating knowledge generated through mutual learning through interactions between farmers, among scientists and between farmers and scientists, for more effective translation of scientific information (Feldman and Ingram, 2009). Table 2 suggests some key characteristics (or major commonalities) of farms closer to the Localized Performance Target (shown in Figure 3). An identification of the key characteristics (or common factors, if they exist) of farms in each of the groups listed in Table 2 may help in designing advisories which are more specific than generic advisories. Lessons can be drawn from “Best Practice Farms” about their superior water management practices (despite relatively poor soils), and can be applied with confidence to advise “Critical Farms” and particularly “Quick Improvement Farms” because they are unable to achieve high WUEs despite relatively high SQIs.
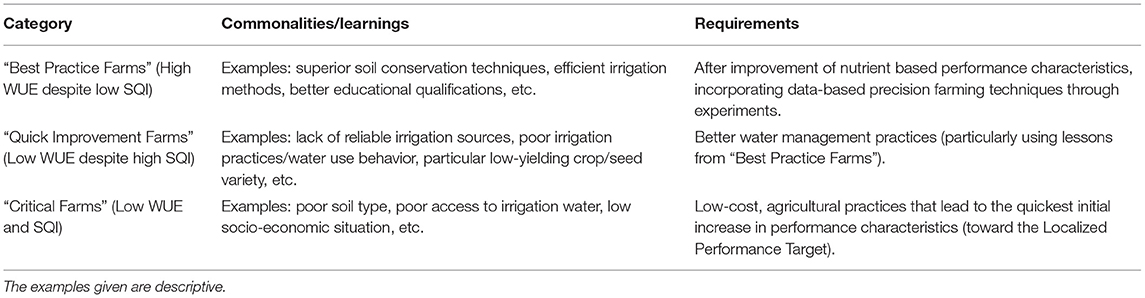
Table 2. Template for collecting key characteristics of farm sub-categories to guide a bi-directional flow of information.
Progressive farmers with the “Best Practice Farms” and “High Performance Farms” could potentially function as community leaders. Several examples of such leadership exists across domains, including the kisan mitras (farmer friends)—educated progressive farmers appointed by the government as village level extension functionaries (Landge and Tripathi, 2006), “barefoot engineers”—local level para-hydrogeologists employed by the gram panchayat (local village government) to take independent decisions regarding water management programs (Sen et al., 2019), and community health care workers—facilitators in improving health care access and outcomes in poor and deprived communities (Rosenthal et al., 2010). Also, once a farm is closer to the Localized Performance Target, a customized plan can be designed with modified global best practices, incorporating the potential of precision farming, for enhanced sustainability in the longer run. Ensuring transparency in disseminating performance indicators (with the possibility of farmers to visit vicinal better performing farms) can encourage farmers to visit each other without any immediate need for contacting the external “scientific” community, inspiring knowledge exchange within the community. Moreover, employees of some agencies in direct and regular communication with farmers (such as grassroots NGOs) have informally appreciated the potential of this tool for improved farm data monitoring and management (particularly of variables causing yield losses), and ultimately developing customized solutions for their farmer beneficiaries.
The form in which advisories are administered may be designed considering pre-existing local practices. Farmers have needed graphs and data to be interpreted by trained advisors in some advisory services (Eastwood et al., 2019). Engagement with users in the study area also corroborated this need; farmers suggested that advisories be administered using the local agronomic and agricultural management nomenclature. The corresponding training of advisors could incorporate suggestions from selected local farmers (managing the best practice farms in the region).
5. Conclusions
Acknowledging the need for data-driven agricultural extension, a “diagnostics” approach is developed to supplement pre-existing, demand-based, generic advisory programs, particularly in the Indian context. It included the following steps. The current performance of farms is evaluated using soil nutrient and water related performance indicators (Soil Quality Index SQI and Water Use Efficiency WUE respectively). Next, farms are classified into different performance zones to develop more customized advisories. Further special classes of farms are identified; the “Best Practice Farms” which can serve as a source of successful traditional or modern knowledge, “Critical Farms” which perform relatively poorly and would need critical focus urgently, and “Quick Improvement Farms” with low WUE despite relatively better SQI. A corresponding Farm Agricultural Diagnostics (FAD) tool is developed using MS Excel Macros which incorporates the salient features of the approach into a well-ordered, interactive and user-friendly design. The approach and tool are piloted in Kanpur, a region representing a smallholder dominated intensively managed rural landscape in the Ganga river basin (India). Additionally, a GIS database is developed to visualize the diagnostics for improved advisory administration. The approach and tool can be utilized extensively by academia, government and non-government agencies working in the agricultural sector, synergistically harnessing their strengths of rigorous scientific research, soil testing capacity, and direct stakeholder engagement, respectively. However, this effort would require political will, capacity building and cooperation within and between the relevant sectors.
Data Availability Statement
The raw data supporting the conclusions of this article will be made available by the authors, without undue reservation.
Author Contributions
SA and SG designed the research and analyzed the data. SA, SG, and SHK performed the research. SA programmed the software. SA, SP, and SG wrote the manuscript. SA, SP, ST, and MD edited the manuscript. ST, MD, and SP provided supervisory support. ST and SHK applied for the successful grant which funded the research. All authors contributed to the article and approved the submitted version.
Funding
The World Bank funded the surveys in 2018 were funded under the project Provision of Advisory for Necessary Irrigation (PANI). The Uttar Pradesh State Agricultural Department funded the soil testing and soil health card generation for 100 farmers in Kanpur (Uttar Pradesh).
Conflict of Interest
SHK was employed by company Kritsnam Technologies Pvt Ltd.
The remaining authors declare that the research was conducted in the absence of any commercial or financial relationships that could be construed as a potential conflict of interest.
Publisher's Note
All claims expressed in this article are solely those of the authors and do not necessarily represent those of their affiliated organizations, or those of the publisher, the editors and the reviewers. Any product that may be evaluated in this article, or claim that may be made by its manufacturer, is not guaranteed or endorsed by the publisher.
Acknowledgments
The authors wish to gratefully acknowledge the collaborators of the PANI project, Prof. Faisal Hossain, Prof. Bharat Lohani, Dr. Shahryar Khalique Ahmad, and Mr. Sandeep Goyal. The authors also thank Mr. Atul Kumar Gaur and Ankit, who conducted the farmer surveys in 2018. The Uttar Pradesh State Agricultural Department is acknowledged for soil testing and soil health card generation for 100 farmers in Kanpur.
Supplementary Material
The Supplementary Material for this article can be found online at: https://www.frontiersin.org/articles/10.3389/frwa.2021.798241/full#supplementary-material
Supplementary Data Sheet 1. Survey questionnaire and details of AHP methodology.
Supplementary Data Sheet 2. Farm-Agricultural-Diagnostics-Tool.
Abbreviations
AHP, Analytic Hierarchy Process; MCDM, Multi-Criteria Decision Making; PWCM, Pairwise Comparison Matrix; SHM, Soil AHP, Analytic Hierarchy Process; CSPro, Census and Survey Processing System; EC, Electrical Conductivity; FAD, Farm Agricultural Diagnostics; GIS, Geographic Information System; GW, Groundwater; ICAR, Indian Council of Agricultural Research; ICT, Information and Communications Technology; IFFCO, Indian Farmers Fertiliser Cooperative; IFPRI, International Food Policy Research Institute; IMRL, Intensively Managed Rural Landscape; INM, Integrated Nutrient Management; IoT, Internet of Things; MCDM, Multi-Criteria Decision Making; MEVBA, Macro-in-Excel Visual Basic for Applications; MS, Microsoft; NGO, Non-governmental Organization; NL, Nutrient Limited (farm performance); NLWL, Nutrient and Water Co-limited (farm performance); NMSA, National Mission for Sustainable Agriculture; PWCM, Pairwise Comparison Matrix; S, Satisfactory (farm performance); SHM, Soil Health Management; SOC, Soil Organic Carbon; SQI, Soil Quality Index; USAID, United States Agency for International Development; WL, Water Limited (farm performance); WUE, Water Use Efficiency.
Footnotes
1. ^https://krishi.icar.gov.in/kvk.jsp
2. ^https://kvk.icar.gov.in/aboutkvk.aspx
3. ^https://soilhealth.dac.gov.in/Content/blue/soil/about.html
5. ^http://apeda.gov.in/apedawebsite/
References
Ahikiriza, E., Wesana, J., Gellynck, X., Van Huylenbroeck, G., and Lauwers, L. (2021). Context specificity and time dependency in classifying sub-saharan africa dairy cattle farmers for targeted extension farm advice: the case of uganda. Agriculture 11, 836. doi: 10.3390/agriculture11090836
Aker, J. C. (2011). Dial “A” for agriculture: a review of information and communication technologies for agricultural extension in developing countries. Agric. Econ. 42, 631–647. doi: 10.1111/j.1574-0862.2011.00545.x
Alharthi, H., Sultana, N., Al-Amoudi, A., and Basudan, A. (2015). An analytic hierarchy process-based method to rank the critical success factors of implementing a pharmacy barcode system. Perspect. Health Inf. Manag. 12:1g. https://www.ncbi.nlm.nih.gov/pmc/articles/PMC4700872/
Anderson, J., and Feder, G. (2007). “Agricultural extension,” in Handbook of Agricultural Economics, Vol. 3 (Amsterdam: Elsevier B.V.), 2343–2378.
Andrews, S. S., Karlen, D. L., and Cambardella, C. A. (2004). The soil management assessment framework: a quantitative soil quality evaluation method. Soil Sci. Soc. Am. 68, 1945–1962. doi: 10.2136/sssaj2004.1945
Bartlett, A., Andales, A., Arabi, M., and Bauder, T. (2015). A smartphone app to extend use of a cloud-based irrigation scheduling tool. Comput. Electron. Agric. 111, 127–130. doi: 10.1016/j.compag.2014.12.021
Bell, M. (2013). e-Afghan Ag. Content is Just Part of the Story. Rwanda: Presentation at CTA's ICT4Ag International Conference.
Bramley, R. G. (2009). Lessons from nearly 20 years of precision agriculture research, development, and adoption as a guide to its appropriate application. Crop Pasture Sci. 60, 197–217. doi: 10.1071/CP08304
Buytaert, W., Zulkafli, Z., Grainger, S., Acosta, L., Alemie, T. C., Bastiaensen, J., et al. (2014). Citizen science in hydrology and water resources: opportunities for knowledge generation, ecosystem service management, and sustainable development. Front. Earth Sci. 2:26. doi: 10.3389/feart.2014.00026
Das, A., Basu, D., and Goswami, R. (2016). Accessing agricultural information through mobile phone: lessons of IKSL services in West Bengal. Indian Res. J. Extension Educ. 12, 102–107. https://api.semanticscholar.org/CorpusID:168547286
Davis, K., and Franzel, S. (2018). Extension and Advisory Services in 10 Developing Countries: A Cross-country Analysis. Technical report, USAID.
De Fraiture, C., Molden, D., and Wichelns, D. (2010). Investing in water for food, ecosystems, and livelihoods: an overview of the comprehensive assessment of water management in agriculture. Agric. Water Manag. 97, 495–501. doi: 10.1016/j.agwat.2009.08.015
De Fraiture, C., and Wichelns, D. (2010). Satisfying future water demands for agriculture. Agric. Water Manag. 97, 502–511. doi: 10.1016/j.agwat.2009.08.008
Digital Green (2019). Farm Stack. A Digital Green Web Publication. Available online at: https://farmstack.co/.
Eastwood, C., Ayre, M., Nettle, R., and Rue, B. D. (2019). Making sense in the cloud: Farm advisory services in a smart farming future. NJAS Wageningen J. Life Sci. 90:100298. doi: 10.1016/j.njas.2019.04.004
Eastwood, C., Jago, J., Edwards, J., and Burke, J. (2015). Getting the most out of advanced farm management technologies: roles of technology suppliers and dairy industry organisations in supporting precision dairy farmers. Anim. Product. Sci. 56, 1752–1760. doi: 10.1071/AN141015
Eicher, C. K. (2001). Africa's unfinished business: building sustainable agricultural research systems. Technical Report 1099-2016-89172, Department of Agricultural Economics, Michigan State University, East Lansing.
Fafchamps, M., and Minten, B. (2012). Impact of SMS-based agricultural information on Indian farmers. World Bank Econ. Rev. 26, 383–414. doi: 10.1093/wber/lhr056
Feder, G., Anderson, J. R., Birner, R., and Deininger, K. (2010). “Promises and realities of community-based agricultural extension,” in Community, Market and State in Development, eds K. Otsuka and K. Kaliranjan (London: Palgrave Macmillan), 187–208.
Feldman, D. L., and Ingram, H. M. (2009). Making science useful to decision makers: climate forecasts, water management, and knowledge networks. Weather Clim. Soc. 1, 9–21. doi: 10.1175/2009WCAS1007.1
Galanouli, D., Murphy, C., and Gardner, J. (2004). Teachers' perceptions of the effectiveness of ict-competence training. Comput. Educ. 43, 63–79. doi: 10.1016/j.compedu.2003.12.005
Ganesan, M., Karthikeyan, K., Prashant, S., and Umadikar, J. (2013). Use of mobile multimedia agricultural advisory systems by Indian farmers: results of a survey. J. Agric. Exten. Rural Dev. 5, 89–99. https://academicjournals.org/journal/JAERD/article-abstract/80B08225742
Gargiulo, J., Eastwood, C., Garcia, S., and Lyons, N. (2018). Dairy farmers with larger herd sizes adopt more precision dairy technologies. J. Dairy Sci. 101, 5466–5473. doi: 10.3168/jds.2017-13324
Glendenning, C. J., Babu, S., and Asenso-Okyere, K. (2010). Review of agricultural extension in India: Are farmers' information needs being met? Technical report, International Food Policy Research Institute (IFPRI).
Government of India (2011). Census of India. Office of the Registrar General & Census Commissioner. New Delhi. Available online at: https://censusindia.gov.in/2011-Common/Archive.html
Government of Malawi (2000). Agriculture Extension in the New Millennium: Towards Pluralistic and Demand-Driven Services in Malawi. Technical report, Department of Agricultural Extension Services, Ministry of Agriculture and Irrigation.
Gupta, S., Karumanchi, S., Dash, S., Adla, S., Tripathi, S., Sinha, R., et al. (2019). Monitoring ecosystem health in India's food basket. Eos 100. doi: 10.1029/2019EO117683
Gupta, S., Tripathi, S., Sinha, R., Sri Harsha, K., Paul, D., Tripathi, S., et al. (2017). “Setting Up a New CZO in the ganga basin: instrumentation, stakeholder engagement and preliminary observations,” in American Geophysical Union General Assembly 2017 (New Orleans, LA: American Geophysical Union).
Hashem, I. A. T., Yaqoob, I., Anuar, N. B., Mokhtar, S., Gani, A., and Khan, S. U. (2015). The rise of “big data” on cloud computing: review and open research issues. Inf. Syst. 47, 98–115. doi: 10.1016/j.is.2014.07.006
Holmboe, E. S., and Durning, S. J. (2014). Assessing clinical reasoning: moving from in vitro to in vivo. Diagnosis 1, 111–117. doi: 10.1515/dx-2013-0029
Hostiou, N., Fagon, J., Chauvat, S., Turlot, A., Kling-Eveillard, F., Boivin, X., et al. (2017). Impact of precision livestock farming on work and human-animal interactions on dairy farms. a review. Biotechnol. Agron. Soc. Environ. 21, 268–275. https://hal.archives-ouvertes.fr/hal-01644053
Howell, T. A. (2001). Enhancing water use efficiency in irrigated agriculture. Agron. J. 93, 281–289. doi: 10.2134/agronj2001.932281x
ICAR (2015). KVK: A Brief Overview. Available online at: https://krishi.icar.gov.in/kvk.jsp.
ICAR-IASRI (2021). About KVK. Available online at: https://kvk.icar.gov.in/aboutkvk.aspx.
IFPRI (2020). Agricultural Extension. Available online at: https://www.ifpri.org/topic/agricultural-extension.
Jutel, A. (2009). Sociology of diagnosis: a preliminary review. Sociol. Health Illness 31, 278–299. doi: 10.1111/j.1467-9566.2008.01152.x
Kalambukattu, J. G., Kumar, S., and Ghotekar, Y. S. (2018). Spatial variability analysis of soil quality parameters in a watershed of Sub-Himalayan Landscape-A case study. Eurasian J. Soil Sci. 7, 238–250. doi: 10.18393/ejss.427189
Kamilaris, A., Kartakoullis, A., and Prenafeta-Boldú, F. X. (2017). A review on the practice of big data analysis in agriculture. Comput. Electron. Agric. 143, 23–37. doi: 10.1016/j.compag.2017.09.037
Karlen, D. L., Mausbach, M., Doran, J. W., Cline, R., Harris, R., and Schuman, G. (1997). Soil quality: a concept, definition, and framework for evaluation (a guest editorial). Soil Sci. Soc. Am. J. 61, 4–10. doi: 10.2136/sssaj1997.03615995006100010001x
Kaur, S., Kaur, P., and Kumar, P. (2020). Farmers' knowledge of soil health card and constraints in its use. Indian J. Exten. Educ. 56, 28–32. http://epubs.icar.org.in/ejournal/index.php/ijee/article/view/107801
Kil, S.-H., Lee, D. K., Kim, J.-H., Li, M.-H., and Newman, G. (2016). Utilizing the analytic hierarchy process to establish weighted values for evaluating the stability of slope revegetation based on hydroseeding applications in South Korea. Sustainability 8, 58. doi: 10.3390/su8010058
Klerkx, L., and Jansen, J. (2010). Building knowledge systems for sustainable agriculture: supporting private advisors to adequately address sustainable farm management in regular service contacts. Int. J. Agric. Sust. 8, 148–163. doi: 10.3763/ijas.2009.0457
Kumar, A., Sah, B., Singh, A. R., Deng, Y., He, X., Kumar, P., et al. (2017). A review of multi criteria decision making (MCDM) towards sustainable renewable energy development. Renewable Sust. Energy Rev. 69, 596–609. doi: 10.1016/j.rser.2016.11.191
Kumar, U., Kumar, N., Mishra, V., and Jena, R. (2019). “Soil quality assessment using analytic hierarchy process (AHP): a case study,” in Interdisciplinary Approaches to Information Systems and Software Engineering (Hershey: IGI Global), 1–18.
Landge, S., and Tripathi, H. (2006). Training needs of kisan mitras in agriculture and allied areas. Indian Res. J. Exten. Educ. 6, 54–58. https://api.semanticscholar.org/CorpusID:111167119
Lane, J. (2015). Digital soil: The four secrets of the new agriculture. biofuels digest. Available online at: http://www.biofuelsdigest.com/bdigest/2015/03/09/the-four-secrets-of-the-new-agriculture/ (accessed July 7, 2021).
Laurent, C., Cerf, M., and Labarthe, P. (2006). Agricultural extension services and market regulation: learning from a comparison of six eu countries. J. Agric. Educ. Exten. 12, 5–16. doi: 10.1080/13892240600740787
Lee, C.-H., Wu, M.-Y., Asio, V. B., and Chen, Z.-S. (2006). Using a soil quality index to assess the effects of applying swine manure compost on soil quality under a crop rotation system in Taiwan. Soil Sci. 171, 210–222. doi: 10.1097/01.ss.0000199700.78956.8c
Leeuwis, C., and Van den Ban, A. (2004). Communication for Rural Innovation: Rethinking Agricultural Extension. Oxford: Blackwell Publishing Ltd.
Liebig, M. A., Varvel, G., and Doran, J. (2001). A simple performance-based index for assessing multiple agroecosystem functions. Agron. J. 93, 313–318. doi: 10.2134/agronj2001.932313x
Lokers, R., Knapen, R., Janssen, S., van Randen, Y., and Jansen, J. (2016). Analysis of big data technologies for use in agro-environmental science. Environ. Model. Software 84, 494–504. doi: 10.1016/j.envsoft.2016.07.017
McBratney, A. (1997). Spatial variability in soil-implications for precision agriculture. Proc. Precision Agric. 1997, 3–31.
Mishra, A. K., Deep, S., and Choudhary, A. (2015). Identification of suitable sites for organic farming using AHP &GIS. Egyptian J. Remote Sens. Space Sci. 18, 181–193. doi: 10.1016/j.ejrs.2015.06.005
Molden, D., Oweis, T., Steduto, P., Bindraban, P., Hanjra, M. A., and Kijne, J. (2010). Improving agricultural water productivity: between optimism and caution. Agric. Water Manag. 97, 528–535. doi: 10.1016/j.agwat.2009.03.023
Mouazen, A. M., Dumont, K., Maertens, K., and Ramon, H. (2003). Two-dimensional prediction of spatial variation in topsoil compaction of a sandy loam field-based on measured horizontal force of compaction sensor, cutting depth and moisture content. Soil Tillage Res. 74, 91–102. doi: 10.1016/S0167-1987(03)00123-5
Mueller, N. D., Gerber, J. S., Johnston, M., Ray, D. K., Ramankutty, N., and Foley, J. A. (2012). Closing yield gaps through nutrient and water management. Nature 490, 254–257. doi: 10.1038/nature11420
Neethirajan, S. (2017). Recent advances in wearable sensors for animal health management. Sens. Biosens. Res. 12:15–29. doi: 10.1016/j.sbsr.2016.11.004
Nettle, R., Crawford, A., and Brightling, P. (2018). How private-sector farm advisors change their practices: an Australian case study. J. Rural Stud. 58, 20–27. doi: 10.1016/j.jrurstud.2017.12.027
Nyarko, D. A., and Kozári, J. (2021). Information and communication technologies (ICTs) usage among agricultural extension officers and its impact on extension delivery in Ghana. J. Saudi Soc. Agric. Sci. 20, 164–172. doi: 10.1016/j.jssas.2021.01.002
Oduniyi, O. S. (2021). Factors driving the adoption and use extent of sustainable land management practices in South Africa. Circ. Econ. Sust. 1–20. doi: 10.1007/s43615-021-00119-9
Prihar, S., Sandhu, B., Khera, K., and Jalota, S. (1978). Water use and yield of winter wheat in northern India as affected by timing of last irrigation. Irrigation Sci. 1, 39–45. doi: 10.1007/BF00269006
Reghunadhan, R. (2020). “Big data, climate smart agriculture and india-africa relations: a social science perspective,” in IoT and Analytics for Agriculture (Singapore: Springer), 113–137.
Rivera, W., Qamar, K., and Crowder, L. (2001). Agricultural and rural extension worldwide: Options for institutional reform in developing countries. Technical report, Food and Agriculture Organization of the United Nations, Rome.
Rivera, W. M. (2011). Public sector agricultural extension system reform and the challenges ahead. J. Agric. Educ. Exten. 17, 165–180. doi: 10.1080/1389224X.2011.544457
Rosenthal, E. L., Brownstein, J. N., Rush, C. H., Hirsch, G. R., Willaert, A. M., Scott, J. R., et al. (2010). Community health workers: part of the solution. Health Aff. 29, 1338–1342. doi: 10.1377/hlthaff.2010.0081
Rue, B. D., Eastwood, C., Edwards, J., and Cuthbert, S. (2019). New Zealand dairy farmers preference investments in automation technology over decision-support technology. Anim. Product. Sci. 60, 133–137. doi: 10.1071/AN18566
Rutten, C. J., Velthuis, A., Steeneveld, W., and Hogeveen, H. (2013). Invited review: Sensors to support health management on dairy farms. J. Dairy Sci. 96, 1928–1952. doi: 10.3168/jds.2012-6107
Saaty, R. W. (1987). The analytic hierarchy process' what it is and how it is used. Math. Modell. 9, 161–176. doi: 10.1016/0270-0255(87)90473-8
Saaty, T. L. (1977). A scaling method for priorities in hierarchical structures. J. Math. Psychol. 15, 234–281. doi: 10.1016/0022-2496(77)90033-5
Santra, P., Chopra, U., and Chakraborty, D. (2008). Spatial variability of soil properties and its application in predicting surface map of hydraulic parameters in an agricultural farm. Curr. Sci. 95, 937–945. https://www.jstor.org/stable/24103193
Saravanan, R. (2010). ICTs for Agricultural Extension: Global Experiments, Innovations and Experiences. New Delhi: New India Publishing.
Sen, S. M., Singh, A., Varma, N., Sharma, D., and Kansal, A. (2019). Analyzing Social Networks to Examine the Changing Governance Structure of Springsheds: a Case Study of Sikkim in the Indian Himalayas. Environ. Manage. 63, 233–248. doi: 10.1007/s00267-018-1128-0
Severino, G., D'Urso, G., Scarfato, M., and Toraldo, G. (2018). The IoT as a tool to combine the scheduling of the irrigation with the geostatistics of the soils. Future Generation Comput. Syst. 82, 268–273. doi: 10.1016/j.future.2017.12.058
Shankarnarayan, V. K., and Ramakrishna, H. (2020). Paradigm change in indian agricultural practices using big data: challenges and opportunities from field to plate. Inf. Proc. Agric. 7, 355–368. doi: 10.1016/j.inpa.2020.01.001
Sivapalan, M., Konar, M., Srinivasan, V., Chhatre, A., Wutich, A., Scott, C., et al. (2014). Socio-hydrology: use-inspired water sustainability science for the Anthropocene. Earths Future 2, 225–230. doi: 10.1002/2013EF000164
Srinivasan, V., Sanderson, M., Garcia, M., Konar, M., Blöschl, G., and Sivapalan, M. (2017). Prediction in a socio-hydrological world. Hydrol. Sci. J. 62, 338–345.
Thompson, S., Sivapalan, M., Harman, C., Srinivasan, V., Hipsey, M., Reed, P., et al. (2013). Developing predictive insight into changing water systems: use-inspired hydrologic science for the Anthropocene. Hydrol. Earth Syst. Sci. 17, 5013–5039. doi: 10.5194/hess-17-5013-2013
United States Census Bureau (2000). Census and Survey Processing System (CSPro). Available online at: https://www.census.gov/data/software/cspro.html.
USAID (2000). ICTFSECBP (Information Communication Technology For Small Enterprise Capacity Building Program). Available online at: https://www.census.gov/data/software/cspro.html.
Van Emmerik, T., Li, Z., Sivapalan, M., Pande, S., Kandasamy, J., Savenije, H., et al. (2014). Socio-hydrologic modeling to understand and mediate the competition for water between agriculture development and environmental health: murrumbidgee river basin, australia. Hydrol. Earth Syst. Sci. 18, 4239–4259. doi: 10.5194/hess-18-4239-2014
Van Halsema, G. E., and Vincent, L. (2012). Efficiency and productivity terms for water management: A matter of contextual relativism versus general absolutism. Agric. Water Manag. 108, 9–15. doi: 10.1016/j.agwat.2011.05.016
Vasseur, E., Rushen, J., De Passillé, A., Lefebvre, D., and Pellerin, D. (2010). An advisory tool to improve management practices affecting calf and heifer welfare on dairy farms. J. Dairy Sci. 93, 4414–4426. doi: 10.3168/jds.2009-2586
Wolfert, S., Ge, L., Verdouw, C., and Bogaardt, M.-J. (2017). Big data in smart farming - a review. Agric. Syst. 153:69–80. doi: 10.1016/j.agsy.2017.01.023
Wu, Q., and Wang, M. (2007). A framework for risk assessment on soil erosion by water using an integrated and systematic approach. J. Hydrol. 337, 11–21. doi: 10.1016/j.jhydrol.2007.01.022
Keywords: agricultural extension, advisory diagnostics, data-based advisory, soil quality index, water use efficiency
Citation: Adla S, Gupta S, Karumanchi SH, Tripathi S, Disse M and Pande S (2022) Agricultural Advisory Diagnostics Using a Data-Based Approach: Test Case in an Intensively Managed Rural Landscape in the Ganga River Basin, India. Front. Water 3:798241. doi: 10.3389/frwa.2021.798241
Received: 19 October 2021; Accepted: 06 December 2021;
Published: 03 January 2022.
Edited by:
Marcus Nüsser, Heidelberg University, GermanyReviewed by:
Francisco José Fernández, Universidad Mayor, ChileMaysoun A. Mustafa, University of Nottingham Malaysia Campus, Malaysia
Copyright © 2022 Adla, Gupta, Karumanchi, Tripathi, Disse and Pande. This is an open-access article distributed under the terms of the Creative Commons Attribution License (CC BY). The use, distribution or reproduction in other forums is permitted, provided the original author(s) and the copyright owner(s) are credited and that the original publication in this journal is cited, in accordance with accepted academic practice. No use, distribution or reproduction is permitted which does not comply with these terms.
*Correspondence: Soham Adla, c29oYW0uYWRsYUB0dW0uZGU=