 Maximilian Frick
 Mauro Cacace1
 Volker Klemann
 Magdalena Scheck-Wenderoth
- 1GeoForschungsZentrum (GFZ) German Research Centre for Geosciences, Helmholtz Association of German Research Centres (HZ), Potsdam, Germany
- 2Department of Physics and Physical Oceanography, Faculty of Science, Memorial University of Newfoundland, St. John's, NL, Canada
- 3Institute of Geology and Geochemistry of Petroleum and Coal, Rheinisch-Westfaelische Technische Hochschule (RWTH) Aachen University, Aachen, Germany
We use a fully coupled hydro-thermal model (TH) to quantify changes in the pore pressure and temperature distribution following the Last Glacial Maximum (LGM) in the intracontinental basins in Central and Northern Europe. We demonstrate that even without considering a direct mechanical coupling from the visco-elastic lithosphere rebound, the system is, at present-day, in a state of hydrogeologic and thermal disequilibrium as a result of the past ice sheet dynamics. We find that the local geology exerts an additional control on the subsurface response to imposed glacial loading, as evidenced by a contrasting thermal and pore pressure configuration in time and space. Highest rates of pore pressure dissipation are restricted to crustal domains that underwent substantial glacial loading, while the majority of the sedimentary sub-basins show a prominent signature of hydraulic disequilibrium (overpressure) at present. Groundwater-driven convective cooling and heating during the advance and retreat of the ice cap occurred mainly within sedimentary rocks, domains where thermal equilibration is ongoing. The spatial correlation between modeled pore pressure dissipation rates and postglacial uplift rates is indicative of a complex and transient hydrogeological system structurally connected to the viscous tail of the ongoing isostatic adjustment after the LGM, with important implications for assessing the long-term mechanical stability of this intraplate setting.
Introduction
The search and acceptance of storage sites for radioactive waste is a still open question for most countries producing high levels of radioactive waste (Lankof, 2020; e.g., BGE, 2021; Hagros et al., 2021). At the same time, the perception of the risks and the safety of underground storage sites is subject to an open debate, hindering its public acceptance. A key requirement for a high-level nuclear waste repository is to avoid mixing of radionuclides transported via groundwater flow systems with fresh-water bearing shallow aquifers. Exemplary, this is set into the legal framework in Germany, for a time window of up to 1 million years. Such requirements are especially relevant for countries located at high latitudes, which are believed to face future glaciations within the next 10 or more 1,000 years. Loading from an advancing ice sheet will increase the mechanical load on an existing repository and the water pressure in the rock below the ice. Such an increase in pore pressure will act as a source of a direct and indirect (via poro-elastic stress transfer) stress to the rock, which may cause rock failure and possibly lead to instability also in the form of unforeseen earthquakes. This detrimental effect, among others, poses concerns on the long-term stability of a nuclear repository site (Lund et al., 2009a).
Intraplate regions, located far away from active plate boundaries, are considered as stable, low strain tectonic areas characterized by low levels of (neo)tectonic activity (Cacace et al., 2008). In these settings, observed differential deformation patterns are attributed to regional and/or local variations in lithosphere rheology as controlled by the thermal configuration of the crust and upper mantle (Anikiev et al., 2019; Spooner et al., 2020). There is however also evidence of glacial influences on the deformational regime (Wu et al., 1999; Brandes et al., 2015), and the direct influence that such a dynamics exert on the resulting pore pressure and thermal field is the subject of this study.
The thermal state of intraplate regions is usually quantified by a model that depicts a conductive heterogeneous plate, parameterized in terms of the thermal diffusivity constant of the lithosphere in relation to the time at which the most recent tectono-thermal event occurred (Bayer et al., 1997; Noack et al., 2010). Due to the typical small magnitude variations in groundwater recharge in these settings (driven by a rather gentle topographic relief), and the high permeability contrast between sedimentary and crustal rocks, the additional effects of groundwater flow on the heat budget of the crust have usually been deemed of secondary relevance, if not negligible. In the absence of any tectonic transients, as those associated to active volcanism, it is common to assume a steady state diffusive thermal configuration to characterize the mechanical state of the lithosphere in these settings (Stephenson et al., 2009; Bjørlykke, 2010).
Downward (upward) groundwater flow in recharge (discharge) areas has the potential to lower (raise) crustal temperatures relative to a conductive geothermal gradient and to perturb the near surface heat flow distribution (Ferguson et al., 2006; Kaiser et al., 2011; Majorowicz and Wybraniec, 2011; Kooi, 2016). Depending on the local hydrogeological conditions, the induced cooling/warming can be quite extensive not only at depths but also laterally. Pore pressure transients of non-tectonic origins have been discussed as a potential mechanism leading to structural weakening of crustal rocks. This is especially the case in intraplate stable areas where seismicity does not seem to correlate with tectonic loading rates, but shows a rather diffusive spatial distribution (Grünthal et al., 2018 and references therein). There is growing evidence of correlations between spatio-temporal variations in rainfall and changes in seismicity rates (Hainzl et al., 2006; Vittecoq et al., 2020). Crustal thermal weakening associated to active fluid convection has also been considered as a possible causative dynamic to increased seismic activities (Acosta et al., 2018).
Here, we carry out a systematic modeling study of the effects of the last glacial-interglacial cycle on the subsurface pore pressure and temperature distributions in North Central Europe. This intraplate region has been repeatedly affected by glaciations and periglacial processes during the whole Pleistocene, which have affected its morphology and subsurface hydrogeology. Previous studies have been successful in correlating the induced visco-elastic rebound to the Holocene sea level change (Lambeck et al., 1998; Steffen and Wu, 2011) and/or its relation to paleo-fault activity (Wahlström, 1993; Klemann and Wolf, 1998; Lund et al., 2009a; e.g., Bungum et al., 2010; Steffen et al., 2014; Løtveit et al., 2019). However, quantifying the impact of periglacial and glacial climate conditions on the resulting groundwater flow and heat transport dynamics has been limited to local studies nearby proposed repository sites, thereby preventing a unifying description of the regional thermo-hydraulic response of the system to the ice dynamics. The novelty of our study stems from using a detailed 3D geological model of the lithospheric plate coupled to a highly resolved ice reconstruction for the last glacial-interglacial cycle to map the sensitivity of the present-day pore pressure and thermal distribution to the past and present-day system dynamics. We limit this study to an investigation of the direct coupling among the hydraulic and thermal field to variations in the surface loading conditions, as based from a reconstructed ice sheet dynamics during the LGM. As such, we do not consider the additional coupling from the mechanical response, that is the lithosphere response to the ice load (i.e., visco-elastic Glacial Isostatic Adjustment - GIA - from lithospheric flexure or poro-elastic stress transfer), which would have entered an additional source of uncertainty in terms of additional required model parameters (e.g., rock compressibility and elastic moduli). We demonstrate how the system is in a state of present-day disequilibrium with respect to modern boundary conditions due to the persistence of a hydraulic and thermal memory derived from the last glaciation dynamics. This is manifested in a reorganization of the subsurface flow field, which differs from what would be expected for a system in equilibrium with the present-day topographic forcing, and in an ongoing thermal re-equilibration of the past thermal signature, as also seen in available temperature measurements. We additionally found that the local geology plays an additional role in the establishment and maintenance over time of anomalous fluid pressure and temperature conditions. Our results reveal an important feedback mechanism between the local hydrogeological configuration, groundwater dynamics and ongoing deformation that has been so far neglected in 3D subsurface studies of intraplate regions subjected to ice dynamics.
Geology of Central and Northern Europe
We integrate the geological configuration of the lithosphere as based on an existing 3D geological model, which resolves details of the configuration of the mantle, (upper and lower) crust as well as of the overlying sediment (Figure 1; Maystrenko et al., 2012b, 2020; Maystrenko and Scheck-Wenderoth, 2013; Scheck-Wenderoth and Maystrenko, 2013).
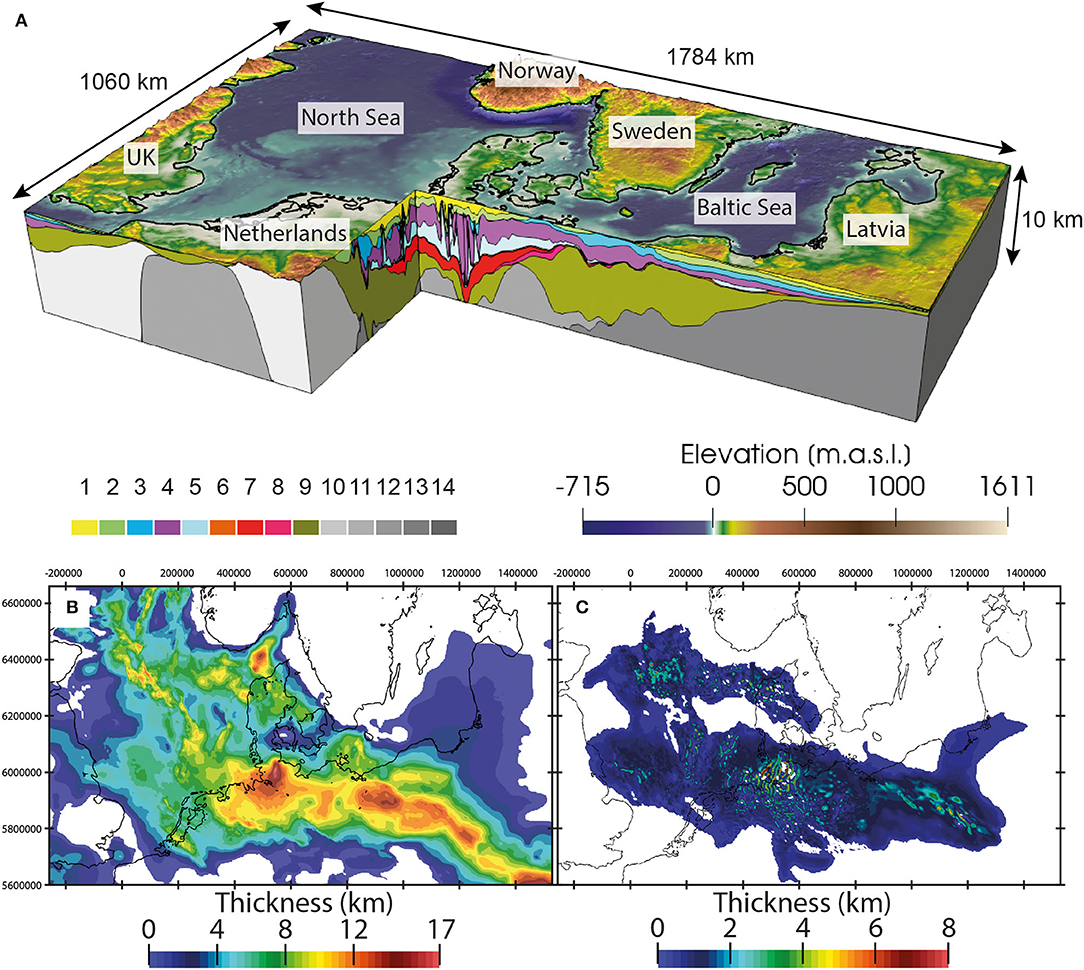
Figure 1. Structural model of the Central European Basin System (Maystrenko and Scheck-Wenderoth, 2013; Maystrenko et al., 2020). (A) Clip of the uppermost 10 km, 25× vertical exaggeration. Colors on top: elevation of uppermost slice of the model, vertical interfaces showing the geological layers of the model: 1 = Tertiary, 2 = Cretaceous, 3 = Jurassic, 4 = Triassic, 5 = Permian Zechstein Salt, 6 = Permian Carbonates, 7 = Rotliegend Sediments, 8 = Permocarboniferous Volcanics, 9 = Pre-Permian Sediments, 10 = Bohemian Granite, 11 = Variscan Crust, 12 = Laurentia Crust, 13 = Avalonia Crust, 14 = Baltica Crust. (B) Cumulative thickness distribution of the sedimentary layers (1–9); (C) Thickness distribution of the Permian Zechstein Salt. Coordinates are in UTM Zone 32N.
The cumulative thickness distribution of the sedimentary sequences ranges from a few meters to up to over 16 km in its main subsidence depocenters (Figure 1). As a result of the poly-phase tectonic evolution of the study area, its basin infill consists of diverse lithologies, including mainly clastic sediments with minor intercalations of carbonates and a thick layer of postdepositionally mobilized evaporites of the Permian Zechstein salt. Hydrogeologically, two over-regional aquifer systems can be distinguished. The lower aquifer complex is composed by the Rotliegend clastic sediments, the Permocarboniferous Volcanics and the Pre-Permian sediments. Permeability values of these sedimentary rocks are rather in the lower range for those considered typical of porous reservoirs (Table 1) as these units have rather small porosities in response to their burial depth and the related high degree of compaction. This aquifer complex is hydraulically sealed by the impervious Zechstein salt layer, consisting mostly of post-depositionally mobilized rock salt (halite, Figure 1) forming today numerous salt pillows and diapirs deforming their cover layers. As a result, the overlying upper (Mesozoic-Cenozoic) aquifer complex displays a rather heterogeneous thickness distribution, with depocenters within the main troughs adjacent to salt walls and diapirs, so-called salt rim synclines. Accordingly, the stress state within this heterogeneous Permo-Cenozoic succession locally influenced by halokinetics is highly variable and decoupled from the pre-Zechstein units, thus resulting in a rather heterogeneous porosity-permeability distribution. Partly due to this complexity and due to lower amount of compaction-related porosity reduction, the post Zechstein upper aquifer complex has a comparatively higher average permeability than the lower aquifer complex below the Zechstein unit (Table 1).
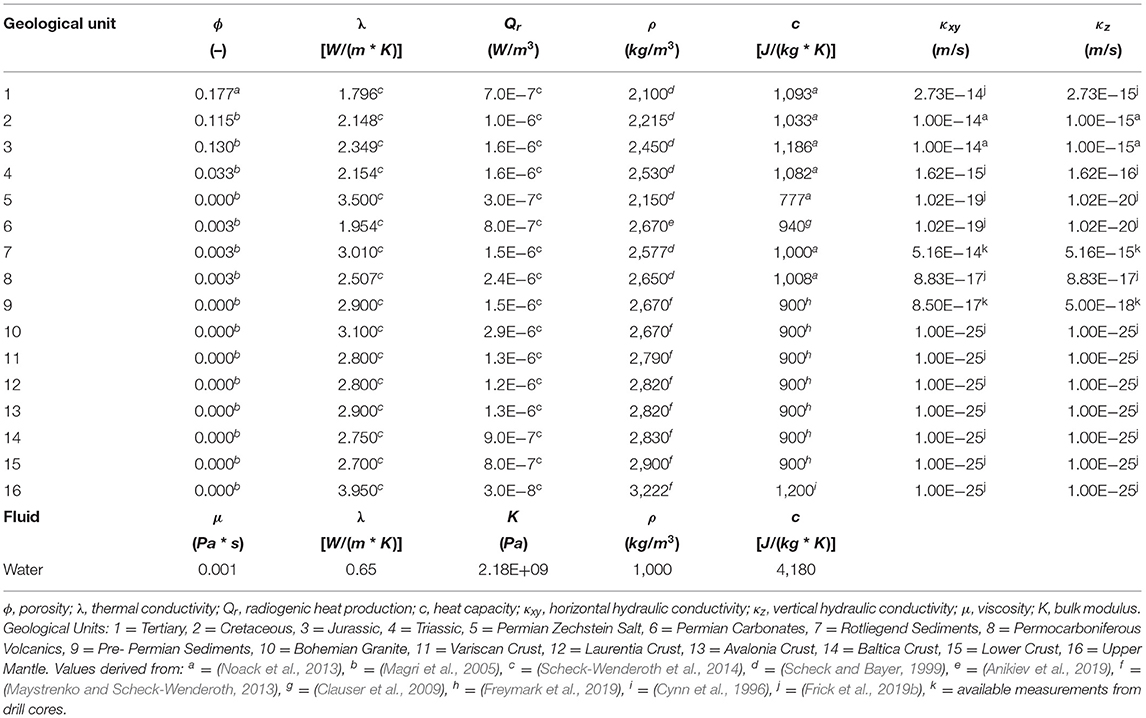
Table 1. Physical properties of the model units and water as used for the numerical simulations.
Deep geophysical surveys have revealed a high level of structural complexity between the different regional units at deeper crustal levels (Maystrenko et al., 2012a). This complex set-up is preserved in the 3D model in terms of a heterogeneous crustal configuration consisting of distinct adjacent crustal blocks locally outcropping at the surface (Figure 1).
The lowermost boundary of the model coincides with the 1,300°C isotherm deduced from receiver function studies (Geislser et al., 2010) and assumed to be representative of the temperature where the solidus of mantle peridotite meets the geotherm. The topography of this thermochemical boundary (see Supplementary Material) is rather heterogeneous, with its deepest domain beneath the East European Craton in the Northeast and its shallowest depth level in the North-West and South.
Model Set-Up
In order to carry out our numerical study, we imported the model geometry as described in the previous chapter to the in-house developed software Golem (Cacace and Jacquey, 2017). Golem is based on the MOOSE (Multiphysics Object-Oriented Simulation Environment) framework and has been developed to foster hybrid parallel and scalable implicit numerical solutions for non-linear thermal-hydraulic-mechanical and non-reactive chemical (THM-C) processes in fractured and unfractured porous rocks.
In this study, we focus on a numerical reconstruction of the thermo-hydraulic (TH) state of the system in response to the reconstructed ice dynamics following the latest glacial stage. Therefore, the final system of equations read as:
with ϕ = porosity, Kf = fluid bulk modulus, Ks = solid bulk modulus, pf = pore pressure, t = time, qD = Darcy velocity, k = permeability tensor, μf = fluid viscosity, ρf/s = fluid/solid density, g = gravitational acceleration, (ρc)b = ϕρfcf+(1−ϕ)ρscs)= bulk specific thermal storage with cf/s = heat capacity of fluid/solid, T = temperature, cf = specific heat capacity of the fluid, λb = ϕλf+(1−ϕ)λs = bulk (fluid, solid) thermal conductivity and = radiogenic heat production.
We converted the original 3D geological model into a consistent finite element mesh consisting of approximately 4 million degree of freedoms (dofs) subdivided into 15 computational layers. All simulations have been carried out on the JUWELS supercomputer hosted at the Jülich Supercomputer Center (JSC).
Table 1 lists all thermal and hydraulic properties adopted in this study. Individual units are assigned thermal and mechanical properties, which are dependent on and consistent with their dominant lithology. Our parameterization is based on a combination of available information from borehole data as well as from published literature derived from numerous sources. We consider isotropic properties for all units but for the permeability tensor, which we considered as orthotropic. Adopted values should be considered as chosen at the lower end of the possible spectrum. Our choice stems from the geological complexity of the model, where the main aquifer systems are locally interbedded by aquitards in the form of clay-rich intercalations, effectively hampering intra-aquifers hydraulic connectivity at depths. Moreover, the present-day structure of the study area is the result of several deformation phases during which some layers experience for example an early deep burial (and related compaction) followed by inversion-related uplift and erosion (Littke et al., 2008). Thus, units composed of clastic sediments with strongly reduced porosity and permeability may be located also at very shallow depth. It is this complexity that required to parametrize the model units mostly based on well measurement data whenever available. In addition, the values chosen to parametrize the model are consistent with previous coupled heat and fluid transport studies in the region, which show a small misfit to measured temperatures (among others Noack et al., 2013 and references therein). We do not claim, that using isotropic fixed values for the units is the best approximation to reality, we are however confident that the values chosen are conservative and representative of the different stratigraphies.
Reconstructed ice Dynamics
We derived the upper thermal and pressure boundary conditions based on the GLAC-1D dataset (Tarasov et al., 2014). This is the result of an approximate Bayesian calibration of a glaciological model against a large set of geological and geophysical constraints (following the methodology of Tarasov et al., 2012). This dataset includes (i) ice thickness, (ii) glacier bed elevation, (iii) floating ice mask, (iv) proglacial lake depths, and, (v) temperature at the surface of the solid earth in a resolution of 0.5° in 1,000 year time slices. For the scope of this study, we limited the temporal window to between the last glacial maximum and present. In detail, we run our simulations from −26 kyrs till present-day with a time resolution of 100 yrs. Please note that all time values discussed hereafter should be considered as relative to present-day. The average ice coverage (Figure 2) is characterized by a bi-parted temporal evolution starting by an initial value of 52% of the model area being covered by ice at −26 kyrs, increasing until the LGM where 65% of the area is covered by ice sheets. After the LGM, the ice coverage decreases down to 4% at around −14 kyrs and to ice-free conditions starting at approximately −10 kyrs.
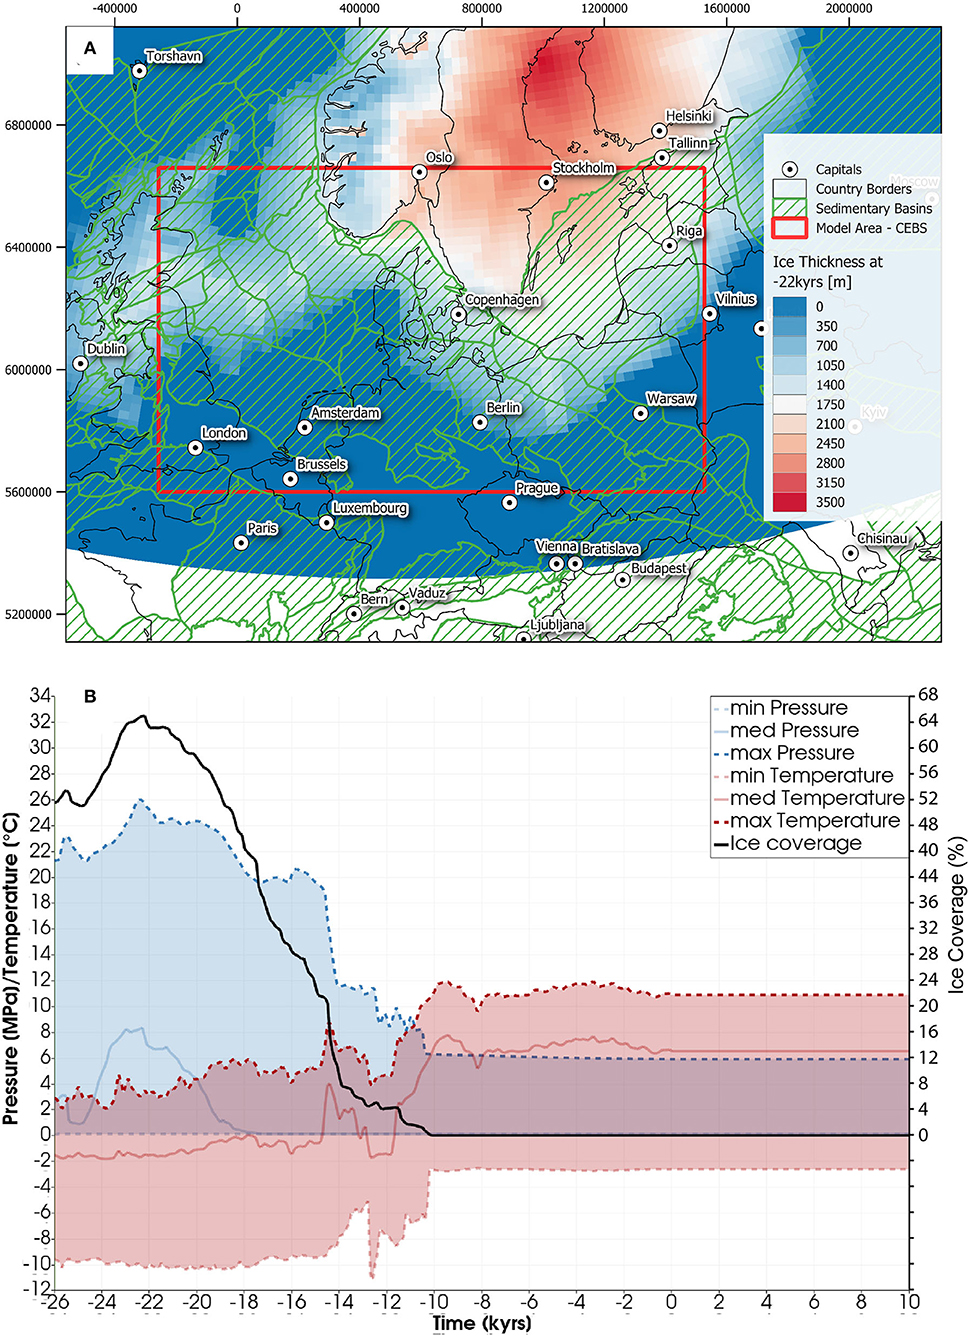
Figure 2. Input and output data used to represent the time varying boundary conditions at the topmost surface of the model. (A) Extent of the modeled ice thickness (0.5 degrees resolution) at −26 kyrs after Tarasov et al. (2014). The red square outlines our model area extent. The cross hatched green areas highlight the sedimentary basins after Robertson and Tellus (2018). Coordinates are in UTM Zone 32N. (B) Temperature (red curves), pressure (blue curves) and ice coverage (black curve) used as upper boundary conditions (applied to topmost interface of numerical model) over the whole time window considered in this study. Acronyms: min = minimum, max = maximum, med = median values. A video file of the temporal and lateral variations of both the pressure and temperature across the whole study area is provided as Supplementary Material to the manuscript.
We compute the pore pressure distribution at the surface assuming a constant density for the ice (910 kg/m3), seawater (1,025 kg/m3) and fresh water (1,000 kg/m3). The resulting pressure at the base of the ice, lake bed, sea bed and in ice free domains is then computed as:
where hice is the thickness of the ice, hsea and hlake is the bathymetry with reference to the seabed or lake bed, respectively, and is the atmospheric pressure normalized by the gravity acceleration. In Equation (4) we consider the whole ice column to derive the pressure boundary condition along the topmost surface. This is equivalent to assuming the ice base to be in direct hydraulic contact with the underlying rock throughout the model domain covered by an ice sheet (warm based ice sheet approximation). We follow this approximation based on the temperature derived from the GLAC-1D database, which are indicative of a wet based ice sheet beneath the majority of the study area. However, there is evidence for the presence of frozen ice conditions and/or permafrost formation within the northernmost domains of the study area (e.g., Lagerbäck and Sundh, 2008 for Fennoscandia). In such a setting, the impact from the ice loading on the subsurface pore pressure would not be direct as modeled in our study, but rather mediated via a poro-elastic stress transfer from the ice base to the underground rocks, a process that we neglect in this study. Within our study area, the domains where we would expect a cold based ice sheet correspond mainly to the shields and cratonic areas in the north-northeast, that is, domains that are characterized by relatively low permeability values, which also limits hydraulic connectivity between the ice base and the underlying rocks. There is also evidence of subglacial tunneling and undulations in the rock surface where the glacier is resting on, leading to local hydraulic discontinuity between the ice sheet and the subsurface, a process difficult to investigate at the scale of our model and that would require refined local studies targeting specific sub-domains in the study area.
The resulting pore pressure (Figure 2) ranges between minima during ice free conditions to maxima at ~26 MPa (highest ice thickness at −22.5 kyrs) with a median of the distribution that matches its lower bound. The temporal evolution of the pore pressure distribution is affected by the ice cap dynamics, and it is characterized by a relatively fast increase in the median of the distribution up to the LGM, followed by a systematic drop to ice free conditions at about −10 kyrs with maxima of approximately 6 MPa, related to the high water depth in the Norwegian Trough.
We derive thermal boundary conditions from the basal/ground temperature, provided by the GLAC-1D datasets. GLAC-1D provides the temperature of the ice sheet relative to the pressure melting point (Tbpm) as standard output. We follow a wet based ice sheet approximation (in a consistent manner with what done above to derive our hydraulic boundary conditions) in order to derive the temperature at the base of the glacier to be used as thermal boundary conditions in our modeling. Therefore, the temperature boundary conditions have been derived as:
where Tb is the temperature at the base of the glacier (in °C), and Tbpm is the temperature of the ice sheet (also in °C) relative to the pressure melting point.
The temperature data also portray an uneven distribution in their median value, being closer to the colder temperature range. The evolution during the time period considered shows an initial increase in the median of the distribution until −15 kyrs, followed by a rapid acceleration during the last glacial interstadial. After this period, the median drops until −13 kyrs in the Younger Dryas. From this local minimum, the median increases again in the early Holocene approaching the stable climatic conditions of the Holocene with median temperatures of 6°C, minimum temperatures of −2°C and maximum temperatures of 11°C.
The pressure and temperature distributions derived based on Equation (4) and (5) are applied along the topmost surface of the model (surface of the solid earth) as first order, Dirichlet boundary conditions. The temporal resolution of the boundary conditions dataset matches the resolution of the GLAC-1D dataset (100 years). Therefore, those data have been linearly interpolated in time for solution steps smaller than this threshold when required.
We close the system of PDEs (Equations 1–3) by imposing an initial pore pressure and temperature distribution. Previous studies aiming at quantifying the effects of the boundary condition on the system's hydraulic regime opted to parameterize the initial setting as being in equilibrium with respect to the imposed boundary forcing (Frick et al., 2015, 2019a,b; Haacke et al., 2018; Koltzer et al., 2022). The assumption at play here is to neglect the system's memory from its past evolution. Indeed, we found that by assuming thermal and hydraulic equilibrium, that is steady state conditions, under a developed ice coverage provides unrealistically high thermal gradients and led to an overestimation of computed groundwater velocities. In an attempt to minimize the errors introduced to the model by such an initialization we derived the initial state of the system, by starting from an initial configuration which portrays thermal and hydraulic equilibrium with respect to the approximately ice-free conditions at −43 kyrs and ran an initial simulation up to the onset of the LGM at −26 kyrs, which we take as initial condition for the later simulations. These initial conditions, for both pore pressure and temperature, have been derived from this initial run where we approximated the evolution of the topmost boundary by a linear interpolation between the starting ice-free conditions at −43 kyrs up to the onset of the LGM at −26 kyrs.
Pore Pressure and Temperature Evolution
In this paragraph, we discuss the evolution of the system in terms of differential maps of pore pressure and temperature as extracted at a reference level of 1,000 m.b.s, considered as the maximum depth of glacial meltwater penetration (McIntosh et al., 2012). To help the following discussion, we present a subcrop map at the same depth level in Figure 3. From Figure 3 it is clear that, on a regional scale, the model area shows a subdivision in its geological configuration into major sedimentary sub-basins and adjacent crystalline domains. The latter are located preferentially along the borders of the model, as in the Variscan consolidated rocks in the south and the cratonic and shield areas in the north-northeast. Major sedimentary basins are characterized by older sediments along their basin edges, and increasingly younger sediments toward their main subsidence axes. The short-wavelength heterogeneities in the structural configuration in the central domain of the study area are the result of the Mesozoic mobilization of the Permian salt that has effectively reshaped the structural setting of the overlying basin fill (see also Figure 1C and Section Geology of Central and Northern Europe). As a result, the youngest units are found mainly in the Cenozoic rim synclines (depressions between major salt structures rising during this time), while the oldest units are located below those.
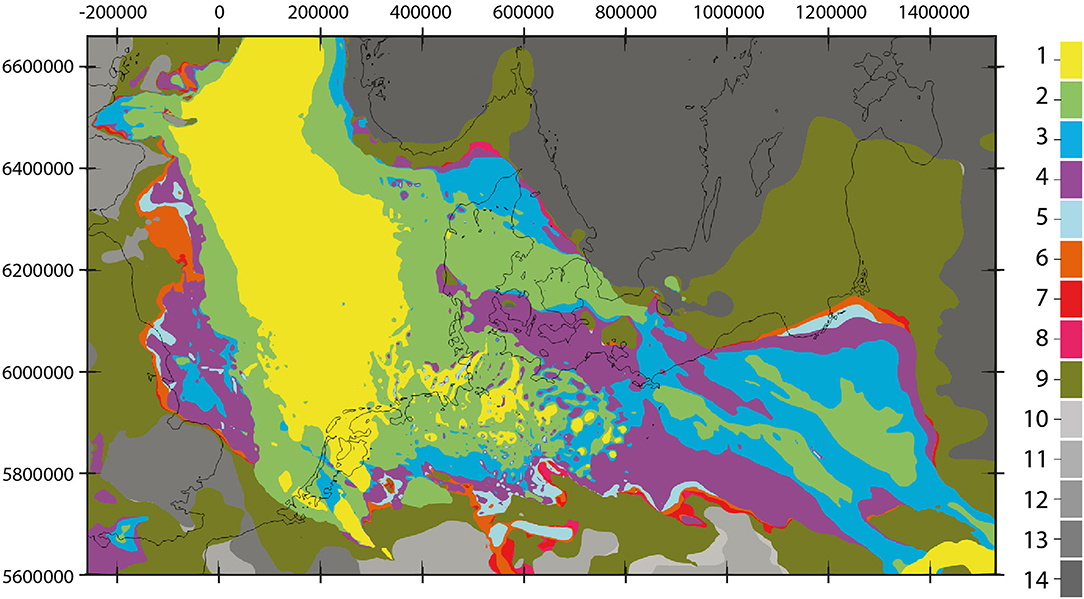
Figure 3. Distribution of geological units extracted at −1,000 m b.s.; different colors rep- resent different geological units: 1 = Tertiary, 2 = Cretaceous, 3 = Jurassic, 4 = Triassic, 5 = Permian Zechstein Salt, 6 = Permian Carbonates, 7 = Rotliegend Sediments, 8 = Permocarboniferous Volcanics, 9 = Pre-Permian Sediments, 10 = Bohemian Granite, 11 = Variscan Crust, 12 = Laurentia Crust, 13 = Avalonia Crust, 14 = Baltica Crust. Coordinates are in UTM Zone 32N.
In Figure 4 we plot difference maps of pore pressure at specific times in the system evolution. Observed changes in the pore pressure during the early stages of the system evolution (up to 20 kyrs before present, Figure 4A) correlate spatially with the distribution of ice thickness, that is both, increase and decrease, and its evolution during this time window. For this time window (−26 to −20 kyrs), the crustal domains loaded by the ice sheet (increasing ice thicknesses) are under elevated pore pressure conditions compared to the sedimentary aquifers to the west (decreasing ice thicknesses). In domains of decreasing ice thickness, pore pressure disturbances can propagate quite rapidly through the main aquifer systems, thereby effectively diffusing the pore pressure induced by the loading from the ice sheet. Consequently, while loading of the crystalline domains in the northeast by the advancing ice sheet causes excess pore pressure beneath these areas, dissipation of the previously accumulated pore pressure and the retreating ice sheet characterizes the sedimentary domains to the west.
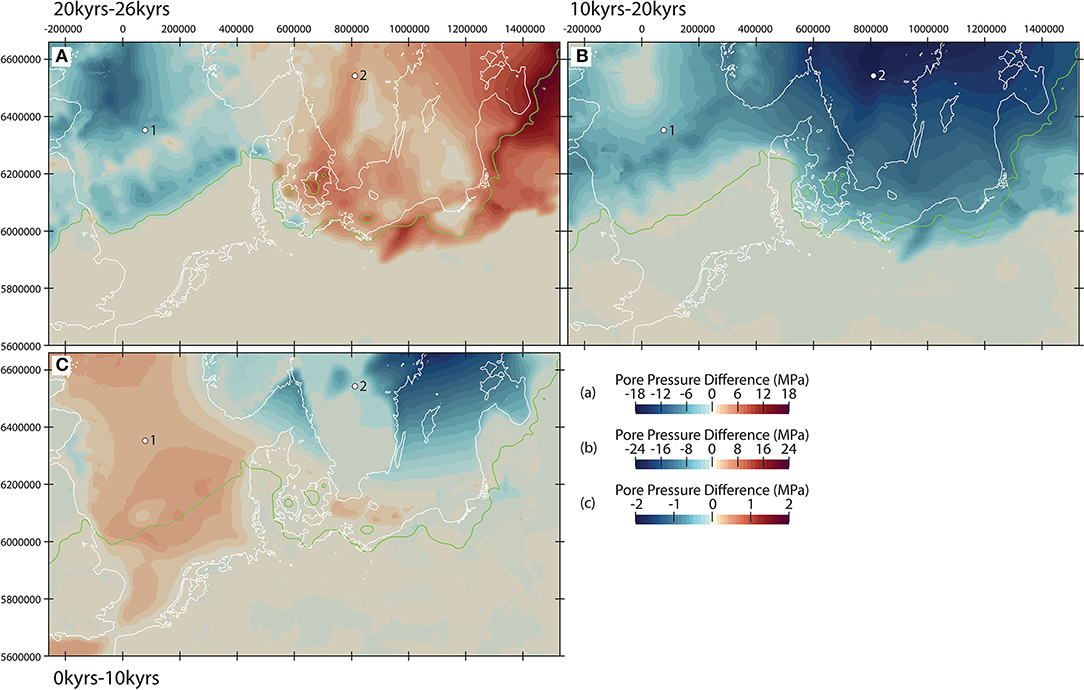
Figure 4. Pore pressure difference between selected time steps at −1,000 m b.s.: (A) pore pressure at−20 kyrs minus pore pressure at −26 kyrs, (B) pore pressure at −10 kyrs minus pore pressure at −20 kyrs, (C) Pore pressure at 0 kyrs (present) minus pore pressure at 10 kyrs, and (A–C) white lines = coastline, green line = maximum ice extent at −22 kyrs, white dots represent extraction locations from Figure 7: 1 = central North Sea, 2 = northern crust. Coordinates are in UTM Zone 32N.
This positive correlation between pore pressure build-up and dissipation (Figure 4A), and ice thickness variations is mostly evident along the ice rim, leading to the development of local hydrodynamics within the main aquifer systems that reflect variations in the ice sheet topography (Figure 5A). The excess in pore pressure underneath the ice forces fluid to flow into the ice-free areas to the south, where the groundwater level is lower (no excess pore pressure) and where permeable sediments are present. This leads to the onset of a regional groundwater flow system driven solely by the ice dynamics and the topography of the ice sheet, having a kilometer-scale penetration depth, reaching as far down as the deep Rotliegend aquifer system. The onset of this groundwater flow influences the distribution of heat, promoting local perturbations in the temperature distribution of short wavelengths as evidenced by the presence of groundwater driven advective cooling and heating induced by the presence of hydraulic gradients mainly located along the glacial front (Figure 6A). These effects are superposed, and partially overprinted by imposed changes in the surface temperature boundary condition, making it therefore difficult to isolate the effects of pressure driven convection alone. Highest differences are found at the ice rim location (west of Denmark), which we can attribute to pore pressure driven process, as variations in the temperature boundary condition at these locations are only minor (compare Supplementary Material and Figure 5A).
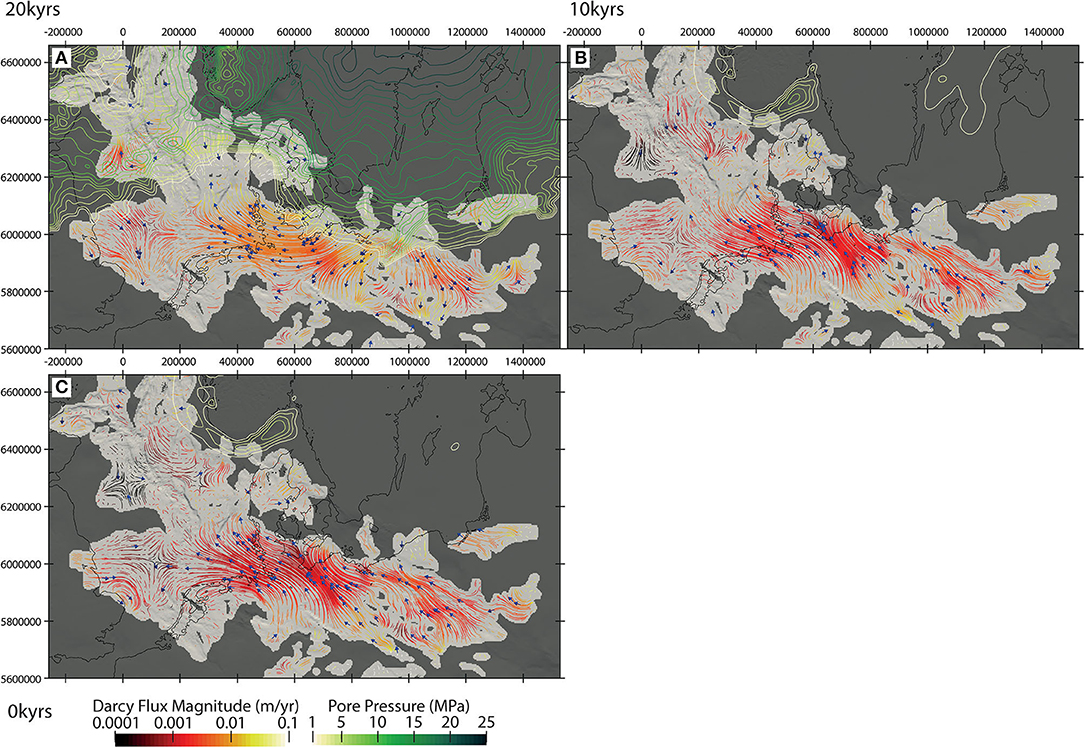
Figure 5. Fluid flow paths for the Rotliegend and pressure at the top of the model for selected time-steps, (A) −20 kyrs, (B) −10 kyrs, (C) 0 kyrs, and (A–C) bright gray colors = extent of Rotliegend aquifer, dark gray = underlying basement, blue arrows = fluid flow direction projected in 2D. Coordinates are in UTM Zone 32N.
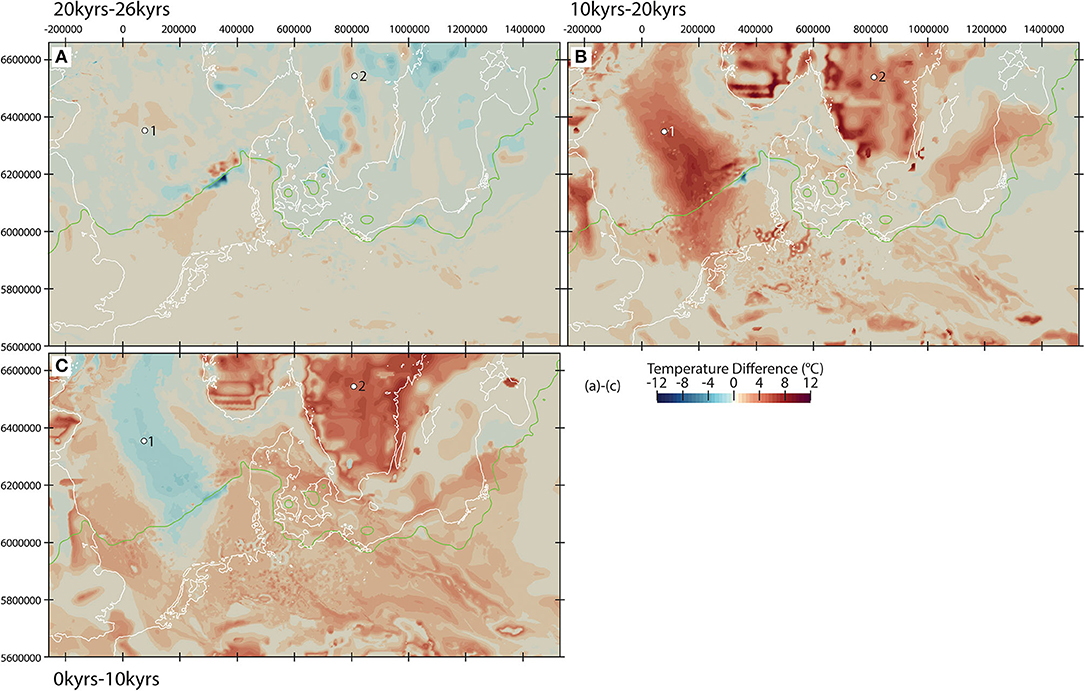
Figure 6. Temperature difference between selected time steps at −1,000 m b.s.: (A) temperature at −20 kyrs minus temperature at −26 kyrs, (B) temperature at −10 kyrs minus temperature at −20 kyrs, (C) Temperature at 0 kyrs minus temperautre at 10 kyrs, and (A–C) white lines = coastline, green line = maximum ice extent at −22 kyrs, white dots represent extraction locations from Figure 7: 1 = central North Sea, 2 = northern crust, Coordinates are in UTM Zone 32N.
Between 20 and 10 kyrs before present, we note a general drop in subsurface pore pressure associated with the retreat of the ice sheet and a consequent reduction in the ice coverage and thickness (Figure 4B). This leads to a reversal in the groundwater flow within the sedimentary units with respect to the previous stage in the system evolution (Figure 5B). Due to the observed pore pressure decline and consequent reorganization of the regional groundwater flow, we find an overall increase in the temperatures within large parts of the study area, with the amount of heat gained being proportional to the thermal properties encountered at depths (Figure 6B).
Within the crystalline domain to the northeast, the model predicts ongoing release of pore pressure at the basement level up to present-day (Figure 4C). In contrast, the domain to the northwest portrays an opposite trend of pore pressure build-up, triggered by the rise of sea level associated with the isostatic adjustment of the crust and lateral flow in the permeable sedimentary units at depths (Figure 5C). The pressure drop along the continental margins leads to a significant decrease in the hydraulic gradient between on- and offshore. Hence, as the ice retreats and the sea level rises again, this gradient drops, leading to a reduction in the pore pressure in those regions. This process does not happen onshore, where the pressure release scales solely with the stored overpressure. The predicted pore pressure build-up promotes advective cooling within the porous sediments, and causes the temperature reductions in these domains (Figure 6C). Horizontal components of groundwater flow play a central role in this net subsurface cooling by conveying relatively cold water to zones of upward groundwater flow. Outside these domains characterized by relative high flow magnitudes, the remainder of the model area shows a different behavior where temperature evolves in time and space mainly due to variations in the imposed surface values.
In order to better visualize the role played by the local geology on the subsurface response to imposed glacial loading, we plot the evolution over time of the pore pressure and temperature as extracted from the model at two different locations in Figure 7: beneath the Central North Sea and beneath the Fennoscandian Shield (both extracted at 500 m below surface), as representative for a sedimentary and a domain of crystalline crust (location in Figures 4, 6), respectively. This depth level was chosen since it enables to showcase trends in temperature and pressure development while also not being too close to the upper boundary of the model. During the early stages, the pore pressure evolution is controlled to a first degree by the ice dynamics, resulting in a build-up of pore pressure in both domains synchronous to the advance of the ice cap. Magnitudes of induced overpressures scales with the ice thickness, thus explaining the difference in absolute pore pressure magnitudes observed in the two areas. After this initial stage, and coeval with the start of the ice sheet retreat, both domains undergo pore pressure dissipation. The crustal domains (having low nominal permeability) to the east are generally characterized by higher rates of pore pressure dissipation, as evidenced by the sharp decrease in pore pressure at early times after the retreat of the ice sheet (approximately within 1 kyr), which is then followed by a more gradual relaxation stage, still ongoing at present-day. In contrast, within the sedimentary basins in the North Sea, pore pressure diffusion is slower as evidenced by an overpressure condition enhanced by the lateral inflow of groundwater into these sedimentary units after the ice retreat. However, the overall pore pressure dissipation is comparatively fast for both domains, gradually slowing down as overpressure decreases. Groundwater-driven advective heating and cooling during the advance and retreat of the ice cap also influences the thermal configuration within the sedimentary rocks, linking changes between the upper thermal boundary condition and the temperature development at the investigated depth. This is different to the thermal state modeled for the crustal domain further to the east, where thermal equilibrium has been reached starting at ~8 kyrs before present-day.
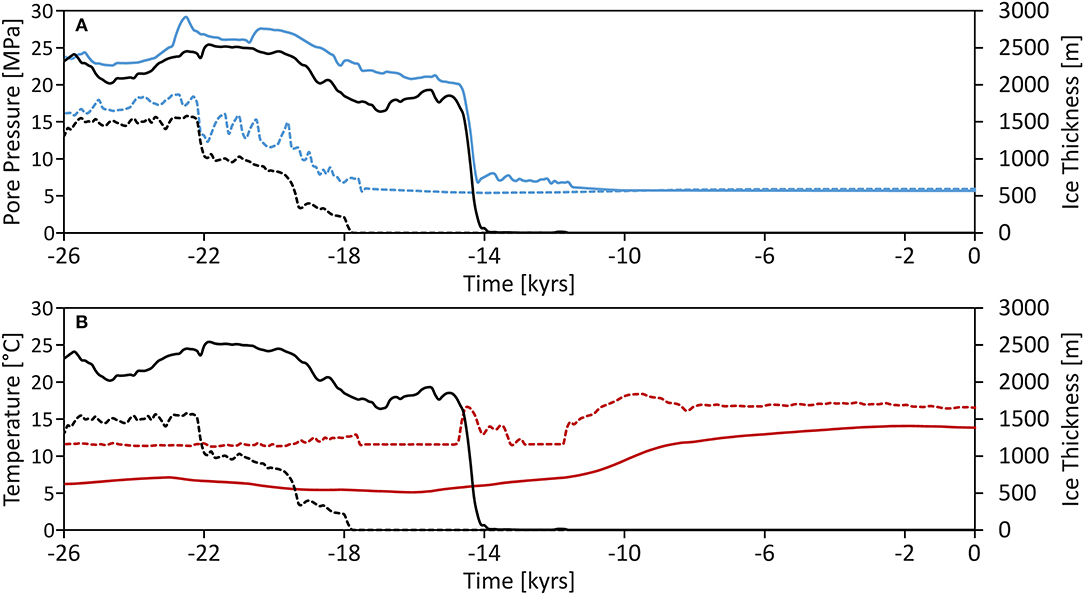
Figure 7. Temporal development of temperature and pressure for representative domains in the model at 500 m.b.s.: (A) pore pressure in the central North Sea (stippled blue line), and in Fennoscandian shield domain (solid blue line), (B) temperature in the central North Sea (stippled red line), and in the northern crustal domain (solid red line), (A,B) ice thickness in the central North Sea (stippled black line) and in the northern crustal domain (solid black line). Location of sample points in Figures 4, 6.
Discussions and Conclusions
Our model results show how the impacts of a realistic ice dynamics would manifest in terms of a pressure and thermal fingerprint, still visible at present. This results in a rather complex pore pressure and thermal configuration, both in time and space, which is the result of the interplay between the ice dynamics and the local hydrogeological setting. In an attempt to provide a quantification of these transients in the hydrothermal state of the system, in Figure 8A we compare available measured temperatures and modeled temperatures at present-day. We also compute a steady state conductive thermal field as it would develop in response to the modern configuration only. By taking the difference between these two modeling results, we can then assess to what extent the temperature distribution at the present-day deviates from an equilibrium state, as typically assumed in previous works (Scheck-Wenderoth et al., 2014; Sippel et al., 2015; Frick et al., 2016; Fuchs et al., 2020).
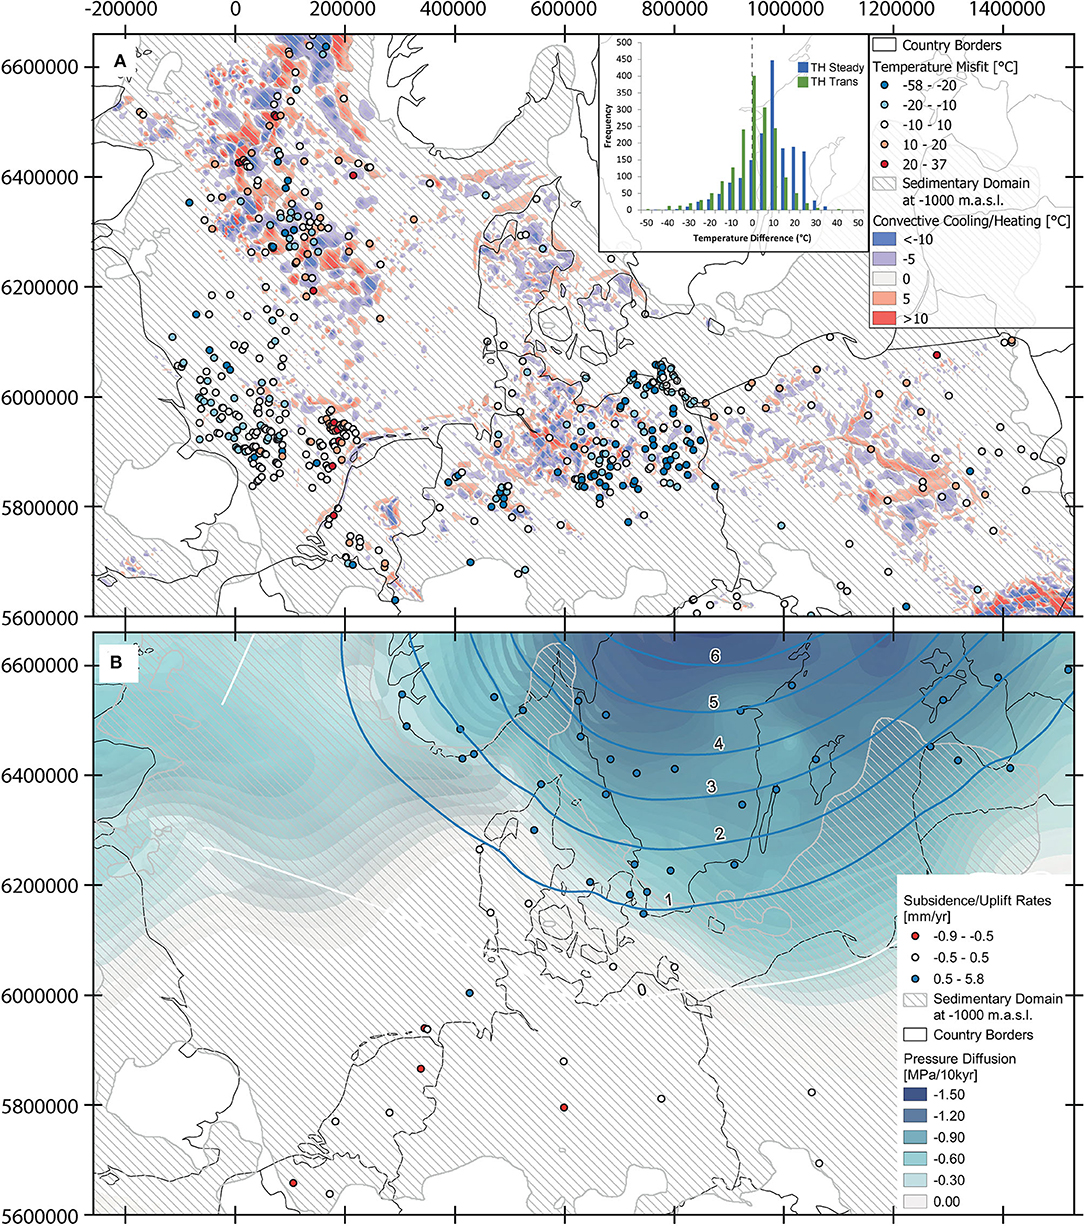
Figure 8. Comparison of modeled data to measured data. (A) Temperature misfit (modeled - measured) between the transient model at present day and available measurements (Supplementary Material), blue spheres: model colder than measurements, red spheres: model warmer than measurements. Not all temperature misfits are shown as some localities have more than one measurement vertically. All misfits have been included in the histograms. Backdrop represents influence of convection at −26 kyrs (TH model – T model), inlay: histogram of temperature misfits for the transient model and the steady state model for 0 kyrs (modeled - measured). (B) Circles represent uplift rates at present day after (Vestøl et al., 2019), contour lines represent the empirical model of uplift rates at present day after (Vestøl et al., 2019), backdrop represents the pore pressure dissipation (depth integrated along the model) at present day plotted along in map view to, illustrate its variations in space (A,B) black lines represent the coastline as derived from the 0 m contour of the topography distribution of the top slice of the model, Coordinates are in UTM Zone 32N.
We found a good fit between model results and observations, with the majority of the values plotting within a confidence interval of ±10°C. Outliers are found within the northern North Sea and in the North German Basin in the South, domains where our results indicate the presence of extensive groundwater-driven convective cooling/heating (background colors in Figure 8A) during the whole evolution of the system. It is therefore likely that our regional model provides an overly simplistic hydrogeological characterization of the heterogeneous sedimentary sequences in these areas, which hindered to match local measurements. If we compare the results obtained by our model to those derived from assuming thermal equilibrium at present-day, we note that the former provide a better agreement with the available observations (compare the two histograms in Figure 8A). The temperature distribution obtained by a model which features thermal equilibrium at present overestimates available measurements, as visible in the median of the distribution plotting at +20°C. This is indicative that present-day temperatures within the study area are still out of equilibrium with respect to modern boundary conditions and to the persistence of a thermal memory of the system to the last glaciation, despite it ended locally more than 10 kyrs before present.
The transition from ice covered to ice free conditions coincides not only with a reorganization of the groundwater flow system, but also with a drop in groundwater velocities up to one order of magnitude (Figures 5A,B) following the retreat of the ice sheet, thereby resulting in longer times to dissipate the thermal signal. While the dissipation of the thermal signal would be slowly going on even without fluid flow, the change in groundwater flow rates might explain the still visible imprint of the last glaciation on the present-day thermal configuration. Thereby, the ongoing thermal relaxation of subsurface temperatures observed beneath areas which were previously covered by the ice sheet could be related to both processes. Observations of the glacial thermal imprint can be found in numerous regions in Northern Europe (Kukkonen et al., 1994; Kukkonen and Jõeleht, 2003), i.e., in Udryn (Szewczyk and Nawrocki, 2011), Hannover and Ketzin (Fuchs et al., 2015) and several locations in Denmark (Balling, 2013; Møller et al., 2019), all areas which show temperature dissipation in our models as well.
The fact that the model is still in disequilibrium concerning its temperature distribution has implications for other vulnerability aspects in earth dynamics. In the context of climate change and consequent greenhouse gas emissions, variations in the temperature within continental shelves and slopes can drastically impact stability conditions of gas hydrates. Previous studies have indeed demonstrated that post glacial ocean warming, together with lowering in relative sea level can lead to dissociation of gas hydrates, increase methane seepage and continental slope instability causing submarine landslides (Jung and Vogt, 2004; Bangs et al., 2005; Klitzke et al., 2016).
The observed present-day temperature dissipation, coupled with the temperature increase in this region due to climate change, illustrate the high probability of fast changes in these regions. This might also have an effect on the groundwater chemistry. To illustrate this, studies have shown, that even when considering steady state solutions as initial conditions, models of groundwater utilization show a high dependency of groundwater safety (Sowers et al., 2006) and utilization success (Saito et al., 2016; Brehme et al., 2019) on the groundwater chemistry. Since the groundwater chemistry is linked to both pressure and temperature, and given the disequilibrium most systems are in due to the glaciation-related memory effect additionally enhanced by a fast-changing climate on the subsurface, solubility of minerals in groundwater may change as well. Such mechanisms could explain some observations and problematics connected with mineral precipitation or transport.
We also found a spatial correlation between modeled areas where pore pressure dissipation is still ongoing and modern uplift rates (Figure 8B). In Figure 8 we plot the value of pore pressure dissipation, depth integrated across the domain and show them in a map view in order to illustrate variations at each given location. Areas that are currently undergoing uplift as a result of post-glacial rebound are also characterized by a transient hydrogeological system that is still re-equilibrating the remnant pore pressure signal that existed during the active phase of glaciation. This is best evidenced within the crustal domains in the northeast, where modeled decompression of pore fluid, locally enhanced by porosity rebound from the unloading which followed the ice sheet retreat and sediments erosion, can provide an explanation to the underpressure generation observed at present in these domains. Our results therefore demonstrated, that not only uplift due to glacial isostatic adjustment is still ongoing, but also that the direct hydraulic loading from the ice sheet dynamics caused a long-term signal on the subsurface hydraulics, still visible at present day. All major basins are indeed characterized by elevated groundwater flow and recharge rates during the active phase of glaciation as compared to non-glacial periods, and we found that in these regions the present-day hydrogeological conditions are likely to reflect, at least partly, the impact of the last glaciation. These observations have important implications to interpret the mechanical stability of formerly glaciated areas including the in-situ stress field and faulting behavior of rocks, all aspects that depend on the pore pressure state. The ongoing post-glacial reduction in overpressured compartments as depicted by our model might promote, in concert with the ongoing isostatic adjustment, reactivation of existing faults and provide an additional source for the occurrence of unexpected earthquakes in what is considered an otherwise stable continental region (Munier and Fenton, 2004; Kukkonen et al., 2010; e.g., Brandes et al., 2015; Mikko et al., 2015). In addition, this process also depends on stress changes induced by the flexure of the (visco)elastic lithospheric plate (Lund et al., 2009b). There is geological evidence on the existence of several major fault zones running through the model area (Brandes et al., 2015), which likely represent critical regions with regard to their stability. These observations call for caution in any planning of utilization of the subsurface, be that geothermal, hydrologic or probably most critically, nuclear waste disposal. In addition, in anticipation of further glacial cycles over the coming 1 million years such changes may occur with a cyclicity governed by the glaciations and also lead to repeated local change in groundwater flow dynamics and to pore pressure-related rock and fault weakening.
In the context of the search for safe nuclear disposal sites (e.g., BGE, 2021), the results of this study showed that several ongoing processes might impact the safety of such disposal sites, including seismicity connected to fault reactivation driven by a groundwater system that is still out of equilibrium with respect to the present-day hydraulic boundary forcing. Though a quantitative interpretation of the regional pressure patterns is complicated because of a lack of pore pressure data at the scale of the whole model area, our results provide indications of an important feedback mechanism between the local hydrogeological configuration, groundwater dynamics and the still ongoing deformation triggered by the most recent ice dynamics. These results have implications for a sound understanding of the hydrogeological framework and its evolution in space and time, which is essential to predict the stability and safety of any chosen site.
The model presented in this manuscript, while already depicting a high amount of complexity, relies on some assumptions or simplifications which should be considered while revisiting the implications from the study and which will be considered in future studies. The main simplification stems from neglecting the additional effects from a full mechanical coupling, either in the form of a visco-elastic crustal rebound or poro-elastic stress transfer within sedimentary rocks. With respect to the effects from an ongoing at present viscoelastic crustal rebound, we should note that the relaxation time derived from GIA models is of the order of a few thousands years, (e.g., Klemann and Wolf, 1998), which differ from Maxwell relaxation time scales (100s of yrs) used to describe the shear relaxation of mantle material. This entails that the build-up of shear stress from lithospheric flexure is likely to be relevant on deglaciation time scales. Crustal and upper mantle rocks are usually approximated as purely elastic materials in GIA studies. It follows that sedimentary and crustal rocks will respond to induced stress from an ice sheet via a poro-elastic stress transfer, while their viscous contribution to the overall relaxation of induced stress (or overpressure) can be considered of secondary relevance. This (poro)elastic response will also alter the hydraulic setting within the main sediments, thus affecting the resulting pore pressure evolution. It is important to mention, that the mantle viscosity likely plays an important role in the ongoing glacial rebound in Fennoscandia, affecting induced horizontal stresses buffered by the poro-elastic deformation of the overlying crust. Our study neglects these additional effects, as it is not a full GIA model, by considering a purely hydraulic response of the system parameterized in terms of a boundary condition along the topmost surface of the model, which likely underestimate magnitudes of induced pore pressure signals. Despite these assumptions, the main message from our study, that is, the fact that the system is in a state of hydraulic and thermal disequilibrium with respect to the present-day set-up (water table) and that this imbalance stems from its thermo-mechanical memory from the last glaciation, should be considered valid. The results presented in our study provide therefore a conservative estimate of the actual pore pressure evolution. We found that the system is in a state of hydraulic and thermal disequilibrium with respect to the present-day boundary set-up, and that this imbalance results from its thermo-hydraulic memory from the last glaciation. Therefore, by neglecting the additional poro-elastic stress transfer within the sedimentary rocks, we might have underestimated pore pressure magnitudes, but these additional effects would not affect the regional patterns seen in both the pore pressure and thermal field, which results from the complex interplay between the ice dynamics and the complex geology of the area. Our results, which are based on a detailed 3D geological model, highlight a different hydraulic behavior depending on the local geological conditions encountered at depths. While crustal domains display the highest rate of pore pressure dissipation, despite being the domains that underwent substantial direct loading from the ice, the majority of sedimentary sub-basins still depict a pore pressure signal indicative of disequilibrium at present. We would expect that this remnant effect would likely be more pronounced by considering the additional poromechanics effects within these permeable porous rocks, while poroelasticity would be only minor in the mechanically stiffer crustal domains. The crustal domains are experiencing glacial rebound, however, which could link back to them being in hydraulic disequilibrium as well. Considering this additional coupling could also provide a better fitting to available temperature measurements (considering that our model provides already an improvement over published ones which do not consider these transient effects), which are mainly located within the sedimentary domains, that is domains where we would expect poro-elastic effects to become more important. In addition to this direct source of stress transfer, flexure of the lithosphere could also introduce an additional spatial and temporal variability in the computed stress field. Therefore, future studies should focus on quantifying these additional dynamics and their effects on the resulting hydraulic state of the system.
An important asset to improve the reliability of the conclusions derived would be to investigate the additional effects that variations in the fluid properties, namely its density and viscosity as a function of the evolving pressure, temperature and chemical conditions, would have on the regional fluid dynamics. Our model has been limited to a time window covering the latest stage of the most recent glacial cycle so far. In this regard, it would be interesting to widen the temporal evolution to the entire deglaciation stage (starting at −116 kyrs), thereby covering the full glacial cycle. The reason for this suggestion is the need to test the hypothesis that the memory effect of different glacial cycles would be even more pronounced in longer simulations, given the accumulation of more overpressure and stronger cooling of the subsurface. The structural model we used as base geometry in our model, while already showing a high degree of differentiation (Figure 1), could also be improved by resolving additional heterogeneities in the shallow sedimentary aquifers as the shallow variations in physical properties have been shown to have a large impact in the modeling result (Frick et al., 2016). We have shown that the distribution of permeability exerts a control on the model response. This calls for additional studies aiming at quantifying the degree of uncertainties introduced by our parameterization. This in turn would require to perform extensive global sensitivity studies, via ensemble modeling, that should consider uncertainties not only in the model parameters, but also in the geological configuration of the sedimentary sequence for which hard data are lacking at the scale of our study. In general, the uncertainty in the model unit parameterization, while in accordance with all available data, could also be investigated further, i.e., with Monte Carlo style simulations. Here, the transient nature of the model runs and the large number of involved parameters would require substantial processing power and is therefore postponed to a later stage. Permafrost generation would possibly result in additional pressure effects, potentially reducing/enhancing those triggered by the glacial processes. However, given surface temperature conditions as derived from the GLAC-1D database typical of a wet based ice sheet, it is likely that permafrost within the investigated area would have played only a secondary role in shaping the regional groundwater dynamics.
Data Availability Statement
The datasets presented in this study can be found in online repositories. The names of the repository/repositories and accession number(s) can be found below: https://doi.org/10.5880/GFZ.4.5.2021.003.
Author Contributions
MF prepared the mentioned 3-D model, conducted the coupled simulations, and drafted the manuscript. MC helped to draft the manuscript and setting up the coupled simulations. LT supplied the data for the boundary conditions. MS-W, MC, LT, and VK participated in the design of the study and contributed with discussions and the interpretation of the results. All authors have read and approved the final manuscript.
Funding
The work described in this paper has received funding from the Initiative and Networking Fund of the Helmholtz Association through the project Advanced Earth System Modelling Capacity (ESM). The authors gratefully acknowledge the Earth System Modelling Project (ESM) for funding this work by providing computing time on the ESM partition of the supercomputer JUWELS (Krause, 2019) at the Jülich Supercomputing Centre (JSC) under the application 16050 entitled Quantitative HPC Modelling of Sedimentary Basin System. The grant number is: D-061-16-004.
Conflict of Interest
The authors declare that the research was conducted in the absence of any commercial or financial relationships that could be construed as a potential conflict of interest.
Publisher's Note
All claims expressed in this article are solely those of the authors and do not necessarily represent those of their affiliated organizations, or those of the publisher, the editors and the reviewers. Any product that may be evaluated in this article, or claim that may be made by its manufacturer, is not guaranteed or endorsed by the publisher.
Supplementary Material
The Supplementary Material for this article can be found online at: https://www.frontiersin.org/articles/10.3389/frwa.2022.818469/full#supplementary-material
References
Acosta, M., Passelègue, F. X., Schubnel, A., and Violay, M. (2018). Dynamic weakening during earthquakes controlled by fluid thermodynamics. Nat. Commun. 9:3074. doi: 10.1038/s41467-018-05603-9
Anikiev, D., Lechel, A., Dacal, M., Bott, J., Cacace, M., and Scheck-Wenderoth, M. (2019). A three-dimensional lithospheric-scale thermal model of Germany. Adv. Geosci. 49, 225–234. doi: 10.5194/adgeo-49-225-2019
Balling, N. (2013). The Lithosphere Beneath Northern Europe: Structure and Evolution Over Three Billion Years: Contributions from Geophysical Studies. Aarhus: Aarhus Universitet.
Bangs, N. L. B., Musgrave, R. J., and Tréhu, A. M. (2005). Upward shifts in the southern Hydrate Ridge gas hydrate stability zone following postglacial warming, offshore Oregon. J. Geophys. Res. Solid Earth 110, B03102. doi: 10.1029/2004JB003293
Bayer, U., Scheck, M., and Koehler, M. (1997). Modeling of the 3D thermal field in the northeast German basin. Geologische Rundschau 86, 241–251. doi: 10.1007/s005310050137
BGE (2021). Endlagersuche für hochradioaktive Abfälle - BGE. Available online at: https://www.bge.de/de/endlagersuche/ (accessed November 12, 2021).
Bjørlykke, K. (2010). “Heat transport in sedimentary basins,” in Petroleum Geoscience, (Berlin: Springer), 253–257. Available online at: https://link.springer.com/book/10.1007/978-3-642-02332-3#about
Brandes, C., Steffen, H., Steffen, R., and Wu, P. (2015). Intraplate seismicity in northern Central Europe is induced by the last glaciation. Geology 43, 611–614. doi: 10.1130/G36710.1
Brehme, M., Nowak, K., Banks, D., Petrauskas, S., Valickas, R., Bauer, K., et al. (2019). A review of the hydrochemistry of a deep sedimentary aquifer and its consequences for geothermal operation: Klaipeda, Lithuania. Geofluids 2019, 1–20. doi: 10.1155/2019/4363592
Bungum, H., Olesen, O., Pascal, C., Gibbons, S., Lindholm, C., and Vestøl, O. (2010). To what extent is the present seismicity of Norway driven by post-glacial rebound? J. Geol. Soc. 167, 373–384. doi: 10.1144/0016-76492009-009
Cacace, M., Bayer, U., Marotta, A. M., and Lempp, C. (2008). Driving Mechanisms for Basin Formation and Evolution. Berlin: Springer.
Cacace, M., and Jacquey, A. B. (2017). Flexible parallel implicit modelling of coupled thermal–hydraulic–mechanical processes in fractured rocks. Solid Earth 8, 921–941. doi: 10.5194/se-8-921-2017
Clauser, C., Koch, A., Jorand, R., Vogt, C., Arnold, J., Mottaghy, D., et al. (2009). Erstellung statistisch abgesicherter thermischer und hydraulischer Gesteinseigenschaften für den flachen und tiefen Untergrund in Deutschland. Lehrstuhl Applied Geophysics and Geothermal Energy, EON Energy Research Center, RWTH Aachen University, Aachen, Germany.
Cynn, H., Carnes, J. D., and Anderson, O. L. (1996). Thermal properties of forsterite, including Cv, calculated rom αKT through the entropy. J. Phys. Chem. Solids 57, 1593–1599. doi: 10.1016/0022-3697(96)00060-1
Ferguson, G., Beltrami, H., and Woodbury, A. D. (2006). Perturbation of ground surface temperature reconstructions by groundwater flow? Geophys. Res. Lett. 33, 1–5. doi: 10.1029/2006GL026634
Freymark, J., Bott, J., Cacace, M., Ziegler, M., and Scheck-Wenderoth, M. (2019). Influence of the main border faults on the 3d hydraulic field of the central upper Rhine Graben. Geofluids 2019. doi: 10.1155/2019/7520714
Frick, M., Scheck-Wenderoth, M., Sippel, J., and Cacace, M. (2015). Sensitivity of a 3D geothermal model of Berlin with respect to upper boundary conditions. Energy Proc. 76, 291–300. doi: 10.1016/j.egypro.2015.07.864
Frick, M., Sippel, J., Cacace, M., and Scheck-Wenderoth, M. (2016). The geothermal field below the city of Berlin, Germany: results from structurally and parametrically improved 3D models. Energy Proc. 97, 334–341. doi: 10.1016/j.egypro.2016.10.011
Frick, M., Scheck-Wenderoth, M., Cacace, M., and Schneider, M. (2019a). “Boundary condition control on inter-aquifer flow in the subsurface of Berlin (Germany) – new insights from 3-D numerical modelling,” in Advances in Geosciences, ed M. Kühn (Potsdam: Copernicus GmbH), 9–18.
Frick, M., Scheck-Wenderoth, M., Schneider, M., and Cacace, M. (2019b). Surface to groundwater interactions beneath the city of Berlin - Results from 3D models. Geofluids 13, 1–22.
Fuchs, S., Balling, N., and Förster, A. (2015). Calculation of thermal conductivity, thermal diffusivity and specific heat capacity of sedimentary rocks using petrophysical well logs. Geophys. J. Int. 203, 1977–2000. doi: 10.1093/gji/ggv403
Fuchs, S., Balling, N., and Mathiesen, A. (2020). Deep basin temperature and heat-flow field in Denmark–New insights from borehole analysis and 3D geothermal modelling. Geothermics 83, 101722. doi: 10.1016/j.geothermics.2019.101722
Geislser, W. H., Sodoudi, F., and Kind, R. (2010). Thickness of the central and eastern European lithosphere as seen by S receiver functions. Geophys. J. Int. 181, 604–634. doi: 10.1111/j.1365-246X.2010.04548.x
Grünthal, G., Stromeyer, D., Bosse, C., Cotton, F., and Bindi, D. (2018). The probabilistic seismic hazard assessment of Germany—version 2016, considering the range of epistemic uncertainties and aleatory variability. Bull. Earthquake Eng. 16, 4339–4395. doi: 10.1007/s10518-018-0315-y
Haacke, N., Frick, M., Scheck-Wenderoth, M., Schneider, M., and Cacace, M. (2018). 3-D simulations of groundwater utilization in an urban catchment of Berlin, Germany. Adv. Geosci. 45, 177–184. doi: 10.5194/adgeo-45-177-2018
Hagros, A., Engelhardt, J., Fischer, T., Gharbieh, H., Hautojärvi, A., Hellä, P., et al. (2021). Host Rock Target Properties for Norwegian National Facility. Tampere, AINS - Civil Engineering.
Hainzl, S., Kraft, T., Wassermann, J., Igel, H., and Schmedes, E. (2006). Evidence for rainfall-triggered earthquake activity. Geophys. Res. Lett. 33, L19303. doi: 10.1029/2006GL027642
Jung, W.-Y., and Vogt, P. R. (2004). Effects of bottom water warming and sea level rise on Holocene hydrate dissociation and mass wasting along the Norwegian-Barents Continental Margin. J. Geophys. Res. Solid Earth 109, B06104. doi: 10.1029/2003JB002738
Kaiser, B. O., Cacace, M., Scheck-Wenderoth, M., and Lewerenz, B. (2011). Characterization of main heat transport processes in the Northeast German basin: constraints from 3-D numerical models. Geochem. Geophys. Geosyst. 12, 1–17. doi: 10.1029/2011GC003535
Klemann, V., and Wolf, D. (1998). Modelling of stresses in the Fennoscandian lithosphere induced by Pleistocene glaciations. Tectonophysics 294, 291–303. doi: 10.1016/S0040-1951(98)00107-3
Klitzke, P., Luzi-Helbing, M., Schicks, J. M., Cacace, M., Jacquey, A. B., Sippel, J., et al. (2016). Gas hydrate stability zone of the Barents Sea and Kara Sea region. Energy Proc. 97, 302–309. doi: 10.1016/j.egypro.2016.10.005
Koltzer, N., Kommana, G., Cacace, M., Frick, M., Bott, J., and Scheck-Wenderoth, M. (2022). Influences of hydraulic boundary conditions on the deep fluid flow in a 3D regional model (central Upper Rhine Graben). Environ. Earth Sci. 81, 1–18. doi: 10.1007/s12665-021-10111-z
Kooi, H. (2016). Groundwater flow as a cooling agent of the continental lithosphere. Nat. Geosci. 9, 227–230. doi: 10.1038/ngeo2642
Krause, D. (2019). JUWELS: Modular Tier-0/1 Supercomputer at the Jülich Supercomputing Centre. J. Large Scale Res Facilities 5, 135. doi: 10.17815/jlsrf-5-171
Kukkonen, I. T., Cermák, V., and Šafanda, J. (1994). Subsurface temperature—depth profiles, anomalies due to climatic ground surface temperature changes or groundwater flow effects. Global Planetary Change 9, 221–232. doi: 10.1016/0921-8181(94)90017-5
Kukkonen, I. T., and Jõeleht, A. (2003). Weichselian temperatures from geothermal heat flow data. J. Geophys. Res. Solid Earth 108, 1–11. doi: 10.1029/2001JB001579
Kukkonen I. T. Olesen O. Ask M. V. S. GROUP the P. W. (2010). Postglacial faults in fennoscandia: targets for scientific drilling. GFF 132, 71–81. doi: 10.1080/11035891003692934
Lagerbäck, R., and Sundh, M. (2008). Early Holocene Faulting and Paleoseismicity in Northern Sweden. Uppsala: Geological Survey of Sweden.
Lambeck, K., Smither, C., and Johnston, P. (1998). Sea-level change, glacial rebound and mantle viscosity for northern Europe. Geophys. J. Int. 134, 102–144. doi: 10.1046/j.1365-246x.1998.00541.x
Lankof, L. (2020). Assessment of permian zubers as the host rock for deep geological disposal. Energies 13, 2239. doi: 10.3390/en13092239
Littke, R., Bayer, U., Gajewski, D., and Nelskamp, S. (2008). Dynamics of Complex Intracontinental Basins: The Central European Basin System. Berlin: Springer Science & Business Media.
Løtveit, I. F., Fjeldskaar, W., and Sydnes, M. (2019). Tilting and flexural stresses in basins due to glaciations—An example from the Barents Sea. Geosciences 9, 474. doi: 10.3390/geosciences9110474
Lund, B., Schmidt, P., and Hieronymus, C. (2009b). Stress Evolution and Fault Stability During the Weichselian Glacial Cycle. Available online at: https://www.osti.gov/etdeweb/biblio/971759 (accessed November 18, 2021).
Lund, B., Näslund, J.-O., Connor, C. B., Chapman, N. A., and Connor, L. J. (2009a). “Glacial isostatic adjustment: implications for glacially induced faulting and nuclear waste repositories,” in Volcanic and Tectonic Hazard Assessment for Nuclear Facilities, 142–155. Available online at: https://www.cambridge.org/core/books/abs/volcanic-and-tectonic-hazard-assessment-for-nuclear-facilities/glacial-isostatic-adjustment-implications-for-glacially-induced-faulting-and-nuclear-waste-repositories/60CC6B10C3E0A36FED5C52602B7725B8
Magri, F., Bayer, U., Clausnitzer, V., Jahnke, C., Diersch, H.-J., Fuhrmann, J., et al. (2005). Deep reaching fluid flow close to convective instability in the NE German basin - results from water chemistry and numerical modelling. Tectonophysics 397, 5–20. doi: 10.1016/j.tecto.2004.10.006
Majorowicz, J., and Wybraniec, S. (2011). New terrestrial heat flow map of Europe after regional paleoclimatic correction application. Int. J. Earth Sci. 100, 881–887. doi: 10.1007/s00531-010-0526-1
Maystrenko, Y. P., Bayer, U., and Scheck-Wenderoth, M. (2012a). Regional-scale structural role of Permian salt within the Central European Basin System. Geol. Soc. 363, 409–430. doi: 10.1144/SP363.19
Maystrenko, Y. P., Bayer, U., and Scheck-Wenderoth, M. (2012b). Salt as a 3D element in structural modeling — example from the central European basin system. Tectonophysics 591, 62–82. doi: 10.1016/j.tecto.2012.06.030
Maystrenko, Y. P., and Scheck-Wenderoth, M. (2013). 3D lithosphere-scale density model of the central European basin system and adjacent areas. Tectonophysics 601, 53–77. doi: 10.1016/j.tecto.2013.04.023
Maystrenko, Y. P., Scheck-Wenderoth, M., and Anikiev, D. (2020). 3D-CEBS: Three-Dimensional Lithospheric-Scale Structural Model of the Central European Basin System and Adjacent Areas. Potsdam: GFZ German Research Center Geoscience
McIntosh, J. C., Schlegel, M. E., and Person, M. (2012). Glacial impacts on hydrologic processes in sedimentary basins: evidence from natural tracer studies. Geofluids 12, 7–21. doi: 10.1111/j.1468-8123.2011.00344.x
Mikko, H., Smith, C. A., Lund, B., Ask, M. V., and Munier, R. (2015). LiDAR-derived inventory of post-glacial fault scarps in Sweden. GFF 137, 334–338. doi: 10.1080/11035897.2015.1036360
Møller, I., Balling, N., and Ditlefsen, C. (2019). Shallow subsurface thermal structure onshore Denmark: temperature, thermal conductivity and heat flow. Bull. Geol. Soc. Denmark 67, 29–52. doi: 10.37570/bgsd-2019-67-03
Munier, R., and Fenton, C. (2004). “Review of postglacial faulting—Current understanding and directions for future studies,” in Respect Distances—Rationale and Means of Computation. Swedish Nuclear Fuel and Waste Management Co., Stockholm (Report R-04-17). 62 p.
Noack, V., Cherubini, Y., Scheck-Wenderoth, M., Lewerenz, B., Höding, T., Simon, A., et al. (2010). Assessment of the present-day thermal field (NE German Basin)—inferences from 3D modelling. Chemie Der Erde Geochem. 70, 47–62. doi: 10.1016/j.chemer.2010.05.008
Noack, V., Scheck-Wenderoth, M., Cacace, M., and Schneider, M. (2013). Influence of fluid flow on the regional thermal field: results from 3D numerical modelling for the area of Brandenburg (North German Basin). Environ. Earth Sci. 70, 3523–3544. doi: 10.1007/s12665-013-2438-4
Robertson, B., and Tellus, T. P. (2018). Robertson Basins and Plays (TellusTM) - Sedimentary Basins of the World Map — Datapages. Sedimentary Basins of the World - Shapefile. Available online at: http://www.datapages.com/gis-map-publishing-program/gis-open-files/global-framework/robertson-tellus-sedimentary-basins-of-the-world-map (accessed December 14, 2020).
Saito, T., Hamamoto, S., Ueki, T., Ohkubo, S., Moldrup, P., Kawamoto, K., et al. (2016). Temperature change affected groundwater quality in a confined marine aquifer during long-term heating and cooling. Water Res. 94, 120–127. doi: 10.1016/j.watres.2016.01.043
Scheck, M., and Bayer, U. (1999). Evolution of the Northeast German Basin - inferences from a 3D structural model and subsidence analysis. Tectonophysics 313, 145–169. doi: 10.1016/S0040-1951(99)00194-8
Scheck-Wenderoth, M., Cacace, M., Maystrenko, Y. P., Cherubini, Y., Noack, V., Kaiser, B. O., et al. (2014). Models of heat transport in the Central European Basin System: effective mechanisms at different scales. Marine Petroleum Geol. 55, 315–331. doi: 10.1016/j.marpetgeo.2014.03.009
Scheck-Wenderoth, M., and Maystrenko, Y. P. (2013). Deep control on shallow heat in sedimentary basins. Energy Proc. 40, 266–275. doi: 10.1016/j.egypro.2013.08.031
Sippel, J., Scheck-Wenderoth, M., Lewerenz, B., and Klitzke, P. (2015). Deep vs. shallow controlling factors of the crustal thermal field – insights from 3D modelling of the Beaufort-Mackenzie basin (Arctic Canada). Basin Res. 27, 102–123. doi: 10.1111/bre.12075
Sowers, L., York, K. P., and Stiles, L. (2006). Impact of thermal buildup on groundwater chemistry and aquifer microbes. Proc. Ecostock 1–7. Available online at: https://books.google.de/books/about/Thermal_Energy_Storage.html?id=ZEsvswEACAAJ&redir_esc=y
Spooner, C., Scheck-Wenderoth, M., Cacace, M., Götze, H.-J., and Luijendijk, E. (2020). The 3D thermal field across the Alpine orogen and its forelands and the relation to seismicity. Global Planetary Change 193, 103288. doi: 10.1016/j.gloplacha.2020.103288
Steffen, H., and Wu, P. (2011). Glacial isostatic adjustment in Fennoscandia—A review of data and modeling. J. Geodyn. 52, 169–204. doi: 10.1016/j.jog.2011.03.002
Steffen, R., Wu, P., Steffen, H., and Eaton, D. W. (2014). The effect of earth rheology and ice-sheet size on fault slip and magnitude of postglacial earthquakes. Earth Planetary Sci. Lett. 388, 71–80. doi: 10.1016/j.epsl.2013.11.058
Stephenson, R., Egholm, D. L., Nielsen, S. B., and Stovba, S. M. (2009). Role of thermal refraction in localizing intraplate deformation in southeastern Ukraine. Nat. Geosci. 2, 290–293. doi: 10.1038/ngeo479
Szewczyk, J. A. N., and Nawrocki, J. (2011). Deep-seated relict permafrost in northeastern Poland. Boreas 40, 385–388. doi: 10.1111/j.1502-3885.2011.00218.x
Tarasov, L., Dyke, A. S., Neal, R. M., and Peltier, W. R. (2012). A data-calibrated distribution of deglacial chronologies for the North American ice complex from glaciological modeling. Earth Planetary Sci. Lett. 315–316, 30–40. doi: 10.1016/j.epsl.2011.09.010
Tarasov, L., Hughes, A., Gyllencreutz, R., Lohne, O. S., Mangerud, J., and Svendsen, J. I. (2014). “The global GLAC-1c deglaciation chronology, melwater pulse 1-a, and a question of missing ice,” in IGS Symposium: Contribution of Glaciers and Ice Sheets to Sea-Level Change, Chamonix, France, 26–30.
Vestøl, O., Ågren, J., Steffen, H., Kierulf, H., and Tarasov, L. (2019). NKG2016LU: a new land uplift model for Fennoscandia and the Baltic Region. J. Geod. 93, 1759–1779. doi: 10.1007/s00190-019-01280-8
Vittecoq, B., Fortin, J., Maury, J., and Violette, S. (2020). Earthquakes and extreme rainfall induce long term permeability enhancement of volcanic island hydrogeological systems. Sci. Rep. 10, 20231. doi: 10.1038/s41598-020-76954-x
Wahlström, R. (1993). Fennoscandian seismicity and its relation to the isostatic rebound. Global Planetary Change 8, 107–112. doi: 10.1016/0921-8181(93)90018-J
Keywords: hydrogeologic 3D model, Central European Basin System (CEBS), basin modeling, last glacial maximum (LGM), boundary condition (BC), 3D thermohydraulic numerical model, nuclear waste repository, glacial isostatic adjustment (GIA)
Citation: Frick M, Cacace M, Klemann V, Tarasov L and Scheck-Wenderoth M (2022) Hydrogeologic and Thermal Effects of Glaciations on the Intracontinental Basins in Central and Northern Europe. Front. Water 4:818469. doi: 10.3389/frwa.2022.818469
Received: 19 November 2021; Accepted: 13 April 2022;
Published: 03 May 2022.
Edited by:
Roman Seidl, Leibniz University Hannover, GermanyCopyright © 2022 Frick, Cacace, Klemann, Tarasov and Scheck-Wenderoth. This is an open-access article distributed under the terms of the Creative Commons Attribution License (CC BY). The use, distribution or reproduction in other forums is permitted, provided the original author(s) and the copyright owner(s) are credited and that the original publication in this journal is cited, in accordance with accepted academic practice. No use, distribution or reproduction is permitted which does not comply with these terms.
*Correspondence: Maximilian Frick, bWZyaWNrQGdmei1wb3RzZGFtLmRl