 Ritesh Kumar
 Sarnam Singh
 Rakesh Kumar
 Prabhakar Sharma
- School of Ecology and Environment Studies, Nalanda University, Rajgir, India
Groundwater quality due to geogenic factors, aggravated by anthropogenic activities, is a significant threat to human wellbeing and agricultural practices. This study aimed at mapping the spatial distribution of low and high groundwater-contaminated regions in the Sheikhpura district of Bihar for safe drinking and irrigation water availability. To account for spatial distribution, groundwater quality parameters, such as fluoride, iron, total dissolved solids, turbidity, and pH, were analyzed using integrated interpolation, geographical information systems, and regression analysis. A total of 206 dug wells and bore wells were analyzed for in-situ observations in the Sheikhpura district of Bihar, India. The analysis indicated that the periphery south of Chewara and Ariari blocks, i.e., about 9.16% of district area, is affected by fluoride content (1.55–2.32 mg/l) which is highly unsuitable for consumption, as recommended by the WHO and BIS standards. However, the remaining area (90.84%) is within the permissible limit of fluoride content (0.37–1.54 mg/l). In most areas, iron content is beyond WHO permissible limits (>0.1 mg/l), except 3.1% area in the eastern region with 0.06–0.12 mg/l iron, although iron concentrations in groundwater are under the acceptable limit (<0.3 mg/l) as per BIS standard across the district. However, pH and total dissolved solids were within permissible limits. Each of the modeled geospatial maps was validated using a set of 17 in-situ observations. The best-fit model between observed and predicted variables such as fluoride, iron, total dissolved solids, and pH produced a coefficient of determination (R2) of 0.96, 0.905, 0.91, and 0.906, respectively. The findings of this study provide insights and understanding on groundwater pollution regimes and minimize uncertain causes because of the high spatial distribution of geogenic fluoride and iron occurrence, and will also be helpful to policymakers for better planning, investments, and management to supply potable water in the area.
Introduction
Water, whether on the surface or underground, is the most essential and significant natural resource for sustaining life on Earth and for the sustainable growth of socioeconomic sectors such as irrigation and industrialization. Water, in each form, is an essential component of hydro-geo-ecological and various other metabolic, physiological, and ecological processes of living beings. The “resourcism” and unethical human activities in the Earth's biosphere–hydrosphere–geosphere have created a global water imbalance and crisis which threatens the life of the billion individuals and numerous natural ecosystems (Mekonnen and Hoekstra, 2016; Falkenmark et al., 2019). At the global scale, in developed nations, per head water consumption is reported to be 382 l in the USA and 110 l in France (Grafton et al., 2009), whereas, in developing countries like India, it is 150–200 l for drinking and domestic purposes (CGWA, 2016). Even though nearly four billion people are facing severe water scarcity across the world (Rijsberman, 2006; Mekonnen and Hoekstra, 2016; Adams et al., 2020; Tzanakakis et al., 2020), potable water scarcity is projected to affect nearly 10 billion people by 2050 (Chouchane et al., 2018; Boretti and Rosa, 2019). Further, at the regional level, water quality deterioration, abstraction, drought, floods, erratic rainfall, etc., affect a large population due to which water scarcity has become a global issue (Kumar et al., 2010; Jain, 2012; Jain et al., 2013; Boers et al., 2017; Ellison et al., 2017).
Groundwater aquifers are the primary source of water supply in rural and urban areas, mainly in the arid and semiarid regions worldwide (Dash et al., 2010; Uyan and Cay, 2013; Rao et al., 2020). Groundwater scarcity in dry seasons draws global attention and perceived risk due to anthropogenic activities, like overexploitation of groundwater for irrigation, industrial, and drinking purposes (Mekonnen et al., 2015; Adimalla et al., 2020b). Therefore, the abuse of groundwater spawns hazardous impacts, mainly water quality, and quantity, in general (Ray and Elango, 2019). Furthermore, groundwater resources are contaminated via anthropogenic activities and geogenic contaminants bearing rocks and soils (Saha et al., 2018). Consequently, the groundwater crisis is driven by land-use changes, cropping patterns, high water demand, high-yielding crop races, and water availability (Ellison et al., 2017). Inadequate management has further disturbed the global water cycle, likely accelerating groundwater pollution and climate change (Abbott et al., 2019).
Groundwater systems have their unique chemistry and characteristics at each location and depend on various climatic changes, precipitation, surface water, and recharge parameters. Water quality depends mainly on underlying rock's geochemical and lithological composition and subsurface factors (Magesh and Chandrasekar, 2013). Time-sensitive undulation in the source and the configuration of revived water and the hydrological and social variables may generate irregular changes in the parameters dealing with water quality (Sahoo et al., 2019; Ijumulana et al., 2021, 2022). Heavy metals, such as fluoride, arsenic, cadmium, iron, and mercury, and other toxic chemicals either geogenic or discharged from residential areas, industries, and agricultural land contaminate surface and subsurface systems and have been reported to have more than the permissible concentration in drinking water (WHO, 2004; Bhagure and Mirgane, 2011; Sahoo et al., 2019; Adimalla et al., 2020a; Ijumulana et al., 2021, 2022). Groundwater quality has been measured using physicochemical properties, such as the concentration of arsenic, fluoride, pH, bicarbonates, chlorine, and total dissolved solids (Kannel et al., 2007; Ijumulana et al., 2020, 2021; Ligate et al., 2021). In India, including the present study area, arsenic, fluoride, iron, manganese, chromium, radon, uranium, etc., are geogenic contaminants from mineral deposits in the aquifer and have a significant health concern (Banerjee et al., 2012; Thakur and Gupta, 2015; Saha and Sahu, 2016; Krishan et al., 2021; Sahoo et al., 2022). Bihar has severe problems of arsenic, fluoride, iron, nitrate, etc., contamination in groundwater. The majority of the Indo-Gangetic plain is formed by quaternary alluvium deposition (old and new). In the Southern Gangetic Plains of Bihar, groundwater from quaternary aquifers is the principal source for water supply in rural and urban areas through bore wells, dug wells, etc. (Saha et al., 2007). The origin of contaminants is attributed to late quaternary stratigraphy and sedimentation in Middle Ganga Plains (Shah, 2008). Fluoride contamination from underlying parent rocks and soil affects the water quality in the upper layer of alluvium and is a well-known menace (Saha and Sahu, 2016). In the larger scenario, unsustainable and unplanned groundwater exploitation is constructing a negative influence on aquifer systems. It is complex (Saha et al., 2019) and unfit for human consumption and irrigation purposes (Earle, 2019).
India's dependency on groundwater for crop irrigation and drinking water is very high (Shankar et al., 2011). The primary consumers of groundwater are utilizing about 70–90% of annual extrication for irrigation in global agriculture (Llamas and Martínez-Santos, 2005; Kulkarni et al., 2015). It is assessed that the contribution of groundwater for irrigation is 62%, and the requirement of rural and urban water consumption is 85 and 50%, respectively, in India (Saha and Ray, 2018; Saha et al., 2019). However, the dependency on groundwater utilization in rural Bihar is about 80%. In 2001, the per capita availability of groundwater was 1950 and 1816 cubic m for Bihar and India, respectively, and reported to decrease because of increased population, industrialization, irrigation, etc. Due to the ever-increasing population in India, the annual per capita water availability is projected to shift down from 5,177 cubic m in 1951 to 1,140 cubic m in 2051 (MoWR, 2015). The total water gap across the Sheikhpura district was estimated to be 148.2 million cubic meters (MCM). For water budget, in 2020, it was estimated that groundwater and surface waters were 180.7 and 49.0 MCM, respectively (TRUAGRICO, 2017). Water quantity and quality are inextricably related to water resource management and must be controlled using integrated ways to prevent water pollution.
Fluoride (F) contamination is a severe problem in groundwater across India and the world (Changmai et al., 2018). It has a direct impact on the health of human beings, animals, and plants due to exceeded limits, and it varies in the air (0.1–0.6 μg/l), plant (0.01–42 mg/kg), soils (150–400 mg/kg), rocks (100–2,000 mg/kg), and water (1.0–38.5 mg/l) (Singh et al., 2018). Fluoride concentration is acceptable with < 1.5 mg/l for drinking and irrigation purposes (WHO, 1997). Millions of people are affected by diseases such as skeletal and dental fluorosis in many parts of India, caused by high fluoride contamination. Both lower concentrations of fluoride (0.6 mg/l) and upper concentrations of fluoride (1.2 mg/l) are harmful to health for prolonged consumption (Singh et al., 2016). The fluoride concentration of 1.5–3.0 mg/l can cause dental fluorosis, and the concentration of 3.0–4.0 mg/l causes to stiffens brittle bones, and more than 4.0 mg/l of fluoride concentration can cause crippling fluorosis (Saxena and Sewak, 2015). Besides, fluoride can also affect bruising of the liver, thyroid, and other organs, including deformation in bone and teeth spotting/flaking (Jiménez-Reyes and Solache-Ríos, 2010). Total dissolved solids (TDS) are a useful parameter for deciding safe drinking water quality with a lower range of 500 mg/l to a higher permissible limit of 2,000 mg/l (Jain et al., 2010); however, the World Health Organization (WHO) permits TDS for an extreme concentration of 1,700 mg/l (WHO, 2008). The permissible limit of TDS with <300 mg/l is excellent, 300–600 mg/l good, 600–900 mg/l poor, and > 1,700 mg/l unacceptable (WHO, 2008). However, the TDS concentration varies significantly due to diverse geological locations (WHO, 2004; Magesh and Chandrasekar, 2013). The prevalence of high iron (Fe) in drinking water causes severe impacts on human health, such as diabetes, heart diseases, cirrhosis of the liver, liver cancer, and infertility (Kumar et al., 2017). The permissible limit of iron content in drinking water is <0.1 mg/l (Borah et al., 2010; WHO, 2011). pH, a crucial constraint in drinking water, varies greatly, and the permissible range is 6.5–9.5 (Saxena and Ahmed, 2001; WHO, 2011).
In Bihar, among 38 districts, 13 districts are located beside the Gangetic river are partly impaired by pollution due to the high concentration of arsenic (As >0.05 mg/l), affecting 1,590 habitations (Singh et al., 2014), whereas 11 districts are profoundly affected by fluoride pollution (F > 1.5 mg/l), having a detrimental impact over 4,157 habitations. The iron concentration (Fe > 1 mg/l) was found in 9 districts over 18,673 residences. Previous studies reported fluoride concentrations with respective concentrations of 0.00–1.34 mg/l in Bhagalpur (Verma et al., 2017), 0.10–2.50 mg/l in Rohtas (Ray et al., 2000), and 0.19–14.4 mg/l in Gaya (Yasmin et al., 2011; Ranjan and Yasmin, 2012). The fluoride concentration in groundwater in the Sheikhpura district of Bihar is more than 1.5 mg/l, affecting 193 habitations (PHED, 2009), and iron is < 1 mg/l; however, the WHO recommended 0.1 mg/l Fe as the permissible limit for drinking purposes.
Geostatistics has been globally applied as a decision-making tool for groundwater level (Knotters and Bierkens, 2001), contamination analysis (Gaus et al., 2003), groundwater quality analysis (Yeh et al., 2006; Lee and Song, 2007; Sakram et al., 2019), and storage and reservoir capacity (Rakhmatullaev et al., 2011). In the groundwater pollution modeling, the geostatistical interpolation techniques applied are kriging, inverse distance weighting (IDW), principal component analysis (PCA), etc. (Chatterjee et al., 2010; Machiwal et al., 2011; Belkhiri and Narany, 2015; Bodrud-Doza et al., 2016; Verma et al., 2017; Kawo and Karuppannan, 2018). Investigating different groundwater quality parameters at every location would be time-consuming and economically inviable. The geospatial interpolation techniques are used significantly in unsampled areas. In this context, two different approaches, deterministic and geospatial methods, are adopted for groundwater pollution studies (Sarangi et al., 2005; Dash et al., 2010), and geospatial interpolation techniques are reported and extensively applied in hydrology, hydrogeology, geography, geology, soil science, atmospheric science, etc. (Diodato and Ceccarelli, 2005; Sarangi et al., 2006; Tweed et al., 2007; Dash et al., 2010; Pandian and Jeyachandran, 2014; Bodrud-Doza et al., 2016; Kawo and Karuppannan, 2018; Aher and Deshmukh, 2019).
This study aims for adequate information on spatial distribution of groundwater quality for long-term assessment and implementation of groundwater management strategies for irrigation and potable water supply. Therefore, this study proposed spatial mapping and distribution of groundwater quality parameters, such as fluoride, iron, pH, and TDS, using integrated interpolation techniques, geographical information systems, and regression analysis into low and high groundwater contaminated regions in the Sheikhpura district of Bihar for safe drinking and irrigation water supply. Geospatial pattern analysis of different quality parameters is essential for management and monitoring agencies such as Central and State Pollution Control Boards, farmers, agricultural research institutes, the Government of Bihar, and India to implement schemes and policy in different regions.
Materials and Methods
Study Area
The study area was Sheikhpura, a district in South Bihar, India, which lies between 24°45′ and 25°45′ North and 85°45′ and 86°45′ East longitude. The district has six blocks and 360 villages, extending over 609.51 km2 in size (Figure 1). Groundwater-bearing geological formations in the area have unconsolidated sediments of alluvium plain having hard rock with fissured quartzite formation, as shown in Supplementary Figure 1 (Rajmohan and Prathapar, 2013; IEED, 2019). IEED (2019) reported that the geology of the Sheikhpura district is composed of quartzites, phyllite, and schist rocks. Further, several studies documented that the geological formations of quartzites, phyllite, and schist rocks are primary sources of fluoride and iron in groundwater (Rao and Devadas, 2003; Suthar et al., 2008; Okofo et al., 2021). The area is enriched with old alluvial soil. Most of the area is covered by sand, silt, and clay, with aquifer thickness in the range of 20–190 m because of uneven bed-rock topography across the district (CGWB, 2013; TRUAGRICO, 2017). The hydrogeology features comprise unconsolidated formation, i.e., quaternary alluvium and consolidated formation due to hard rocks (Supplementary Figure 1) (CGWB, 2013). The major part is covered with old alluvium, which receives sediments from the Phalgu-Kiul sub-basin of River Ganga. Soils are coarse loamy with dominant subgroups of typic ustifluvents, fine aeric ochraqualfs, fine vertical ochraqualfs, and fine vertical ustochrepts. The major part in the south has fine vertic ochraqualfs and fine vertic ustochrepts in the middle region. In the northern side, soils are coarse loamy typic ustifluvents. The fine aeric ochraqualfs randomly occupy in the west, southeast, and northeast. The maps of soil types and dominant soil subgroups are shown in Figures 2A,B, respectively, and are used for water management strategy. The majority of the area is covered with greenish clay with caliche oxidized and pedocal soil, followed by silt and clay of variegated colors in the northeastern region and sand, silt, and clay unoxidized in the southeastern side. The greenish clay in the northern part occupies a significant area. The minimum area has silt and clay of variegated colors.
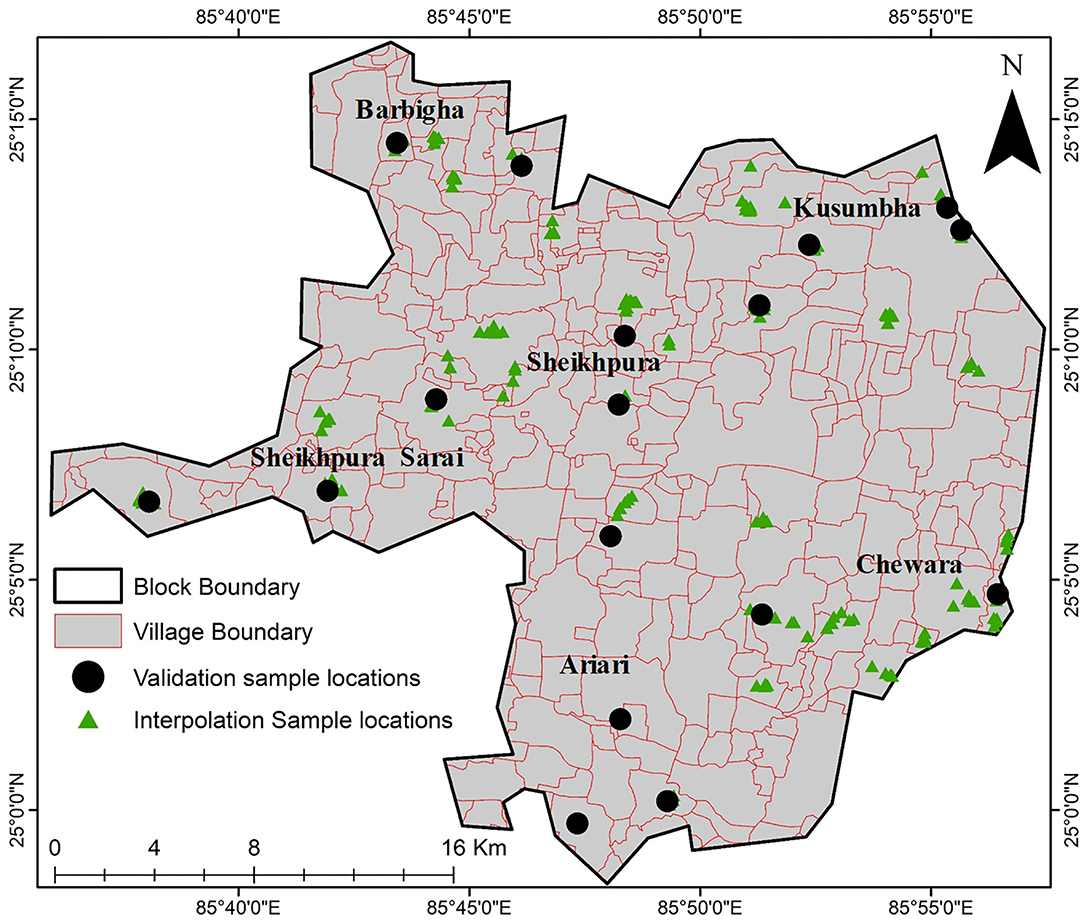
Figure 1. Village map of Sheikhpura district indicates groundwater sample locations (N = 206) (source: http://www.sheikhpura.bih.nic.in/).
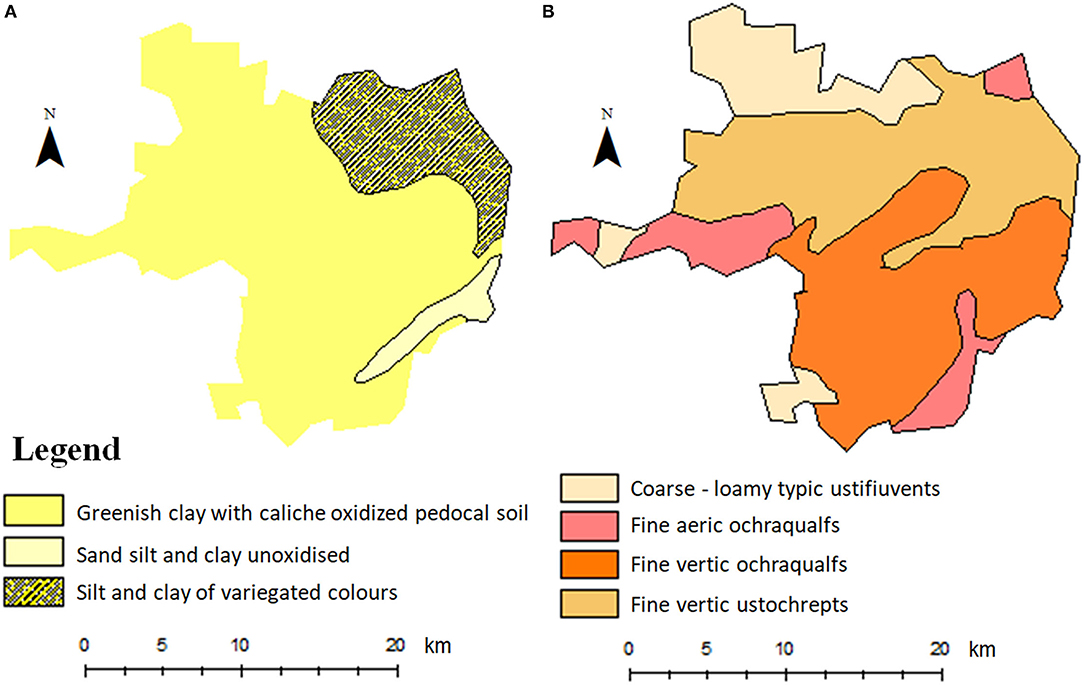
Figure 2. Soil maps (A) soil type, (B) dominant soil subgroups (source: NATMO, Kolkata, India).
Research Methods and Data Collection
With a sampling intensity of 10%, 36 villages encompassing all the blocks were randomly selected based on strata of location, population, block, and village size (big, medium, and small). Out of 2,000 bore wells in the area, 206 bore wells were sampled and analyzed. The data on F, Fe, TDS, turbidity, and pH collected by the Ministry of Drinking Water and Sanitation, Government of India, in 2017 under the National Rural Drinking Water Programme were used in this study. The geotagging of these wells was done using the Garmin eTrex Legend navigation system. We prepared a geospatial database of soil types and subgroups (ICAR, 1998) in the geospatial information system (GIS) domain and land use/land cover using satellite data. Geo-coordinates of 206 well locations were imported in the GIS domain, and attributes on F, Fe, TDS, and pH were assigned to prepare geospatial maps using Arc GIS 10.9 software (Figure 1).
Geospatial Modeling
The geospatial approaches such as Kriging and IDW interpolate the spatial variability of point attributes and predict for an unobserved location using nearby known attributes (Rakhmatullaev et al., 2011; Sahoo et al., 2019; Ijumulana et al., 2020, 2021, 2022; Ligate et al., 2021). The Kriging interpolation technique is the optimal and widely applicable procedure for estimating unknown values (attributes) using normally distributed known data (Jager, 1990; Dong et al., 2011; Wu et al., 2011; Ijumulana et al., 2022). A linear interpolation method predicts the value of unobserved location attributes based on probabilistic models (Shyu et al., 2011; Ijumulana et al., 2021, 2022) with minimum error (Mendes and Ribeiro, 2010). In the present study, kriging was applied and validated the reliability of different groundwater quality parameters by incorporating geospatial statistical techniques. The water quality parameters, such as F, Fe, TDS, and pH, were characterized as good, moderate, and poor based on the ranges and permissible limits for groundwater quality characterization (Table 1). Under the National Rural Drinking Water Programme, Ministry of Drinking Water and Sanitation, Government of India, in 2017, turbidity was reported almost negligible (<2 NTU) across the Sheikhpura district of Bihar. Therefore, the turbidity data were not considered for integrated interpolation, GIS, and regression analysis. Therefore, except turbidity, each parameter was assigned weights considering their negative impacts. The highest weight of four was assigned to fluoride, then iron (3), TDS (2), and the lowest (1) to pH. Fluoride is more than its permissible limit (> 1.5 mg/l); therefore, it was assigned high weight, and pH was set with the least weight due to its concentration being under the allowable limit (6.5–9.5). A simple overlay analysis considering the ranges and these weights were performed for suitability analysis. The groundwater suitability for irrigation and drinking water supply was characterized, assigned from very good (rank rating = 3), i.e., under the permissible limit, to very poor (rank rating = 1) for more than the allowable limit to each quality parameter (Islam et al., 2018). With criteria for drinking and irrigation purposes, the water quality has been characterized based on each contaminant presented in Table 1. The validation and adequacy of the model were tested by determining the coefficient of determination (R2) based on 17 randomly selected point data to establish the relationship between the actual and predicted ranges of pollution parameters.
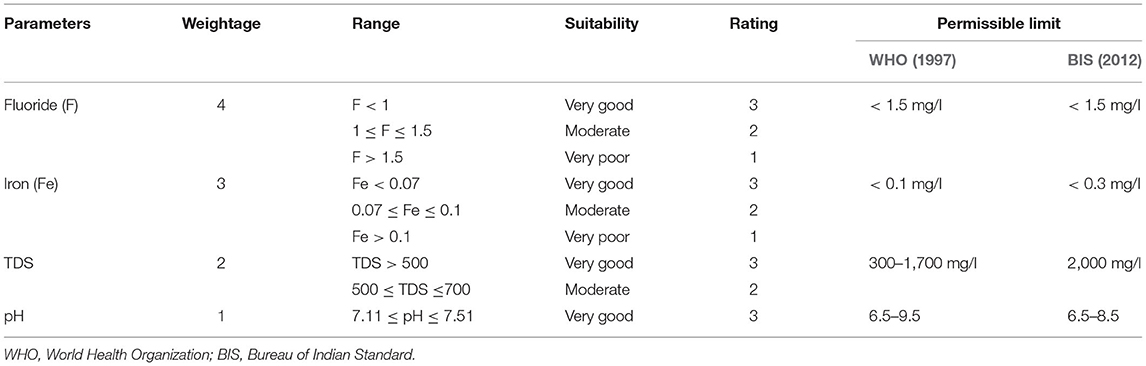
Table 1. Parameterization of groundwater quality assessment.
Results and Discussion
Geospatial Mapping of Groundwater Pollutants
In this study, groundwater quality parameter limits followed the standards outlined by WHO (1997) and BIS (2012) for drinking and irrigation purposes. Fluoride and iron concentrations exceed the permissible limit, whereas TDS and pH values are under permissible limits. Fluoride level was observed within the permissible limit except in the southeastern region (Figure 3A). The northern part is occupied by “Tal” (a low-lying area having soil of silt and clay of variegated colors), contaminated with fluoride ranging between 0.37 and 0.76 mg/l. The southeastern part has slightly higher concentrations of fluoride that range from 1.024 to 1.45 mg/l, which are also within the acceptable limit. The fluoride concentration is acceptable with < 1.5 mg/l for drinking and irrigation purposes, according to the WHO and BIS (Bureau of Indian Standards) standards (WHO, 1997; BIS, 2012). Geospatial analyses indicated that the fluoride contamination with permissible limit is higher in most of the area; the moderately affected (1.16–1.54 mg/l) area in the Ariari block covers 6.54% of the total area. The majority of the area is within the fluoride concentration of 1.5 mg/l, which possesses coarse-loamy soils in the northeastern region and fine-loamy soil in the southern region of the Sheikhpura district. Besides this, the lowest range of fluoride from 0.37 to 0.76 mg/l was associated with greenish clay, characterized by caliche oxidized with pedocal soils, and covered almost 76.10% area of the entire district. 91.15% area comes under Sheikhpura, Ghat Kusumbha, Barbigha, and Sheikhpura Sarai, and major portions of Ariari blocks have groundwater with fluoride concentrations in the range of 0.37–1.54 mg/l, i.e., under the WHO-permissible limit of fluoride concentrations, and are suitable for drinking purposes. The maximum fluoride concentration was 1.54–2.32 mg/l in the southeastern region, where groundwater is unsuitable for domestic and drinking purposes. The analysis indicated that the southern peripheral area of Chewara is profoundly affected with fluoride concentrations of 1.55–2.32 mg/l, which covers 5.07% of the total district area. Pedocal soils have high concentrations of fluoride (1.94 mg/l < F <2.32 mg/l) in groundwater (Figure 3A) and are unsuitable for drinking purposes. This is the highest level of fluoride spread in ~24.71 km2 (4.09%) of the total area.
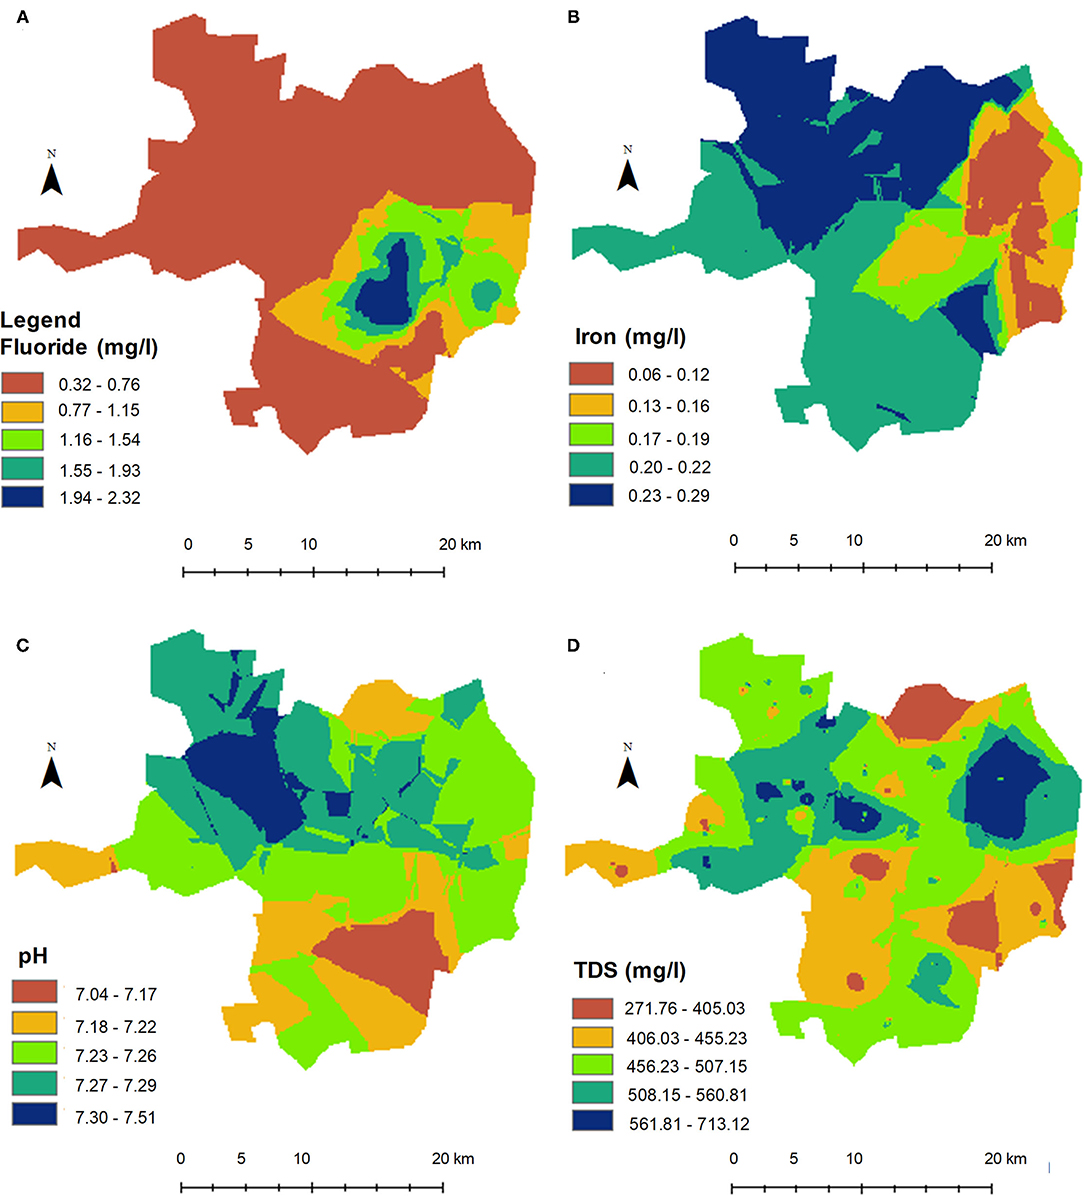
Figure 3. Geospatial maps of groundwater quality: (A) fluoride, (B) iron, (C) pH, and (D) TDS based on kriging interpolation of field observations.
Iron is a vital element and occurs naturally in water. The geogenic source of iron in groundwater is due to the underlying quartzite rocks of Sheikhpura. A similar geogenic source of iron in groundwater is reported in the literature (Rao, 2008; Amanambu, 2015). In general, the desirable limit of iron is <0.1 mg/l (WHO, 2011) and <0.3 mg/l (BIS, 2012), according to the WHO and BIS standards for drinking purposes. The high concentration of iron in groundwater has a direct impact on health. The categorization of groundwater quality parameters for drinking and irrigation purposes based upon iron is presented in Table 1. In this regard, the spatial distribution of iron concentration is shown in Figure 3B, indicating that 96.9% of the total area has a concentration of more than 0.1 mg/l. The analysis also revealed that the northern region has 0.23–0.29 mg/l of iron concentration, covering Barbigha, Sheikhpura, and Ghat Kusumbha blocks and a small portion in the Chewara block. Moreover, the west and south regions of the district exhibit a high iron level of 0.20–0.22 mg/l in Sheikhpura Sarai, Ariari, and Chewara blocks. Iron concentrations ranged from 0.13 to 0.18 mg/l in most northeastern blocks, like Sheikhpura, Chewara, and Ghat Kusumbha (Figure 3B). The permissible limit (0.00–0.12 mg/l) for drinking purposes was found in pockets of Sheikhpura and Chewara blocks in the northeastern region. Based on the BIS standard, iron concentrations are under the required acceptable limit (<0.3 mg/l).
The pH determines the acidity and alkalinity of groundwater as a significant water quality parameter. The permissible limit of pH ranged from 6.5 to 9.5 as per WHO recommendations (WHO, 2011) and 6.5 to 8.5 according to BIS standards (BIS, 2012) for drinking purposes. Figure 3C depicts the geospatial pattern of pH and is in the desirable limit. It varied from 7.04 to 7.51, under permissible limits recommended by the WHO and BIS standards in drinking water. In the northern area of the district, it ranged from 7.23 to 7.51.
TDS characterizes the total concentration of dissolved substances in groundwater, an important parameter to measure drinking water/groundwater quality. TDS indicate fully dissolved minerals, such as calcium, chlorides, carbonates, bicarbonates, magnesium, silica, and sodium, in groundwater (Anbazhagan and Nair, 2004). The permissible limit <300 mg/l is excellent, and the unacceptable limit is > 1,700 mg/l (WHO, 2008) and 2,000 mg/l according to BIS (2012) standards. In this regard, TDS varied between 271 and 713 mg/l. A slightly higher level of TDS (713 mg/l) was noted in small pockets of Sheikhpura and Ghat Kusumbha blocks (Figure 3D). Thus, it is not much of a concern for drinking and irrigation purposes (Table 1). Therefore, this study recommends the development of a practical groundwater management support tool for fluoride-free water for drinking and irrigation purposes. Besides, implementing an efficient and reliable technique should be adopted to achieve groundwater quality under WHO and BIS standard permissible limits.
Model Accuracy
Seventeen observational data points were used to validate the results of Kriging interpolation. The actual observations were evaluated concerning the predicted values. The goodness of fit for an actual concentration of contaminants indicated that the coefficient of determination (R2) between observed/actual and predicted for F, Fe, TDS, and pH were 0.96, 0.905, 0.91, and 0.906, respectively (Figures 4A–D), which shows heterogeneity in the quality parameters (Table 2).
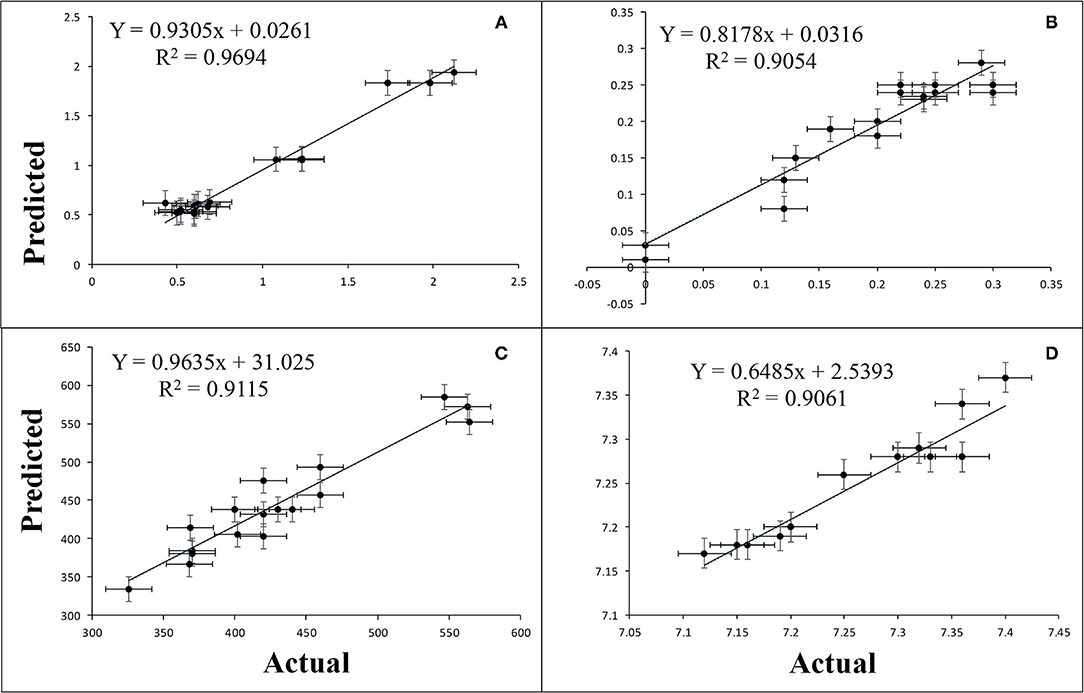
Figure 4. Model accuracy assessment between observed and predicted groundwater quality parameters: (A) fluoride, (B) iron, (C) pH, and (D) TDS.
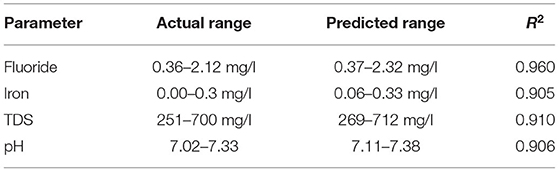
Table 2. Relationship between observed vis-à-vis predicted groundwater quality.
Geospatial Modeling for Suitability of Groundwater
Characterization for groundwater quality mapping based on class interval and weights to different layers of F, Fe, TDS, and pH per their significance is shown in a map (Figure 5). Prioritization of groundwater quality was done for planning and conservation of groundwater resources for drinking and irrigation purposes. Only 5.08% area is falling under the “very good” category. Many villages are in Sheikhpura block, whereas four villages, viz., Angpur, Bahuwara, Chakandara, and Chewara villages, are of the Chewara block, and two villages, Kusumbha and Rajauli villages, are of the Ghat Kusumbha block. Significant areas are covered under suitable groundwater conditions in each block, i.e., 55.84% of the total district area has groundwater fit for drinking purposes. Therein, the medium/moderate quality of groundwater is falling under all blocks, which covered 33.95% area of the district, except the Ariari block. The poor, unsuitable groundwater quality covered only 5.13% of the total area. The poor water quality only extended in Arari, Chewara, and Sheikhpura blocks. Nabinagar, Husenabad, Diha, Belchhi, Karki, and Pandhar villages are the most affected in the Arari block. In contrast, Sheikhpura and Eksari villages are affected in the Sheikhpura block, and Mane, Barari, and Chewara are the most affected from the Chewara block. Villages have been categorized under different water quality parameters with corresponding percent area, including the uninhabited village of Sheikhpura district polluted under quality parameters (Supplementary Table 1).
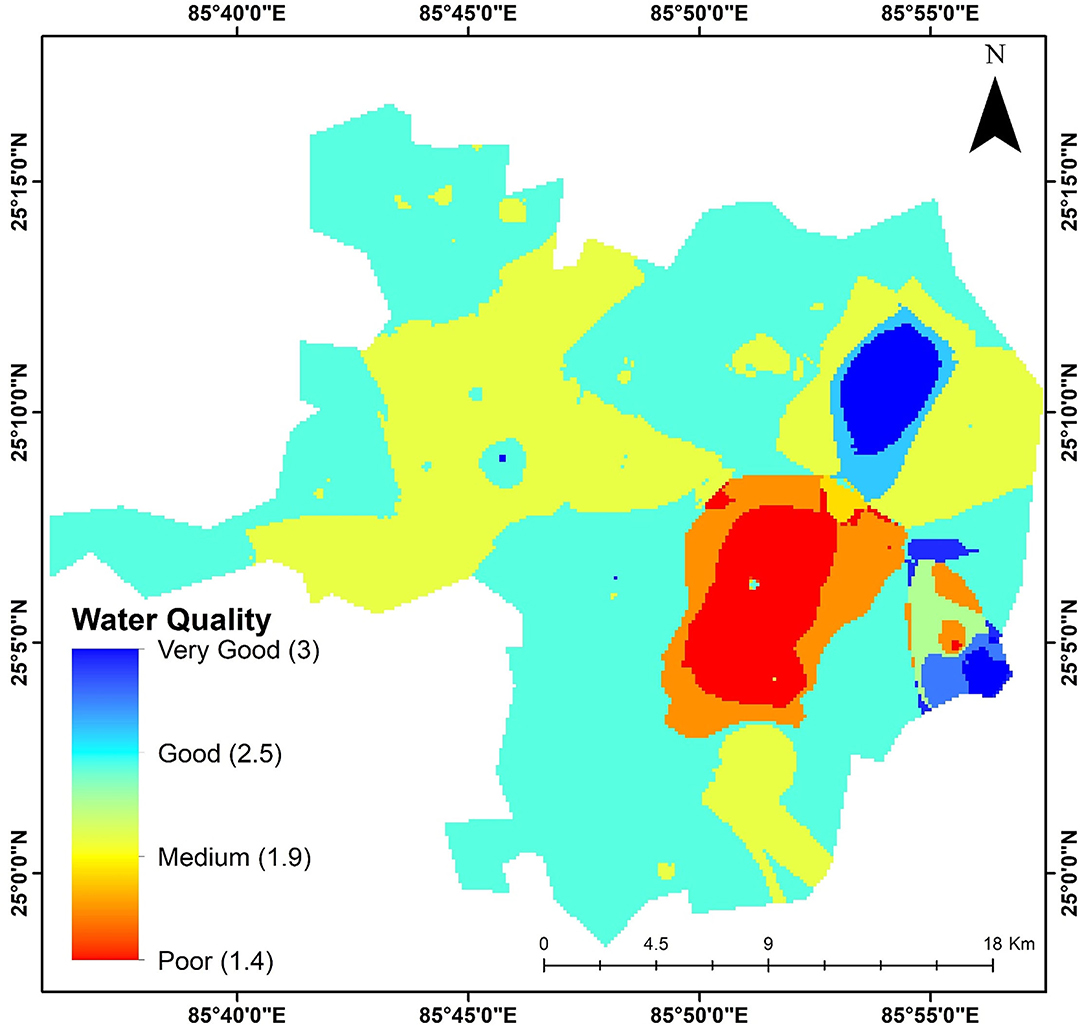
Figure 5. Potential groundwater quality map for planning and management of groundwater harvesting and supply.
Relationship Between Soil Types and Groundwater Quality Parameters
Groundwater is vulnerable to contamination under different soil types (Li et al., 2020). Geogenic fluoride contamination is globally observed in shallow aquifers (Edmunds and Smedley, 2013). In the Indo-Gangetic plains, potential fluoride contamination was observed in alluvial aquifers of northwest India, but < 1.5 mg/l of fluoride concentration in groundwater (Lapworth et al., 2017). Therefore, the principal source of contamination might be from underlying rocks and the flow rate in the aquifers (Saha et al., 2007; Saha and Sahu, 2016). Overall, it was observed that the groundwater quality parameters exceed the desirable limits for domestic, drinking, and agriculture purposes at several locations in the Sheikhpura district. In Sheikhpura, the high fluoride concentration in the range of 1.55–2.32 mg/l was found in the southeastern region. In addition, the iron concentration is found in the range of 0.13–0.30 mg/l, which is above the permissible limit recommended by the WHO. The geological characteristics which constituted quartzites, phyllite, and schist rocks are responsible for the enrichment of fluoride and iron in groundwater in the Sheikhpura area of Bihar. Both fluoride and iron are likely to indicate geogenic contamination of aquifers in the area (Saha et al., 2007; Saha and Sahu, 2016). The pH and TDS are well within the permissible limits, i.e., 7.04–7.51 and 271–713 mg/l, respectively, as per WHO recommendations. The causal relationship between soil types and groundwater contaminants across the district is tabulated (Table 3).
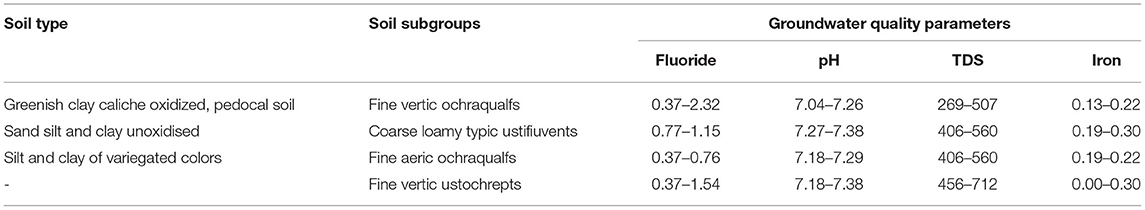
Table 3. Summarized relationship between soil types and groundwater quality.
Groundwater contaminant concentrations were randomly distributed among different soil types in the area. There is no noticeable, quantifiable, and significant relationship between soil types and groundwater contaminants. A similar study by Sheehan et al. (2003) highlighted no statistical correlation between groundwater chemistry and toxicity and soil. However, the lack of correlation between soil and groundwater contaminants must not ignore the potential risk assessment to quantify contaminated soils for determining underlying aquifers characteristics, land uses, and groundwater footprint.
Conclusions
Integrated interpolation techniques, geostatistical systems, and regression analysis have proved efficient decision-making tools for groundwater quality analysis, monitoring, and management. In this study, the spatial groundwater quality parameters, such as F, Fe, TDS, and pH, were analyzed across six blocks of the Sheikhpura district of Bihar. Groundwater in Sheikhpura, Arari, and Chewara blocks were contaminated with high fluoride concentrations up to 2.42 mg/l. In addition, iron has also spread with more than the WHO permissible limit (>0.1 mg/l) across all six blocks. Reasons behind the enrichment of fluoride and iron in the groundwater of the Sheikhpura district of Bihar are the underlying geological features composed of quartzites, phyllite, and schist rocks. Besides this, TDS and pH were found under the allowable limit across the district. The spatial analysis of different parameters is conducted based on the Kriging method by estimating unobserved locations relating to the known values. This study also attempted to establish the relationship between soil types and groundwater contaminants; however, no statistical correlation was found for each groundwater quality parameter considered for spatial mapping in the Sheikhpura district. The final groundwater quality map highlighted the area having groundwater quality from “poor” to “very good” across the district. In the interpolated map, the overall groundwater quality of the Arari, Chewara, and Sheikhpura blocks is not appropriate; thus, aquifer quality is relatively low and not acceptable for drinking and irrigation purposes. Thus, spatial mapping of groundwater quality will help policymakers to better operate and manage the groundwater resources through detecting pollutants, demand–supply gap, etc. Overall, proper utility and management of groundwater through canals, channels, and underground movement from safe to affected blocks/zones are recommended for drinking and agricultural purposes to avoid carcinogenic diseases among the population in the future.
Data Availability Statement
Publicly available datasets were analyzed in this study. This data can be found at: All the primary groundwater quality data were obtained from the website of Ministry of Drinking Water and Sanitation, Government of India, surveyed in 2017 under the National Rural Drinking Water Programme and has been duly acknowledged. Map of soil types and soil subgroups published by the National Bureau of Soil Survey and Land Use Planning (ICAR 1998), Nagpur, India. were used.
Author Contributions
RiK: conceptualization, sampling strategy, fieldwork, GIS database creation and analysis, and writing of the first draft of the manuscript. SS: conceptualization, sampling strategy, methodology, GIS analysis supervision, review of results, and editing of the manuscript. RaK: support in GIS analysis, writing, reviewing, and editing of the manuscript. PS: initial conceptualization, review, and editing of the manuscript. All authors contributed to the article and approved the submitted version.
Conflict of Interest
The authors declare that the research was conducted in the absence of any commercial or financial relationships that could be construed as a potential conflict of interest.
Publisher's Note
All claims expressed in this article are solely those of the authors and do not necessarily represent those of their affiliated organizations, or those of the publisher, the editors and the reviewers. Any product that may be evaluated in this article, or claim that may be made by its manufacturer, is not guaranteed or endorsed by the publisher.
Acknowledgments
The authors would like to record their gratitude to SEES lab, Nalanda University for scientific facilities and also like to express their gratitude to the National Rural Drinking Water Programme, Ministry of Drinking Water and Sanitation, Government of India for allowing access to the data on their website. We want to thank Dr. Dharmendra Singh, Assistant Scientist (Environment/Ecology) Haryana Space Applications Centre, Hissar for his timely help during the analysis.
Supplementary Material
The Supplementary Material for this article can be found online at: https://www.frontiersin.org/articles/10.3389/frwa.2022.848018/full#supplementary-material
References
Abbott, B. W., Bishop, K., Zarnetske, J. P., Minaudo, C., Chapin, F., Krause, S., et al. (2019). Human domination of the global water cycle absent from depictions and perceptions. Nat. Geosci. 12, 533–540. doi: 10.1038/s41561-019-0374-y
Adams, E. A., Stoler, J., and Adams, Y. (2020). Water insecurity and urban poverty in the Global South: Implications for health and human biology. Am. J. Hum. Biol. 32:e23368. doi: 10.1002/ajhb.23368
Adimalla, N., Chen, J., and Qian, H. (2020a). Spatial characteristics of heavy metal contamination and potential human health risk assessment of urban soils: A case study from an urban region of South India. Ecotoxicol. Environ. Saf. 194:110406. doi: 10.1016/j.ecoenv.2020.110406
Adimalla, N., Dhakate, R., Kasarla, A., and Taloor, A. K. (2020b). Appraisal of groundwater quality for drinking and irrigation purposes in Central Telangana, India. Groundwater Sustain. Dev. 10:100334. doi: 10.1016/j.gsd.2020.100334
Aher, S., and Deshmukh, K. (2019). Identifying the impact of intensive agriculture practices on groundwater quality using GIS and multi-tracer techniques around Sangamner city, Maharashtra, India. Geocarto Int. 2019, 1–25. doi: 10.1080/10106049.2019.1633422
Amanambu, A. C. (2015). Geogenic contamination: hydrogeochemical processes and relationships in Shallow Aquifers of Ibadan, South-West Nigeria. Bull. Geography. Phys. Geography Series 9, 5–20. doi: 10.1515/bgeo-2015-0011
Anbazhagan, S., and Nair, A. M. (2004). Geographic information system and groundwater quality mapping in Panvel Basin, Maharashtra, India. Environ. Geol. 45, 753–761. doi: 10.1007/s00254-003-0932-9
Banerjee, D., Mukherjee, A., Acharya, S., Chatterjee, D., Mahanta, C., Saha, D., et al. (2012). Contemporary groundwater pollution studies in India: a review. Proc. Ind. Natl. Sci. Acad. 78, 333–342.
Belkhiri, L., and Narany, T. S. (2015). Using multivariate statistical analysis, geostatistical techniques and structural equation modeling to identify spatial variability of groundwater quality. Water Res. Manage. 29, 2073–2089. doi: 10.1007/s11269-015-0929-7
Bhagure, G. R., and Mirgane, S. (2011). Heavy metal concentrations in groundwaters and soils of Thane Region of Maharashtra, India. Environ. Monit. Assess. 173, 643–652. doi: 10.1007/s10661-010-1412-9
BIS (2012). Indian Standard Drinking Water - Specification IS 10500: 2012. New Delhi: Bureau of Indian Standards.
Bodrud-Doza, M., Islam, A. T., Ahmed, F., Das, S., Saha, N., and Rahman, M. S. (2016). Characterization of groundwater quality using water evaluation indices, multivariate statistics and geostatistics in central Bangladesh. Water Sci. 30, 19–40. doi: 10.1016/j.wsj.2016.05.001
Boers, N., Marwan, N., Barbosa, H. M., and Kurths, J. (2017). A deforestation-induced tipping point for the South American monsoon system. Sci. Rep. 7:41489. doi: 10.1038/srep41489
Borah, K. K., Bhuyan, B., and Sarma, H. P. (2010). Lead, arsenic, fluoride, and iron contamination of drinking water in the tea garden belt of Darrang district, Assam, India. Environ. Monit. Assess. 169, 347–352. doi: 10.1007/s10661-009-1176-2
Boretti, A., and Rosa, L. (2019). Reassessing the projections of the world water development report. NPJ Clean Water 2, 1–6. doi: 10.1038/s41545-019-0039-9
CGWA (2016). Estimation of Water Requirement for Drinking and Domestic Use. National Building Code, 2016. Bureau of Indian Standards. India
CGWB (2013). Ground Water Information Booklet, Sheikhpura District, Bihar State, Central Ground Water Board, Ministry of Water Resources, Govt. of India, Mid-Eastern Region, Patna.
Changmai, M., Pasawan, M., and Purkait, M. (2018). A hybrid method for the removal of fluoride from drinking water: Parametric study and cost estimation. Sep. Purifi. Technol. 206, 140–148. doi: 10.1016/j.seppur.2018.05.061
Chatterjee, R., Tarafder, G., and Paul, S. (2010). Groundwater quality assessment of Dhanbad district, Jharkhand, India. Bull. Eng. Geol. Environ. 69, 137–141. doi: 10.1007/s10064-009-0234-x
Chouchane, H., Krol, M. S., and Hoekstra, A. Y. (2018). Expected increase in staple crop imports in water-scarce countries in 2050. Water Res. X 1:100001. doi: 10.1016/j.wroa.2018.09.001
Dash, J., Sarangi, A., and Singh, D. (2010). Spatial variability of groundwater depth and quality parameters in the national capital territory of Delhi. Environ. Manage. 45, 640–650. doi: 10.1007/s00267-010-9436-z
Diodato, N., and Ceccarelli, M. (2005). Interpolation processes using multivariate geostatistics for mapping of climatological precipitation mean in the Sannio Mountains (southern Italy). Earth Surface Proc. Landforms 30, 259–268. doi: 10.1002/esp.1126
Dong, J., Yu, M., Bian, Z., Wang, Y., and Di, C. (2011). Geostatistical analyses of heavy metal distribution in reclaimed mine land in Xuzhou, China. Environ. Earth Sci. 62, 127–137. doi: 10.1007/s12665-010-0507-5
Edmunds, W. M., and Smedley, P. L. (2013). “Fluoride in natural waters,” in Essentials of Medical Geology, eds B. Alloway, J. Centeno, R. Finkelman, R. Fuge, U. Lindh, P. Smedley (Springer). doi: 10.1007/978-94-007-4375-5_13
Ellison, D., Morris, C. E., Locatelli, B., Sheil, D., Cohen, J., Murdiyarso, D., et al. (2017). Trees, forests and water: Cool insights for a hot world. Glob. Environ. Change 43, 51–61. doi: 10.1016/j.gloenvcha.2017.01.002
Falkenmark, M., Wang-Erlandsson, L., and Rockström, J. (2019). Understanding of water resilience in the Anthropocene. J. Hydrol. X 2:100009. doi: 10.1016/j.hydroa.2018.100009
Gaus, I., Kinniburgh, D., Talbot, J., and Webster, R. (2003). Geostatistical analysis of arsenic concentration in groundwater in Bangladesh using disjunctive Kriging. Environ. Geol. 44, 939–948. doi: 10.1007/s00254-003-0837-7
Grafton, R. Q., Kompas, T., To, H., and Ward, M. B. (2009). Residential Water Consumption: A Cross Country Analysis. Research Reports 94823, Australian National University, Environmental Economics Research Hub 2009.
ICAR (1998). Bihar Soils Map. National Bureau of Soil Survey and Land Use Planning (ICAR), Nagpur, India.
IEED (2019). District Survey Report of Sheikhpura - Sand Mineral and Brick Kilns. Institute of Environment & EcoDevelopment. Mines & Geology Department, Government of Bihar. Patna.
Ijumulana, J., Ligate, F., Bhattacharya, P., Mtalo, F., and Zhang, C. (2020). Spatial analysis and GIS mapping of regional hotspots and potential health risk of fluoride concentrations in groundwater of northern Tanzania. Sci. Total Environ. 735:139584. doi: 10.1016/j.scitotenv.2020.139584
Ijumulana, J., Ligate, F., Irunde, R., Bhattacharya, P., Ahmad, A., Tomašek, I., et al. (2022). Spatial variability of the sources and distribution of fluoride in groundwater of the Sanya alluvial plain aquifers in northern Tanzania. Sci. Total Environ. 810:152153. doi: 10.1016/j.scitotenv.2021.152153
Ijumulana, J., Ligate, F., Irunde, R., Bhattacharya, P., Maity, J. P., Ahmad, A., et al. (2021). Spatial uncertainties in fluoride levels and health risks in endemic fluorotic regions of northern Tanzania. Groundwater Sustain. Dev. 2021:100618. doi: 10.1016/j.gsd.2021.100618
Islam, M. A., Rahman, M. M., Bodrud-Doza, M., Muhib, M. I., Shammi, M., Zahid, A., et al. (2018). A study of groundwater irrigation water quality in south-central Bangladesh: a geo-statistical model approach using GIS and multivariate statistics. Acta Geochim. 37, 193–214. doi: 10.1007/s11631-017-0201-3
Jain, C., Bandyopadhyay, A., and Bhadra, A. (2010). Assessment of ground water quality for drinking purpose, District Nainital, Uttarakhand, India. Environ. Monit. Assess. 166, 663–676. doi: 10.1007/s10661-009-1031-5
Jain, S., Kumar, V., and Saharia, M. (2013). Analysis of rainfall and temperature trends in northeast India. Int. J. Climatol. 33, 968–978. doi: 10.1002/joc.3483
Jain, S. K. (2012). Sustainable water management in India considering likely climate and other changes. Curr. Sci. 2012, 177–188.
Jiménez-Reyes, M., and Solache-Ríos, M. (2010). Sorption behavior of fluoride ions from aqueous solutions by hydroxyapatite. J. Hazard. Mater. 180, 297–302. doi: 10.1016/j.jhazmat.2010.04.030
Kannel, P. R., Lee, S., Kanel, S. R., Khan, S. P., and Lee, Y.-S. (2007). Spatial–temporal variation and comparative assessment of water qualities of urban river system: a case study of the river Bagmati (Nepal). Environ. Monit. Assess. 129, 433–459. doi: 10.1007/s10661-006-9375-6
Kawo, N. S., and Karuppannan, S. (2018). Groundwater quality assessment using water quality index and GIS technique in Modjo River Basin, central Ethiopia. J. Afr. Earth Sci. 147, 300–311. doi: 10.1016/j.jafrearsci.2018.06.034
Knotters, M., and Bierkens, M. F. (2001). Predicting water table depths in space and time using a regionalised time series model. Geoderma 103, 51–77. doi: 10.1016/S0016-7061(01)00069-6
Krishan, G., Taloor, A. K., Sudarsan, N., Bhattacharya, P., Kumar, S., Ghosh, N. C., et al. (2021). Occurrences of potentially toxic trace metals in groundwater of the state of Punjab in northern India. Groundwater Sustain. Dev. 15:100655. doi: 10.1016/j.gsd.2021.100655
Kulkarni, H., Shah, M., and Shankar, P. V. (2015). Shaping the contours of groundwater governance in India. J. Hydrol. Reg. Stud. 4, 172–192. doi: 10.1016/j.ejrh.2014.11.004
Kumar, V., Bharti, P. K., Talwar, M., Tyagi, A. K., and Kumar, P. (2017). Studies on high iron content in water resources of Moradabad district (UP), India. Water Sci. 31, 44–51. doi: 10.1016/j.wsj.2017.02.003
Kumar, V., Jain, S. K., and Singh, Y. (2010). Analysis of long-term rainfall trends in India. Hydrol. Sci. J. 55, 484–496. doi: 10.1080/02626667.2010.481373
Lapworth, D., Krishan, G., MacDonald, A., and Rao, M. (2017). Groundwater quality in the alluvial aquifer system of northwest India: New evidence of the extent of anthropogenic and geogenic contamination. Sci. Total Environ. 599, 1433–1444. doi: 10.1016/j.scitotenv.2017.04.223
Lee, J.-Y., and Song, S.-H. (2007). Evaluation of groundwater quality in coastal areas: implications for sustainable agriculture. Environ. Geol. 52, 1231–1242. doi: 10.1007/s00254-006-0560-2
Li, R., Ruan, X., Ma, T., Bai, Y., and Liu, C. (2020). In-situ nitrogen fate in the vadose zone of different soil types and its implications for groundwater quality in the Huaihe River Basin, China. Acta Geochim. 39, 281–290. doi: 10.1007/s11631-020-00412-8
Ligate, F., Ijumulana, J., Ahmad, A., Kimambo, V., Irunde, R., Mtamba, J. O., et al. (2021). Groundwater resources in the East African Rift Valley: Understanding the geogenic contamination and water quality challenges in Tanzania. Sci. Afr. 13:e00831. doi: 10.1016/j.sciaf.2021.e00831
Llamas, M. R., and Martínez-Santos, P. (2005). Intensive groundwater use: silent revolution and potential source of social conflicts. J. Water Res. Plan. Manage. 131:337. doi: 10.1061/(ASCE)0733-9496(2005)131:5(337)
Machiwal, D., Jha, M. K., and Mal, B. C. (2011). GIS-based assessment and characterization of groundwater quality in a hard-rock hilly terrain of Western India. Environ. Monit. Assess. 174, 645–663. doi: 10.1007/s10661-010-1485-5
Magesh, N., and Chandrasekar, N. (2013). Evaluation of spatial variations in groundwater quality by WQI and GIS technique: a case study of Virudunagar District, Tamil Nadu, India. Arab. J. Geosci. 6, 1883–1898. doi: 10.1007/s12517-011-0496-z
Mekonnen, M. M., and Hoekstra, A. Y. (2016). Four billion people facing severe water scarcity. Sci. Adv. 2:e1500323. doi: 10.1126/sciadv.1500323
Mekonnen, M. M., Pahlow, M., Aldaya, M. M., Zarate, E., and Hoekstra, A. Y. (2015). Sustainability, efficiency and equitability of water consumption and pollution in Latin America and the Caribbean. Sustainability 7, 2086–2112. doi: 10.3390/su7022086
Mendes, M. P., and Ribeiro, L. (2010). Nitrate probability mapping in the northern aquifer alluvial system of the river Tagus (Portugal) using Disjunctive Kriging. Sci. Total Environ. 408, 1021–1034. doi: 10.1016/j.scitotenv.2009.10.069
MoWR (2015). A Year of Inclusive Development in Water Resources Sector. National Water Mission, Government of India. Available online at: http://www.nationalwatermission.gov.in/sites/default/files/COP%2021%20MoWR%20Booklet.pdf (accessed June 2021).
Okofo, L. B., Anderson, N. A., Bedu-Addo, K., and Armoo, E. A. (2021). Hydrochemical peculiarities and groundwater quality assessment of the Birimian and Tarkwaian aquifer systems in Bosome Freho District and Bekwai Municipality of the Ashanti Region, Ghana. Environ. Earth Sci. 80:818. doi: 10.1007/s12665-021-10081-2
Pandian, M., and Jeyachandran, N. (2014). Groundwater Quality Mapping using Remote Sensing and GIS–A Case Study at Thuraiyur and Uppiliapuram Block, Tiruchirappalli District, Tamilnadu, India. Int. J. Adv. Remote Sensing GIS 3, 580–591.
PHED (2009). Water Quality. Physical Health and Engineering Department, Government of Bihar, Patna. Available online at: http://phed.bih.nic.in/WaterQuality.htm (accessed May 6, 2021).
Rajmohan, N., and Prathapar, S. (2013). Hydrogeology of the Eastern Ganges Basin: An Overview. 42p, IWMI Working Paper 157. Colombo, Sri Lanka: International Water Management Institute. doi: 10.5337/2013.216
Rakhmatullaev, S., Marache, A., Huneau, F., Le Coustumer, P., Bakiev, M., and Motelica-Heino, M. (2011). Geostatistical approach for the assessment of the water reservoir capacity in arid regions: a case study of the Akdarya reservoir, Uzbekistan. Environ. Earth Sci. 63, 447–460. doi: 10.1007/s12665-010-0711-3
Ranjan, S., and Yasmin, S. (2012). Assessment of groundwater quality in Gaya region with respect to fluoride. J. Ecophysiol. Occup. Health 12:21.
Rao, N. S. (2008). Iron content in groundwaters of Visakhapatnam environs, Andhra Pradesh, India. Environ. Monit. Assess. 136, 437–447. doi: 10.1007/s10661-007-9698-y
Rao, N. S., and Devadas, D. J. (2003). Fluoride incidence in groundwater in an area of Peninsular India. Environ. Geol. 45, 243–251. doi: 10.1007/s00254-003-0873-3
Rao, N. S., Sunitha, B., Adimalla, N., and Chaudhary, M. (2020). Quality criteria for groundwater use from a rural part of Wanaparthy District, Telangana State, India, through ionic spatial distribution (ISD), entropy water quality index (EWQI) and principal component analysis (PCA). Environ. Geochem. Health 42, 579–599. doi: 10.1007/s10653-019-00393-5
Ray, D., Rao, R. R., Bhoi, A., Biswas, A., Ganguly, A., and Sanyal, P. (2000). Physico-chemical quality of drinking water in Rohtas district of Bihar. Environ. Monit. Assess. 61, 387–398. doi: 10.1023/A:1006165615097
Ray, S. S., and Elango, L. (2019). “Deterioration of groundwater quality: Implications and management,” in Water Governance: Challenges and Prospects, eds A. Singh, D. Saha, and A. Tyagi (Singapore: Springer). doi: 10.1007/978-981-13-2700-1_5
Rijsberman, F. R. (2006). Water scarcity: fact or fiction? Agricult. Water Manage. 80, 5–22. doi: 10.1016/j.agwat.2005.07.001
Saha, D., Marwaha, S., and Dwivedi, S. (2019). “National aquifer mapping and management programme: A step towards water security in India,” in Water Governance: Challenges and Prospects, eds A. Singh, D. Saha, and A. Tyagi (Singapore: Springer). doi: 10.1007/978-981-13-2700-1_3
Saha, D., Marwaha, S., and Mukherjee, A. (2018). “Groundwater resources and sustainable management issues in India,” in Clean and Sustainable Groundwater in India, eds D. Saha, S. Marwaha, and A. Mukherjee (Singapore: Springer). doi: 10.1007/978-981-10-4552-3_1
Saha, D., and Ray, R. (2018). “Groundwater resources of India: Potential, challenges and management,” in Groundwater Development and Management, ed P. Sikdar (Springer). doi: 10.1007/978-3-319-75115-3_2
Saha, D., and Sahu, S. (2016). A decade of investigations on groundwater arsenic contamination in Middle Ganga Plain, India. Environ. Geochem. Health 38, 315–337. doi: 10.1007/s10653-015-9730-z
Saha, D., Upadhyay, S., Dhar, Y., and Singh, R. (2007). The aquifer system and evaluation of its hydraulic parameters in parts of South Ganga Plain, Bihar. Geol. Soc. India 69:1031.
Sahoo, P. K., Dall'Agnol, R., Salomão, G. N., Junior, J. D. S. F., Silva, M. S., Souza Filho, P. W. M., et al. (2019). High resolution hydrogeochemical survey and estimation of baseline concentrations of trace elements in surface water of the Itacaiúnas River Basin, southeastern Amazonia: Implication for environmental studies. J. Geochem. Explor. 205:106321. doi: 10.1016/j.gexplo.2019.06.003
Sahoo, P. K., Virk, H. S., Powell, M. A., Kumar, R., Pattanaik, J. K., Salomão, G. N., et al. (2022). Meta-analysis of uranium contamination in groundwater of the alluvial plains of Punjab, northwest India: Status, health risk, and hydrogeochemical processes. Sci. Total Environ. 807:151753. doi: 10.1016/j.scitotenv.2021.151753
Sakram, G., Kuntamalla, S., Machender, G., Dhakate, R., and Narsimha, A. (2019). Multivariate statistical approach for the assessment of fluoride and nitrate concentration in groundwater from Zaheerabad area, Telangana State, India. Sustain. Water Res. Manage. 5, 785–796. doi: 10.1007/s40899-018-0258-0
Sarangi, A., Cox, C., and Madramootoo, C. (2005). Geostatistical methods for prediction of spatial variability of rainfall in a mountainous region. Transact. Am. Soc. Agricul. Biol. Eng. 48, 943–954. doi: 10.13031/2013.18507
Sarangi, A., Madramootoo, C., and Enright, P. (2006). Comparison of spatial variability techniques for runoff estimation from a Canadian watershed. Biosyst. Eng. 95, 295–308. doi: 10.1016/j.biosystemseng.2006.06.002
Saxena, K., and Sewak, R. (2015). Fluoride consumption in endemic villages of India and its remedial measures. Int. J. Eng. Sci. Invention 4, 2319–6734.
Saxena, V., and Ahmed, S. (2001). Dissolution of fluoride in groundwater: a water-rock interaction study. Environ. Geol. 40, 1084–1087. doi: 10.1007/s002540100290
Shah, B. A. (2008). Role of Quaternary stratigraphy on arsenic-contaminated groundwater from parts of Middle Ganga Plain, UP–Bihar, India. Environ. Geol. 53, 1553–1561. doi: 10.1007/s00254-007-0766-y
Shankar, P. V., Kulkarni, H., and Krishnan, S. (2011). India's groundwater challenge and the way forward. Econ. Polit. Wkly. 46, 37–45.
Sheehan, P., Dewhurst, R., James, S., Callaghan, A., Connon, R., and Crane, M. (2003). Is there a relationship between soil and groundwater toxicity? Environ. Geochem. Health 25, 9–16. doi: 10.1023/A:1021261217971
Shyu, G.-S., Cheng, B.-Y., Chiang, C.-T., Yao, P.-H., and Chang, T.-K. (2011). Applying factor analysis combined with kriging and information entropy theory for mapping and evaluating the stability of groundwater quality variation in Taiwan. Int. J. Environ. Res. Public Health 8, 1084–1109. doi: 10.3390/ijerph8041084
Singh, G., Kumari, B., Sinam, G., Kumar, N., and Mallick, S. (2018). Fluoride distribution and contamination in the water, soil and plants continuum and its remedial technologies, an Indian perspective–a review. Environ. Pollut. 239, 95–108. doi: 10.1016/j.envpol.2018.04.002
Singh, P., Tiwari, A. K., and Singh, P. K. (2014). Hydro chemical characteristic and quality assessment of groundwater of Ranchi township area, Jharkhand, India. Curr. World Environ. 9:804. doi: 10.12944/CWE.9.3.30
Singh, S., Raju, N. J., Gossel, W., and Wycisk, P. (2016). Assessment of pollution potential of leachate from the municipal solid waste disposal site and its impact on groundwater quality, Varanasi environs, India. Arab. J. Geosci. 9:131. doi: 10.1007/s12517-015-2131-x
Suthar, S., Garg, V. K., Jangir, S., Kaur, S., Goswami, N., and Singh, S. (2008). Fluoride contamination in drinking water in rural habitations of Northern Rajasthan, India. Environ. Monit. Assess. 145, 1–6. doi: 10.1007/s10661-007-0011-x
Thakur, B. K., and Gupta, V. (2015). Groundwater arsenic contamination in Bihar: causes, issues and challenges. J. Commerce Manage. 2, 45–60. doi: 10.17492/manthan.v2i1.6434
TRUAGRICO (2017). District Irrigation Plan Sheikhpura 2016-20. Trans Rural Agri Consulting Services. Government of Bihar, Patna.
Tweed, S. O., Leblanc, M., Webb, J. A., and Lubczynski, M. W. (2007). Remote sensing and GIS for mapping groundwater recharge and discharge areas in salinity prone catchments, southeastern Australia. Hydrogeol. J. 15, 75–96. doi: 10.1007/s10040-006-0129-x
Tzanakakis, V. A., Paranychianakis, N. V., and Angelakis, A. N. (2020). Water supply and water scarcity. Water 12, 234. doi: 10.3390/w12092347
Uyan, M., and Cay, T. (2013). Spatial analyses of groundwater level differences using geostatistical modeling. Environ. Ecol. Stat. 20, 633–646. doi: 10.1007/s10651-013-0238-3
Verma, D., Bhunia, G. S., Shit, P. K., Kumar, S., Mandal, J., and Padbhushan, R. (2017). Spatial variability of groundwater quality of Sabour block, Bhagalpur district (Bihar, India). Appl. Water Sci. 7, 1997–2008. doi: 10.1007/s13201-016-0380-9
WHO (1997). Guidelines for Drinking-Water Quality: Volume 3-Surveillance and Control of Community Supplies. Geneva: World Health Organization.
WHO (2008). Guidelines for Drinking-Water Quality: Incorporating 1st and 2nd Addendum: Vol. 1- Recommendations, 3rd edition. Geneva: World Health Organization.
Wu, C., Wu, J., Luo, Y., Zhang, H., Teng, Y., and DeGloria, S. D. (2011). Spatial interpolation of severely skewed data with several peak values by the approach integrating Kriging and triangular irregular network interpolation. Environ. Earth Sci. 63, 1093–1103. doi: 10.1007/s12665-010-0784-z
Yasmin, S., Monterio, S., Ligimol, P., and D'Souza, D. (2011). Fluoride contamination and fluorosis in Gaya Region of Bihar, India. Curr. Biot. 5, 232–236.
Keywords: groundwater pollution, geospatial modeling, fluoride, iron, Bihar
Citation: Kumar R, Singh S, Kumar R and Sharma P (2022) Groundwater Quality Characterization for Safe Drinking Water Supply in Sheikhpura District of Bihar, India: A Geospatial Approach. Front. Water 4:848018. doi: 10.3389/frwa.2022.848018
Received: 03 January 2022; Accepted: 11 February 2022;
Published: 24 March 2022.
Edited by:
Prosun Bhattacharya, Royal Institute of Technology, SwedenReviewed by:
Rachida Bouhlila, Higher National Engineering School of Tunis, TunisiaPrafulla Kumar Sahoo, Central University of Punjab, India
Venkatramanan Senapathi, Alagappa University, India
Copyright © 2022 Kumar, Singh, Kumar and Sharma. This is an open-access article distributed under the terms of the Creative Commons Attribution License (CC BY). The use, distribution or reproduction in other forums is permitted, provided the original author(s) and the copyright owner(s) are credited and that the original publication in this journal is cited, in accordance with accepted academic practice. No use, distribution or reproduction is permitted which does not comply with these terms.
*Correspondence: Rakesh Kumar, cmFrZXNoLmt1bWFyLlBoREBuYWxhbmRhdW5pdi5lZHUuaW4=
†ORCID: Sarnam Singh orcid.org/0000-0003-1829-7941
Rakesh Kumar orcid.org/0000-0001-7264-5682
Prabhakar Sharma orcid.org/0000-0003-0894-0809