 Isabellah von Trapp
 Kelsey G. Jencso
 Zachary H. Hoylman2
 W. Payton Gardner
- 1Department of Geosciences, University of Montana, Missoula, MT, United States
- 2Department of Forest Management, Franke College of Forestry and Conservation, Missoula, MT, United States
We investigated the contribution of bedrock groundwater to streamflow as a function of catchment scale in a headwater stream. Synoptic surveys were conducted during hydrologically important periods of the year using multiple environmental tracers in stream water, soil water, and bedrock groundwater, along a first-order montane stream, in west-central Montana. Sampled analytes included 222Rn, used to constrain total subsurface flux, and major and minor elements, used in end-member mixing analysis (EMMA) to identify the contributions of soil and bedrock groundwater to the stream. Partitioning between soil-derived and bedrock-derived groundwater was then analyzed as a function of the incremental and accumulated sub-catchment sizes. Radon results indicated that subsurface water contributions accounted for the majority of streamflow at all surveyed times. EMMA results revealed that the bedrock groundwater contribution to streamflow varied between 26% during peak snowmelt and 44% during late summer. Streamflow generation was dominated by soil groundwater contribution along the entire reach, but the bedrock groundwater contribution increased consistently with accumulated sub-catchment size. However, groundwater contributions were not well-correlated with incremental sub-catchment size. The scale at which increased bedrock groundwater discharge can be correlated with sub-catchment size appears to be >1 km2 for our study. Our results are consistent with a conceptual model where streamflow is predominantly generated by a 3D subsurface nested flow system. Local subsurface heterogeneities control the stream source at local scales but begin to average out at scales >2 km2. Our study indicates that, while soil groundwater is the dominant source, bedrock groundwater remains an important and predictable contributor to streamflow throughout the year, even in a snow-dominated, mountainous headwater catchment.
Introduction
Upland mountain watersheds host active hydrologic systems that play important roles in the storage and release of water to the larger stream network (Hale et al., 2016; Hale and McDonnell, 2016; Liu et al., 2004; Williams et al., 2015). These groundwater systems are locally important sources of streamflow (Asano et al., 2022; Gabrielli et al., 2012; Uchida et al., 2003) and recharge regional groundwater systems, which discharge to larger streams in the lowlands (Beisner et al., 2018; Fan et al., 2013; Frisbee et al., 2011; Gardner et al., 2011; Gleeson and Manning, 2008; Smerdon et al., 2012). The amount of bedrock groundwater discharge in montane streamflow is important for conceptualizing watershed function and predicting hydrologic resource availability in the future (Condon and Maxwell, 2019; Meixner et al., 2016; Williams et al., 2015). However, groundwater flow systems are marked by extreme heterogeneity in hydraulic characteristics and the resulting flow path length and rate; as a result, groundwater discharge volumes and locations are all highly variable (Beisner et al., 2018; Gardner et al., 2011; Hale et al., 2016; Harrington et al., 2013; Smerdon and Gardner, 2021). Neither the spatial scale at which 3D groundwater flow becomes an important and predictable source of streamflow nor the seasonal variation in these processes are well-documented at present.
Subsurface water is an important source of streamflow, even in snow-dominated watersheds (Liu et al., 2004). Subsurface sources are commonly conceptualized as originating from both bedrock (weathered bedrock and saprolite) and soil reservoirs (Anderson et al., 1997a; Carroll and Williams, 2018; Hale et al., 2016; Hale and McDonnell, 2016; Salve et al., 2012; Torres et al., 1998). In this study, we refer to shallow groundwater in the soil zone as soil groundwater and deeper, fractured-bedrock groundwater as bedrock groundwater. The relative importance of soil and bedrock reservoirs depends on the soil and bedrock hydraulic characteristics (Flint et al., 2008; Gardner et al., 2020; Katsuyama et al., 2005; Pfister et al., 2017; Uchida et al., 2002, 2006). The amount of groundwater in a watershed significantly influences dynamic properties, such as hydrograph variability (Asano et al., 2022; Gardner et al., 2010; Pfister et al., 2017) and mean transit time (Asano et al., 2002; Asano and Uchida, 2012; Hale et al., 2016; Pfister et al., 2017; Uchida et al., 2006).
Soil water lateral flow and bedrock groundwater circulation are tightly coupled (Appels et al., 2015; Carroll et al., 2019; Gardner et al., 2020; Tromp-van Meerveld et al., 2007; Uchida et al., 2002). As a result of this coupling, the location and amount of bedrock recharge are controlled by subsurface permeability distribution, hillslope position, and bedrock topography, which affect the lateral soil moisture distribution and location of vertical drainage (Appels et al., 2015; Gardner et al., 2020). The relative contributions of soil and bedrock groundwater to stream water are expected to vary temporally (Spencer et al., 2021). The celerity of subsurface response depends on the soil and bedrock hydraulic properties (Anderson et al., 1997a,b).
Groundwater discharge location, rate, and flow path source can be highly localized and variable because they depend upon the local geology and surface characteristics (Beisner et al., 2018; Bergstrom et al., 2016; Gardner et al., 2011; Harrington et al., 2013; Smerdon et al., 2012). In addition, the localized bedrock and soil water contributions from hillslopes are buffered by the local alluvial groundwater system, and they can be mixed and transported within this system before reaching the stream (Jencso et al., 2010). Despite the spatial heterogeneity at local scales, it is clear that the contribution from deeper bedrock groundwater systematically increases with increasing drainage area at regional scales (Asano et al., 2022; Frisbee et al., 2011, 2012). Since there is observed heterogeneity in the amount and location of groundwater discharge occurring locally, which contrasts with predictable increases in groundwater discharge at larger, integrated scales, it appears that groundwater discharge in streams is an emergent property.
Is there, in fact, a scale at which groundwater discharge volume becomes more predictable? If so, does this scale change temporally? In this article, we investigate how the amount and location of bedrock and soil groundwater discharge vary as a function of space and time in a montane, first-order watershed in west-central Montana. The study objectives are to constrain the amount of bedrock vs. soil groundwater discharge along a stream reach as a function of seasonal changes in catchment wetness and increasing spatial scale. Leveraging a high-resolution network of gauging stations, we conducted a multi-tracer interrogation of the incremental sources of streamflow generation. We estimate the total volume of subsurface discharge and distinguish the contributions of soil and bedrock groundwater discharge along the stream. We then explore relationships of the bedrock groundwater contribution as a function of the incremental and integrated upland characteristics.
Study area
The Cap Wallace Watershed (CWW) is located in west-central Montana, ~56 km northeast of Missoula on the north slope of the Garnet Range (Figure 1). The catchment drains 6 km2 of forested land and is a tributary of the Blackfoot River. The CWW ranges in elevation from 1,163 m at the confluence of Cap Wallace Creek (CWC) and Elk Creek to 1,918 m at the ridge tops. Vegetation consists primarily of second-growth western larch (Larix occidentalis) on the north-slope mid and upper elevations, Douglas-fir (Pseudotsuga menziesii) on north-facing, low-elevation slopes, and Ponderosa Pine (Pinus ponderosa) on south-aspect slopes. North-aspect slopes have well-developed soils, whereas south-aspect slopes lack soil coverage and are generally covered by steep talus fields. Due to topographic variation in the radiation balance and resulting microclimatic effects (Holden et al., 2011a,b), south-aspect slopes remain significantly drier throughout the year (Hoylman et al., 2019).
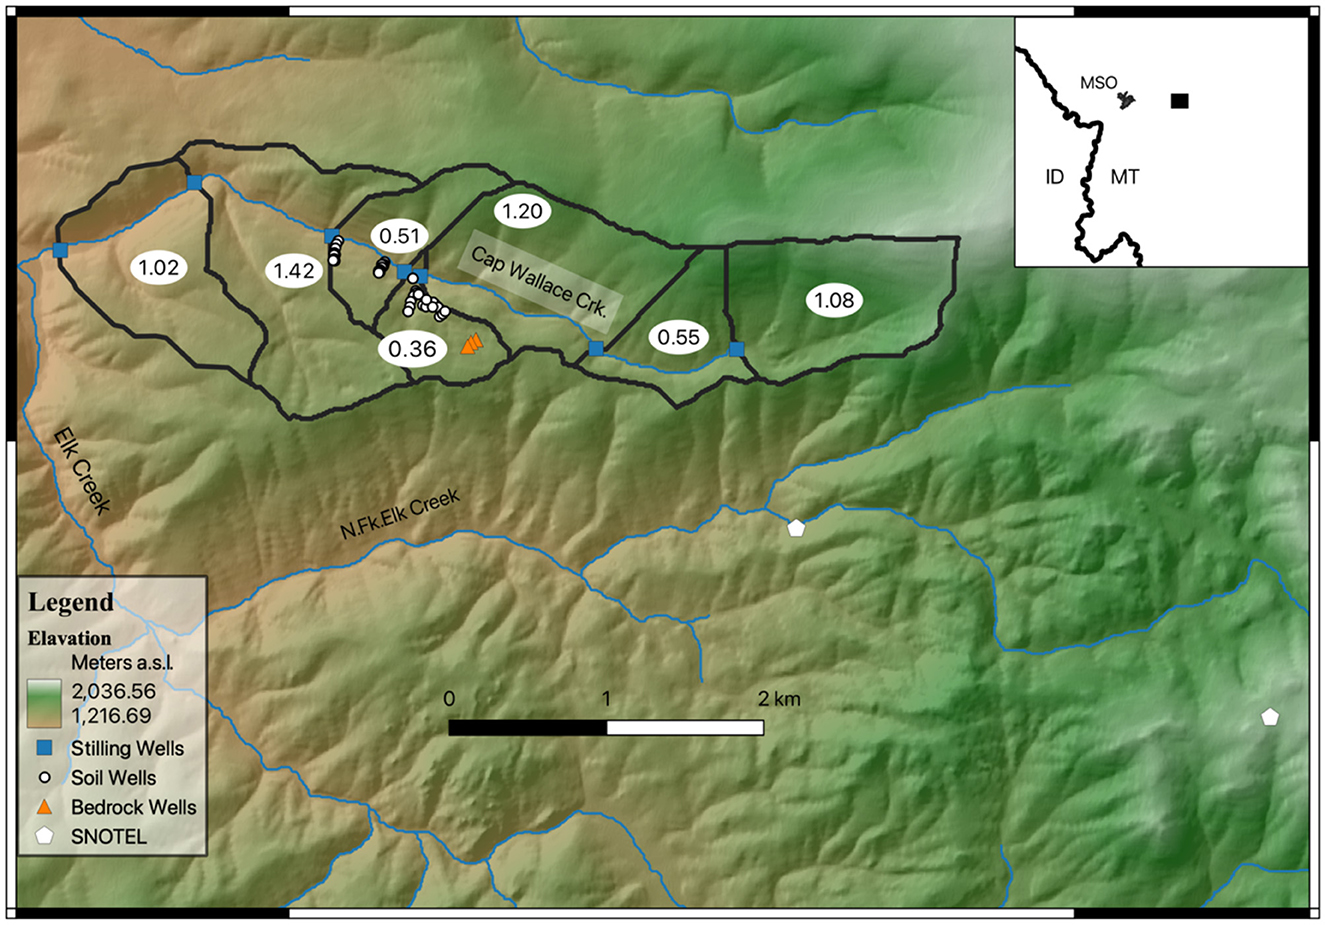
Figure 1. Map of the Cap Wallace watershed on the north slope of the Garnet Range. Outlines indicate sub-watersheds, with drainage areas in km2 given in white ellipses. The inset map shows east-central Idaho (ID) and west-central Montana (MT) with the relative location of Missoula (MSO).
At the Lubrecht Flume SNOTEL station (site #604; 1,425 m), the average annual precipitation over the record period of 10 years is 514 mm. Nearly 50% of precipitation falls as snow, classifying the Cap Wallace as a snowmelt-dominated watershed. In 2017, temperatures ranged from −27.6°C to 34.2°C with an annual average temperature of 6.1°C (Figure 2). Peak snow water equivalent typically occurs in late March, with snow melt taking place during April, May, and early June. May and June are typically cool and rainy, while July, August, and September are generally hot and dry, with precipitation beginning again in October.
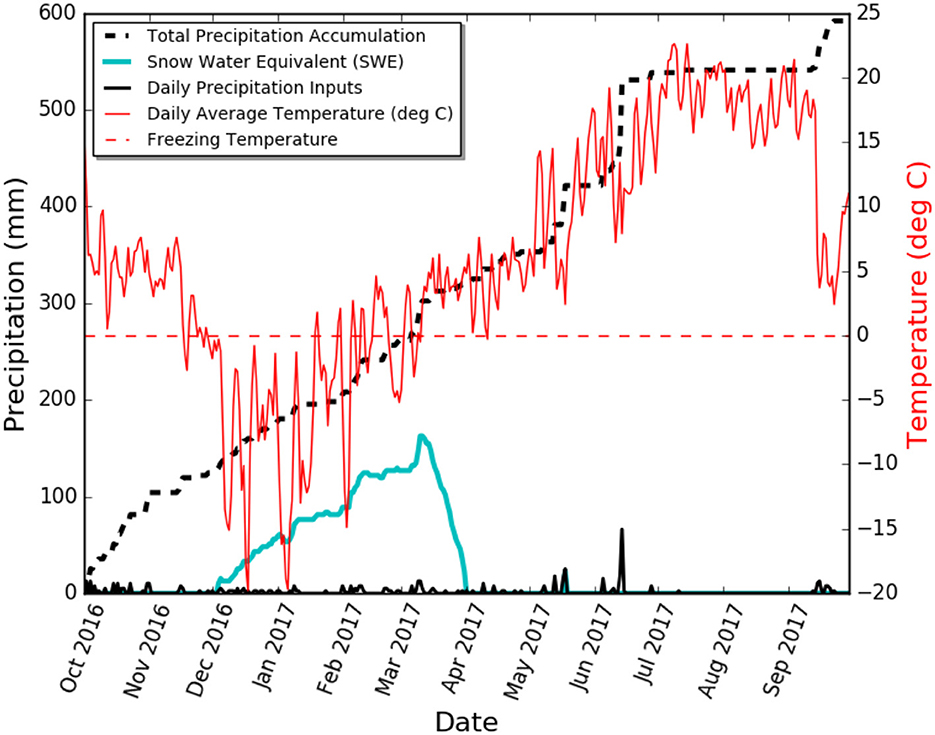
Figure 2. Lubrecht climate data for the 2017 water year. Data source: Lubrecht SNOTEL (site #604). 2017 was a heavy precipitation year with many days below freezing.
The Garnet Range is part of the Northern Rocky Mountains and was formed through folding and thrusting associated with the Jurassic Sevier and Cretaceous Laramide Orogenies (140–55 Ma). Subsequent extensional normal faulting was initiated in the early Eocene as a result of Basin and Range tectonics, triggering the uplift of metamorphic core complexes in the Northern Rockies (Portner et al., 2011). The CWW is situated on the flank of a large granitic batholith called the Garnet Stock, which intruded the area during the Late Cretaceous (Lonn et al., 2010). CWC follows an east–west trending normal fault. Quaternary glacial and alluvial deposits cover the narrow valley bottom and stream floor, while the hillslopes are composed of gravelly, silt-loam soils (Soil Survey Staff, Natural Resources Conservation Service, United States Department of Agriculture, n.d.) that overlie several kilometers of argillites, siltites, and quartzites of the Precambrian metasedimentary Belt Supergroup. Soils are classified as Typic Haplustalfs (well-draining with a lower clay horizon), with depths ranging from 0.5 to 2 m that are thicker in hollows and thinner in upper elevation ridges (Hoylman et al., 2018). The north-aspect slope is composed of the Garnet Range Formation, a siltstone with hummocky sand lenses, which lies unconformably across the valley from the stratigraphically lower Bonner Quartzite, a massive, slightly metamorphosed, arkosic sandstone that makes up the south-aspect slopes (Lonn et al., 2010). These formations have been subject to tectonism associated with compression from major mountain-building events and subsequent active extension due to gravitational relaxation, leading to a dense fracture network within the bedrock (Brenner, 1968; Gardner et al., 2020).
Methods
We measured multiple environmental tracers in soil, groundwater, and stream water to perform hydrograph separation along CWC. We conducted synoptic sampling along CWC for discharge of the stream and dissolved 222Rn and major ions at four hydrologically important times: (1) early-spring baseflow (March), (2) the rising limb of spring snowmelt freshet (April), (3) the falling limb of freshet (May–early June), and (4) summer baseflow (late June–October).
Field methods
Cap Wallace Watershed is instrumented with 36 shallow soil wells, three groundwater wells, and seven stilling wells for measuring stream discharge. Shallow soil wells are 1–2 m deep, fully screened, and pounded with a steel rod until refusal. Bedrock groundwater wells were drilled to depths of 10–20 m using a man-portable drilling rig. Bedrock wells were fully screened, and the annulus was filled with the sand pack from the bottom to 7 m below the land surface and then cased and the annulus sealed with bentonite to the land surface. Stilling wells were spaced at ~1 km intervals, strategically located downstream of converging sub-watersheds with large contributing areas to estimate the hillslope contribution from sub-watersheds along the stream (Figure 1). Field data collection began during the winter of 2017. Solinst pressure transducers were installed in stilling, soil, and groundwater wells to continually monitor and record stage measurements along the stream and contributing hillslopes.
Throughout the spring, summer, and fall of 2017, synoptic discharge measurements were made repeatedly at each stilling well using dilution gauging (Gooseff and McGlynn, 2005). Replicate measurements were collected at multiple stilling well locations during each sampling period. On average, replicates of stream discharge differed by ±4% of one another, but during baseflow, one replicate recorded a discharge value of 54% lower than the original measurement (28 August 2017). There are several potential reasons for this discrepancy. In particular, this measurement was collected at one of the lowest recorded flows. Low flows have been shown to complicate the dilution gauging technique when hyporheic exchange occurs (Moore, 2004). Because this replicate was identified as an outlier, this baseflow measurement was not used in our determination of the average uncertainty in replicate measurements (5%); however, it is clear that as we approach low flows, our ability to accurately measure the flow is reduced.
During synoptic discharge measurement campaigns, each stilling well location was sampled for 222Rn and major ions (Ca2+, K+, Mg2+, Na+, F−, Cl−, , ). Sample bottles were rinsed three times with sample water. Samples for 222Rn analysis were collected underwater in airtight 250 mL glass bottles to avoid exchange with the atmosphere. Major ion samples were filtered using a 0.45-μm disposable filter and stored in acid-washed polyethylene bottles. Cation samples were acidified with 0.2 mL of nitric acid. Field parameters, including pH, temperature, oxidation-reduction potential, and electric conductivity, were collected using an In-Situ Aqua TROLL 600 sonde. Precipitation samples were collected at the Jones Pond Montana Mesonet site ~10 km away and were measured throughout the year. Integrated snowmelt samples were collected during the melt season using a snow core to collect complete snowpack samples and melted in the laboratory refrigerator. Water samples were collected from soil and groundwater wells, using a peristaltic pump in April 2017. Prior to collection, wells were purged until field parameters remained constant (~2–3 × the volume of the well).
Laboratory methods
222Rn samples were analyzed within 48 h of collection using a Durridge Instruments RAD7 spectral alpha-decay detector. A sample of 250 ml was analyzed using the WAT-250 protocol, with 5 min of degassing (bubbling) followed by five rounds of counting, where each counting round was 5-min long. The RAD7 was purged for >20 min between each sample. Concentration was determined from the last four counting rounds (20 min total). The obtained concentrations were corrected to account for decay during the period between sample collection and analysis using the formula:
where Ctc is the time-corrected radon concentration in Bq/L, Ci is the initial radon concentration prior to correction (Bq/L), and t is the time elapsed between collection and analysis in hours. Samples for the analysis of anions were run on a DIONEX DX500 (IC) and cations on a Perkin-Elmer OPTIMA 5300 (ICP-OES). Detection limits and accuracy for IC and ICP-OES analyses are presented in Table 1. All 222Rn and major ion samples were analyzed at the University of Montana's Environmental Biogeochemical Laboratory.
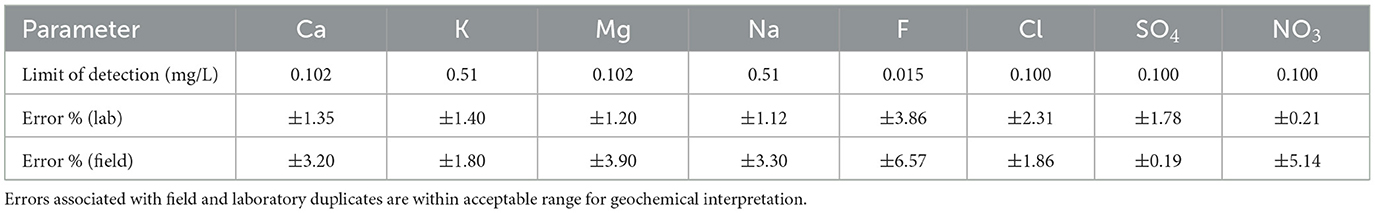
Table 1. Limits of detection and precision of field and laboratory duplicates for ion chromatography (IC) and inductively coupled plasma emission spectroscopy (ICAP-OES) analyses.
Modeling approach and data analysis
Two different modeling techniques were used to identify and estimate the sources of streamflow. First, in-stream radon concentrations were used to estimate total subsurface discharge. End-member mixing analysis (EMMA) was then conducted on major ions in stream, soil, snowmelt, and groundwater to estimate the appropriate number and type of end members. The obtained end members were then used in a mass-balance mixing model to quantify end-member contributions to the stream. Mixing fractions were compared with landscape topographic characteristics. The effects of different internal landscape characteristics on spatial heterogeneity and duration of subsurface flow were quantified seasonally at spatial scales ranging from 0.4 to 6 km2.
Radon modeling
222Rn is advantageous as an analyte because it is not present in the atmosphere and is non-existent in overland flow, direct snowmelt, and precipitation. Meanwhile, all subsurface waters with a residence time of over a few hours have measurable 222Rn, and all waters with a residence time over ~2 weeks achieve secular equilibrium and have relatively constant 222Rn concentration for a given lithology. Thus, 222Rn concentrations can be used to isolate subsurface streamflow sources. Estimating subsurface inflow from 222Rn requires a model that accounts for subsurface discharge, gas exchange with the atmosphere, and radioactive decay. A 1D stream transport model was created to simulate longitudinal radon activity (Cook et al., 2003) using the equations:
where c is the concentration of radon in the stream (Bq/L), ci is the concentration in bedrock or soil groundwater (Bq/L), I is the groundwater inflow rate (m3/m/day), w is the stream width (m), d is the mean stream depth (cross-sectional area/width) (m), k is the gas exchange velocity (m/day), λ is the radon decay coefficient (per day), Q is the stream discharge (m3/day), E is the evaporation rate (m/day), and L is the stream extraction rate from pumping or diversions (m3/m/day). Equation 2 is the mass balance equation for water in the stream, and Equation 3 is the 1D steady-state equation for advective solute transport in the stream with groundwater inflow, atmospheric gas exchange, and in-stream radioactive decay. We assumed an atmospheric 222Rn concentration of zero, no production of 222Rn within the stream, and steady-state flow conditions.
The ultimate goal of the 222Rn fitting was to assess the amount of subsurface-derived discharge vs. overland discharge, assuming that soil and groundwater with residence times over 2 weeks have similar radon concentrations and overland flow has zero radon concentration. The distributed total groundwater discharge (soil plus bedrock) was estimated by fitting the observed 222Rn stream discharge. Radon and discharge values were fit by varying stepwise groundwater discharge (Gardner et al., 2011). Groundwater inflow was assumed to be constant over 500 m steps, which resulted in 10 unknown groundwater inflow steps along the stream reach. The number and location of groundwater steps were held constant at all sampling times. Steps in the radon concentration correspond to boundaries of the stepwise constant groundwater inflow. The total number of observations for inversion is 14, resulting in an overdetermined system.
To quantify incremental gains from subsurface sources at each stilling well, we calculated the ratio of subsurface discharge to total streamflow gain (Fss):
where Qss1is the upstream modeled subsurface discharge (L/s), Qss2 is the downstream modeled subsurface discharge (L/s), and ΔQt is the measured difference in streamflow from upstream to downstream (L/s).
The parameters used for radon modeling are shown in Table 2. Those that were not directly measured in the field were estimated based on a series of equations also detailed in Table 2. Following the approach of Cook et al. (2003), a sensitivity analysis was conducted by varying each individual model parameter by ±50%, while holding the other parameters constant to observe the associated effect on estimated subsurface inflow. Particular interest was given to the parameters not measured in the field since they were the largest source of uncertainty in the model.
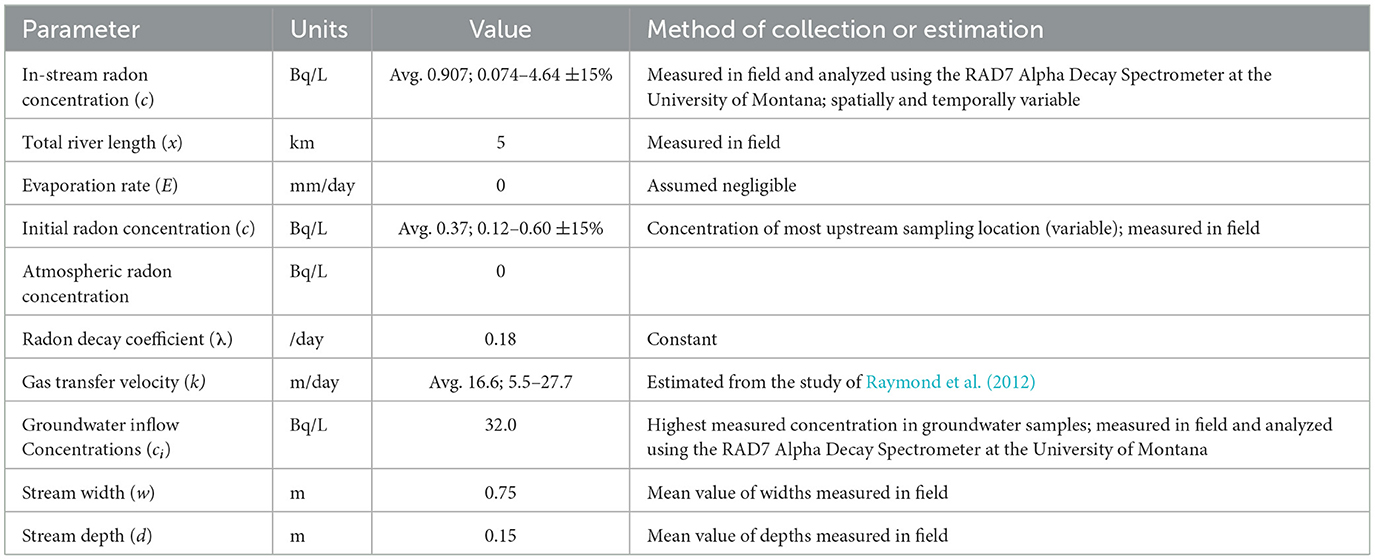
Table 2. Details of the parameters used in 222Rn modeling.
As the gas transfer velocity (k) is difficult to constrain in low-order mountainous streams due to their variable geometries, flow velocities, and temperatures, special attention was given to the effect of k on estimated subsurface inflow rates. Four common equations that depend on slope, velocity, and depth (Raymond et al., 2012) were used to approximate the gas transfer velocity range.
End-member mixing analysis
End-member mixing analysis was performed following the approach of Hooper (2003). Details of the specific application of EMMA in this article can be found in Supplementary material. Here, we used four tracers (calcium, magnesium, sodium, and chloride, see Results) to constrain a two-end-member mixing model. The end members chosen were the reprojected average bedrock and soil groundwater compositions from all samples throughout the year. End-member concentrations were held constant over time. However, most bedrock and all soil groundwater samples were collected in spring when water tables were shallow enough to be sampled. Our end members are referred to here as soil groundwater and bedrock groundwater, where soil water represents shallow groundwater in the soil zone, and groundwater represents bedrock groundwater in fractured bedrock. We estimated uncertainty for the EMMA results by propagating the error due to EMMA misfit through the mixing calculation details, which can be found in Supplementary material. Error bars on mixing plots are given as the mean relative error for all samples, which was 13%.
Terrain analysis
To explore the topographic characteristics that influence streamflow generation, the catchment was delineated into “sub-catchments.” All-terrain analyses were performed using the SAGA GIS software (Conrad et al., 2015). A 10-m resolution digital elevation model of the study area had sinks filled, and the stream network burned in. The CWW boundary was delineated by creating flow direction and accumulation grids to determine the contributing area for each stilling well. The watershed was then divided into seven sub-catchments based on those areas. In the process, each sequential downstream sub-catchment integrated all upstream sub-catchments; we refer to these sub-catchments as “accumulated” sub-catchments. “Incremental” sub-segments contributing between stilling wells were determined by subtracting the upstream sub-watershed from the downstream sub-watershed (Figure 1). Mean elevation, Topographic Wetness Index (TWI), and upslope accumulated catchment area (UAA) were calculated for each accumulated and incremental sub-catchment. Linear regression was then performed to assess the modeled end-member discharge correlation to terrain attributes for both the incremental and accumulated areas.
To analyze the relationship between landscape and end-member discharge in an incremental sense, fractions of end-member discharge gained in each sub-catchment were calculated by quantifying the solute concentration of water entering the incremental reach (ΔC) at each stilling well along the reach using the following formula:
where Qd is downstream discharge (L/s), Cd is downstream solute concentration (mg/L), Qu is upstream discharge (L/s), Cu is the upstream solute concentration (mg/L), and ΔQ is the net change in discharge from the upstream stilling well to the downstream stilling well (L/s). Incremental solute concentrations, such as calcium, magnesium, sodium, and chloride, were calculated for each tracer used in mixing models. These solute concentrations were applied in mass-balance mixing models (Supplementary material) to quantify fractional gains in groundwater and soil water from one sub-catchment to the next. Modeled end-member fractions were compared against the mean elevation and TWI values as well as the area for each incremental sub-catchment to evaluate the relationships between internal catchment characteristics and discharge. To evaluate these relationships for the accumulated area, the elevation, TWI, and UAA values for the sub-watershed draining to each stilling well were compared to the original EMMA-modeled groundwater and soil water contributions at each stilling well location. Both accumulated and incremental analyses were conducted for each synoptic sampling campaign in order to evaluate seasonal change.
Hydrometric data from soil wells at various landscape positions were used as a proxy for determining when the catchment was “wet,” as the data indicated the interconnectedness of the water table over time. Full hydrographs for soil and groundwater over the study period can be found in Gardner et al. (2020). Soil water connection was evaluated through binary plots of saturated vs. unsaturated conditions.
Results
Radon concentrations ranged from 0.074 to 4.25 Bq/L and showed the same general spatial pattern across varying discharges (Figure 3). During each sampling period, a significant increase in radon activity was observed approximately halfway down the observed reach (~2.5 km). This increase coincides with the location of a large contributing hillslope area from the south (Figure 1). The difference between duplicate samples ranged from 0 to 40%, with low-concentration samples exhibiting larger variability, consistent with Poisson statistics of radioactive decay. For example, at a concentration of 0.074 Bq/L (corresponding duplicate 0.111 Bq/L), there is a 40% variability, while at a concentration of 2.527 Bq/L (duplicate 2.597 Bq/L), there is a 2.7% variability.
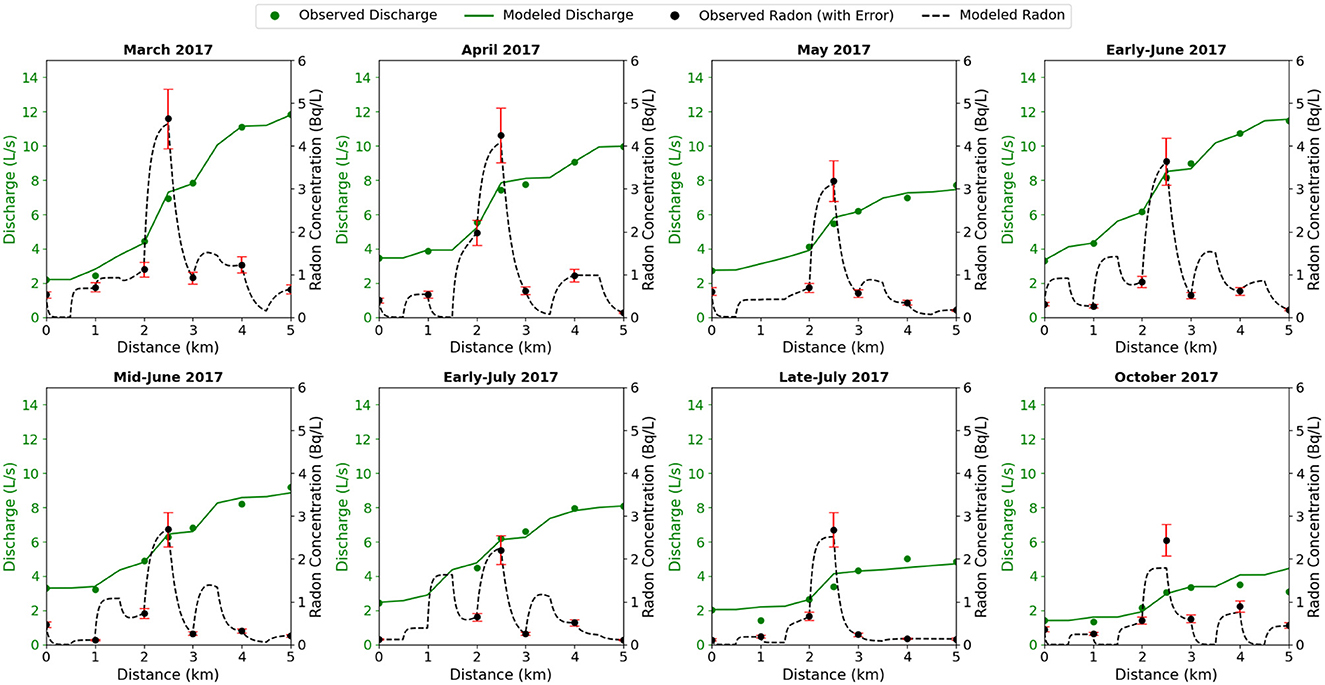
Figure 3. Longitudinal profiles of measured and modeled 222Rn concentration and stream discharge. Black and green dots represent measured in-stream 222Rn concentration and discharge, respectively. Dashed black and green lines represent modeled 222Rn concentration and streamflow. Error bars of 15% added as an average field of duplicate errors.
Figure 4 shows total subsurface discharge estimates along with modeled and observed total stream discharge. The longitudinal profile of the accumulated subsurface discharge closely follows the increase in total stream discharge. For each interval, subsurface discharge accounts for 19–100% of the incremental gains in streamflow, with an average of 81% (Figure 5). In May and mid-June, the months of highest rainfall, the influence of non-subsurface discharge is strongest, with subsurface discharge accounting for, on average, 68% and 59%, respectively, of the incremental gains in streamflow. Non-subsurface discharge generation estimates predominantly occur near the center of the reach (2.5–3 km downstream of the headwaters) at the convergence of two large hillslopes.
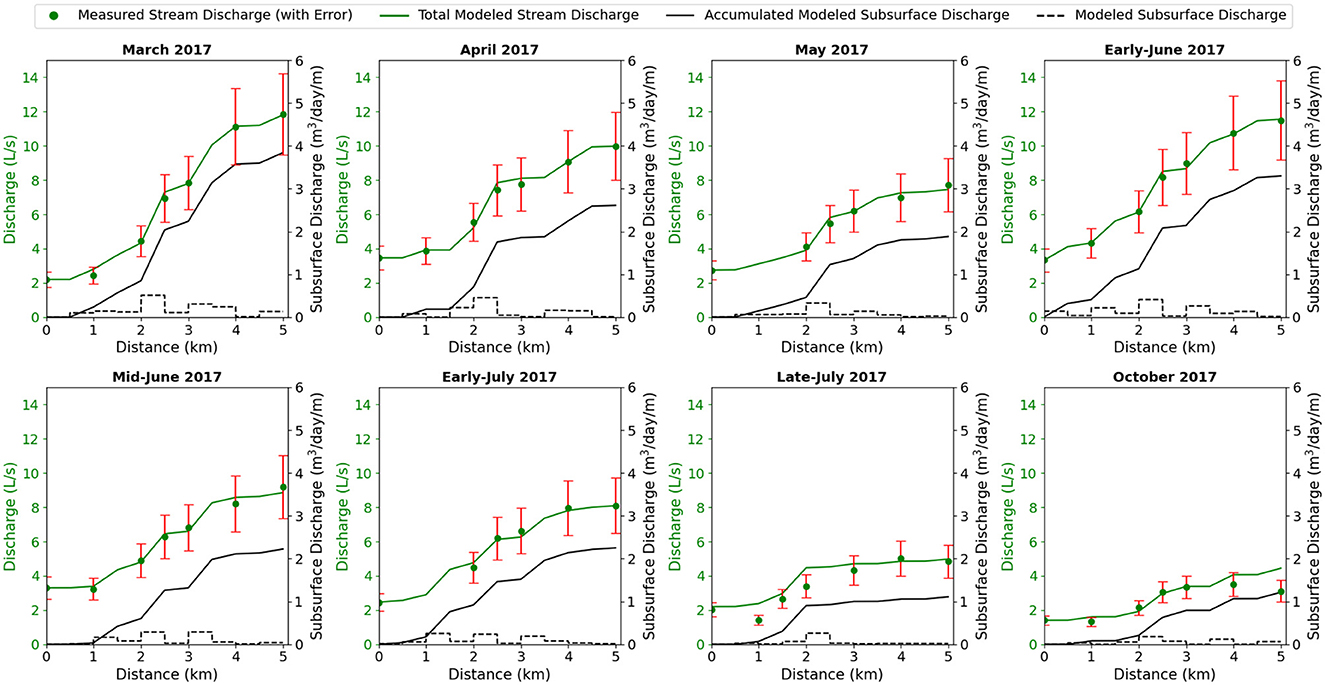
Figure 4. Longitudinal profiles of stream discharge. The green line, green dots, and black line correspond to the primary y-axis and represent accumulated modeled total stream discharge, measured stream discharge at each stilling well location, and accumulated modeled subsurface discharge along the reach. The dashed black line corresponds to the secondary y-axis and shows modeled subsurface inflow in m3/m/d. Error bars of 20% added as an average field duplicate error.
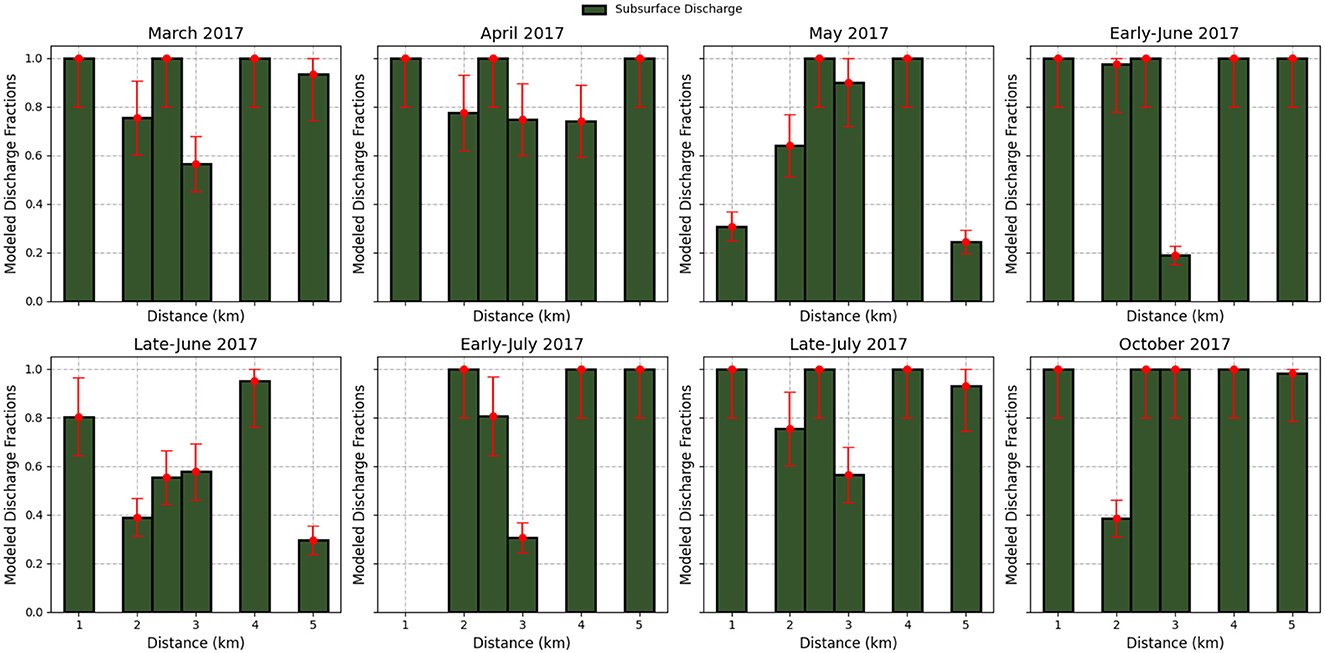
Figure 5. Incremental gains in modeled streamflow as a fraction of subsurface to total streamflow at each gauging location along the reach. The darker green color indicates the fraction of the accumulated discharge accounted for by a subsurface discharge between gauging station locations. Error bars estimated from 20% uncertainty in groundwater discharge estimate using our Rn transport model (Goble, 2018).
Reprojected mean groundwater and soil water end-member concentrations are provided in Table 3. The two end members chosen, spanned the sample variance and the residual error in modeled vs. observed concentration showed no structure. The fractions of soil and bedrock groundwater in stream water samples are shown in Figure 6. The bedrock groundwater discharge fraction ranged from 0 to 0.45, with an average of ~0.2. In general, bedrock groundwater becomes a larger component of streamflow as the distance downstream increases, with the highest fraction of groundwater discharge occurring at the farthest downstream gauging location. Figure 7 shows the percentage of bedrock groundwater at the outlet as a function of time. Groundwater at the outlet fluctuated between 26 and 44% and averaged 38% of total streamflow. The fraction of bedrock groundwater to total streamflow at the outlet was highest during the late spring (2 June 2017) and lowest during mid-spring (19 May 2017).
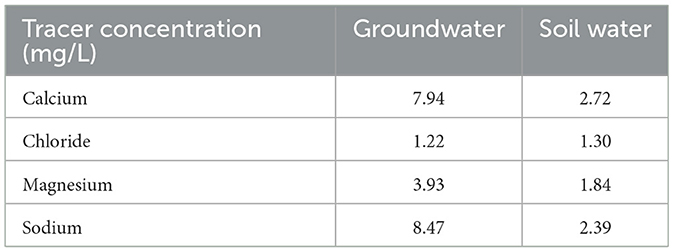
Table 3. Solute concentrations used in EMMA mass-balance mixing models.
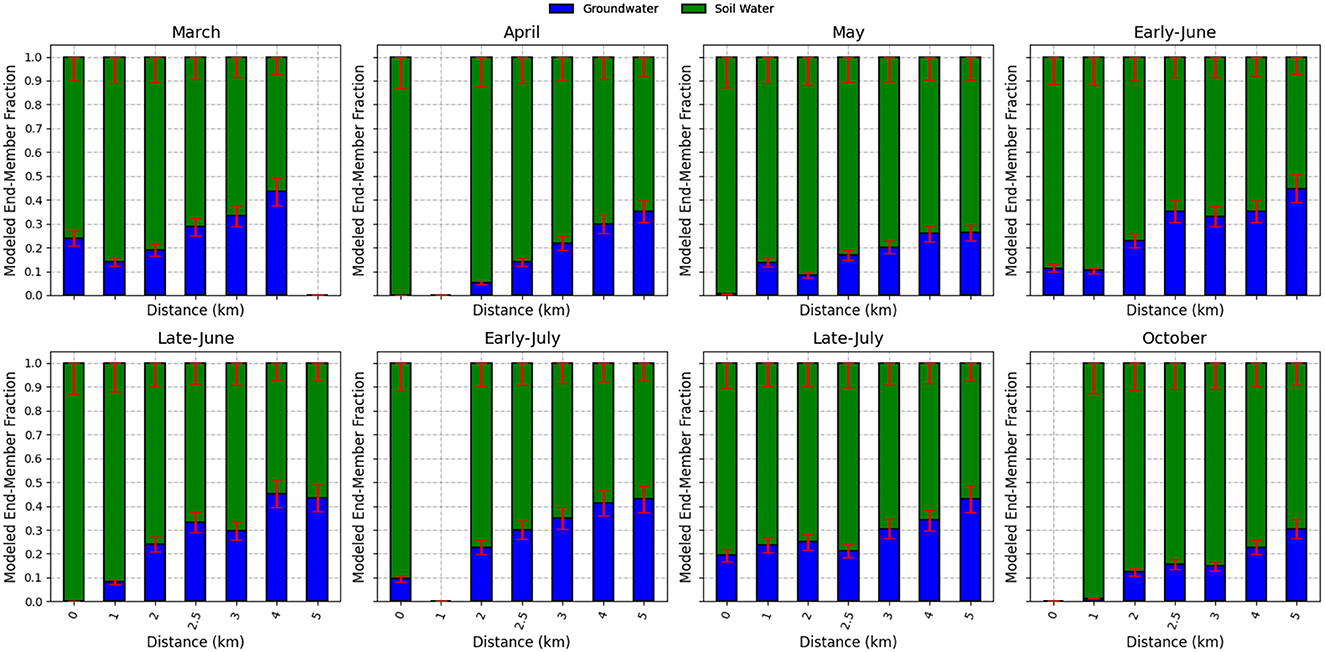
Figure 6. Longitudinal profiles of mixing model results showing how soil and bedrock groundwater were partitioned along the reach for each sampling campaign. Stream chemistry and discharge measurements were occasionally unavailable in circumstances where it would have been dangerous to collect them (i.e., the presence of bears), if samples became contaminated or if sample bottles were broken prior to chemical analysis.
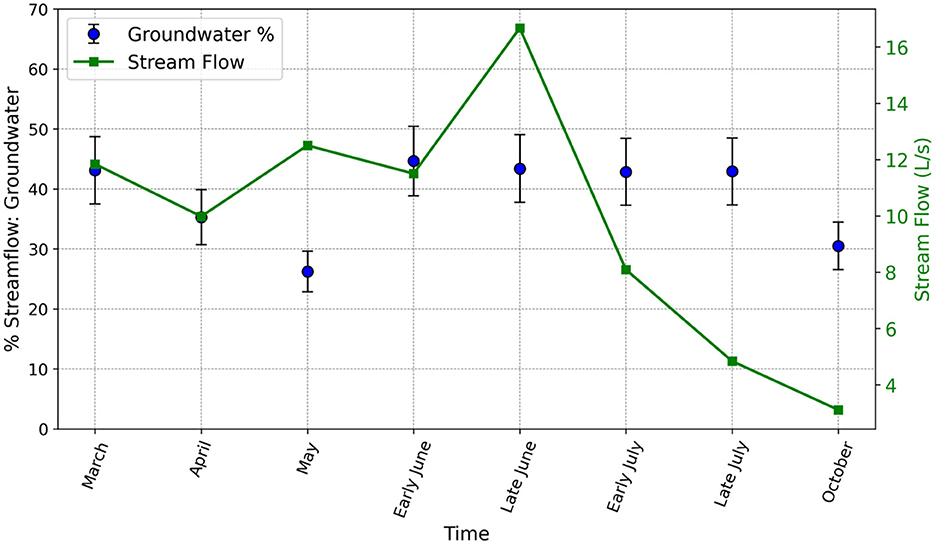
Figure 7. Seasonal fluctuation of the groundwater fraction of total streamflow at the outlet.
Table 4 summarizes linear regression results for incremental and accumulated terrain characteristics with the bedrock groundwater mixing fraction. Linear regression of cumulative mean terrain indices and soil and bedrock groundwater fractions revealed strong relationships with both cumulative average elevation and cumulative upslope accumulated area (Figure 8, Table 4). R2 values ranged from 0.52 to 0.98 over the 7-month study period. While the R2 values ranged from 0.05 to 0.81 for the incremental terrain characteristics, they tended to switch drastically from high to low values throughout the year. No systematic trend was found relating incremental end-member discharges with incremental TWI and area (Figure 9, Table 4).
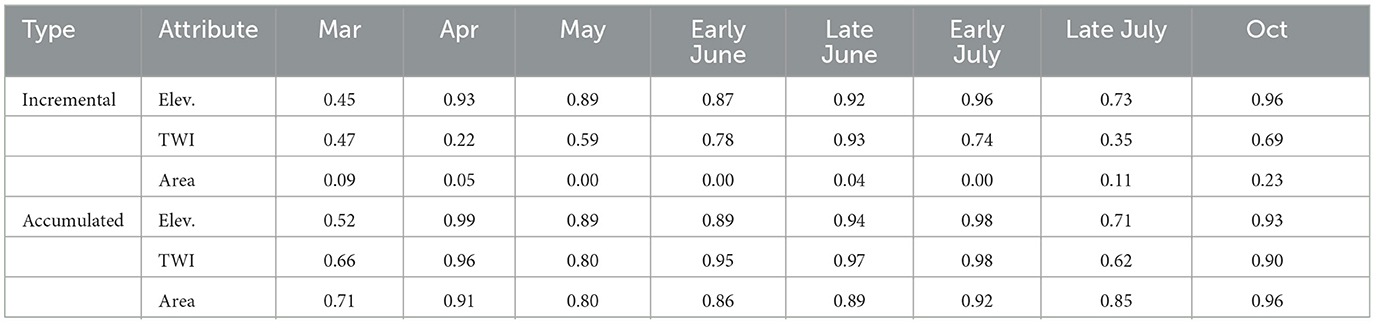
Table 4. Summary of r2 values from cumulative and incremental regression against mean elevation, topographic wetness index, and sub-watershed area.
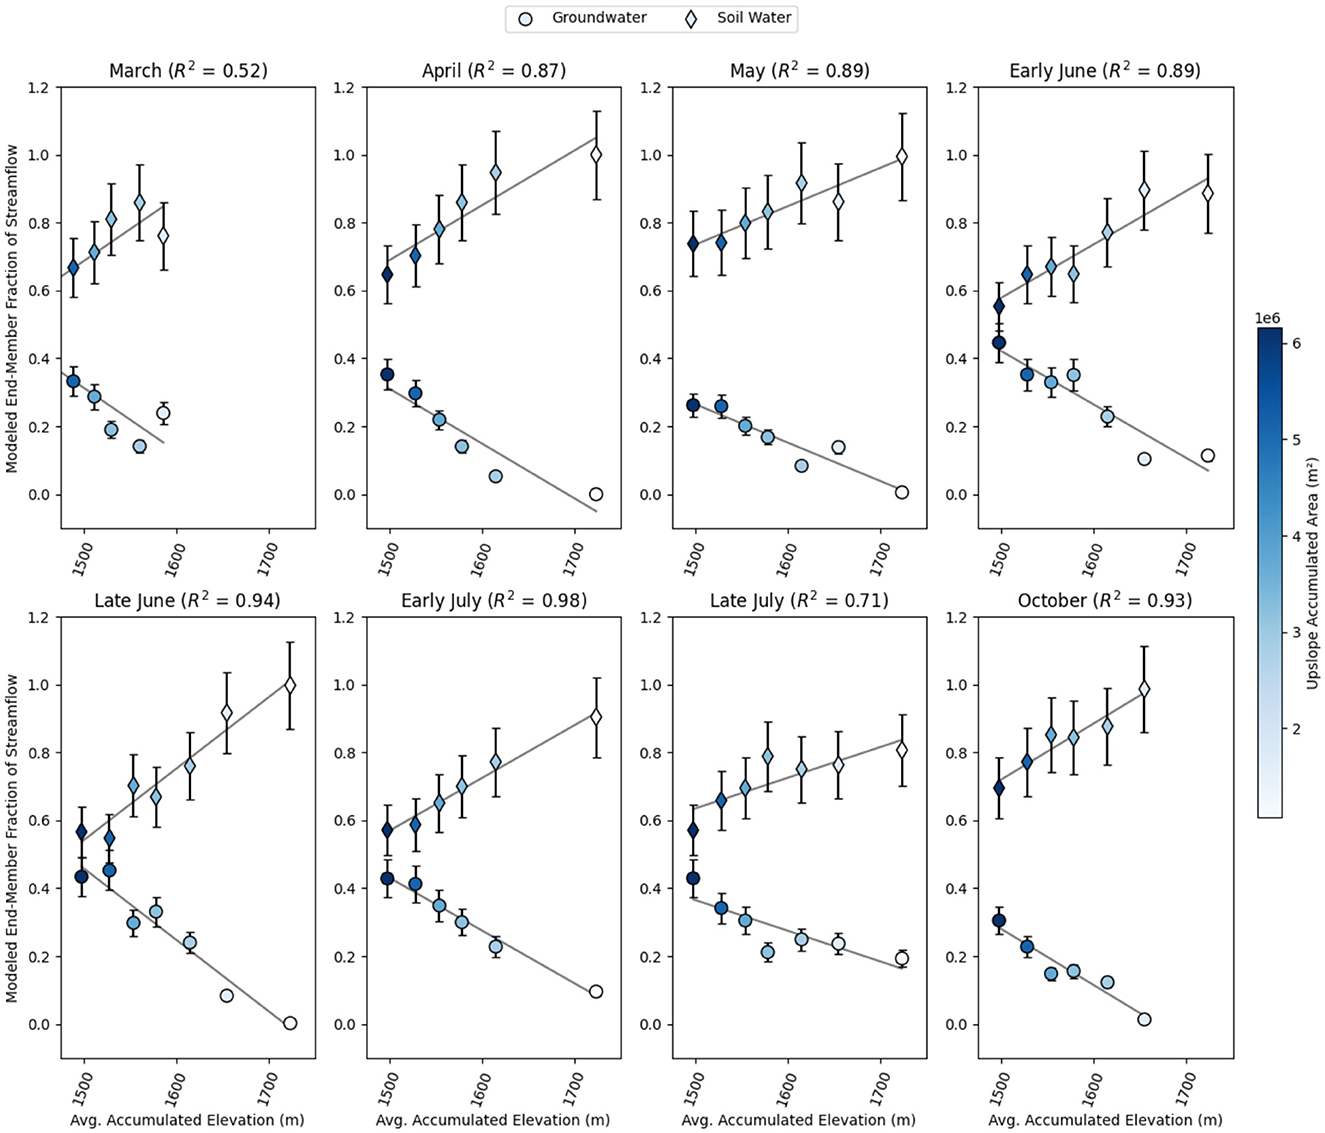
Figure 8. Regression results from a cumulative analysis of end-member discharge against elevation and UAA. Blue dots and diamonds are color-coordinated with cumulative mean UAA to show relative fractions of modeled groundwater and soil water discharge along the reach.
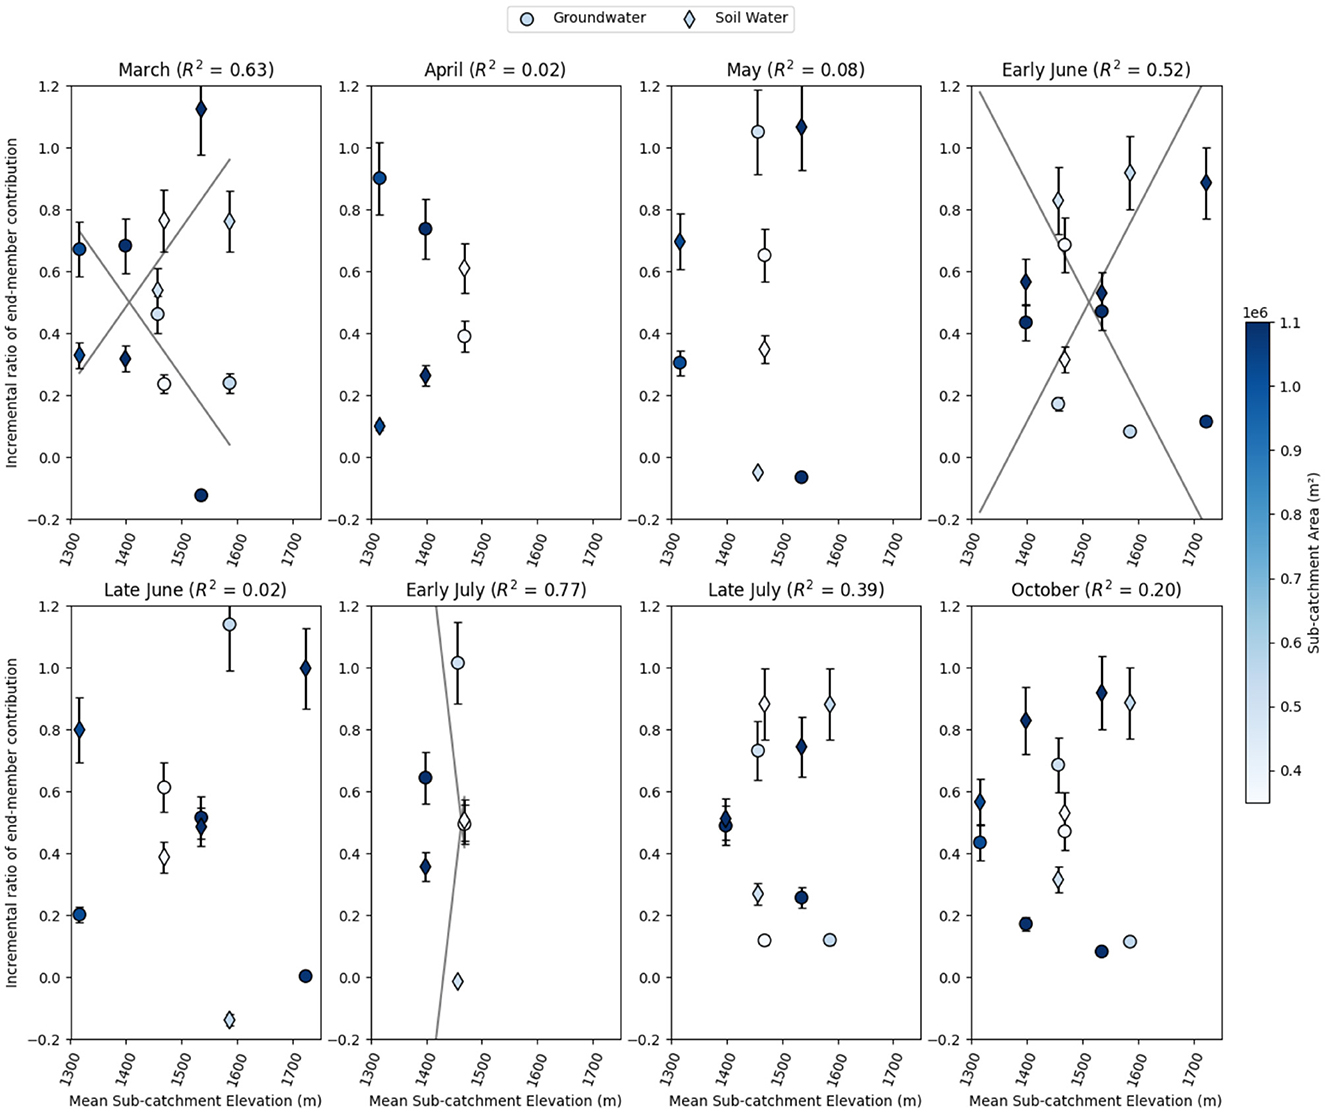
Figure 9. Regression results from the incremental analysis of end-member discharge against elevation and UAA. Blue dots and diamonds are color-coordinated with sub-catchment areas to show the relative incremental fractions of modeled groundwater and soil water discharge.
Figure 10 plots the r2 values from cumulative and incremental regression with binary soil well responses as a function of time. Soil wells with high TWI values tended to stay continually saturated, whereas those with lower TWI values exhibited more transient-like behavior in response to climatic forcing. In both cases, the r2 value was highest (0.98 and 0.81, respectively) in early July, ~3 weeks after the largest catchment “wet-up.”
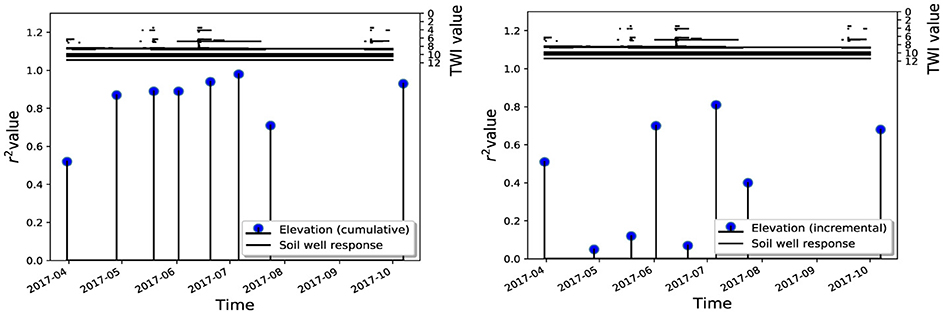
Figure 10. Blue dots show the r2 values from cumulative (Left) and incremental (Right) regression of elevation values against modeled end-member fractions through time. Black lines near the top of the plot are binary soil well responses with corresponding TWI values in which the length of the line corresponds to the amount of time a soil well was saturated.
Discussion
Radon results indicate the majority of runoff in CWC is derived from subsurface sources (soil and bedrock groundwater) throughout the year, even during the snowmelt cycle, consistent with prior observations in alpine catchments (Liu et al., 2004). These results may be expected in later parts of the season (late summer and fall) when the overland flow is expected to be zero in our catchment. However, the fact that subsurface flow dominates during snowmelt (March, April, and May) indicates that direct runoff through the snowpack is not a major source of water for our stream. Radon results are consistent with soil hydrometric data. Soil wells with low TWI values (generally located at higher elevations with less accumulated area) exhibit transient behavior to catchment wet-ups (Figure 10) (Gardner et al., 2020). Some wet-ups had durations on the order of hours to days, suggesting that soil water in these landscape positions is rapidly lost through lateral inter-flow and/or infiltration to the bedrock aquifer.
While incremental discharge source plots show that subsurface sources account for the majority of streamflow gains, there are some instances where non-subsurface sources are estimated to be more important in streamflow generation (Figure 5). Non-subsurface streamflow generation occurred throughout the year but had the strongest influence on stream chemistry during the late spring to mid-summer (May through late July). These instances occurred primarily in the middle section of the reach, where multiple convergent zones from large hillslopes converge (Figure 3). Hydrometric data from soil wells indicate that the catchment was at its most saturated state during the May and June periods (Figure 10). Thus, during May and June, we hypothesize that non-subsurface sources could be due to saturation excess and overland flow in these large contributing drainage bottoms or soil and/or preferential/piping flow in the unsaturated zone. The fact that our radon modeling indicates some non-subsurface flow during the baseflow periods (late July and October) is likely due to model error. A probable source of error is the discharge of short residence time flow paths that have low Rn.
End-member mixing analysis provided an independent test of the discharge source findings, along with the ability to further divide stream-flow composition. The results indicate that the stream is generally composed of shallow saturated soil water at the headwaters and that shallow soil water is the dominant source of streamflow generation, but bedrock groundwater discharge increases with downstream distance, even during periods of snowmelt and heavy rainfall. Our bedrock groundwater discharge fractions are generally comparable with those of other mountain aquifer studies (Somers and McKenzie, 2020). The increasing influence of bedrock groundwater with downstream distance argues for a 3D watershed conceptual model consistent with those proposed by previous researchers evaluating groundwater flow in mountainous catchments in the western U.S. (Carroll et al., 2018; Frisbee et al., 2011, 2012). However, this study demonstrates that this emergent relationship exists in headwater catchments >2 km2 in scale.
Temporal analysis indicates surprisingly low variability in modeled end-member proportions throughout the observed time period; however, early summer months have the highest proportion of bedrock groundwater discharge. Several large precipitation events (~60 mm/day) occurred in early June. These precipitation events could have rapidly filled the subsurface reservoirs, which could, in turn, drive increased discharge through a variety of mechanisms, including groundwater ridging, preferential recharge, and high fractured bedrock celerity. Rapid groundwater reactions to precipitation inputs are consistent with the experimental observations of Anderson et al. (1997a). However, our observed late-season bedrock groundwater ratios of streamflow are surprisingly low. Several previous hydrograph separation studies have assumed that baseflow is entirely composed of groundwater (Genereux et al., 1993; Pinder and Jones, 1969). Indeed, our results indicate that shallow soil groundwater is a substantial portion of streamflow during the late season. These results could be explained by several different mechanisms. For example, the substantial difference in the hydraulic diffusivity of soil and fractured bedrock can lead to situations where the fractured bedrock discharge exhibits a rapid response to infiltration, which is then followed by a long-term storage release from porous soil (Anderson et al., 1997b). Additionally, soil interflow and groundwater recharge and discharge have been shown to be tightly coupled at the scales of hillslopes (Gardner et al., 2020) and catchments (Carroll et al., 2019), and this interaction is capable of sustaining groundwater recharge and soil water throughflow throughout the year (Gardner et al., 2020).
Soil groundwater remains the dominant source of subsurface discharge over our entire reach throughout the year. However, bedrock groundwater discharge becomes an increasingly higher fraction of discharge as the amount of accumulated area increases. These observed trends of high soil groundwater discharge and increasing bedrock groundwater contribution with increased catchment scale imply that streamflow represents an integration of individual hillslope responses and larger-scale deeper groundwater flow paths (Figure 11). We attribute the increasing contribution of bedrock groundwater discharge with increasing accumulated area due to the integration of more heterogeneity and higher groundwater discharge zones (Asano et al., 2022; Frisbee et al., 2011). However, we demonstrate this relationship at a landscape scale that is orders of magnitude smaller than what has been observed in previous research. The relationship was generally consistent across variable streamflow states, with small temporal inconsistencies that are likely associated with dynamic catchment properties, such as climate and soil moisture, highlighting the importance of antecedent conditions.
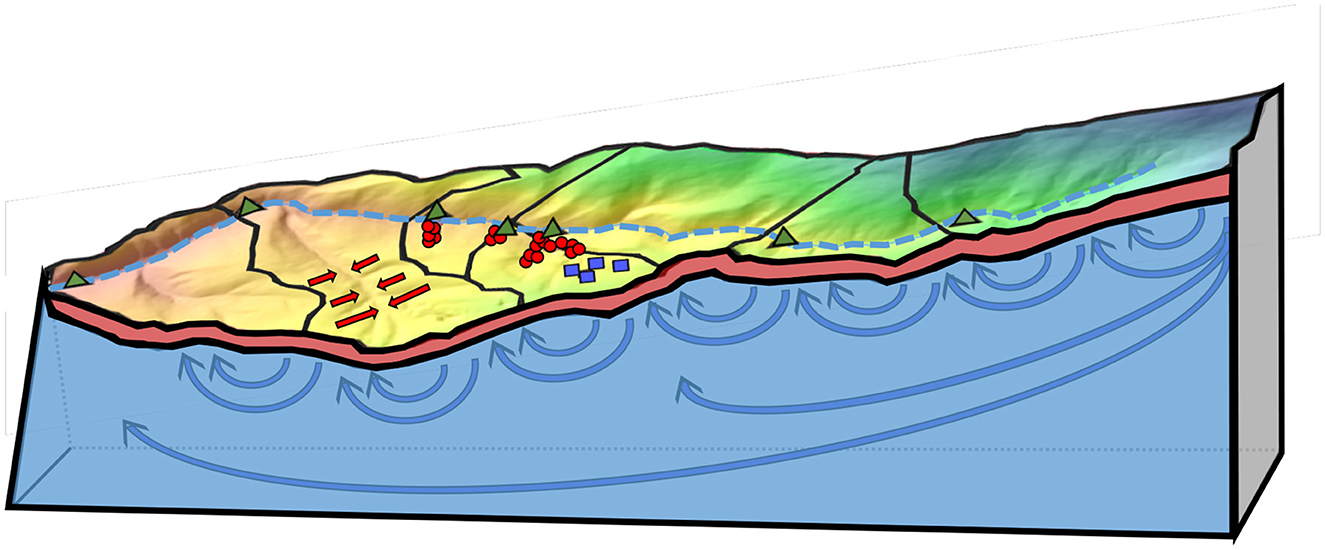
Figure 11. A 3D conceptual model of CWW showing the creek as an integration of hillslope surface and unsaturated slow (red arrows) and local (short blue arrow) regional groundwater (long blue arrow) flow paths that contribute to streamflow at lower elevations as well as individual hillslope responses. Stilling well locations are shown as triangles, groundwater wells as blue squares, and soil wells as red circles.
The lack of trend in bedrock groundwater discharge with incremental sub-watershed area suggests that a minimum scale exists below which it is difficult to observe trends in bedrock groundwater discharge with terrain metrics. This lack of trend could result from two proposed processes: (1) regional groundwater flow paths could contribute to streamflow in a non-linear fashion due to geologic heterogeneities and (2) valley-bottom exchange of water. Linear trends in modeled soil and bedrock groundwater contributions against elevation and upslope accumulated area should not necessarily be expected, as a sub-catchment high in the watershed could export its regional groundwater to locations lower in the watershed. Thus, in the case of active regional groundwater flow, low-elevation sites would receive disproportionally more groundwater than high-elevation sites, potentially explaining the observed correlations with accumulated catchment area.
Caveats and limitations
Our estimates of the bedrock groundwater discharge fraction are affected by the total flow and our error in gauging low flows. For example, on 8 June 2017, a 0.25-L/s increase in streamflow was recorded when going from stilling well “CWSTW6” (located ~2.5 km downstream from headwaters) to stilling well “CWSTW2-upper” (~3 km downstream from headwaters). Over this same reach, a 0.15-L/s increase in modeled subsurface discharge was calculated, implying that 60% of discharge gained was obtained from the subsurface while 40% was obtained from the surface or unsaturated sources. However, the observed 0.25-L/s increase is small compared to the uncertainty in discharge measurements. In addition, estimated subsurface inflows are subject to uncertainty in model parameters. Groundwater inflow estimates derived from 222Rn are sensitive to the gas transfer velocity (k), which is also one of the least constrained parameters in the radon transport model. Varying the gas transfer velocity by ±50% has a marked effect on estimated groundwater inflow: a 50% decrease in 222Rn would result in an estimated gain of 0.0 L/s, implying that 100% of streamflow comes from the surface, while a 50% increase in 222Rn would result in an estimated gain of 0.45 L/s, which was more than what was actually measured. In addition, radon modeling is limited to detecting subsurface sources that have an appreciably high concentration of 222Rn, which requires subsurface residence times of more than a couple of days, with secular equilibrium being reached only after ~2 weeks. It is possible that subsurface sources with brief residence times and thus low 222Rn concentration could go undetected.
Overall, these uncertainties could contribute to uncertainty in the exact volume and proportion of subsurface discharge sources for a given reach, particularly at low flows for any one of our data interpretations. However, if the errors are of similar magnitude for each reach, then the overall pattern across the watershed should remain. In addition, we have the added benefit of combining discharge, soil hydrometric data, and multiple stream tracers, which helps minimize the influence of error in any single data source. Given these factors, we argue that our results are suitable for characterizing the watershed's behavior and developing conceptual models of streamflow generation.
Conclusion
In this study, multiple environmental tracers were used to estimate the discharge of soil and bedrock groundwater along a 5 km reach of a snowmelt-dominated mountainous catchment at a variety of hydrologically important times. 222Rn modeling indicated that streamflow is generated predominantly from subsurface sources for all sampled periods. EMMA results indicated that streamflow chemistry could be explained by discharge from soil and bedrock groundwater. On average, bedrock groundwater comprised 38% of streamflow at the watershed outlet but fluctuated between a low of 26% in spring and a high of 44% in early summer. Bedrock groundwater discharge for individual stream segments was not well-correlated with landscape characteristics for incremental sub-watersheds draining to the segment (01 km2); however, it was well-correlated with the aggregated watershed landscape characteristics upstream of that segment (>2 km2). EMMA-derived mixing models showed that headwaters are dominantly composed of soil groundwater and that bedrock groundwater becomes an increasingly more important component to streamflow at larger catchment scales with lower elevations and higher UAA values, suggesting 3D topography-driven flow. For the accumulated watershed characteristics, correlations among landscape and end-member discharge were strong across variable states of catchment “wetness” conditions, and accumulated elevation or total upslope area were robust predictors of groundwater discharge during all seasons (r2 = 0.52–0.98). Groundwater discharge can be expected to constitute a significant source of streamflow generation in upland and montane catchments throughout the year. Bedrock groundwater flow paths follow a 3D nested flow pattern where recharge originating in upper reaches can discharge in further downstream reaches according to the heterogeneous subsurface architecture. Groundwater discharge locations are strongly controlled by local heterogeneities and cannot be well-predicted from the incremental contributing area at scales below 1 km2. As the watershed scale exceeds 2 km2, the aggregated average groundwater discharge from these 3D flow paths increases with an increase in drainage area. These findings could be useful to other researchers in developing conceptual models of streamflow generation in other watersheds.
Data availability statement
The original contributions presented in the study are included in the article/Supplementary material, further inquiries can be directed to the corresponding authors.
Author contributions
IV: Writing – original draft, Writing – review & editing. KJ: Conceptualization, Funding acquisition, Investigation, Project administration, Resources, Supervision, Writing – original draft, Writing – review & editing. ZH: Conceptualization, Investigation, Software, Writing – review & editing. RL: Conceptualization, Data curation, Formal analysis, Investigation, Methodology, Writing – review & editing. WG: Conceptualization, Data curation, Formal analysis, Funding acquisition, Investigation, Methodology, Project administration, Resources, Software, Supervision, Validation, Visualization, Writing – original draft, Writing – review & editing.
Funding
The authors declare that financial support was received for the research and/or publication of this article. This research was funded in part by DOE DE-NE0008786, DE-SC0021088, and the Montana Wyoming Water Center faculty seed grant program.
Conflict of interest
The authors declare that the research was conducted in the absence of any commercial or financial relationships that could be construed as a potential conflict of interest.
Generative AI statement
The author(s) declare that no Gen AI was used in the creation of this manuscript.
Publisher's note
All claims expressed in this article are solely those of the authors and do not necessarily represent those of their affiliated organizations, or those of the publisher, the editors and the reviewers. Any product that may be evaluated in this article, or claim that may be made by its manufacturer, is not guaranteed or endorsed by the publisher.
Supplementary material
The Supplementary Material for this article can be found online at: https://www.frontiersin.org/articles/10.3389/frwa.2025.1539177/full#supplementary-material
References
Anderson, S. P., Dietrich, W. E., Montgomery, D. R., Torres, R., Conrad, M. E., and Logue, K. (1997a). Subsurface flow paths in a steep, unchannelled catchment. Water Resour. Res. 33, 2637–2653. doi: 10.1029/97WR02595
Anderson, S. P., Dietrich, W. E., Torres, R., Montgomery, D. R., and Loague, K. (1997b). Concentration-discharge relationships in runoff from a steep, unchanneled catchment. Water Resour. Res. 33, 211–225. doi: 10.1029/96WR02715
Appels, W. M., Graham, C. B., Freer, J. E., and Mcdonnell, J. J. (2015). Factors affecting the spatial pattern of bedrock groundwater recharge at the hillslope scale. Hydrol. Process. 29, 4594–4610. doi: 10.1002/hyp.10481
Asano, Y., Suzuki, S. N., and Kawasaki, M. (2022). Peak discharges per unit area increase with catchment area in a high-relief mountains with permeable sedimentary bedrock. J. Hydrol. 610:127876. doi: 10.1016/j.jhydrol.2022.127876
Asano, Y., and Uchida, T. (2012). Flow path depth is the main controller of mean base flow transit times in a mountainous catchment. Water Resour. Res. 48:W03512. doi: 10.1029/2011WR010906
Asano, Y., Uchida, T., and Ohte, N. (2002). Residence times and flow paths of water in steep unchannelled catchments, Tanakami, Japan. J. Hydrol. 261, 173–192. doi: 10.1016/S0022-1694(02)00005-7
Beisner, K. R., Gardner, W. P., and Hunt, A. G. (2018). Geochemical characterization and modeling of regional groundwater contributing to the Verde River, Arizona between Mormon Pocket and the USGS Clarkdale gage. J. Hydrol. 564, 99–114. doi: 10.1016/j.jhydrol.2018.06.078
Bergstrom, A., Jencso, K., and McGlynn, B. (2016). Spatiotemporal processes that contribute to hydrologic exchange between hillslopes, valley bottoms, and streams. Water Resour. Res. 52, 4628–4645. doi: 10.1002/2015WR017972
Brenner, R. L. (1968). The Geology of Lubrecht Experimental Forest. Missoula, MT: The Montana Forest and Conservation Experiment Station, 71.
Carroll, R. W. H., Bearup, L. A., Brown, W., Dong, W., Bill, M., and Willlams, K. H. (2018). Factors controlling seasonal groundwater and solute flux from snow-dominated basins. Hydrol. Process. 32, 2187–2202. doi: 10.1002/hyp.13151
Carroll, R. W. H., Deems, J. S., Niswonger, R., Schumer, R., and Williams, K. H. (2019). The Importance of Interflow to Groundwater Recharge in a Snowmelt-Dominated Headwater Basin. Geophys. Res. Lett. 46, 5899–5908. doi: 10.1029/2019GL082447
Carroll, R. W. H., and Williams, K. H. (2018). Data from: Discharge data collected within the East River for the Lawrence Berkeley National Laboratory Watershed Function Science Focus Area (Water years 2015-2018). ESS-DIVE. doi: 10.21952/WTR/1495380
Condon, L. E., and Maxwell, R. M. (2019). Simulating the sensitivity of evapotranspiration and streamflow to large-scale groundwater depletion. Sci. Adv. 5:eaav4574. doi: 10.1126/sciadv.aav4574
Conrad, O., Bechtel, B., Bock, M., Dietrich, H., Fischer, E., Gerlitz, L., et al. (2015). System for automated geoscientific analyses (SAGA) v. 2.1.4. Geosci. Model Dev. 8:1991–2007. doi: 10.5194/gmd-8-1991-2015
Cook, P. G., Favreau, G., Dighton, J. C., and Tickell, S. (2003). Determining natural groundwater influx to a tropical river using radon, chloroflourocarbons and ionic environmental tracers. J. Hydrol. 277, 74–88. doi: 10.1016/S0022-1694(03)00087-8
Fan, Y., Li, H., and Miguez-Macho, G. (2013). Global patterns of groundwater depth. Science 339, 940–943. doi: 10.1126/science.1229881
Flint, A. L., Flint, L. E., and Dettinger, M. D. (2008). Modeling Soil moisture processes and recharge under a melting snowpack. Vadose Zone J. 7, 350–357. doi: 10.2136/vzj2006.0135
Frisbee, M. D., Phillips, F. M., Campbell, A. R., Liu, F., and Sanchez, S. A. (2011). Streamflow generation in a large, alpine watershed in the southern {Rocky Mountains of Colorado: Is} streamflow generation simply the aggregation of hillslope runoff responses? Water Resour. Res. 47:W06512. doi: 10.1029/2010WR009391
Frisbee, M. D., Phillips, F. M., Weissmann, G. S., Brooks, P. D., Wilson, J. L., Campbell, A. R., et al. (2012). Unraveling the mysteries of the large watershed black box: implications for the streamflow response to climate and landscape perturbations. Geophys. Res. Lett. 39:L01404. doi: 10.1029/2011GL050416
Gabrielli, C. P., McDonnell, J. J., and Jarvis, W. T. (2012). The role of bedrock groundwater in rainfall-runoff response at hillslope and catchment scales. J. Hydrol. 450–451, 117–133. doi: 10.1016/j.jhydrol.2012.05.023
Gardner, W. P., Harrington, G. A., Solomon, D. K., and Cook, P. G. (2011). Using terrigenic 4He to identify and quantify regional groundwater discharge to streams. Water Resour. Res. 47, 1–13. doi: 10.1029/2010WR010276
Gardner, W. P., Jensco, K., Hoylman, Z., Livesay, R., and Maneta, M. (2020). A numerical investigation of bedrock groundwater recharge and exfiltration on soil mantled hillslopes. Hydrol. Process. 34, 3311–3330. doi: 10.1002/hyp.13799
Gardner, W. P., Susong, D. D., Solomon, D. K., and Heasler, H. P. (2010). Snowmelt hydrograph interpretation: revealing watershed scale hydrologic characteristics of the Yellowstone volcanic plateau. J. Hydrol. 383, 209–222. doi: 10.1016/j.jhydrol.2009.12.037
Genereux, D. P., Hemond, H. F., and Mulholland, P. J. (1993). Use of radon-222 and calcium as tracers in a three-end-member mixing model for streamflow generation on the West Fork of Walker Branch Watershed. J. Hydrol. 142, 167–211. doi: 10.1016/0022-1694(93)90010-7
Gleeson, T., and Manning, A. H. (2008). Regional groundwater flow in mountainous terrain: three-dimensional simulations of topographic and hydrogeologic controls. Water Resour. Res. 44:W10403. doi: 10.1029/2008WR006848
Goble, D. (2018). Estimating Groundwater Inflow and Age Characteristics in an Alluvial Aquifer Along the Little Wind River, Wyoming (Masters). University of Montana. Available online at: https://scholarworks.umt.edu/etd/11263
Gooseff, M. N., and McGlynn, B. L. (2005). A stream tracer technique employing ionic tracers and specific conductance data applied to the Maimai catchment, New Zealand. Hydrol. Process. 19, 2491–2506. doi: 10.1002/hyp.5685
Hale, V. C., McDonnell Jeffrey, J., Stewart, M. K., Solomon, D. K., Doolitte, J., Ice, G. G., et al. (2016). Effect of bedrock permeability on stream base flow mean transit time scaling relationships: 2. Process study of storage and release. Water Resour. Res. 52, 1375–1397. doi: 10.1002/2015WR017660
Hale, V. C., and McDonnell, J. J. (2016). Effect of bedrock permeability on stream base flow mean transit time scaling relations: 1. A multiscale catchment intercomparison. Water Resour. Res. 52, 1358–1374. doi: 10.1002/2014WR016124
Harrington, G. A., Gardner, W. P., and Munday, T. J. (2013). Tracking groundwater discharge to a large river using tracers and geophysics. Groundwater 52, 837–852. doi: 10.1111/gwat.12124
Holden, Z. A., Abatzoglou, J. T., Luce, C. H., and Baggett, L. S. (2011a). Empirical downscaling of daily minimum air temperature at very fine resolutions in complex terrain. Agric. For. Meteorol. 151, 1066–1073. doi: 10.1016/j.agrformet.2011.03.011
Holden, Z. A., Crimmins, M. A., Cushman, S. A., and Littell, J. S. (2011b). Empirical modeling of spatial and temporal variation in warm season nocturnal air temperatures in two North Idaho mountain ranges, USA. Agric. For. Meteorol. 151, 261–269. doi: 10.1016/j.agrformet.2010.10.006
Hooper, R. P. (2003). Diagnostic tools for mixing models of stream water chemistry. Water Resour. Res. 39. doi: 10.1029/2002WR001528
Hoylman, Z. H., Jencso, K. G., Hu, J., Holden, Z. A., Martin, J. T., and Gardner, W. P. (2019). The climatic water balance and topography control spatial patterns of atmospheric demand, soil moisture and shallow subsurface flow. Water Resour. Res. 55, 2370–2389. doi: 10.1029/2018WR023302
Hoylman, Z. H., Jencso, K. G., Hu, J., Martin, J. T., Holden, Z. A., Seielstad, C. A., et al. (2018). Hillslope topography mediates spatial patterns of ecosystem sensitivity to climate. J. Geophys. Res. Biogeosci. 123, 353–371. doi: 10.1002/2017JG004108
Jencso, K. G., McGlynn, B. L., Gooseff, M. N., Bencala, K. E., and Wondzell, S. M. (2010). Hillslope hydrologic connectivity controls riparian groundwater turnover: implications of catchment structure for riparian buffering and stream water sources. Water Resour. Res. 46:W10524. doi: 10.1029/2009WR008818
Katsuyama, M., Ohte, N., and Kabeya, N. (2005). Effects of bedrock permeability on hillslope and riparian groundwater dynamics in a weathered granite catchment. Water Resour. Res. 41, 1–11. doi: 10.1029/2004WR003275
Liu, F., Williams, M. W., and Caine, N. (2004). Source waters and flow paths in an alpine catchment, Colorado Front Range, United States. Water Resour. Res. 40:W09401. doi: 10.1029/2004WR003076
Lonn, J. D., McDonald, C., Sears, J. W., and Smith, L. N. (2010). Geologic Map of the Missoula East 30′ x 60′ Quadrangle, Western Montana. Montana Bureau of Mines and Geology Open-File Report 593.
Meixner, T., Manning, A. H., Stonestrom, D. A., Allen, D. M., Ajami, H., Blasch, K. W., et al. (2016). Implications of projected climate change for groundwater recharge in the western United States. J. Hydrol. 534, 124–138. doi: 10.1016/j.jhydrol.2015.12.027
Pfister, L., Martínez-Carreras, N., Hissler, C., Klaus, J., Carrer, G. E., Stewart, M. K., et al. (2017). Bedrock geology controls on catchment storage, mixing, and release: a comparative analysis of 16 nested catchments. Hydrol. Process. 31, 1828–1845. doi: 10.1002/hyp.11134
Pinder, G. F., and Jones, J. F. (1969). Determination of the ground-water component of peak discharge from the chemistry of total runoff. Water Resour. Res. 5, 438–445. doi: 10.1029/WR005i002p00438
Portner, R. A., Hendrix, M. S., Stalker, J. C., Miggins, D. P., and Sheriff, S. D. (2011). Sedimentary response to orogenic exhumation in the northern rocky mountain basin and range province, flint creek basin, west-central Montana. Can. J. Earth Sci. 48, 1131–1153. doi: 10.1139/e10-107
Raymond, P. A., Zappa, C. J., Butman, D., Bott, T. L., Potter, J., Mulholland, P., et al. (2012). Scaling the gas transfer velocity and hydraulic geometry in streams and small rivers. Limnol. Oceanogr. Fluids Environ. 2, 41–53. doi: 10.1215/21573689-1597669
Salve, R., Rempe, D. M., and Dietrich, W. E. (2012). Rain, rock moisture dynamics, and the rapid response of perched groundwater in weathered, fractured argillite underlying a steep hillslope. Water Resour. Res. 48, 1–25. doi: 10.1029/2012WR012583
Smerdon, B. D., and Gardner, W. P. (2021). Characterizing groundwater flow paths in an undeveloped region through synoptic river sampling for environmental tracers. Hydrol. Process. 36:e14464. doi: 10.1002/hyp.14464
Smerdon, B. D., Gardner, W. P., Harrington, G. A., and Tickell, S. J. (2012). Identifying the contribution of regional groundwater to the baseflow of a tropical river (Daly River, Australia). J. Hydrol. 464–465, 107–115. doi: 10.1016/j.jhydrol.2012.06.058
Soil Survey Staff Natural Resources Conservation Service, United States Department of Agriculture. (n.d.). Soil Survey Geographic (SSURGO) Database for West-Central Montana. Available online. (Accessed August 1, 2017).
Somers, L. D., and McKenzie, J. M. (2020). A review of groundwater in high mountain environments. Wires Water. 7:e1475. doi: 10.1002/wat2.1475
Spencer, S. A., Anderson, A. E., Silins, U., and Collins, A. L. (2021). Hillslope and groundwater contributions to streamflow in a Rocky Mountain watershed underlain by glacial till and fractured sedimentary bedrock. Hydrol. Earth Syst. Sci. 25, 237–255. doi: 10.5194/hess-25-237-2021
Torres, R., Dietrich, W. E., Montgomery, D. R., Anderson, S. P., and Loague, K. (1998). Unsaturated zone processes and the hydrologic response of a steep, unchanneled catchment. Water Resour. Res. 34, 1865–1879. doi: 10.1029/98WR01140
Tromp-van Meerveld, H. J., Peters, N. E., and McDonnell, J. J. (2007). Effect of bedrock permeability on subsurface stormflow and the water balance of a trenched hillslope at the Panola Mountain Research Watershed, Georgia, USA. Hydrol. Process. 21, 750–769. doi: 10.1002/hyp.6265
Uchida, T., Asano, Y., Ohte, N., and Mizuyama, T. (2003). Seepage area and rate of bedrock groundwater discharge at a granitic unchanneled hillslope. Water Resour. Res. 39, 1–12. doi: 10.1029/2002WR001298
Uchida, T., Kosugi, K., and Mizuyama, T. (2002). Effects of pipe flow and bedrock groundwater on runoff generation in a steep headwater catchment in Ashiu, central Japan. Water Resour. Res. 38, 1–14. doi: 10.1029/2001WR000261
Uchida, T., McDonnell, J. J., and Asano, Y. (2006). Functional intercomparison of hillslopes and small catchments by examining water source, flowpath and mean residence time. J. Hydrol. 327, 627–642. doi: 10.1016/j.jhydrol.2006.02.037
Keywords: groundwater—surface water interactions, streamflow generation, mountain hydrology, environmental tracers, mountain aquifer
Citation: von Trapp I, Jencso KG, Hoylman ZH, Livesay R and Gardner WP (2025) On the emergent scale of bedrock groundwater contribution to headwater mountain streams. Front. Water 7:1539177. doi: 10.3389/frwa.2025.1539177
Received: 03 December 2024; Accepted: 09 June 2025;
Published: 15 July 2025.
Edited by:
Matteo Camporese, University of Padua, ItalyReviewed by:
Ilja H. J. van Meerveld, University of Zurich, SwitzerlandLuisa Hopp, University of Bayreuth, Germany
Copyright © 2025 von Trapp, Jencso, Hoylman, Livesay and Gardner. This is an open-access article distributed under the terms of the Creative Commons Attribution License (CC BY). The use, distribution or reproduction in other forums is permitted, provided the original author(s) and the copyright owner(s) are credited and that the original publication in this journal is cited, in accordance with accepted academic practice. No use, distribution or reproduction is permitted which does not comply with these terms.
*Correspondence: W. Payton Gardner, cGF5dG9uLmdhcmRuZXJAdW1vbnRhbmEuZWR1