 Katsutoshi Mizuta1,2*
 Sabine Grunwald1
 Michelle A. Phillips3Allan R. Bacon1Wendell P. Cropper Jr.4Charles B. Moss5
- 1Soil and Water Sciences Department, University of Florida, Gainesville, FL, United States
- 2Department of Soil, Water and Climate, University of Minnesota, Saint Paul, MN, United States
- 3Economics Department, University of Florida, Gainesville, FL, United States
- 4School of Forest, Fisheries, and Geomatics Sciences, University of Florida, Gainesville, FL, United States
- 5Food and Resource Economics Department, University of Florida, Gainesville, FL, United States
Soil Indices and Econometric Techniques
Inter- and transdisciplinary approaches that catapult soil science to the next level in pedometrics are urgently needed to address critical topics in soil health and security. Specifically, the fusion of pedometrics and econometrics is poised to move quantitative soil assessments focused on properties and predictions toward integrative pedo-econometric decision-making instruments. Novel pedo-econometric approaches bear profound potential to revolutionize pedometrics and will facilitate “smart” and strategic soil management. Pedo-econometric approaches view the optimization of soil health to sustain soil quality as salient through simultaneous modeling of input-output interactions between soil and environmental factors. In addition, pedo-econometrics fuses economic-oriented strategies into the soil modeling process that allows land managers, regulators, and decision-makers to guide soil management considering potential efforts (costs and labor) to sustain or improve soil functionality. We present the nuts-and-bolts of pedo-econometrics and a demonstration to assess site-specific efficiency soil carbon scores as well as regional maximum and attainable soil carbon.
Soil scientists conventionally have used metric systems, such as soil quality indices, to assess soil health functions addressed by soil concepts (e.g., soil quality, soil health, and soil security). As a state-of-the art approach, soil quality indices are generally constructed using multivariate statistics, such as principal component analysis (1, 2). Although these multivariate quantitative approaches are suited for predictive modeling of soil variables they lack to meet axiomatic criteria of index theory (3). Furthermore, Karr and Chu (4) argued that multivariate analyses can be used for the identification of data patterns or structures but not impact assessment. Mizuta et al. (3) argued that soil health index systems based on capabilities or efficiencies, rather than multivariate predictions or the variance of environmental properties, allow to express soil health. The same applies to quantitative modeling of soil quality, security, risk, functionality…etc.
Performance assessments of targeted functions, using econometric techniques are a rapidly growing interdisciplinary field of research (5). Previous studies have produced quantitative methods, such as the data envelopment analysis (DEA), to evaluate capability or efficiency of functions, such as ecological efficiency (6), crop production performance efficiency (7), ecosystem services output efficiency (8). The DEA is used in many different application areas, including engineering, development studies, education, finance, health care studies, natural resource management, public economics, and sports studies (9). Yet, the DEA has been only sparsely used in soil science.
The DEA, a non-parametric technique, considers aspects of outputs and the relevant inputs; the former is the targeted function to maximize or minimize, and the latter are managerial factors that contribute to produce the function (10). The potential reduction of inputs to achieve the same levels of outputs, or the optimization of outputs based on the same sets and levels of inputs, are examples of the quantitative evaluations that this approach can provide (11, 12). The produced scores are used to evaluate the efficiency of functions for decision-making-units (DMUs). DMUs may include soil pedons, forests, agricultural fields under different managements, and other (3, 13).
A Practical Example—How to Assess a Soil Function Using Econometrics
Here, an integrated pedo-econometric approach is demonstrated using an econometric technique, the DEA, to compute the efficiency scores of a specific soil health function—soil organic carbon (SOC) stocks. Our approach of pairing inputs and outputs is grounded in the empirical, longitudinal analysis of non-linear, site-specific effects, and data-driven algorithms. Suppose that the DEA user decides to assess the efficiency of the SOC stock function in Florida U.S., which would be considered as output (y-axis in Figure 1A). Plant available water capacity (AWC) and/or Normalized Difference Vegetation Index (NDVI) were considered as inputs (x-axis). AWC has been shown to regulate the respiration and accumulation of SOC in soils (17, 18), while NDVI is a proxy for the abundance of healthy green vegetation that is a source of carbon input via residues into the soil. These empirical input and output variables drive the frontier (line) that produces a reference system, called in econometrics the frontier or technology line (10). The DMU on the frontier gives the score of one and indicates the maximum efficiency of output operation with a given set of inputs. The further the DMU locates away from the frontier, the closer the score is to zero, and the more inefficient a given site in terms of SOC stocks. In our example DEA-SOC application the option “output orientation” was used undergirding the goal to maximize output levels (in this case SOC stocks) (Figure 1A) (19). This setting identifies soils with higher output levels based on the same or less quantities of given inputs. The relationships between the input and output variables may form various shapes of a frontier and consequently produce different scores. Figures 1B,C vs. Figures 1D,E demonstrate two commonly used Return-to-Scale functions to produce the frontier line: free disposable hull (FDH) and variable returns-to-scale (VRS). See the detail descriptions of the RTS terminology in Bogetoft and Otto (16).
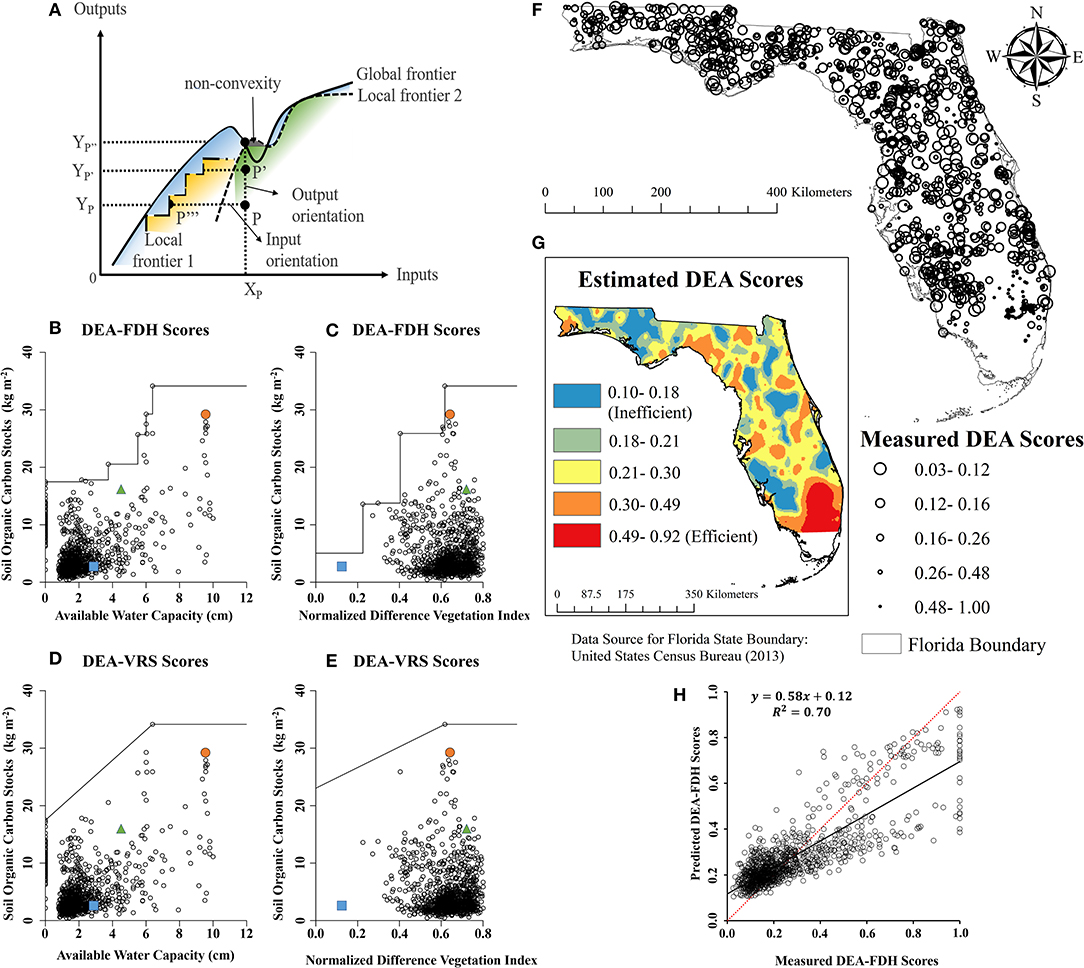
Figure 1. (A) The conceptual framework of global and local frontiers. X shows input variable, and Y shows output variable. P is the sample point, and P', P”, and P”' show the maximum efficient points on local frontier and/or global frontier. The area shaded in gray represents the unexpected samples with local scores lower than global scores potentially due to non-convexity of frontiers. Other shaded colors represent the sphere of enveloped areas by the frontiers; (B–H) Demonstration of the data envelopment analysis (DEA) based on 1,014 samples (0–20 cm soil) collected across Florida and a state-wide database that contained soil organic carbon stocks (SOC kg m−2). Details of soil sampling, soil analytics, the soil database, and environmental data (i.e., annual mean plant available water capacity, AWC cm in 0–25 cm, and the annual mean Normalized Difference Vegetation Index (NDVI) derived from Landsat ETM images) can be found in Xiong et al. (14, 15). (B–E) The different frontiers driven by one input (either AWC or NDVI) and one output (i.e., SOC) using a free-disposable hull (FDH) or variable returns-to-scale (VRS) return-to-scale option. This demonstration was conducted using R Benchmarking package (16). The closer the points are to the frontier line, the higher the scores are. The points located on the frontier equate the value of one which indicates the maximum efficiency of the soil function (i.e., output variable) based on a given level of input(s). The orange circle, green triangle, and blue square indicate soil samples with high, medium, and low SOC stocks levels, respectively; (F) The map of DEA scores produced by incorporating both AWC and NDVI together as inputs and SOC as output. The scores were calculated by the FDH frontier. The more efficient soils are, the smaller the open circles are; (G) The interpolation map of the DEA-FDH scores were based on two inputs (AWC and NDVI) and one output (SOC) using the ordinary kriging method; (H) The measured and predicted score comparison based on cross-validation. Note, that the presented simple DEA was intended to introduce the pedo-econometrics paradigm to readers showcasing the principles. More complex DEAs could be developed using a broad array of inputs and outputs, strategic variable selection methods (e.g., supervised and deep learning algorithms), and sophisticated interpolation methods (e.g., regression kriging, machine learning, and other artificial intelligence algorithms) which are beyond the scope of this brief paper.
When either of input, AWC or NDVI, was used in the DEA, our example showed that the efficiency scores of soil with high SOC (orange circle) was equal to 0.85 regardless of assumption or input variables. This indicates that the output level can be further maximized by 15% (SOC stocks up to 34.1 kg m−2) with given input quantities. A high SOC status does not always lead to high efficiency because the DEA considers both output and input variables simultaneously. For example, the DEA-FDH score calculated with NDVI as input for soil with low SOC (blue square) was 0.56, which was 19% greater than the one for soil with medium SOC (green triangle). The site-specific efficiency scores facilitate to assess the potential gains in SOC to meet attainable SOC stocks (i.e., efficiency score of 1). SOC stock gains could be achieved through management (e.g., fertilization, irrigation, amendments) or land use conversions. The “smart” strategic approach of the DEA allows to simultaneously consider site-specific soil-environmental conditions (e.g., soils, vegetation, climate, topography) as well as management and use options to focus on improvement of those inefficient sites that have potential to sequester most carbon (i.e., sites that depart furthest from the frontier line) and provide the most return (SOC stocks) for investment (cost and labor for a management intervention).
The DEA can incorporate multiple inputs and/or outputs to calculate the efficiency scores, which we implemented to compute DEA-FDH scores with both AWC and NDVI as inputs at 1,075 sites across Florida (Figure 1F). No obvious spatial trend was observed, however, the high prediction accuracy using an ordinary kriging method (R2= 0.70) (Figures 1G,H) indicates the great potential of integrating DEA scores into digital soil mapping techniques to help decision-makers identify the site-specific location with needs of improvements for local management. The DEA approach allows researchers and stakeholders to identify attainable rates of optimized functions using a data-driven frontier without control sites. Incorporation of new empirical data for inputs and/or outputs may quantify other soil functions. The usefulness of the DEA approach for environmental assessments has been described in the literature (20), though this method has rarely been applied yet for soil functions other than agricultural production except a few studies according to our knowledge [e.g., (21–23)].
Research Opportunities in Pedo-Econometrics
Key questions that need to be answered for DEA applications are (1) what drives a standard frontier? and (2) how to construct a frontier function? The main factors that can determine the reference include (1) selection of inputs and/or outputs by discerning relatively stable, dynamic, and/or managerial variables; (2) orientation direction of the DEA; and (3) DEA assumptions (i.e., returns-to-scales).
The proper choice of each factor drives the reference. In the case of carbon credits, Zhai et al. (24) calculated the ecological efficiency of the energy supply chain under carbon credit transactions using multiple inputs (fuel consumption and financial investment) and multiple outputs (fiscal revenue/profit and carbon emission). Liu and Liu (25) used three inputs (energy consumption, capital stock, and labor force) and one output (gross domestic product) to calculate low carbon economy efficiency scores. Other combinations of input(s) and output(s) related to carbon efficiency can be found in the literature review provided by Zhang et al. (26). The data-driven evaluation can identify areas that optimize outputs with a given set of inputs, and thereby, offers profound potential for agricultural, forest, conservation, and land management in general.
Establishing local or global/meta-frontier systems would also be an important research topic (see Figure 1A). Such systems are constructed in form of a multiple-layered structure in which the global frontier envelops local frontiers (27). The metafrontier approach discerns inefficient sites that need management improvements from efficient sites and facilitates to assess the suitability of a targeted function under given environmental conditions. There are two kinds of efficiency metrics produced in this approach. One metric type measures different efficiency levels for each DMU to provide performance assessments of soil functions for the users. The other metric type may derive interpretations from external factors that govern overall performance of soil functions, which are often hardly manageable. For example, climatic factors such as precipitation and temperature may influence some soil functions directly and indirectly (e.g., biodiversity protection function, energy production functions for ecosystems). Relatively stable environmental factors, such as topography, ecological factors, and parent material can be used to classify different soils and then the DEA can be implemented for each class separately to construct a metafrontier framework. Grunwald et al. (28) discerned soil-environmental factors along the stability-dynamic spectrum in an ecosystem that regulate a given target variable (e.g., efficiency of SOC stocks). Such soil-environmental factorial approach combined with the DEA analysis provides profound opportunities to transform state-of-the-art pedometric applications that are focused on digital soil mapping asking “what soil is there?” toward smart pedo-econometric applications asking “how efficient is a site to attain a soil function?” The former traditional pedometrics approach is descriptive while the interdisciplinary pedo-econometric approach focuses on optimization considering simultaneously site-specific soil-environmental inputs and one or multiple soil outputs.
The potential of the metafrontier DEA framework is to address the ambiguities of soil health, soil quality, and soil security assessments bound to mapping of soil properties. The emergence of the pedo-econometrics approach facilitates to move traditional assessments of soil measurements that lack economic considerations, such as non-convexity, into interdisciplinary realms considering explicitly soil-environments and economics (29). Soil functionality within an economic framework can be quantified through DEA efficiency scoring and the meta-frontier or local frontier approaches. The advantages of the metafrontier approach can reveal not only suitability of various soil health functions concomitantly that have not been quantified but also the efficiencies of the function performance that may be improved by local management.
The quantitative metrics of soil functions can visualize the inconspicuous contribution of soil to environmental and economic systems (30). The more capabilities of soil functions that can be quantified by this pedo-econometric approach, the clearer the value of each function may become, and the more accurate soil function evaluation in economic models would be (31). The new paradigm using this approach would reveal the relationship between output functions of soil and inputs and catalyze prioritization of soil functions over more traditional soil assessments. Measuring the features of soil concepts and soil functioning is essential for sustainable food production and environmental conservation. Thus, the modern paradigm contributes to our understanding of the potential efficiency of soils to sequester carbon, which is an important and understudied element about which knowledge is needed to adapt to global climate change. The DEA and similar econometric methods are envisioned to assess not only carbon related soil function but also other complex functions of soil (e.g., biodiversity function using the Shannon index and soil carbon stocks for input/output) under varying conditions.
Author Contributions
KM, SG, MP, AB, WC, and CM: conceptualization. KM and SG: funding acquisition and writing—original draft. KM, SG, MP, and CM: methodology. SG: supervision. SG, AB, and WC: writing—review and editing. All authors: contributed to the article and approved the submitted version.
Funding
This study was funded by USDA-CSREES-NRI grant award 2007-35107-18368 Rapid Assessment and Trajectory Modeling of Changes in Soil Carbon across a Southeastern Landscape (National Institute of Food and Agriculture – Agriculture and Food Research Initiative). This project is a Core Project of the North American Carbon Program KM receives general support for research from the Japan Student Services Organization, the University of Florida Soil and Water Sciences Department, Dr. Yuxin Miao, and Dr. Ajay Sharma.
Conflict of Interest
The authors declare that the research was conducted in the absence of any commercial or financial relationships that could be construed as a potential conflict of interest.
References
1. Andrews SS, Karlen DL, and Mitchell JP. A comparison of soil quality indexing methods for vegetable production systems in Northern California. Agric Ecosyst Environ. (2002) 90:25–45. doi: 10.1016/S0167-8809(01)00174-8
2. Whittaker G, Barnhart B, Färe R, Grosskopf S, and Grosskopf S. Application of index number theory to the construction of a water quality index: aggregated nutrient loadings related to the areal extent of hypoxia in the northern Gulf of Mexico. Ecol Indic. (2015) 49:162–8. doi: 10.1016/j.ecolind.2014.10.003
3. Mizuta K, Grunwald S, and Phillips MA. New soil index development and integration with econometric theory. Soil Sci Soc Am J. (2018) 82:1017–32. doi: 10.2136/sssaj2017.11.0378
4. Karr JR, and Chu EW. Biological Monitoring and Assessment: Using Multimetric Indexes Effectively. Seattle, WA: University of Washington (1997). Available online at: http://nepis.epa.gov/Exe/ZyPDF.cgi/P1002I4N.PDF?Dockey=P1002I4N.PDF (accessed June 24, 2015).
5. Cook WD, and Seiford LM. Data envelopment analysis (DEA) – Thirty years on. Eur J Oper Res. (2009) 192:1–17. doi: 10.1016/j.ejor.2008.01.032
6. Dyckhoff H, and Allen K. Measuring ecological efficiency with data envelopment analysis (DEA). Eur J Oper Res. (2001) 132:312–25. doi: 10.1016/S0377-2217(00)00154-5
7. Atici KB, and Podinovski VV. Using data envelopment analysis for the assessment of technical efficiency of units with different specialisations: an application to agriculture. Omega. (2015) 54:72–83. doi: 10.1016/j.omega.2015.01.015
8. Susaeta A, Adams DC, Carter DR, and Dwivedi P. Climate change and ecosystem services output efficiency in southern loblolly pine forests. Environ Manage. (2016) 58:417–30. doi: 10.1007/s00267-016-0717-z
9. Emrouznejad A, and Yang G. A survey and analysis of the first 40 years of scholarly literature in DEA: 1978–2016. Socioecon Plann Sci. (2017) 61:4–8. doi: 10.1016/j.seps.2017.01.008
10. Cook WD, Tone K, and Zhu J. Data envelopment analysis: prior to choosing a model. Omega. (2014) 44:1–4. doi: 10.1016/j.omega.2013.09.004
11. Cooper WW, Seiford LM, and Tone K. Data Envelopment Analysis: A Comprehensive Text With Models, Applications, References and DEA-Solver Software. 2nd ed. New York, NY: Springer Science & Business Media (2007).
12. Ji Y, and Lee C. Data envelopment analysis. Stata J. (2010) 10:267–80. doi: 10.1177/1536867X1001000207
13. Jaenicke EC, and Lengnick LL. A soil-quality index and its relationship to efficiency and productivity growth measures: two decompositions. Am J Agric Econ. (1999) 81:881–93. doi: 10.2307/1244331
14. Xiong X, Grunwald S, Myers DB, Kim J, Harris WG, and Comerford NB. Holistic environmental soil-landscape modeling of soil organic carbon. Environ Model Softw. (2014) 57:202–15. doi: 10.1016/j.envsoft.2014.03.004
15. Xiong X, Grunwald S, Myers DB, Ross CW, Harris WG, and Comerford NB. Interaction effects of climate and land use/land cover change on soil organic carbon sequestration. Sci Total Environ. (2014) 493:974–82. doi: 10.1016/j.scitotenv.2014.06.088
16. Bogetoft P, and Otto L. Introduction to benchmarking. In: Benchmarking With DEA. SFA, and R International Series in Operations Research & Management Science. New York, NY: Springer (2011). p. 1–22. doi: 10.1007/978-1-4419-7961-2_1
17. Hati KM, Swarup A, Dwivedi AK, Misra AK, and Bandyopadhyay KK. Changes in soil physical properties and organic carbon status at the topsoil horizon of a vertisol of central India after 28 years of continuous cropping, fertilization and manuring. Agric Ecosyst Environ. (2007) 119:127–34. doi: 10.1016/j.agee.2006.06.017
18. Huntington T. Available water capacity and soil organic matter. In: Lal R, editor. Encyclopedia of Soil Science. New York, NY: Taylor and Francis (2007). p. 139–43.
19. Toma P, Miglietta PP, Zurlini G, Valente D, and Petrosillo I. A non-parametric bootstrap-data envelopment analysis approach for environmental policy planning and management of agricultural efficiency in EU countries. Ecol Indic. (2017) 83:132–43. doi: 10.1016/j.ecolind.2017.07.049
20. Charnes A, Cooper WW, and Rhodes E. Measuring the efficiency of decision making units. Eur J Oper Res. (1978) 2:429–44. doi: 10.1016/0377-2217(78)90138-8
21. Pieralli S. Introducing a new non-monotonic economic measure of soil quality. Soil Tillage Res. (2017) 169:92–8. doi: 10.1016/j.still.2017.01.015
22. Mizuta K, Grunwald S, Phillips MA, Cropper WP Jr, Lee WS, and Vasques GM. New indication method using Pedo-Econometric approach. Data Envel Anal J. (2019) 4:207–41. doi: 10.1561/103.00000028
23. Susaeta A, Sancewich B, Adams D, and Moreno PC. Ecosystem services production efficiency of longleaf pine under changing weather conditions. Ecol Econ. (2019) 156:24–34. doi: 10.1016/j.ecolecon.2018.09.007
24. Zhai D, Shang J, Yang F, and Ang S. Measuring energy supply chains' efficiency with emission trading: a two-stage frontier-shift data envelopment analysis. J Clean Prod. (2019) 210:1462–74. doi: 10.1016/j.jclepro.2018.10.355
25. Liu X, Liu J. Measurement of low carbon economy efficiency with a three-stage data envelopment analysis: a comparison of the largest twenty CO2 emitting countries. Int J Environ Res Public Health. (2016) 13:1116. doi: 10.3390/ijerph13111116
26. Zhang Y-J, Jiang L, and Shi W. Exploring the growth-adjusted energy-emission efficiency of transportation industry in China. Energy Econ. (2020) 90:104873. doi: 10.1016/j.eneco.2020.104873
27. O'Donnell CJ, Rao DSP, and Battese GE. Metafrontier frameworks for the study of firm-level efficiencies and technology ratios. Empir Econ. (2008) 34:231–55. doi: 10.1007/s00181-007-0119-4
28. Grunwald S, Thompson JA, and Boettinger JL. Digital soil mapping and modeling at continental scales: finding solutions for global issues. Soil Sci Soc Am J. (2011) 75:1201. doi: 10.2136/sssaj2011.0025
29. Briec W, Kerstens K, and Van De Woestyne I. Nonconvexity in production production cost functions: an exploratory selective review. In: Ray SC, Chambers R, Kumbhakar S, editors. Handbook of Production Economics. Singapore: Springer (2020). p. 1–34. doi: 10.1007/978-981-10-3450-3_15-1
30. Breure A, De Deyn G, Dominati E, Eglin T, Hedlund K, Van Orshoven J, et al. Ecosystem services: a useful concept for soil policy making! Curr Opin Environ Sustain. (2012) 4:578–85. doi: 10.1016/j.cosust.2012.10.010
Keywords: pedometrics, econometrics, performance assessment, data envelopment analysis, metafrontier analysis, ecosystem services, soil health and quality, efficiency
Citation: Mizuta K, Grunwald S, Phillips MA, Bacon AR, Cropper WP Jr and Moss CB (2021) Emergence of the Pedo-Econometric Approach. Front. Soil Sci. 1:656591. doi: 10.3389/fsoil.2021.656591
Received: 21 January 2021; Accepted: 04 March 2021;
Published: 09 April 2021.
Edited by:
Gustavo M. Vasques, Embrapa Solos, BrazilReviewed by:
Mario Guevara, University of California, Riverside, United StatesMarcos Ceddia, Universidade Federal Rural Do Rio de Janeiro, Brazil
Copyright © 2021 Mizuta, Grunwald, Phillips, Bacon, Cropper and Moss. This is an open-access article distributed under the terms of the Creative Commons Attribution License (CC BY). The use, distribution or reproduction in other forums is permitted, provided the original author(s) and the copyright owner(s) are credited and that the original publication in this journal is cited, in accordance with accepted academic practice. No use, distribution or reproduction is permitted which does not comply with these terms.
*Correspondence: Katsutoshi Mizuta, a2F0c3V0b3NoaW1penV0YUB1ZmwuZWR1