 Julian Helfenstein1†
 Emmanuel Frossard1
 Chiara Pistocchi2
 Oliver Chadwick3
 Peter Vitousek4
 Federica Tamburini1*
- 1Institute of Agricultural Sciences, ETH Zürich, Lindau, Switzerland
- 2UMR Eco&Sols, Montpellier SupAgro, Montpellier, France
- 3Department of Geography, University of California, Santa Barbara, Santa Barbara, CA, United States
- 4Department of Biology, Stanford University, Stanford, CA, United States
Current understanding of phosphorus (P) dynamics is mostly based on experiments carried out under steady-state conditions. However, drying-rewetting is an inherent feature of soil behavior, and as such also impacts P cycling. While several studies have looked at net changes in P pool sizes with drying-rewetting, few studies have dynamically tracked P exchange using isotopes, which would give insights on P mean residence times in a given pool, and thus P availability. Here, we subjected three soils from a climatic gradient on the Kohala peninsula from Hawaii to 5-month drying-rewetting treatments. The hypotheses were that physico-chemical and biotic processes would be differently affected by repeated drying-rewetting cycles, and that response would depend on climatic history of the soils. Soils were labeled with 33P and 18O enriched water. At select time intervals, we carried out a sequential extraction and measured P concentration, 33P recovery (only first 3 months), and incorporation of 18O from water into phosphate. This allowed tracing P dynamics in sequentially extracted pools as well as O dynamics in phosphate, which are driven by biological processes. Results showed that P concentration and 33P recovery were predominantly driven by soil type. However, across all soils we observed faster dilution of 33P from resin-P into less mobile inorganic pools under drying-rewetting. On the other hand, O dynamics in phosphate were mostly governed by drying-rewetting treatment. Under drying-rewetting, considerably less O was incorporated from water into phosphate of resin-P, microbial-P and HCl-P, suggesting that drying-rewetting reduced biological P cycling. Hence, our results suggest that repeated drying-rewetting increases inorganic P exchange while reducing biological P cycling due to reduced microbial activity, independent of climatic history of the soils. This needs to be considered in P management in ecosystems as well as model representations of the terrestrial P cycle.
Introduction
Current representations of the phosphorus (P) cycle in land surface models are based on P exchange rates under constant moisture conditions (1–3). However, empirically it is well documented that repeated drying-rewetting, for example due to frequent intermittent rainfall/irrigation events, leads to long-lasting physicochemical and biological changes of soil properties. These changes in soil properties have a large impact on P availability and losses (4), which in turn affects not only the amount of P available for crop production or primary productivity, but also contributes to pollution of aquatic ecosystems (5, 6). With climate change, soils are likely to experience changing precipitation regimes, altering the balance of P release and retention through drying-rewetting (DRW). Previous research has warned that major agricultural transformation may be necessary to halt P losses under climate change (7), however, little is known about the effect of DRW on P exchange in soils, and if response differs in soils with different climatic backgrounds.
Recent research on P exchange showed that P mean residence time in the soil solution is a matter of seconds, in resin-extractable P of minutes, in microbial P and NaOH-extractable inorganic P of weeks to months, and in HCl- extractable P of years to millennia (8–10). Yet these estimates were based on observations of soils under constant soil moisture and or suppressed biological activity. In incubation experiments, repeated DRW drives changes in soil physical/chemical environment that are likely to affect P exchange. Repeated drying-rewetting can alter aggregate structure (11). Slaking may lead to aggregate breakdown, exposing new P binding sites to exchange with the soil solution and allowing fixed P to be released (12, 13). Altered aggregate structure may also lead to more binding of dissolved P onto soil surfaces, as it has been shown that drying-rewetting treatments significantly affected P sorption and hence exchange kinetics (14). In soils with amorphous soil minerals, such as volcanic soils, DRW can alter soil mineralogy, especially if changing soil moisture affects redox conditions (15). While it has been shown that DRW affects physicochemical soil P cycling, it is not clear if DRW leads to a net increase or decrease of P exchange in various inorganic soil P pools.
In addition to affecting physicochemical soil properties, repeated drying-rewetting alters soil microbial community composition and activity. The sudden rewetting of soil through rainfall or irrigation leads to the bursting of microbes and release of cell contents into the environment (16, 17). The release of nutrients and organic compounds from burst cells and the release of organic matter from soil aggregates triggers microbial activity and leads to a peak in soil respiration shortly after rewetting (18–20). Also, different components of the soil microbial community are diversely affected by DRW, and altering of wet and dry conditions may thus lead to changes in soil microbial community structure (17, 19, 21). In an experiment looking at two DRW cycles, DRW was reported to increase organic P mineralization (22). However, the peak in soil respiration upon re-wetting decreases with each subsequent cycle, and overall microbial biomass becomes smaller (23, 24). As shown recently for a sandy grassland soil (25), one might hypothesize that while DRW may increase organic P mineralization on the short term, repeated DRW reduces soil biological activity and biologically mediated P cycling as compared to under constant moisture.
Here, we asked the question, how does DRW affect P exchange in soils having different climatic histories? The hypotheses were that (1) physico-chemical and biotic processes will be differently affected by repeated drying-rewetting cycles [see (25)], and that (2) the soils will respond differently based on their climatic history. To address this question, we studied three soils from the Kohala climatic gradient, where large differences in precipitation have created soils that vary substantially in biological activity and mineralogy while having the same parent material (26–28). Soils were labeled with 33PO4 ions and 18O-enriched water and then subjected to 3-month (33P) and 5-month (18O) DRW treatments. At selected time intervals, we carried out a modified Hedley extraction and measured P concentration, 33P recovery, and incorporation of 18O from water into phosphate in soil pools. The recovery of 33P in inorganic and organic soil P pools allowed measuring P exchange under DRW and control conditions. Furthermore, tracing the incorporation of O from enriched water into phosphate served as a proxy for biological P cycling and microbial activity in general (29–31). Indeed, while physicochemical processes have minimal effect on the oxygen stable isotope ratio in phosphate (δ18OP), enzymes do incorporate oxygen from soil water into phosphate (32–34). Changes in δ18OP (measured in per mil difference to Vienna Standard Mean Ocean Water, VSMOW) and in O incorporation from water are thus an indicator of biological-driven P cycling (35). By conducting a relatively long incubation experiment on soils with different physical and mineralogical properties, we also contribute to further the knowledge on the effect of DRW on soils (25).
Methods
Soils and Sampling
Three soils were sampled on the Kohala climatic gradient in Hawaii, spanning a wide range in soil mineralogy, biological activity, and P availability (26). The three soils are all from grassland sites and correspond to three climatic domains, arid (soil D1), sub-humid (soil D2), and humid domain (soil D3), where P cycling was analyzed under steady-state conditions in previous work (27, 28, 31). Mean annual precipitation (MAP) on D1 is ~275 mm, on D2 ~1578 mm, and on D3 ~3,123 mm (36). Going from arid to wet, primary minerals, e.g., apatite, are lost while amorphous secondary minerals and soil organic matter accumulate (28, 37). With increasing rainfall, biological activity also increases, as reflected by microbial biomass, soil respiration, and potential phosphatase activity (27, 31). Soil on D1 was previously classified as Clayey-skeletal, isotic, isohyperthermic Sodic Haplocambids or medial-skeletal, ferrihydritic, isohyperthermic Typic Haplotorrands, depending on the exact values of density, oxalate ex-tractable Fe and Al, and P sorption parameters; soil on D2 as medial, ferrihydritic, isothermic Andic Haplustolls or medial, amorphic, isomesic Humic Haplustands, depending on the expression of a Mollic epipedon and Andic properties; and soil on D3 as Medial, amorphic, isomesic Hydric Fulvudands and Alic Epiaquands, depending on subtle differences in landscape curvature [see (37) for details]. In a 34-day soil incubation experiment at 60% max. water holding capacity, daily soil respiration increased 10-fold from 7.6 in D1 to 73.5 mg C g−1 soil day−1 in D3 (31). Phosphorus availability is lowest on the wettest site, where leaching drives P losses and P sorption capacity is highest (27).
Soils were sampled in February 2016 and in February 2017 from the A horizon of the three sites. The soil samples were kept at room temperature during shipment to Switzerland (1 week) and then stored at −20°C until the beginning of the experiment in February 2018. The combination of soil samples from two sampling dates was necessary to meet the soil dry mass requirements for the experiment (31).
Analysis of Soil Properties
Soil pH was measured in water using a soil:solution ratio of 1:2.5 and a 24-h equilibration time (38). Total soil C and N were measured on an TC/EA (Temperature Conversion Elemental Analyzer; Vario Pyro Cube, Elementar, GmbH, Germany). To assess changes in soil mineralogy, Fe, Al and Si concentrations were measured in extracts of sodium pyrophosphate, oxalate ammonium, and dithionite-citrate-bicarbonate (39). In general, pyrophosphate tends to extract metals associated to organic matter; oxalate ammonium extracts metals associated to amorphous compounds such as allophane, imogolite and ferrihydrite; and dithionite-citrate-bicarbonate extracts metals from crystalline phases (40). All soil properties were measured with four replicates.
Drying-Rewetting Experiment
For both the 33P and the 18O experiments, soils were preincubated for 17 days at 60% maximum soil water holding capacity. Maximum water holding capacity was 0.62 g water g−1 dry soil for D1, 1.18 for D2, and 3.36 for D3 (31). After preincubation, soil was divided into 30 g dry mass equivalent experimental units and labeled with isotopic tracer (Figure 1). The 33P experiment had four replicates, while the 18O experiment had two replicates. Because of low resin-P concentrations in D3, more soil was needed to provide enough phosphate for purification (31). At the same time, we wanted to preserve 30 g dry mass experimental units to make the results comparable between soils. To meet these requirements, in the 18O experiment the D3 soil treatments were carried out with three experimental units in parallel. At each sampling time point, soils from the three sub-replicates were combined to make one replicate, yielding enough P for purification.
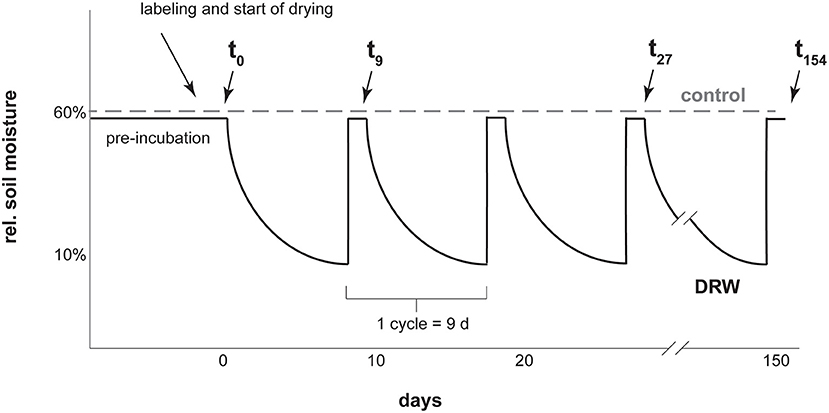
Figure 1. Diagram representing the experimental setup for one soil with a few of the sampling points as examples. Labeling was with carrier-free 33P or 18O-enriched water. Cycle length was kept constant for all three soils. Drying was tracked via mass loss and lids were closed as soon as 10% rel. soil moisture was reached, which was faster for D1 and D2 than D3. After 9 days all soils were rewetted to 60% rel. soil moisture.
The experiment had two treatments: control, where soils were kept constantly moist at 60% max. water holding capacity, and DRW (drying-rewetting). Soils under DRW were wetted to a 60% max. water holding capacity and then subjected to drying until reaching 10% max. water holding capacity (corresponding ~ to 0.06, 0.12, and 0.34 g water g−1 dry soil for D1, D2 and D3, respectively). At these water contents, the three soils were below their respective permanent wilting points (0.28, 0.75, 1.23 g water g−1 dry soil for D1, D2, and D3, respectively; 37). The time to reach 10% max. water holding capacity was 9 days for D3, 4 days for D2 and 2 days for D1. To make results among the soils comparable, DRW cycles were standardized to 9 days for all soils. Once a soil reached 10% max. water holding capacity, a lid was placed on the container to prevent further drying until the start of the next cycle. After 9 days, the drying time of D3, all soils were rewetted. This was repeated for 10 cycles for the 33P experiment and for 17 cycles for the 18O experiment, giving an experiment duration of 90 and 153 days, respectively. Soils were sampled the day after rewetting. The 33P experiment was shorter due to the relatively short half-life (25 days) of 33P. Experimental units were arranged in a random complete block design in an incubation oven set at 27°C.
33P Incorporation Into Inorganic and Organic P Pools
Phosphorus exchange was studied for control and drying-rewetting by labeling soil with 33P as phosphoric acid (carrier free, meaning that the tracer added no measurable mass of P) and measuring the incorporation of radioisotope into different pools. Labeling amount (R) was 29.2 kBq g−1 dry soil for D1, 43.7 kBq g−1 for D2, and 59.9 kBq g−1 for D3.
At each time point, a modified Hedley extraction was used to determine the concentration of P in each of the following operationally-defined inorganic and organic P pools: resin-P, microbial P, NaOH-Pi, NaOH-Po, and HCl-P (27). First, P was extracted with anion exchange membranes (BDH-551642S, VWR International) with or without 0.54 M 1-hexanol, the residue of the hexanol treatment was then extracted with 0.25 M NaOH and 0.05 M EDTA, and finally in 1 M HCl. The sorption-corrected difference between P extracted with hexanol and with resin only was taken as a proxy for microbial P (41, 42). In each fraction, inorganic P was measured by the malachite green method (43). In the NaOH pool, the organic fraction (NaOH-Po) was determined by subtracting the inorganic fraction (NaOH-Pi) from the total P of the pool, determined after digestion with 2.5 M H2SO4 and 0.18 M K2S2O8 at 110°C for 60 min (44). Because even after centrifugation soil residue contained significant amounts of solution, 31P and 33P carry over from the NaOH to the HCl extraction was corrected for using mass-balance.
The incorporation of radioisotope into P pools was determined by measuring the recovery of 33P in each pool. Radioactivity in the extracted P pools was measured by liquid scintillation using a beta-emission counter (Tri-carb 2,500 TR, Packard Instruments, Meriden, CT, USA) after thoroughly mixing the samples with Ultima Gold or Ultima Gold AB for acid extracts. In a pre-test, three methods mentioned in the literature for separating radioactivity in organic and inorganic fractions of NaOH were evaluated: anion exchange resin-trap (45), isobutanol (46), and acidification-centrifugation (47). Since acidification-centrifugation yielded the highest recovery of 33P spike, this method was used in this experiment. Despite having higher recoveries than the other methods, there was still a considerable quenching effect (48), which was corrected for using soil-specific quenching factors calculated in the pre-experiment (Supplementary Table 1).
For all pools, recovery of radioisotope [%] was calculated as,
where r(t) [Bq g−1 soil] is the amount of radioactivity in the sample at time t and R is the total labeling amount, corrected for radioactive decay.
Specific activity sets recovery of isotope in relation to the P pool size and was calculated using Equation 2 (42). The recovery of 33P is divided by the label amount (r(t)/R) in order to account for soil specific labeling. This is because best-practice in radiosafety requires only using the minimum amount of radioactive label still giving a signal, which is dependent on soil P sorption properties. Hence, in this study, as in earlier work, SA has the units [% of 33P (mg kg−1)−1] (42, 49, 50).
Treatment impact on SA(t) of a pool was taken as an indicator for treatment effect on P exchange that pool. If specific activity changes faster under DRW than control treatment, this would imply that DRW accelerates cycling of P in that pool. For several replicates, specific activity could not be calculated due to either negative recovery or too small P pool size.
Incorporation of O From Water Into Phosphate
The effect of repeated DRW cycles on biologically driven P cycling was studied by tracing the incorporation of O from enriched water into phosphate for control and drying-rewetting treatments.
Soils from both treatments (control and DRW) were labeled with 0.6, 1.1, or 3.0 ml water per experimental unit with a δ18OH2O of 387‰ (labeling volume depended on soil water holding capacity). The labeled water was prepared by diluting 98 atom % 18O (Sercon Limited, UK) with double distilled water. The DRW treatment received additional labeled water (δ18OH2O of 52‰) with every rewetting. Soil water was sampled shortly before the first labeling and at every sampling time point, and the isotopic signature of water was measured after quantitatively extracting water with cryodistillation (51).
Oxygen stable isotope ratios in phosphate were measured in the resin, hexanol, and HCl-extractable pools. The pools were extracted in the same way as for the 33P experiment, just with larger soil amounts, to meet the phosphate needs for purification. Phosphate in the resin, hexanol and HCl extracts was purified to Ag3PO4 (52), which was measured in three analytical replicates using a TC/EA (Vario Pyro Cube, Elementar GmbH) in pyrolysis mode, coupled in continuous flow to an isotopic ratio mass spectrometer (Isoprime 100, Elementar GmbH). Two benzoic acid standards (IAEA 601: δ18O = 23.1‰, IAEA 602 δ18O = 71.3‰), an internal Ag3PO4 standard (Acros Organics, Geel, Belgium, δ18O = 14.2‰), and in-house made standards were used for instrumental drift correction and calibration. The δ18OP of microbial P was determined by mass balance considering the pool concentrations. If the difference between δ18OP of resin-P and hexanol P was less than twice the standard deviation of the analytical replicates, then δ18OP of microbial P was set equal to δ18OP of hexanol P. In the HCl extraction, we controlled for inorganic hydrolysis of the P-O bond in phosphate or any organic phosphate compound carried over from previous steps by using 18O-labeled and unlabeled HCl extractants (52). Since there was no systematic difference between the two splits, data did not need to be corrected.
Even though the experiment was conceived to have enough phosphate yield for purification, resin-P concentrations decreased throughout the course of the experiment, so that for later time points phosphate yield was too low to measure δ18OP for some experimental units. For three samples (D1 res B control t27; D2 res A control t27; D2 Res B DRW t27) we suspected organic matter contamination in the Ag3PO4. Accordingly, these samples were cleaned with H2O2 prior to analysis.
We compared the change in 18O in phosphate that we measured with the change in 18O in water to determine the relative exchange of oxygen in phosphate (Equation 3).
Where f is the value at the time of sampling and i is the value at the beginning of the experiment (before labeling). Since only biological processes affect O incorporation into phosphate, the higher the % of O exchanged in phosphate, the higher the proportion of biologically mediated P cycling. If treatment affected % of O exchanged between water and phosphate, this would suggest that there was a treatment effect on biological P cycling. While it is more common to interpret δ18OP relative to a theoretical equilibrium of the isotopic composition of O in phosphate with O in water (53), this approach was not deemed appropriate for this experiment where soil water was constantly changing due to drying-rewetting. While the isotopic signature of soil water was only measured during sampling (shortly after re-wetting), the changes in δ18O in water during drying is predicted from earlier work on the same soils (Supplementary Figure 1; (54)). Measuring % of O exchanged in phosphate allowed us to compare results from different soils, which because of different labeling amounts and drying times, had different O isotopic ratios in water.
Data Analysis
Since different soils had different drying times, the three soils were statistically treated as separate experiments. For each soil, significance of differences in P concentrations, 33P recovery, specific activities, pH, total C and N, and extractable metals was tested using one-way ANOVA followed by Tukey's Honest Significant Difference Test (55). One-way ANOVA was used since sampling was destructive. For each linear model, we carefully performed model diagnostics by visually examining residuals vs. fitted values to test the assumption that the expected error = 0, normal q-q plot to test the assumption of normality, scale-location plot to test homoscedasticity (equal variance) and constant leverage to test the effect of potential outliers. All statistical tests were conducted at the significance level p < 0.05.
Results
Effect of Drying-Rewetting on General Soil Properties
Soil property response to repeated drying-rewetting differed by soil type. The largest pH effect was observed in D3, the soil from the most humid site on the climatic gradient, where pH increased from 4.56 to 5.30 in the control, while it dropped to 3.94 under DRW (Table 1). Carbon concentration in the soil tended to decrease for both treatments compared to t0, though this effect was not statistically significant. Pyrophosphate-extractable Al, Fe, and Si tended to be higher in DRW than control for D1, though this too was not significant. There was no significant effect of DRW on pyrophosphate-extractable metals in D2. In D3, pyrophosphate-extractable Fe and Si were lower under DRW. Oxalate-extractable Al responded differently for the different soils. While in D1 DRW increased oxalate-extractable Al, it decreased in D2 and tended to decrease in D3. There were no significant differences in oxalate-extractable Fe, dithionite-citrate-bicarbonate (DCB)-extractable Al, and DCB-extractable Fe between DRW and control for any soil. However, there was a trend to lower DCB-extractable Si in D1 and significantly lower DCB-extractable Si under DRW for D3.
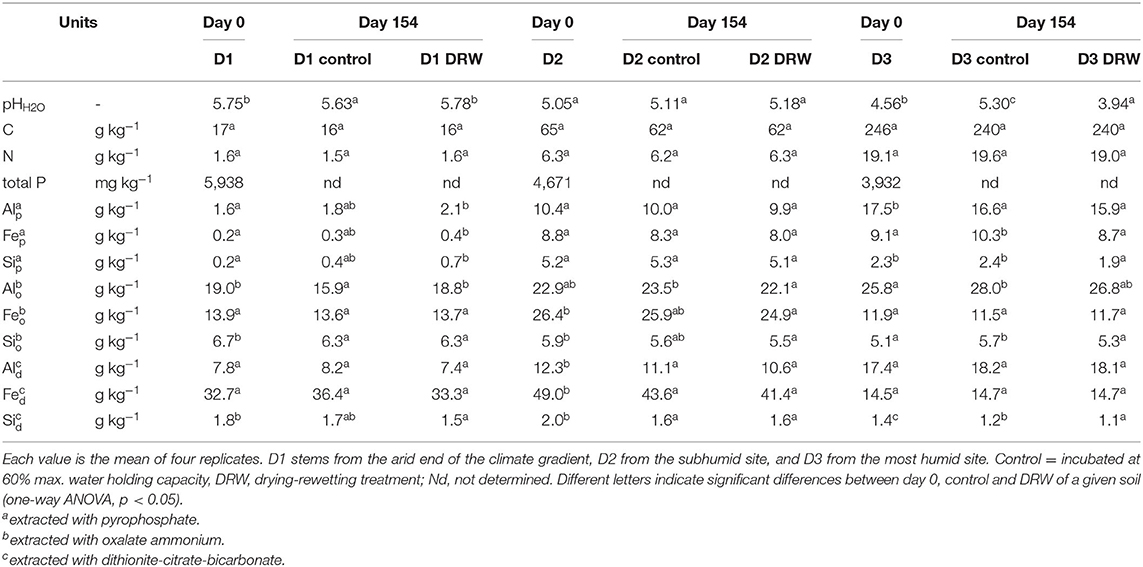
Table 1. Initial (day 0) and final (154) soil properties of the D1, D2, and D3 soils.
33P Incorporation Into Inorganic and Organic P Pools
Concentrations of P in the resin pool were highest in D1 and lowest in D3. Concentrations of resin-P decreased for all soils during the course of the experiment, though only significantly for D2 and D3 (Table 2, Figure 2A). Recovery of 33P and specific activity of the resin pool decreased significantly with time for all soil and treatment combinations (Figures 2C,E). Despite large differences in pool sizes between the different soils, specific activity of resin-P in all soils was similar, ~0.10–0.17 % (mg P kg−1)−1 90 days after labeling. DRW treatment significantly affected specific activity for both D1 and D2 (Table 2). While specific activity of resin-P decreased in D1 compared to the control, for D2 (and D3, though not significant), DRW led to an increase.
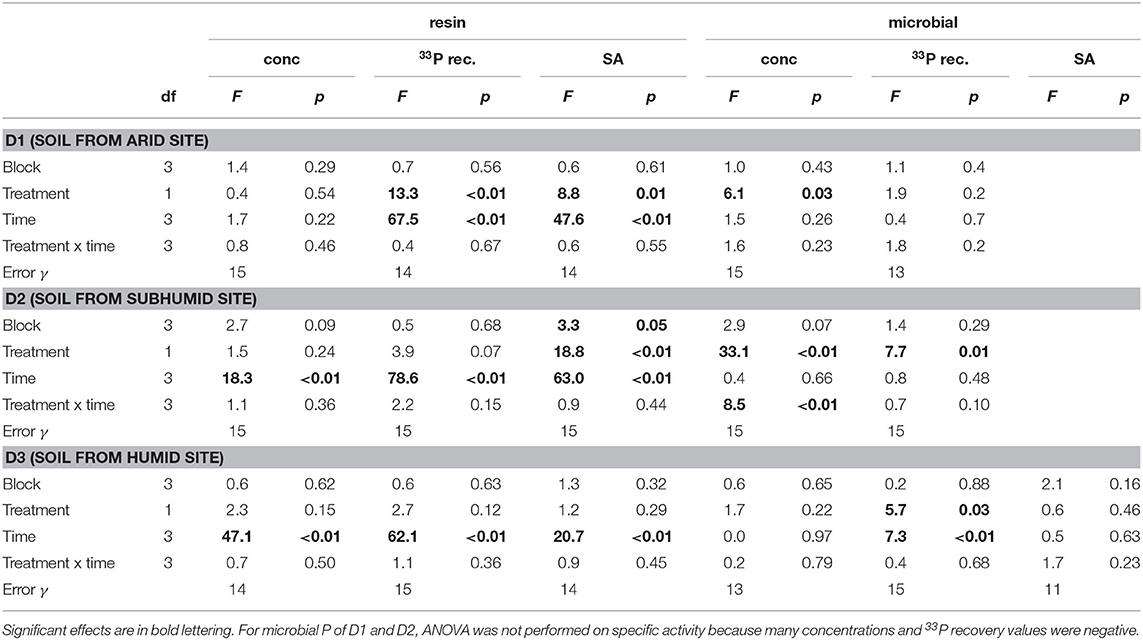
Table 2. ANOVA results for P concentration, 33P recovery, and specific activity (SA) in the resin and microbial pools.
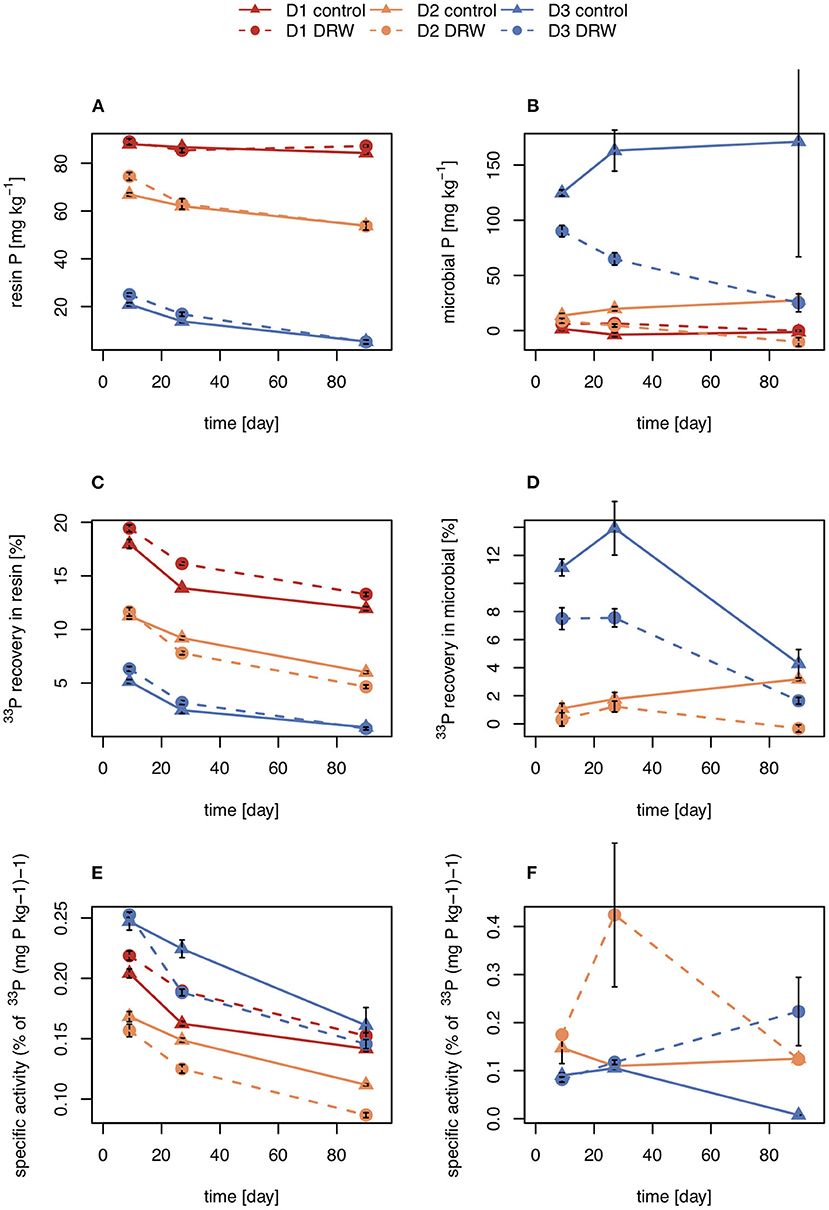
Figure 2. Concentration (A,B), radioisotope recovery (C,D), and specific activity (E,F) in resin-extractable (left) and microbial P (right). D1 refers to soil from the arid site, D2 from the subhumid site, and D3 from the humid site of the climatic gradient. Error bars show standard errors of the mean (n = 4).
Concentration of microbial P was highest in D3 and decreased under DRW compared to control treatment (Figure 2B). Microbial P concentration in D1 and D2 DRW treatment at later time points was not significantly different from 0. Recovery of 33P in microbial P also decreased with time, hence specific activity did not show significant treatment or time effects (Figure 2D). While specific activity in microbial P displayed high variability, in general specific activity was in a similar order of magnitude as that of resin-P (0.10–0.20 % (mg P kg−1)−1. For D2 there was a significant time × treatment interaction effect on specific activity because under DRW microbial P decreased while under the control it stayed constant or increased slightly.
Concentrations of NaOH-Pi were ~2000 mg P kg−1 for D1 and D2 and ~500 mg P kg−1 for D3. Overall, NaOH-Pi showed no clear trend with time or treatment (Figures 3A,D,G). For all time points, NaOH-Pi was the main sink of 33P in D1 and D2, with 50–65% of added 33P recovered in this pool. Recovery of 33P in NaOH-Pi of D3 was lower, ~20–25%. Despite high recovery, specific activity was lower than for resin or microbial pools, at ~0.03–0.05% (mg P kg−1)−1. Specific activity was not significantly affected by treatment or time for any soils (Table 3).
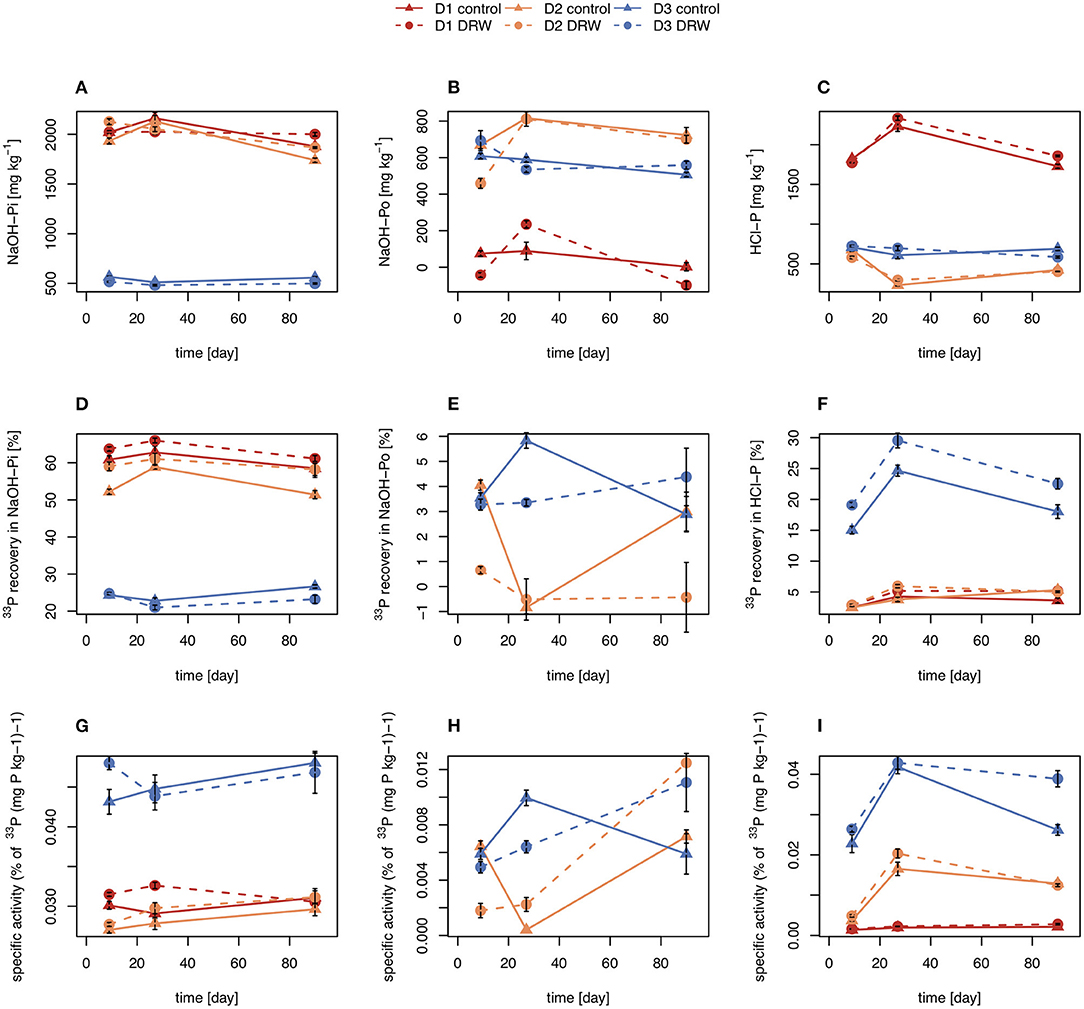
Figure 3. Concentration (A–C), radioisotope recovery (D–F), and specific activity (G–I) in NaOH-Pi (left), NaOH-Po (middle) and HCl-P (right). D1 refers to soil from the arid site, D2 from the subhumid site, and D3 from the humid site of the climatic gradient. Error bars show standard errors of the mean (n = 4).
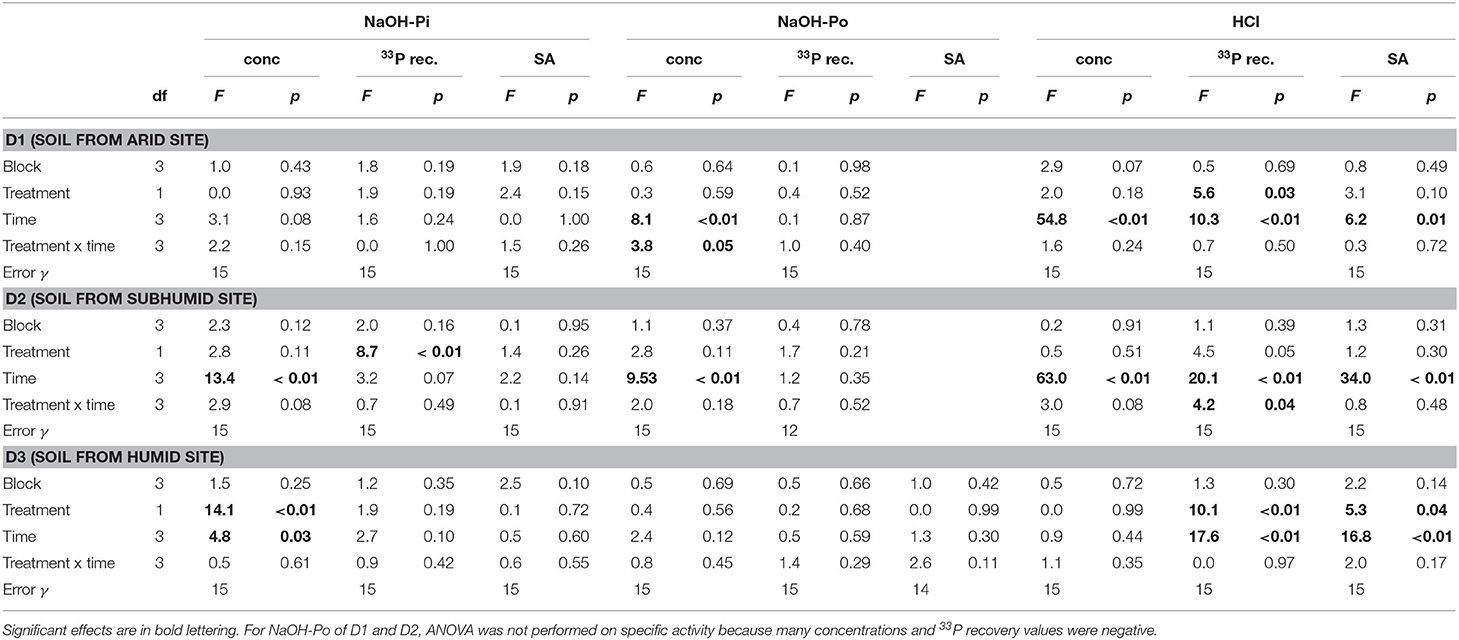
Table 3. ANOVA results for P concentration, 33P recovery, and specific activity (SA) in the NaOH-Pi, NaOH-Po and HCl pools.
Concentrations of NaOH-Po were higher in D2 and D3 than in D1. Concentration of NaOH-Po was significantly affected by time in D1 and D2 (Table 3). However, there was no consistent decrease or increase of NaOH-Po concentration with time in any of the soils (Figure 3B). Recovery of 33P in the NaOH-Po pool displayed high variability between replicates, but in general was low (<6 %) (Figure 3E). Though also displaying high uncertainty, specific activity of NaOH-Po in D2 and D3 tended to increase with increasing time (Figure 3H). For D3, specific activity of NaOH-Po was the lowest for all pools measured [~0.01 % (mg P kg−1)−1].
Concentration of HCl-P was ~2000 mg P kg−1 for D1 and ~500 mg P kg−1 for D2 and D3 (Figure 3C). These concentrations were significantly affected by time in D1 and D2 (Table 3). However, like for NaOH-Pi and Po, there was no consistent decrease or increase of concentration observed with time. Recovery of 33P in HCl-P was low (<5%) in D1 and D2, but considerably higher in D3 (15–30%) (Figure 3F). Specific activity of HCl-P increased with increasing incubation duration for all soils (Figure 3I). For D1, specific activity in HCl-P had the lowest specific activity of any pool [<0.02 % (mg P kg−1)−1].
Total recovery of 33P in D1 ranged from 73–86%, in D2 from 67–75%, and in D3 from 53–70%.
Incorporation of O From Water Into Phosphate
Stable oxygen isotopic value in soil water (δ18OH2O) increased from −1 to −6‰ prior to labeling to +9–+15‰ in the control treatment and to +44–+54‰ in the DRW treatment (Supplementary Table 2). Water in the DRW treatment was heavier because of evaporation during the drying phase and because this treatment was continuously rewetted with 18O-enriched water.
δ18OP values of all treatments and soil combinations in all three analyzed pools increased with time. The δ18OP in resin-P increased from ~20 to 30‰ for all soils and treatments (Supplementary Table 2). The δ18OP in microbial-P showed a similar pattern to resin-P for D1 and D2 soils. In D3, δ18OP in microbial-P in the control treatment tended to be below δ18OP in resin-P. δ18OP of the HCl pool increased during the course of the experiment. After 153 days of incubation, δ18OP in D1 had increased by about 4‰, D2 by ~6‰, and D3 by ~5–7‰. As for resin and microbial δ18OP, there was no clear treatment effect on δ18OP in all three analyzed pools.
Despite having similar δ18OP values, the amount of O exchanged between water and phosphate was higher in the control relative to DRW treatment. Since water in the DRW treatment was heavier, the same δ18OP value implies less actual exchange of O in phosphate (Equation 3). In resin-P, up to 50 % of O in phosphate was exchanged in the control treatment, compared to ~20% in DRW (Figure 4, left). A similar pattern was observed in the microbial-P pool, where the highest exchange was observed in the control treatment of D2 (85%). However, in D3 the proportion of O exchanged in phosphate in the microbial pool did not differ significantly between treatments (Figure 4, right). Finally, in the HCl pool, the relative proportion of O exchanged in phosphate was ~35-70% lower in the DRW treatment (Figure 5), with the clearest difference between control and DRW in D1.
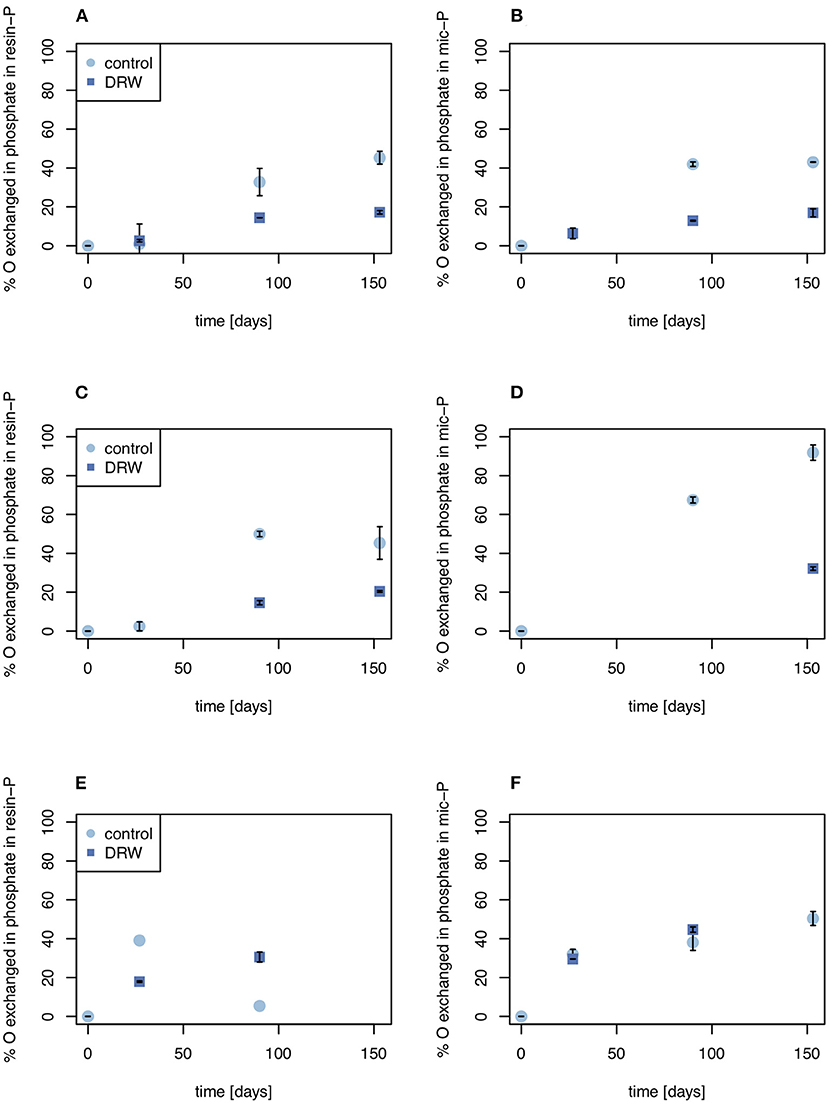
Figure 4. Biologically-mediated oxygen exchange in the resin-P (left) and microbial P pools (right). (A, B) show results from soil D1 (arid site); (C,D) show results from soil D2 (subhumid site); and (E,F) show results from soil D3 (humid site). Exchange was calculated as the change in δ18OP of the pool divided by the change in δ18OH2O. Error bars are standard errors of the mean (n = 2). Oxygen exchange in microbial P of D2 at t = 27 days (D) is not plotted since it was >> 100%, suggesting a measurement error.
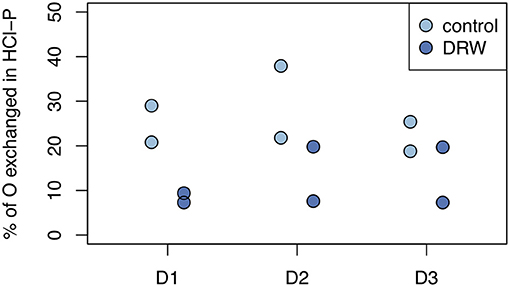
Figure 5. Biologically-mediated oxygen exchange in phosphate in the HCl-P pool. Exchange was measured after 153 days of incubation and calculated as the change in δ18OP of the pool divided by the change in δ18OH2O. D1 refers to soil from the arid site, D2 from the subhumid site, and D3 from the humid site of the climatic gradient.
Discussion
The results suggest that soil physicochemical properties responded differently to DRW based on the climatic history of these soils (Table 1). However, across all soils, DRW seemed to accelerate inorganic P exchange between more recalcitrant pools (HCl-P) and the soil solution. On the other hand, repeated DRW led to reduced O incorporation into resin-P, microbial-P and HCl-P. While several studies have traced 33P incorporation into sequentially-extracted P pools (45, 50, 56, 57), it has not previously been done under DRW conditions. Also, P radioisotope tracing has rarely been combined with 18O tracing in phosphate in soil (30, 31). By comparing specific activity (% 33P recovery/pool concentration, Equation 2) between control and DRW treatments, it was possible to determine that DRW either accelerates or hampers P exchange, depending on the pool and soil studied. The findings provide several new insights on soil P dynamics and implications for soil P research and modeling.
Insights on Soil Phosphorus Dynamics
Recently the sequential extraction method, which is widespread in P research and the basis of most P modeling frameworks, has come under increasing scrutiny (58–60). As a consequence, spectroscopic methods are becoming more widely used as an alternative and as a way to validate extraction procedures. The soils used in this study have already been characterized with spectroscopic approaches and the link between the sequentially extracted pools and the soil composition validated (27, 28). An important validation component is to test the mobility assumptions inherent in sequential extractions, to better understand the dynamics of each pool. Here we trace isotope incorporation into sequentially-extracted pools to better understand P dynamics. Our study confirms earlier findings that NaOH-Pi is the main sink of radioisotope label in the time frame of days-months covered by incubation experiments (45, 50, 56, 57, 61). However, unlike in previous studies, where recovery of 33P in NaOH-Pi continued to increase even after 34 days of incubation (61), in our study specific activity of NaOH-Pi remained more or less constant through the course of the experiment (Figure 3G). The specific activity measured in NaOH-Pi was very close to a theoretical equilibrium specific activity. A common assumption in isotope exchange kinetics is that after enough time has passed, the radioisotope will be distributed equally among all the soil P pools in proportions relative to the pool size (62). Accordingly, the specific activity of any pool in this equilibrium state (SAeq) would be (Equation 4),
Where Psum is the total amount of P involved in exchange processes (the sum of exchanging P pools). If we take Psum to be the sum of sequentially extracted inorganic and organic P pools, SAeq equals 0.024 ± 0.001 for D1, 0.027 ± 0.001 for D2, and 0.046 ± 0.002 % (mg P kg−1)−1 for D3. Our calculated theoretical SAeq closely matched the observed specific activity of the NaOH-Pi pools (Figure 6), suggesting those pools were already in equilibrium at the first sampling (9 days). Hence, analysis of specific activity in NaOH-Pi showed that this pool is more dynamic in soils rich in chemically sorptive components such as amorphous minerals than in other soils investigated in earlier studies, where recovery of 33P in NaOH-Pi did not plateau.
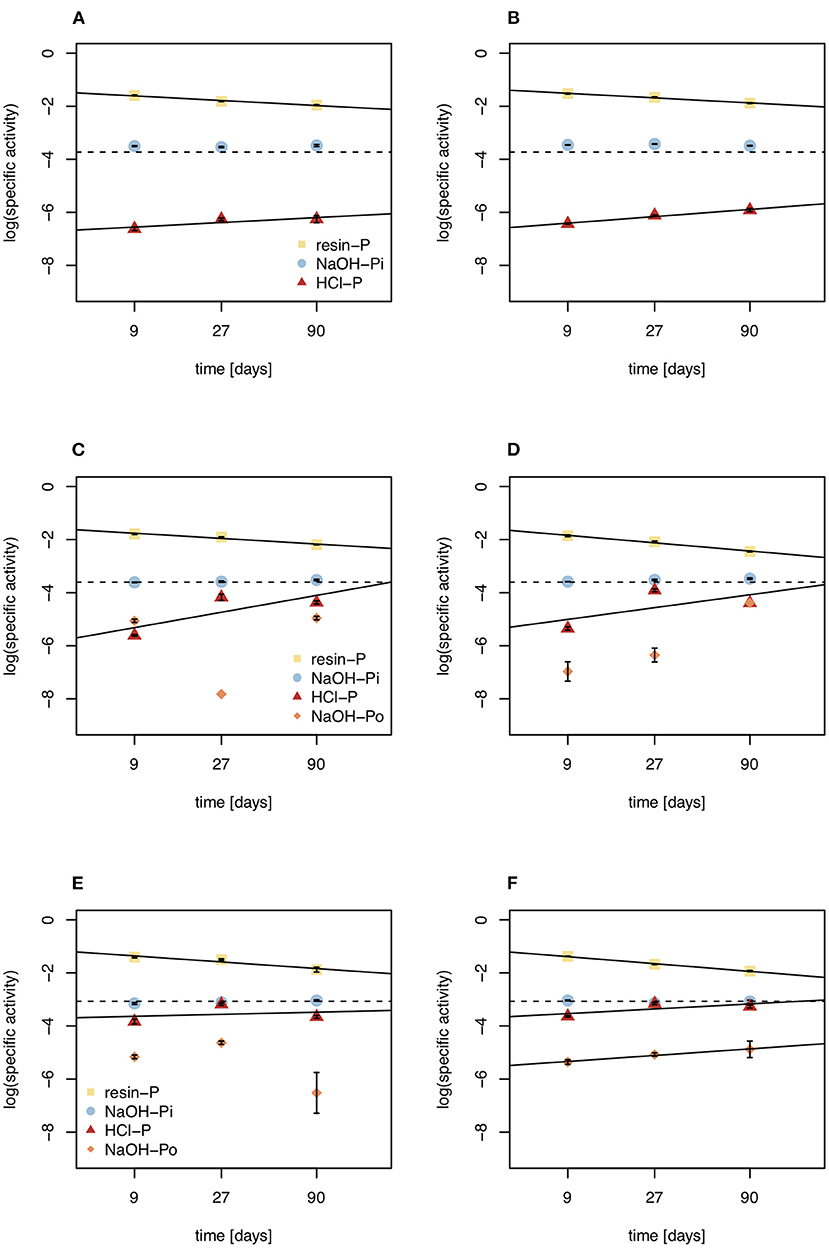
Figure 6. Specific activities of resin-P, NaOH-Pi, NaOH-Po, and HCl pools under control (left) and DRW (right) treatment. (A,B) show results from soil D1 (arid site); (C,D) show results from soil D2 (subhumid site); and (E,F) show results from soil D3 (humid site). Lines are the regression lines fit to specific activities of each pool. The dashed line represents the specific activity expected in equilibrium (SAeq). Specific activity has the units % of 33P (mg P kg−1)−1. Error bars show standard errors of the mean (n = 4).
The fact that NaOH-Pi reached equilibrium before resin-P does not mean that NaOH-Pi turns over faster than the much smaller resin pool. Rather, resin-P, being the fastest to exchange with the pool that is labeled (the soil solution), has the highest specific activity at the beginning of the experiment. This shows the fast exchange of this pool, as resin-P very quickly goes into isotopic equilibrium with phosphate in soil solution, before exchanges with other P pools take place (63). Previous observations have shown that specific activity of resin-P continues to decline during the experiment (42, 56), and our rudimentary extrapolations suggest specific activity of resin-P continues to decline until the radioisotope is equally distributed in the whole system (Figure 6). Our observations suggest that for less labile pools (such as NaOH-Pi), specific activity increases with increasing exchange reactions, and dynamics can only be followed until specific activity reaches SAeq, after which time influx can no longer be differentiated from outflux. The concept of SAeq may be interesting to study P dynamics in future radioisotope tracing experiments. For example, if more points were measured and for a longer period, one might be able to extrapolate an equilibration time of P in the system with some confidence and determine how this differs between different soils and/or treatments. However, for longer experimental durations significantly higher labeling doses would be required.
Mean residence time of P in HCl-P has been approximated to be on the order of years to millennia, depending on soil pH (10). Our results confirm the low reactivity of this pool, especially in D1, which has higher pH and is known to contain apatite (28). However, in D3 specific activity of NaOH-Pi and HCl-P were similar, suggesting that these two pools are chemically more similar for high-organic matter, acidic soils. This may be explained by the redistribution of P from the NaOH-extraction and dissolution of Fe- and Al oxides by 1 M HCl (64). Over all three soils, 7–38% of O in phosphate of the HCl-P pool was incorporated from water during the 5-month experiment (Figure 5). Phosphate enters the HCl pool without cleavage of the P-O bond and therefore an increase in O incorporation can only occur through abiotic exchange with biologically cycled resin-P (65). This confirms the 33P results that HCl-P may contain both minerals that are inert on short time scales, such as apatite, and secondary P forms that are exchanging readily on the time-scale of months. Interpretation of the HCl-P fraction is complicated because depending on soil properties it can contain multiple forms of P, not just apatite (60).
In addition, our study provides information on exchange of P in organic P, which has rarely been tackled (66). We extracted organic P with 0.25 M NaOH and 0.05 M EDTA, the predominant method used for liquid 31P NMR speciation of organic P (67) and for stable oxygen isotope analysis of organic P (68). Earlier work has shown that organic P in this pool is not readily-degradable by enzymes (69). While there was large variability in the data within replicates and between time points, the order of magnitude of specific activity of NaOH-Po provides interesting qualitative insights into the dynamics and nature of this pool. In D2 and D3, the specific activity of NaOH-Po was the lowest of all measured pools, suggesting that the organic fraction of this pool is more inert than the inorganic pools studied (Figure 6). This confirms earlier 33P tracing studies, where the specific activity of NaOH-Po was also very low, comparable to or lower than that of HCl-P (45, 56). It is well known that organic matter is heavily stabilized due to organo-mineral reactions in Hawaiian soils (70–72). Even in the organic horizon of P-poor forest soil, specific activity of NaOH-Po was lower than that of HCl-P (50). This suggests extremely long mean residence time of P in NaOH-Po, likely in a range similar to HCl-P (years to millennia).
While studies on the limitations and opportunities of fractionation techniques have mostly focused on inorganic P forms (58–60), much less is known about limitations of organic-P forms as determined by sequential fractionation. The fast exchange of the inorganic soil P pools (NaOH-Pi and HCl-P) compared to the relatively inert NaOH-Po pool suggests that physicochemical fluxes dominate soil P cycling and P availability in these soils. However, it is likely that some organic P fractions within the large NaOH-Po pool have a shorter mean residence time, but their dynamics are masked by the bulk of organic P, which is stabilized in organo-mineral complexes (73). Analysis of organic P with NMR or stable oxygen isotopes in NaOH-Po extracts needs to consider the relatively inert nature of this pool to avoid drawing false conclusions about P availability and nutrition. The dynamics of P in other operationally-defined organic P pools (e.g., 0.5 M NaHCO3-extractable) or of single Po compounds need to be assessed to determine if there are meaningful substitutes to NaOH-Po for studying organic P cycling in soil.
Effect of Drying-Rewetting on Phosphorus Dynamics
Our results suggest that repeated DRW may reduce mean residence time of inorganic P in soil by accelerating physicochemical P exchange processes. A recent study on sandy soil tracing 33P incorporation into water-extractable and microbial P reported reduced mean residence time of P in microbial-P under DRW as compared to control treatment (25). In our study, we complement these findings by investigating P dynamics in other inorganic P pools and analyzing O incorporation from water in phosphate. Our results show that specific activity was lower under DRW in resin-P of D2 and D3 soils, suggesting faster dilution of 33P from resin-P into less mobile P pools (Figure 2E). This may be because drying-rewetting disrupts aggregate structure, exposing new sites to exchange P with the soil solution (12). Likewise, more 33P tended to be recovered in the HCl-P pool, generally considered to be the least mobile inorganic pool, of DRW than control treatments (Table 3). As soil dries, ionic strength increases, and may lead to precipitation of phosphate with cations (74). The DRW effect on specific activity of resin-P and HCl-P thus provides evidence that DRW may accelerate the exchange of inorganic soil P by repeatedly disturbing the soil chemical environment.
Unlike inorganic P, turnover of organic P was likely reduced by DRW, because DRW hampered biological P cycling. Pool size, 33P recovery, and specific activity of NaOH-Po showed no significant treatment effect, due to high variability between replicates and time points (Table 3). However, several indicators point to reduced biological P transformations. Firstly, soil microbial P decreased in DRW treatments, whereas it remained stable under control treatments (Figure 2B). This confirms earlier studies reporting the negative effect of DRW on soil microbial biomass (23, 24) and slowing down of microbial P turnover (25). 33P recovery in microbial P followed the same pattern as concentration. Hence, the decrease in microbial P pool size resulted in a concomitant decrease in microbially-mediated P cycling.
Drying-rewetting also reduced the amount of O exchanged between water and phosphate, an effect observed in all three pools analyzed (Figures 4, 5). Although soils were below their permanent wilting point under dry conditions, microbes are expected to be active also at soil water potentials well below [−5 mPa; (75)], thus we expect some O exchange. Since we used the δ18O of soil water after re-wetting as a reference to calculate exchange, our observation can be considered a conservative estimate. Under dry conditions, soil water may be up to 10‰ higher (Supplementary Figure 1), which would translate to even lower calculated values of O exchanged between water and phosphate under the DRW treatment (Equation 3). The lower amount of oxygen exchanged in phosphate in DRW could either be due to decreased O incorporation associated to increased proportion of phosphate being released by mineralization (34) or to stress-induced inactivity of microbes. It has been shown that under P-limitation, microbes rely more heavily on organic P mineralization (30, 76), which would incorporate only one O atom. It has also been observed that under drought conditions, microbial metabolism requires higher quantities of C, which translates in higher production of extracellular enzymes targeting C compounds (77). Although not targeting organic P, phosphate is often released as a by-product [i.e., 5′-nucleotidase; (78)] and would incorporate one O from water. In our experiment, DRW had lower O incorporation in all three soils, independent of their P and C availability. Rather, D1, which has the highest P and lowest C availability, respectively [Tables 1, 2, Figure 2A in (31)], had the largest reduction in O exchanged, and this soil also experienced the longest dry periods. Hence, the reduced O incorporation was likely caused by stress-induced inactivity or dormancy of a portion of the microbial biomass. When microbes are dormant, exchange with the soil solution is limited and intracellular processes, which could promote a complete exchange of O in phosphate, are reduced to a minimum (79).
D1 had a low water-holding capacity and thus a fast drying-time, 2 days compared to 4 and 9 days, of D2 and D3, respectively. Hence, treatment effect on O exchanged in phosphate might be the largest for D1 because the DRW soils dried out more quickly than D2 or D3. Interestingly, however, the long dry phase did not translate into a treatment effect on 33P recovery in inorganic P pools (Tables 2, 3), even though physicochemical exchange processes also need water. This may be because aggregate breakdown and changing soil mineralogy (Table 1), as discussed above, increased physicochemical fluxes shortly after rewetting to a point that this compensated for reduced exchange under the dry phase. Thus, the treatment effect on O exchanged in phosphate was less strong in D3 because these soils stayed moist longer. Furthermore, we found evidence for unanticipated anoxic conditions in D3 control treatment. While pH in the DRW treatment of D3 decreased from 4.6 to 3.9, under control treatment pH increased to 5.3 (Table 1). The pH increase under the control treatment came along with a strong sulfur smell, suggesting that the sealed caps led to anoxic conditions and the reduction of Fe3+ to Fe2+, consuming protons, and sulfate to hydrogen sulfide (80). The unintended anoxic conditions likely resulted because high microbial activity of these soils consumed oxygen in the closed containers. The depletion of oxygen likely restricted biological activity in D3 and explains the smaller treatment effect on O-exchanged in phosphate in D3 compared to D2 and D1.
Another limitation of this study was the low 33P recoveries in D3. While total 33P recoveries of D1 and D2 were in the range of those reported in earlier work (50, 56), recoveries of D3 were only 53–70%. Buehler et al. (56) measured total recoveries of 68–90% in Ferralsols from an agricultural field experiment, with lower recoveries on soils with low P availability. D3 had a considerably lower resin-P concentration than the other two studied soils (20 compared to 70 and 90 mg P kg−1), hence total recovery was also negatively related to P availability in our experiment. Part of the incomplete recovery may be due to color quenching or self-absorption of scintillations by soil particles (48), though this effect was at least partially accounted for with our quenching study for the NaOH-extraction (Supplementary Table 1). However, low recovery may also be a sign that the modified Hedley extraction misses large P fractions in organic-matter rich, highly-weathered Andisols. Buehler et al. (56) found additional 0–6% of added radioisotope label in the residual pool, which they extracted by digesting in concentrated H2SO4 at 360°C under stepwise addition of H2O2. It is possible that the residual P pool may also play an important role in P cycling even on a timescale of weeks to months for the soils studied and may have been a sink of 33P in our experiment.
Conclusion
Repeated DRW increased exchange of inorganic P while reducing biological activity and biologically-mediated P cycling. The three studied soils from the Hawaiian climatic gradient displayed significant differences in P dynamics. Most noticeably, incorporation of 33P into HCl-P was much faster on soils from the wettest site (20–25% after 90 days) compared to soils from the most arid site (<5%) of the climatic gradient. This confirms that different inorganic P forms found in these soils lead to vastly different P dynamics. However, across all soils we observed that DRW led to faster dilution of radioisotopes from resin-P into HCl-P. Similarly, DRW reduced the amount of O that had been exchanged in phosphate from 20–40 to 7–20% for all soils, suggesting that DRW hampered biological P cycling independent of soil climatic history. The results thus confirm our first hypothesis that biological and physicochemical P cycling are differently affected by repeated DRW. However, the second hypothesis was rejected, since we could not find evidence that the effect of DRW is dependent on soil climatic history. Current model representations of the P cycle should thus be updated to account for opposing effects of DRW on biological vs. physicochemical fluxes to P availability.
Data Availability Statement
The raw data supporting the conclusions of this article will be made available by the authors, without undue reservation.
Author Contributions
JH wrote the manuscript with inputs from all co-authors. JH, EF, CP, OC, PV, and FT contributed to the experimental design. JH and FT conducted the experiments and performed the analysis. All authors contributed to the manuscript and approved the submitted version.
Funding
This work was funded by the Swiss National Science Foundation (Project number 200021_162422).
Conflict of Interest
The authors declare that the research was conducted in the absence of any commercial or financial relationships that could be construed as a potential conflict of interest.
Publisher's Note
All claims expressed in this article are solely those of the authors and do not necessarily represent those of their affiliated organizations, or those of the publisher, the editors and the reviewers. Any product that may be evaluated in this article, or claim that may be made by its manufacturer, is not guaranteed or endorsed by the publisher.
Acknowledgments
We are grateful to lab help by Dr. Laurie Schönholzer, Monika Macsai, Camille Rubeaud, Maja Siegenthaler, and Dr. Josep Ramoneda; help with statistics and experimental design by Lilian Gasser, Andreas Psimopoulus, and Nina Roth; and fruitful discussions with Dr. Eva Mészáros, Dr. Klaus Jarosch, Dr. Hao Chen, and Dr. Astrid Oberson. We would also like to acknowledge Prof. Stefano Bernasconi for providing access to IRMS for measuring water samples, and Dr. Matthias Saurer and Dr. Roland Werner for use of the cryo-distillation setup in their lab.
Supplementary Material
The Supplementary Material for this article can be found online at: https://www.frontiersin.org/articles/10.3389/fsoil.2021.738464/full#supplementary-material
References
1. Goll DS, Vuichard N, Maignan F, Jornet-Puig A, Sardans J, Violette A, et al. A representation of the phosphorus cycle for ORCHIDEE (revision 4520). Geosci Model Dev. (2017) 10:3745–70. doi: 10.5194/gmd-10-3745-2017
2. Yu L, Zanchi G, Akselsson C, Wallander H, Belyazid S. Modeling the forest phosphorus nutrition in a southwestern Swedish forest site. Ecol Modell. (2018) 369:88–100. doi: 10.1016/j.ecolmodel.2017.12.018
3. Sun Y, Goll DS, Chang J, Ciais P, Guenet B, Helfenstein J, et al. Global evaluation of nutrient enabled version land surface model ORCHIDEE-CNP v1.2 (r5986). Geosci. Model Dev. (2020) 1–65. doi: 10.5194/gmd-2020-93-supplement
4. Turner BL, Haygarth PM. Biogeochemistry: phosphorus solubilization in rewetted soils. Nature. (2001) 411:258. doi: 10.1038/35077146
5. Carpenter SR, Caraco NF, Correll DL, Howarth RW, Sharpley AN, Smith VH. Nonpoint pollution of surface waters with phosphorus and nitrogen. Ecol Appl. (1998) 8:559–68. doi: 10.1890/1051-0761
6. Reed SC, Yang X, Thornton PE. Incorporating phosphorus cycling into global modeling efforts: a worthwhile, tractable endeavor. New Phytol. (2015) 208:324–9. doi: 10.1111/nph.13521
7. Ockenden MC, Hollaway MJ, Beven KJ, Collins AL, Evans R, Falloon PD, et al. Major agricultural changes required to mitigate phosphorus losses under climate change. Nat Commun. (2017) 8:161. doi: 10.1038/s41467-017-00232-0
8. Oberson A, Joner EJ. Microbial turnover of phosphorus in soil. In: Turner BL, Frossard E, Baldwin DS, editors. Organic Phosphorus in the Environment. Wallingford, CT: CAB International (2005). p. 133–64.
9. Helfenstein J, Jegminat J, McLaren TI, Frossard E. Soil solution phosphorus turnover: derivation, interpretation, and insights from a global compilation of isotope exchange kinetic studies. Biogeosciences. (2018) 15:105–14. doi: 10.5194/bg-15-105-2018
10. Helfenstein J, Pistocchi C, Oberson A, Tamburini F, Goll DS, Frossard E. Estimates of mean residence times of phosphorus in commonly-considered inorganic soil phosphorus pools. Biogeosciences. (2020) 17:441–54. doi: 10.5194/bg-17-441-2020
11. Denef K, Six J, Merckx R, Paustian K. Short-term effects of biological and physical forces on aggregate formation in soils with different clay mineralogy. Plant Soil. (2002) 246:185–200. doi: 10.1023/A:1020668013524
12. Sinaj S, Frossard E, Fardeau JC. Isotopically exchangeable phosphate in size fractionated and unfractionated soils. Soil Sci Soc Am J. (1997) 61:1413–7. doi: 10.2136/sssaj1997.03615995006100050019x
13. Bünemann EK, Keller B, Hoop D, Jud K, Boivin P, Frossard E. Increased availability of phosphorus after drying and rewetting of a grassland soil: processes and plant use. Plant Soil. (2013) 370:511–26. doi: 10.1007/s11104-013-1651-y
14. Olsen RG, Court MN. Effect of wetting and drying of soils on phosphate adsorption and resin extraction of soil phosphate. J Soil Sci. (1982) 33:709–17. doi: 10.1111/j.1365-2389.1982.tb01801.x
15. Thompson A, Chadwick OA, Rancourt DG, Chorover J. Iron-oxide crystallinity increases during soil redox oscillations. Geochim Cosmochim Acta. (2006) 70:1710–27. doi: 10.1016/j.gca.2005.12.005
16. Turner BL, Driessen JP, Haygarth PM, McKelvie ID. Potential contribution of lysed bacterial cells to phosphorus solubilisation in two rewetted Australian pasture soils. Soil Biol Biochem. (2003) 35:187–9. doi: 10.1016/S0038-0717(02)00244-4
17. Dinh M-V, Guhr A, Spohn M, Matzner E. Release of phosphorus from soil bacterial and fungal biomass following drying/rewetting. Soil Biol Biochem. (2017) 110:1–7. doi: 10.1016/j.soilbio.2017.02.014
18. Fierer N, Schimel JP. Effects of drying–rewetting frequency on soil carbon and nitrogen transformations. Soil Biol Biochem. (2002) 34:777–87. doi: 10.1016/S0038-0717(02)00007-X
19. Bapiri A, Bååth E, Rousk J. Drying–rewetting cycles affect fungal and bacterial growth differently in an arable soil. Microb Ecol. (2010) 60:419–28. doi: 10.1007/s00248-010-9723-5
20. Najera F, Dippold MA, Boy J, Seguel O, Koester M, Stock S, et al. Effects of drying/rewetting on soil aggregate dynamics and implications for organic matter turnover. Biol Fertil Soils. (2020) 56:893–905. doi: 10.1007/s00374-020-01469-6
21. Gordon H, Haygarth PM, Bardgett RD. Drying and rewetting effects on soil microbial community composition and nutrient leaching. Soil Biol Biochem. (2008) 40:302–11. doi: 10.1016/j.soilbio.2007.08.008
22. Chepkwony CK, Haynes RJ, Swift RS, Harrison R. Mineralization of soil organic P induced by drying and rewetting as a source of plant-available P in limed and unlimed samples of an acid soil. Plant Soil. (2001) 234:83–90. doi: 10.1023/A:1010541000437
23. Butterly CR, Bünemann EK, McNeill AM, Baldock JA, Marschner P. Carbon pulses but not phosphorus pulses are related to decreases in microbial biomass during repeated drying and rewetting of soils. Soil Biol Biochem. (2009) 41:1406–16. doi: 10.1016/j.soilbio.2009.03.018
24. Chen H, Lai L, Zhao X, Li G, Lin Q. Soil microbial biomass carbon and phosphorus as affected by frequent drying–rewetting. Soil Res. (2016) 54:321. doi: 10.1071/SR14299
25. Chen H, Jarosch K, Meszaros E, Frossard E, Zhao X, Oberson A. Repeated drying and rewetting differently affect abiotic and biotic soil phosphorus (P) dynamics in a sandy soil: a 33P soil incubation study. Soil Biol Biochem. (2021) 153. doi: 10.1016/j.soilbio.2020.108079
26. Vitousek PM, Chadwick OA. Pedogenic thresholds and soil process domains in basalt-derived soils. Ecosystems. (2013) 16:1379–95. doi: 10.1007/s10021-013-9690-z
27. Helfenstein J, Tamburini F, von Sperber C, Massey MS, Pistocchi C, Chadwick OA, et al. Combining spectroscopic and isotopic techniques gives a dynamic view of phosphorus cycling in soil. Nat Commun. (2018) 9:3226. doi: 10.1038/s41467-018-05731-2
28. Vogel C, Helfenstein J, Massey MS, Sekine R, Kretzschmar R, Beiping L, et al. Microspectroscopy reveals dust-derived apatite grains in acidic, highly-weathered Hawaiian soils. Geoderma. (2021) 381:114681. doi: 10.1016/j.geoderma.2020.114681
29. Bauke SL, von Sperber C, Siebers N, Tamburini F, Amelung W. Biopore effects on phosphorus biogeochemistry in subsoils. Soil Biol Biochem. (2017) 111:157–65. doi: 10.1016/j.soilbio.2017.04.012
30. Pistocchi C, Mészáros É, Frossard E, Bünemann EK, Tamburini F. In or Out of Equilibrium? How Microbial Activity Controls the Oxygen Isotopic Composition of Phosphate in Forest Organic Horizons With Low and High Phosphorus Availability. Front Environ Sci. (2020) 8:1–15. doi: 10.3389/fenvs.2020.564778
31. Siegenthaler MB, Tamburini F, Frossard E, Chadwick O, Vitousek P, Pistocchi C, et al. A dual isotopic (32P and 18O) incubation study to disentangle mechanisms controlling phosphorus cycling in soils from a climatic gradient (Kohala, Hawaii). Soil Biol Biochem. (2020) 149:107920. doi: 10.1016/j.soilbio.2020.107920
32. Blake RE, O'Neil JR, Surkov AV. Biogeochemical cycling of phosphorus: Insights from oxygen isotope effects of phosphoenzymes. Am J Sci. (2005) 305:596–620. doi: 10.2475/ajs.305.6-8.596
33. Jaisi DP, Blake RE, Kukkadapu RK. Fractionation of oxygen isotopes in phosphate during its interactions with iron oxides. Geochim Cosmochim Acta. (2010) 74:1309–19. doi: 10.1016/j.gca.2009.11.010
34. Gross A, Angert A. What processes control the oxygen isotopes of soil bio-available phosphate? Geochim Cosmochim Acta. (2015) 159:100–11. doi: 10.1016/j.gca.2015.03.023
35. Tamburini F, Pfahler V, von Sperber C, Frossard E, Bernasconi SM. Oxygen isotopes for unraveling phosphorus transformations in the soil–plant system: a review. Soil Sci Soc Am J. (2014) 78:38. doi: 10.2136/sssaj2013.05.0186dgs
36. Giambelluca TW, Chen Q, Frazier AG, Price JP, Chen Y-L, Chu P-S, et al. Online rainfall atlas of Hawai‘i. Bull Am Meteorol Soc. (2013) 94:313–6. doi: 10.1175/BAMS-D-11-00228.1
37. Chadwick OA, Gavenda RT, Kelly EF, Ziegler K, Olson CG, et al. The impact of climate on the biogeochemical functioning of volcanic soils. Chem Geol. (2003) 202:195–223. doi: 10.1016/j.chemgeo.2002.09.001
38. FAL RAC FAW. “pH-Wert in Wassersuspension (1:2.5) and pH-Wert in CaCl2-Suspension (1:2.5),” in Schweizerische Referenzmethoden der Eidgenössischen landwirtschaftlichen Forschungsanstalten [Agroscope Zürich, Changins, Wädenswil: Forschungsanstalt für Agrarökologie und Landbau (FAL), Recherche Agronomique Changins (RAC), Forschungsanstalt Wädenswil (FAW)] (1996).
39. Pansu M, Gautheyrou J. Mineralogical Separation by Selective Dissolution. In: Pansu M, Gautheyrou J, editors. Handbook of Soil Analysis: Mineralogical, Organic Inorganic Methods. Berlin: Springer (2006). p. 167–219.
40. Parfitt RL, Childs CW. Estimation of forms of Fe and Al: a review, and analysis of contrasting soils by dissolution and moessbauer methods. Soil Res. (1988) 26:121–44. doi: 10.1071/SR9880121
41. Kouno K, Tuchiya Y, Ando T. Measurement of soil microbial biomass phosphorus by an anion exchange membrane method. Soil Biol Biochem. (1995) 27:1353–7. doi: 10.1016/0038-0717(95)00057-L
42. Bünemann EK, Oberson A, Liebisch F, Keller F, Annaheim KE, Huguenin-Elie O, et al. Rapid microbial phosphorus immobilization dominates gross phosphorus fluxes in a grassland soil with low inorganic phosphorus availability. Soil Biol Biochem. (2012) 51:84–95. doi: 10.1016/j.soilbio.2012.04.012
43. Ohno T, Zibilske LM. Determination of low concentrations of phosphorus in soil extracts using malachite green. Soil Sci Soc Am J. (1991) 55:892–895. doi: 10.2136/sssaj1991.03615995005500030046x
44. Bowman RA. A sequential extraction procedure with concentrated sulfuric acid and dilute base for soil organic phosphorus. Soil Sci Soc Am J. (1989) 53:362–6. doi: 10.2136/sssaj1989.03615995005300020008x
45. Bünemann EK, Steinebrunner F, Smithson PC, Frossard E, Oberson A. Phosphorus dynamics in a highly weathered soil as revealed by isotopic labeling techniques. Soil Sci Soc Am J. (2004) 68:1645–55. doi: 10.2136/sssaj2004.1645
46. Jayachandran K, Hetrick BAD, Schwab AP. Partitioning dissolved inorganic and organic phosphorus using acidified molybdate and isobutanol. Soil Sci Soc Am J. (1992) 56:762–5. doi: 10.2136/sssaj1992.03615995005600030014x
47. Moir JO, Tiessen H. Characterization of available P by sequential extraction. In: Carter MR, editors. Soil Sampling Methods of Analysis. Boca Raton, FL: CRC Press (1993). p. 293–306.
48. Gibson J. Modern techniques for measuring the quenching correction in a liquid scintillation counter: a critical review. In: Peng C-T, Horrocks DL, Alpen LE, editors. Liquid Scintillation Counting, Recent Applications Development. San Francisco: Academic Press (1980). p. 153–172.
49. Randriamanantsoa L, Frossard E, Oberson A, Bünemann EK. Gross organic phosphorus mineralization rates can be assessed in a Ferralsol using an isotopic dilution method. Geoderma. (2015) 257–8:86–93. doi: 10.1016/j.geoderma.2015.01.003
50. Pistocchi C, Mészáros É, Tamburini F, Frossard E, Bünemann EK. Biological processes dominate phosphorus dynamics under low phosphorus availability in organic horizons of temperate forest soils. Soil Biol Biochem. (2018) 126:64–75. doi: 10.1016/j.soilbio.2018.08.013
51. Orlowski N, Frede HG, Brüggemann N, Breuer L. Validation and application of a cryogenic vacuum extraction system for soil and plant water extraction for isotope analysis. J Sensors Sens Syst. (2013) 2:179–93. doi: 10.5194/jsss-2-179-2013
52. Tamburini F, Bernasconi SM, Angert A, Weiner T, Frossard E. A method for the analysis of the δ18O of inorganic phosphate extracted from soils with HCl. Eur J Soil Sci. (2010) 61:1025–32. doi: 10.1111/j.1365-2389.2010.01290.x
53. Chang SJ, Blake RE. Precise calibration of equilibrium oxygen isotope fractionations between dissolved phosphate and water from 3 to 37°C. Geochim Cosmochim Acta. (2015) 150:314–29. doi: 10.1016/j.gca.2014.10.030
54. Hsieh JCC, Chadwick OA, Kelly EF, Savin SM. Oxygen isotopic composition of soil water: quantifying evaporation and transpiration. Geoderma. (1998) 82:269–93. doi: 10.1016/s0016-7061(97)00105-5
55. R Core Team. A language and environment for statistical computing. (2018). Available online at: http://www.r-project.org
56. Buehler S, Oberson A, Rao IM, Friesen DK, Frossard E. Sequential phosphorus extraction of a 33P-labeled oxisol under contrasting agricultural systems. Soil Sci Soc Am J. (2002) 66:868–77. doi: 10.2136/sssaj2002.8680
57. Vu DT, Tang C, Armstrong RD. Transformations and availability of phosphorus in three contrasting soil types from native and farming systems: a study using fractionation and isotopic labeling techniques. J Soils Sediments. (2010) 10:18–29. doi: 10.1007/s11368-009-0068-y
58. Condron LM, Newman S. Revisiting the fundamentals of phosphorus fractionation of sediments and soils. J Soils Sediments. (2011) 11:830–40. doi: 10.1007/s11368-011-0363-2
59. Klotzbücher A, Kaiser K, Klotzbücher T, Wolff M, Mikutta R. Testing mechanisms underlying the Hedley sequential phosphorus extraction of soils. J Plant Nutr Soil Sci. (2019) 182:570–7. doi: 10.1002/jpln.201800652
60. Gu C, Margenot AJ. Navigating limitations and opportunities of soil phosphorus fractionation. Plant Soil. (2021) 459:13–7. doi: 10.1007/s11104-020-04552-x
61. Daroub SH, Pierce FJ, Ellis BG. Phosphorus fractions and fate of phosphorus-33 in soils under plowing and no-tillage. Soil Sci Soc Am J. (2000) 64:170–6. doi: 10.2136/sssaj2000.641170x
62. Fardeau J-C, Morel C, Boniface R. Phosphate ion transfer from soil to soil solution: kinetic parameters. Agronomie. (1991) 11:787–97. doi: 10.1051/agro:19910909
63. Morel C, Tunney H, Plénet D, Pellerin S. Transfer of phosphate ions between soil and solution: perspectives in soil testing. J Environ Qual. (2000) 29:50–9. doi: 10.2134/jeq2000.00472425002900010007x
64. Gu C, Dam T, Hart SC, Turner BL, Chadwick OA, Berhe AA, et al. Quantifying uncertainties in sequential chemical extraction of soil phosphorus using XANES spectroscopy. Environ Sci Technol. (2020) 54:2257–67. doi: 10.1021/acs.est.9b05278
65. Tamburini F, Pfahler V, Bünemann EK, Guelland K, Bernasconi SM, Frossard E. Oxygen isotopes unravel the role of microorganisms in phosphate cycling in soils. Environ Sci Technol. (2012) 46:5956–62. doi: 10.1021/es300311h
66. Chapin FS, Barsdate RJ, Barèl D. Phosphorus cycling in Alaskan Coastal Tundra: a hypothesis for the regulation of nutrient cycling. Oikos. (1978) 31:189–99. doi: 10.2307/3543562
67. Cade-Menun BJJ. Using phosphorus-31 nuclear magnetic resonance spectroscopy to characterize organic phosphorus in environmental samples. In: Turner BL, Frossard E, Baldwin DS, editors. Organic Phosphorus in the Environment. Wallingford, CT: CAB International (2005). p. 21–44.
68. Tamburini F, Pistocchi C, Helfenstein J, Frossard E. A method to analyse the isotopic composition of oxygen associated to organic phosphorus in soil and plant material. Eur J Soil Sci. (2018) 69:816–26. doi: 10.1111/ejss.12693
69. Jarosch KA, Doolette AL, Smernik RJ, Tamburini F, Frossard E, Bünemann EK. Characterisation of soil organic phosphorus in NaOH-EDTA extracts: a comparison of 31P NMR spectroscopy and enzyme addition assays. Soil Biol Biochem. (2015) 91:298–309. doi: 10.1016/j.soilbio.2015.09.010
70. Torn MS, Trumbore SE, Chadwick OA, Vitousek PM, Hendricks DM. Mineral control of soil organic carbon storage and turnover. Nature. (1997) 389:3601–3. doi: 10.1038/38260
71. Mikutta R, Schaumann GE, Gildemeister D, Bonneville S, Kramer MG, Chorover J, et al. Biogeochemistry of mineral–organic associations across a long-term mineralogical soil gradient (0.3–4100kyr), Hawaiian Islands. Geochim Cosmochim Acta. (2009) 73:2034–60. doi: 10.1016/j.gca.2008.12.028
72. Kramer MG, Sanderman J, Chadwick OA, Chorover J, Vitousek PM. Long-term carbon storage through retention of dissolved aromatic acids by reactive particles in soil. Glob Chang Biol. (2012) 18:2594–605. doi: 10.1111/j.1365-2486.2012.02681.x
73. Kleber M, Sollins P, Sutton R. A conceptual model of organo-mineral interactions in soils: self-assembly of organic molecular fragments into zonal structures on mineral surfaces. Biogeochemistry. (2007) 85:9–24. doi: 10.1007/s10533-007-9103-5
74. Walworth JL. Soil drying and rewetting, or freezing and thawing, affects soil solution composition. Soil Sci Soc Am J. (1992) 56:433–7. doi: 10.2136/sssaj1992.03615995005600020015x
75. Manzoni S, Katul G. Invariant soil water potential at zero microbial respiration explained by hydrological discontinuity in dry soils. Geophys Res Lett. (2014) 41:7151–8. doi: 10.1002/2014GL061467
76. Lis H, Weiner T, Pitt FD, Keren N, Angert A. Phosphate uptake by cyanobacteria is associated with kinetic fractionation of phosphate oxygen isotopes. ACS Earth Sp Chem. (2019) 3:233–9. doi: 10.1021/acsearthspacechem.8b00099
77. Bouskill NJ, Wood TE, Baran R, Ye Z, Bowen BP, Lim H, et al. Belowground response to drought in a tropical forest soil. I. Changes in Microbial Functional Potential and Metabolism. Front Microbiol. (2016) 7:525. doi: 10.3389/fmicb.2016.00525
78. Liang Y, Blake RE. Oxygen isotope signature of Pi regeneration from organic compounds by phosphomonoesterases and photooxidation. Geochimica et Cosmochimica Acta. (2006) 70:3957–69. doi: 10.1016/j.gca.2006.04.036
79. Blagodatskaya E, Kuzyakov Y. Active microorganisms in soil: critical review of estimation criteria and approaches. Soil Biol Biochem. (2013) 67:192–211. doi: 10.1016/j.soilbio.2013.08.024
Keywords: andosols, andisols, climatic gradient, oxygen isotopes in phosphate, phosphorus cycling, phosphorus radioisotopes, turnover, mean residence time
Citation: Helfenstein J, Frossard E, Pistocchi C, Chadwick O, Vitousek P and Tamburini F (2021) Soil Phosphorus Exchange as Affected by Drying-Rewetting of Three Soils From a Hawaiian Climatic Gradient. Front. Soil Sci. 1:738464. doi: 10.3389/fsoil.2021.738464
Received: 08 July 2021; Accepted: 11 October 2021;
Published: 02 November 2021.
Edited by:
Hermann Jungkunst, University of Koblenz and Landau, GermanyReviewed by:
Jiabao Li, Chinese Academy of Sciences (CAS), ChinaFrancisco Javier Matus, University of La Frontera Temuco, Chile
Copyright © 2021 Helfenstein, Frossard, Pistocchi, Chadwick, Vitousek and Tamburini. This is an open-access article distributed under the terms of the Creative Commons Attribution License (CC BY). The use, distribution or reproduction in other forums is permitted, provided the original author(s) and the copyright owner(s) are credited and that the original publication in this journal is cited, in accordance with accepted academic practice. No use, distribution or reproduction is permitted which does not comply with these terms.
*Correspondence: Federica Tamburini, ZmFkZXJpY2EudGFtYnVyaW5pQHVzeXMuZXRoei5jaA==
†Present Address: Julian Helfenstein, Agroscope, Zürich, Switzerland