 Mohamed Boullouz1,2
 Prem S. Bindraban2*Isaac N. Kissiedu2Anselme K. K. Kouame2
 Krishna P. Devkota3
 Williams K. Atakora2
- 1School of Agriculture, Fertilization, and Environmental Sciences (ESAFE), Mohammed VI Polytechnic University (UM6P), Ben Guerir, Morocco
- 2International Fertilizer Development Center, Accra, Ghana
- 3African Sustainable Agriculture Research Institute (ASARI), Mohammed VI Polytechnic University (UM6P), Laayoune, Morocco
In Ghana, maize (Zea mays) is a crop crucial to achieving food and nutrition security. Maize consumption has increased exponentially over the past decades and contributes to 25% of the caloric consumption in the country. In order to assist in decision-making and guide investment in sustainable intensification of maize production, this study set out to identify the determinants of yield and to arrive at potential interventions for closing the maize yield gap. These were quantified using analytical approaches that combine a light use efficiency crop model (LINTUL-1) with statistical and geospatial analyses. Legacy data, auxiliary covariables, and maize fertilizer trials on eight experimental stations in Ghana were used in this study. Overall, the maize yield gap across the stations and trial treatments ranged from 17% to 98%. The variation in yield gap within a single station indicates a significant scope for closing the yield gap through site-specific nutrient management. Multiple linear regression models that explained 81% of the variability in maize yield gap identified soil organic matter, soil water-holding capacity, root zone depth, rainfall, sulfur fertilizer, and nitrogen fertilizer, in that order of importance, as the major determinants for closing the yield gap in the major agroecological zones of Ghana. The yield gap decreased by 1.4 t ha-1 with a 1% increase in soil organic matter. A 1 mm increase of the soil water-holding capacity reduced the yield gap by 1.06 t ha-1, while an increase in pH and in the application of potassium fertilizer widened the gap. These results suggest that both soil physical and chemical properties, together with weather data, should be taken into consideration to arrive at site-specific fertilizer recommendation and other agronomic practices.
1. Introduction
In Ghana, maize is a major food crop and is cultivated throughout the country (1), accounting for more than half of the country’s total cereal output. The Eastern, Ashanti, and Brong-Ahafo regions of Ghana produce approximately 80% of the country’s total maize and the remainder is produced in the three northern regions, i.e., Northern, Upper East, and Upper West. The high domestic demand for maize as food for humans (constitutes 25% of consumed calories) (2) or as livestock feed make it a valuable source of income for a large community of smallholder farmers. However, the yield of maize does not exceed 1.9 metric tons per hectare (t ha-1), which is far below the reported potential yield of 4-6 t ha-1 (3). Maize production is predominantly rainfed rather than irrigated, the latter accounting for only 2% of the total arable land in the country (4). In the rainfed system, the crop often suffers from water stress due the erratic and highly variable unimodal and bimodal rainfall patterns.
On average, the application rate of fertilizer in Ghana is 20 kg ha-1 (5), with major differences in application rates between farmers and average maize yields of 1.9 t ha-1. The large difference in application rates among famers with low yields implies a low fertilizer use efficiency (6). The low inherent soil fertility limits the yield response to fertilizer (7). These findings suggest that the amount of fertilizer is not the only factor affecting the yield of maize. According to Kouame et al. (8), the yield of maize in Ghana is subject to several factors that affect its response to fertilizer, such as soil water-holding capacity, root zone depth, rainfall, temperature, pH, available phosphorus, and soil organic matter. Hence, understanding the yield gap, i.e., the difference between the potential maize yield and the observed yield as well as the determinants for closing this gap could provide relevant insights for formulating effective technological and policy interventions for improving maize self-sufficiency.
The difference in the potential yield, i.e., the yield obtained under optimal growth conditions, and the observed yield constitute the yield gap (9, 10). Previous studies have reported a yield gap in maize between 67% and 87% over the water-limited yield in the northern regions of Ghana (11). However, the determinants of the yield gap are still not understood. Crop models are used to estimate yield potential. In Ghana, models such as the Agricultural Production Systems sIMulator (APSIM) (12) and Decision Support System for Agrotechnology Transfer (DSSAT) (13) have been used to estimate maize yield under various conditions. However, these comprehensive models require a large amount of data for parameterization, calibration, and validation, including crop physiological processes, agronomic management, physical and chemical soil properties, and various weather variables (14). Even the minimum dataset required to run DSSAT, for instance, is still large (15), and data paucity for Ghana hampers effective application of the models.
LINTUL-1, a generic crop model developed by Spitters (16), is a summary crop model that simulates the potential yield as a function of light use efficiency (LUE) and the leaf area index (LAI) of the crop (Figure 1). LINTUL-2 was subsequently developed to simulate water-limited yield by incorporating a soil-water balance module (18), and LINTUL-3 to simulate nitrogen-limited yield gap (19). Intercepted photosynthetically active radiation (IPAR) and LUE regulate the daily growth in the model based on the Beer–Lambert law. In the model, the subsequent allocation of dry matter is determined by crop development as a function of temperature during the growth cycle. LINTUL synthesizes basic plant physiological and edaphic processes into generic rules, with a low data requirement that can efficiently support research on yield gap analyses for decision-making to enhance yield in data-poor environments, such as Ghana. In this study, the LINTUL-1 model was therefore used to calculate the potential yield of maize to subsequently quantify the yield gap from experimental data and analyze the determinants of this gap through multiple linear regression methods. This comprehensive approach, based on multiple data sources and a combination of crop modeling, advanced statistics, and spatial analysis, allows calculation of the yield gap and identification of its determinants. The potential yield and yield gap maps provide a guideline for spatial explicit investments and interventions in Ghana to raise maize yield and self-sufficiency.
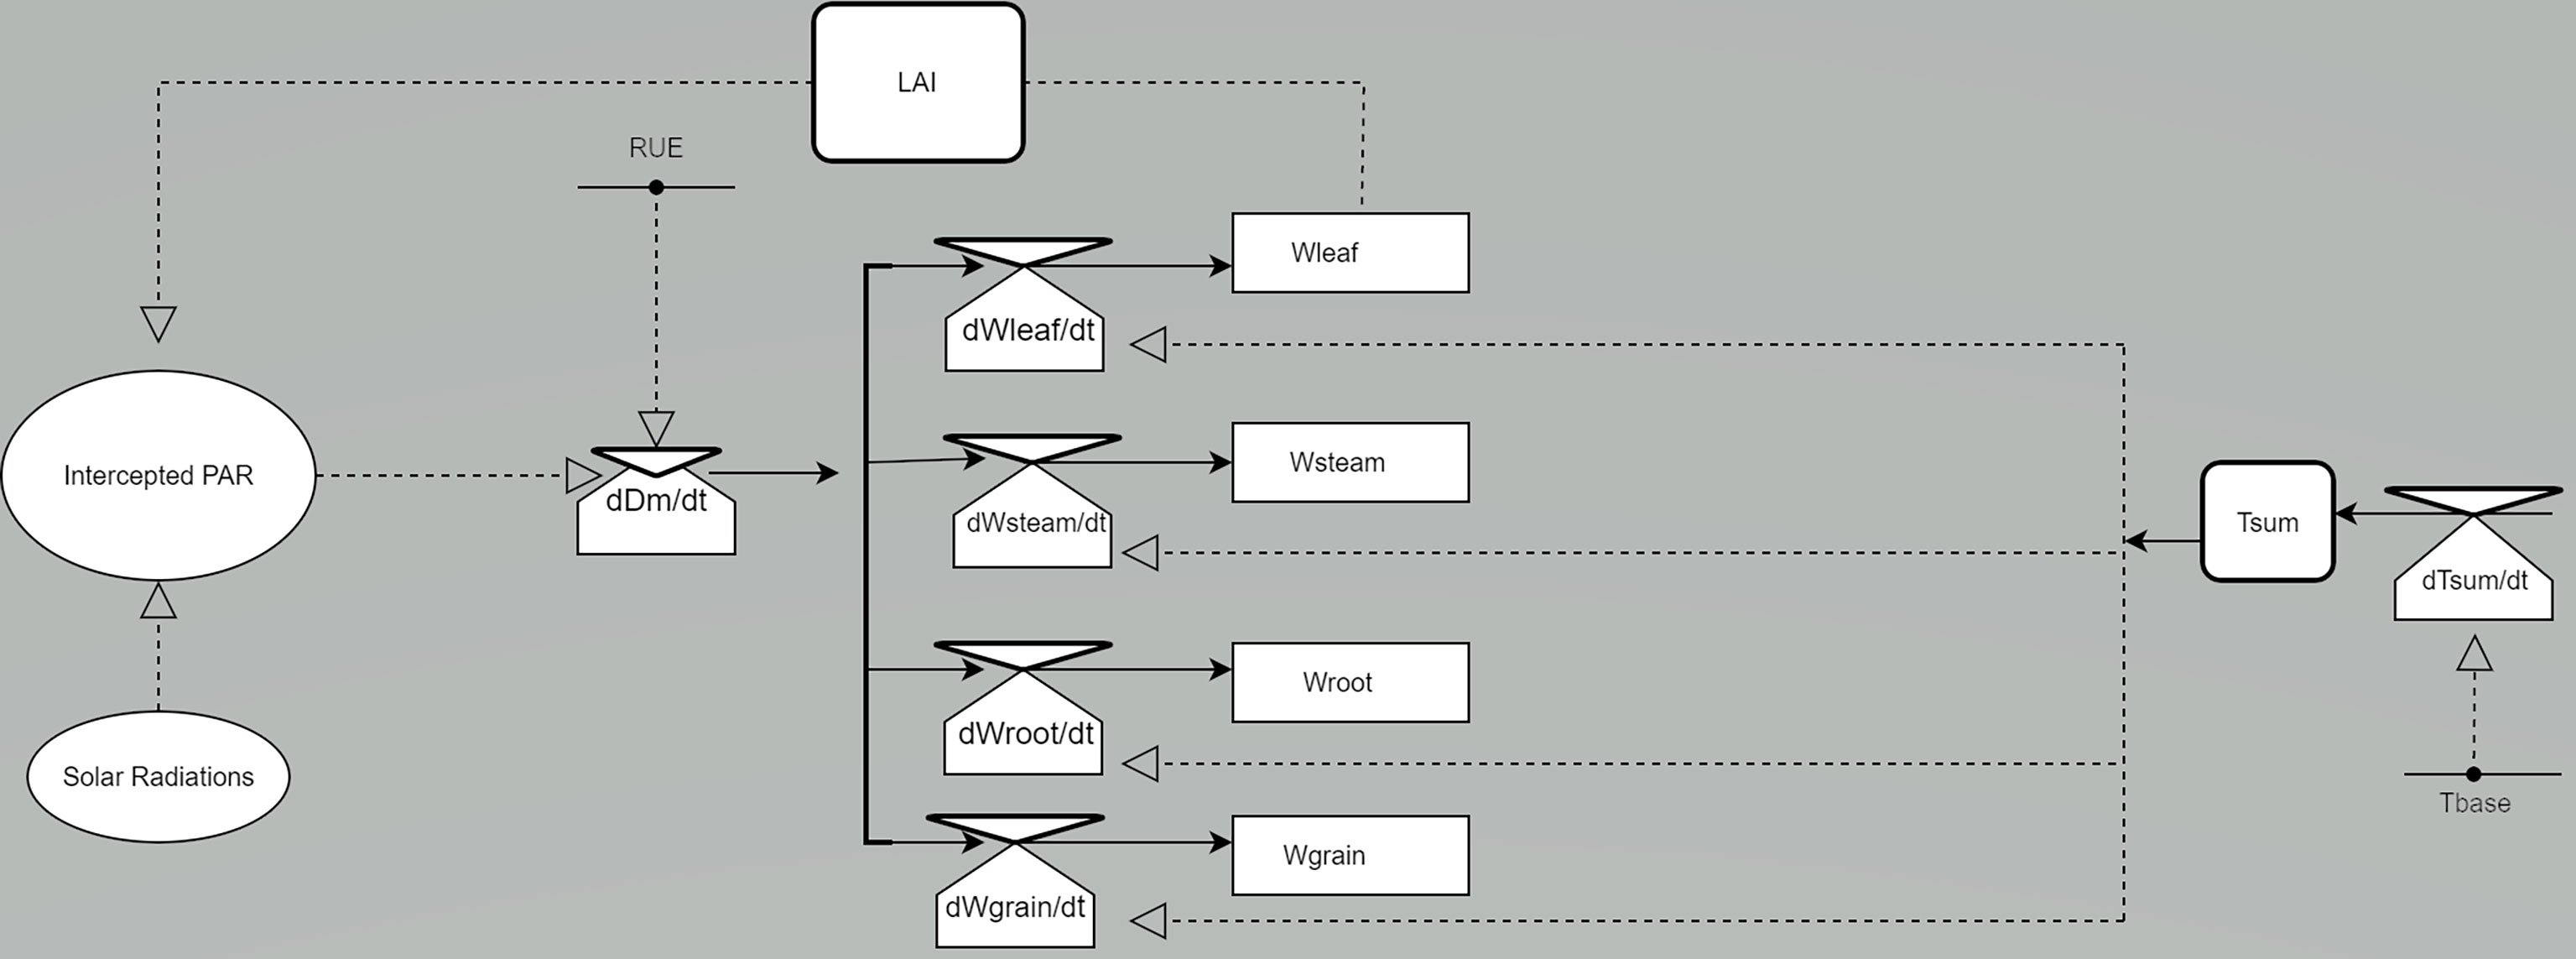
Figure 1 Relational diagram of LINTUL-1 to simulate the potential yield [modified from Nyombi (17)]. Wleaf, weight of leaves; Wstem, weight of stems; Wroot, weight of roots; Wgrain, weight of grain; Dm, dry matter. LAI, leaf area index; Tbase, the low lowest temperature for the crop to grow; PAR, photosynthetic active radiation; RUE, Radiation (light) use efficiency; Tsum, accumulated temperature.
2. Materials and methods
2.1. Study area
During the 2020 growing season, several fertilizer trials on maize were conducted by the Fertilizer Research and Responsible Implementation (FERARI)1 program, implemented by the International Fertilizer Development Center (IFDC). These trials were conducted in eight locations, i.e., Ejura, Mampong, Nyankpala, Wenchi, Kwame Nkrumah University of Science and Technology (KNUST), Sunyani, Ashanti Anwomaso and Ashanti Ayeduase (Figure 2). Different nutrient treatments were applied, and the soil, weather, fertilizer rate, observed yield, and simulated potential yield data were used to analyze the yield gap.

Figure 2 The location studied by the FERARI project in 2020, data derived from this location was used for the calibration of LINTUL-1 and for the yield gap analysis.
2.2. Experimental design
A randomized complete block design was used to establish experimental plots of 5 m × 5 m (25 m2). Subsequently, inside the 25 m2 plot, two sub-plots of 4 m2 each were randomly selected in the field and used for harvest and yield determination. Maize seeds of the Omankwa variety were sown at approximately 5 cm depth in normal soil in all sites. The seeds were planted at 75 cm x 40 cm spacing, with a density of 33,333 plants per hectare. Fertilizer treatments were applied with three or four replications across the study sites, which were considered independent data points for the yield gap analysis (Tables 1, 2); the different number of replications was due to different resource availability at the study sites. For micronutrient application, both foliar and soil application were practiced. However, the application method for fertilizer was not considered in this study to explain the yield gap. Table 3 shows further details about the crop management and studied area.
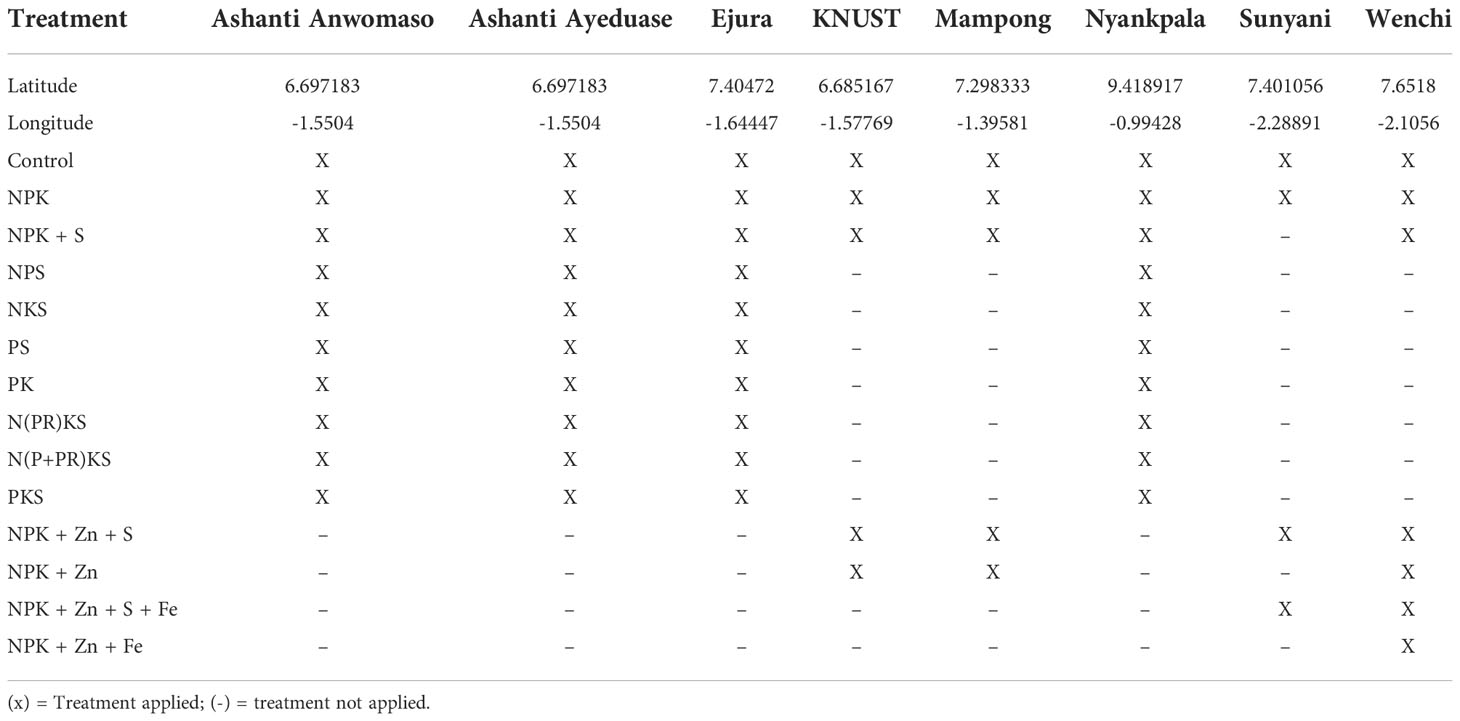
Table 1 Fertilizer treatments applied on the study sites.
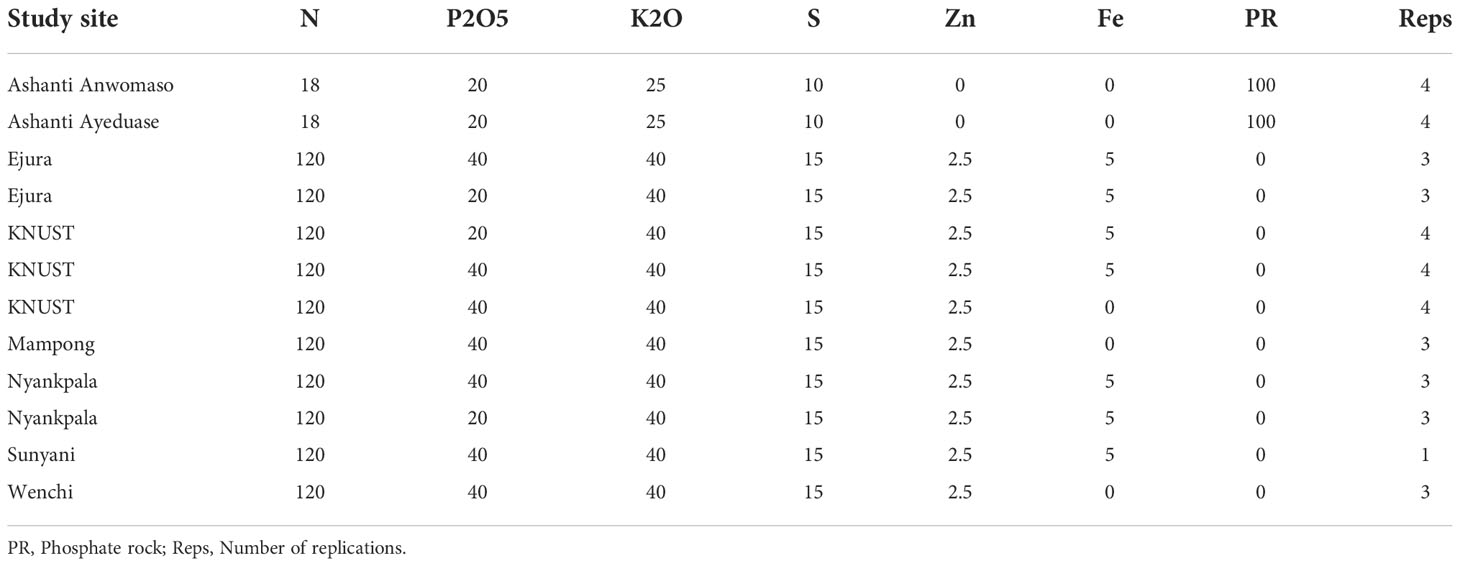
Table 2 Fertilizer application rates (kg ha-1) at the study sites.
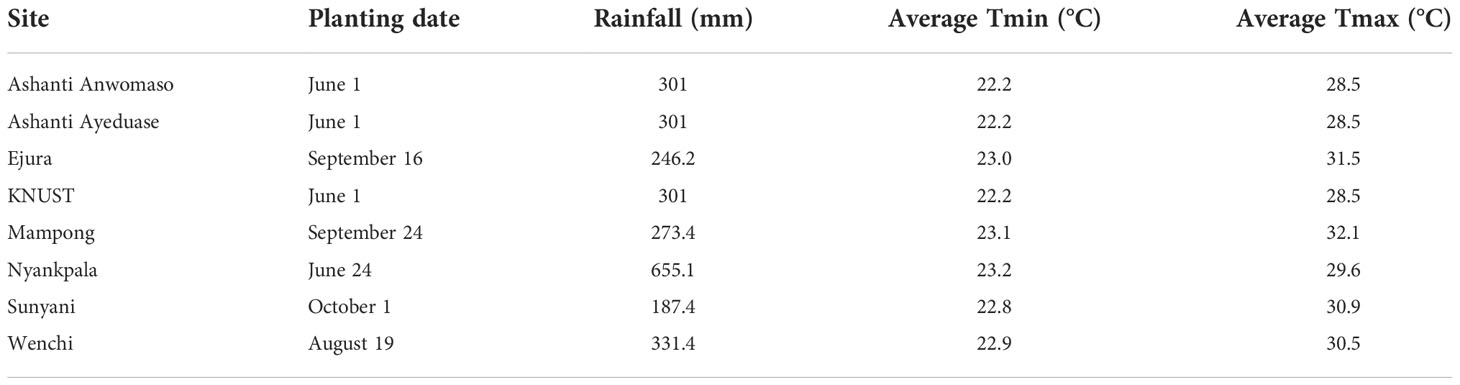
Table 3 Sowing dates, total rainfall, and the average minimum temperature and maximum temperatures during the experimental period at the study sites during 2020.
2.3. Data collection
2.3.1. Crop growth and yield
The recorded agronomic data of maize yield, crop cycle duration, and required temperature to reach maturity and anthesis from FERARI experimental sites (Figure 2) for 2020 were used to calibrate the LINTUL-1 crop model, quantify the yield gap, and analyze the effect of various factors in explaining the yield gap among the experiments.
2.3.2. Climatic data
The weather data for FERARI study sites and for the randomly selected points at the district level were downloaded from ERA5-Land, developed by Muñoz-Sabater (20), at 11 km resolution, which is considered acceptable because the variance of weather data in a small-scale area is relatively minor. The Google Earth Engine interface and the geographical coordinates to access this dataset were used.
2.3.3. Soil data
Before sampling the soil in the studied locations (Figure 2), the field trials were delineated into at least three zones (or sub-plots) based mainly on the terrain characteristics and drainage conditions. Soil samples were then randomly collected from each sub-plot using a handheld auger and core sampler. Around 10 soil samples were collected from the 0–20 cm depth from each sub-plot. For each study site, the collected samples were mixed and packed in 500 g plastic bags for laboratory analysis.
The modified Walkley and Black Procedure, described by Nelson and Sommers (21), was used to determine organic carbon. The Bray 1 extraction solution method (22) was used to determine available soil phosphorus. NH4OAc solution (0.1 M neutral) was used to extract the exchangeable bases, such as Ca2+, Mg2+, K+, and Na+; the exchangeable acids were extracted with a 1.0 M KCl solution, as described by Page et al. (23). The HT 9017 pH meter was used to measure the pH in a 10 g soil sample. Soil water-holding capacity and root zone depth were obtained from the ISRIC SoilGrids Africa soil property map, with a spatial resolution of 1 km (24).
2.4. LINTUL-1 framework
LINTUL-1 is a mechanistic model that uses light interception and light use efficiency to simulate biomass production and yield. IPAR, described in Eq. 1, is a function of the photosynthetically active part of the daily total radiation (RPAR; 400 nm to 700 nm, or 0.5 of the total radiation intercepted by the earth [Eq. 2, FPAR]), leaf area index (LAI), and the extinction coefficient of light (K) (16).
The growth of LAI (GLAI) during the juvenile stage (Tsum< 330 growing degree days [GDD], or LAI< 0.75 m2 m-2) is described as the exponential growth stage (Eq. 3; 25). After the juvenile stage, the GLAI depends on the amount of the allocated dry matter to the leaves multiplied by the specific leaf area (SLA; Eq. 4). The SLA in LINTUL is constant throughout the simulation period.
Leaf senescence reduces the LAI and the leaf weight and is a function of leaf death due to aging (RDRDV) or shading (RDRSH). The relative death rate (RDR) used is the highest of the RDRDV and RDRSH. However, leaf death due to aging occurs only after anthesis, while death due to shading is a function of the LAI itself. When the LAI reaches a critical value (LAIcr), the photosynthetic active radiation (PAR) does not reach the leaves in the bottom part of the crop, which start to die. The maximum death rate due to shading (RDRSHM) is a standard value used to calculate RDRSH in Eq. 5. The reduction of the LAI due to leaf death or senescence (DLAI) is quantified by Eq. 6, and the daily total growth or reduction of LAI (RLAI) is calculated by Eq. 7.
The partitioning coefficient of dry matter to the leaves (FLV), stem (FST), roots (FRT), and storage organs (FSO) follows the development stage of the crop. During the vegetative stage and under the potential conditions, most of the dry matter is allocated to the leaves, then to the roots and to the stems. And during the reproductive stage, the crop allocates the dry matter increasingly more to the storage organs (Eq. 8).
The total daily produced dry matter (GTOTAL; Eq. 9) is a function of IPAR (Eq. 1) and of the light use efficiency (LUE) of the crop. The LUE is measured from field experiments as the slope of the linear regression between the dry matter produced and IPAR and is considered constant during the crop cycle. LUE is a crop parameter that must be provided for the model to run the simulation.
The following are LINTUL-1 crop model equations, explained based on Spitters (16) and Van Oijen and leffelaar (25). The model is programmed in R with the Rstudio interface.
DELT: Time step of integration (1 day); RGRL: Relative growth rate of leaf area; DTEFF: Daily effective temperature. RWLVG: Relative growth of the leaves.
2.5. Calibration and validation of LINTUL-1
The calibration of LINTUL-1 was achieved by adjusting the thermal time to maturity and to anthesis to properly simulate the crop duration. The associated partitioning coefficient of dry matter to different crop organs was adjusted to this duration. The treatment within one of the study sites where the yield was the highest and could be considered the closest to the potential yield was selected for this adjustment. The adjustments for the SLA, the growth rate of the leaves during the exponential stage, and radiation (light) use efficiency were obtained from literature for a similar short-season maize variety (BH660) used widely in sub-Saharan Africa. In general, SLA in LINTUL-1 is constant, according to Farré et al. (26). The SLA value at the flowering stage is used in LINTUL-1. LINTUL-1 uses a constant LUE rate throughout the crop cycle, assuming a linear relationship between the biomass produced by the crop and the intercepted radiations (16). Therefore, the LUE was calculated, based on the work of Srivastava et al. (27), as the average of LUE during different development stages of maize.
2.6. Simulation of the potential yield, harvest index, and vegetative biomass
The calibrated LINTUL-1 in this study was used to simulate the potential yield, harvest index, and vegetative biomass. The sowing date of each study site was used in the simulations (Table 3). The effect of temperature and solar radiation variability on the yield of maize was studied based on the results generated by LINTUL-1. The yield gap for each studied site was calculated by subtracting the measured yield from the simulated potential yield.
2.7. Geospatial analysis of maize potential yield and yield gap
To construct the potential yield and the yield gap map of maize in Ghana, MODIS Land Cover Map at 500 m resolution (28) was used to randomly select 10 points per district (Figure 3). The landcover map layers of the LC_Type2 Dataset were reclassified as non-agricultural land and as agricultural land (at least 60% of the land is cultivated); therefore, some districts, especially in the northern regions, had less than 10 points because the area of cropland in these districts is small. In general, through random selection, more points were selected in the southern part because the density of cropland in this area is high and because the district size in the south is small compared to the north.
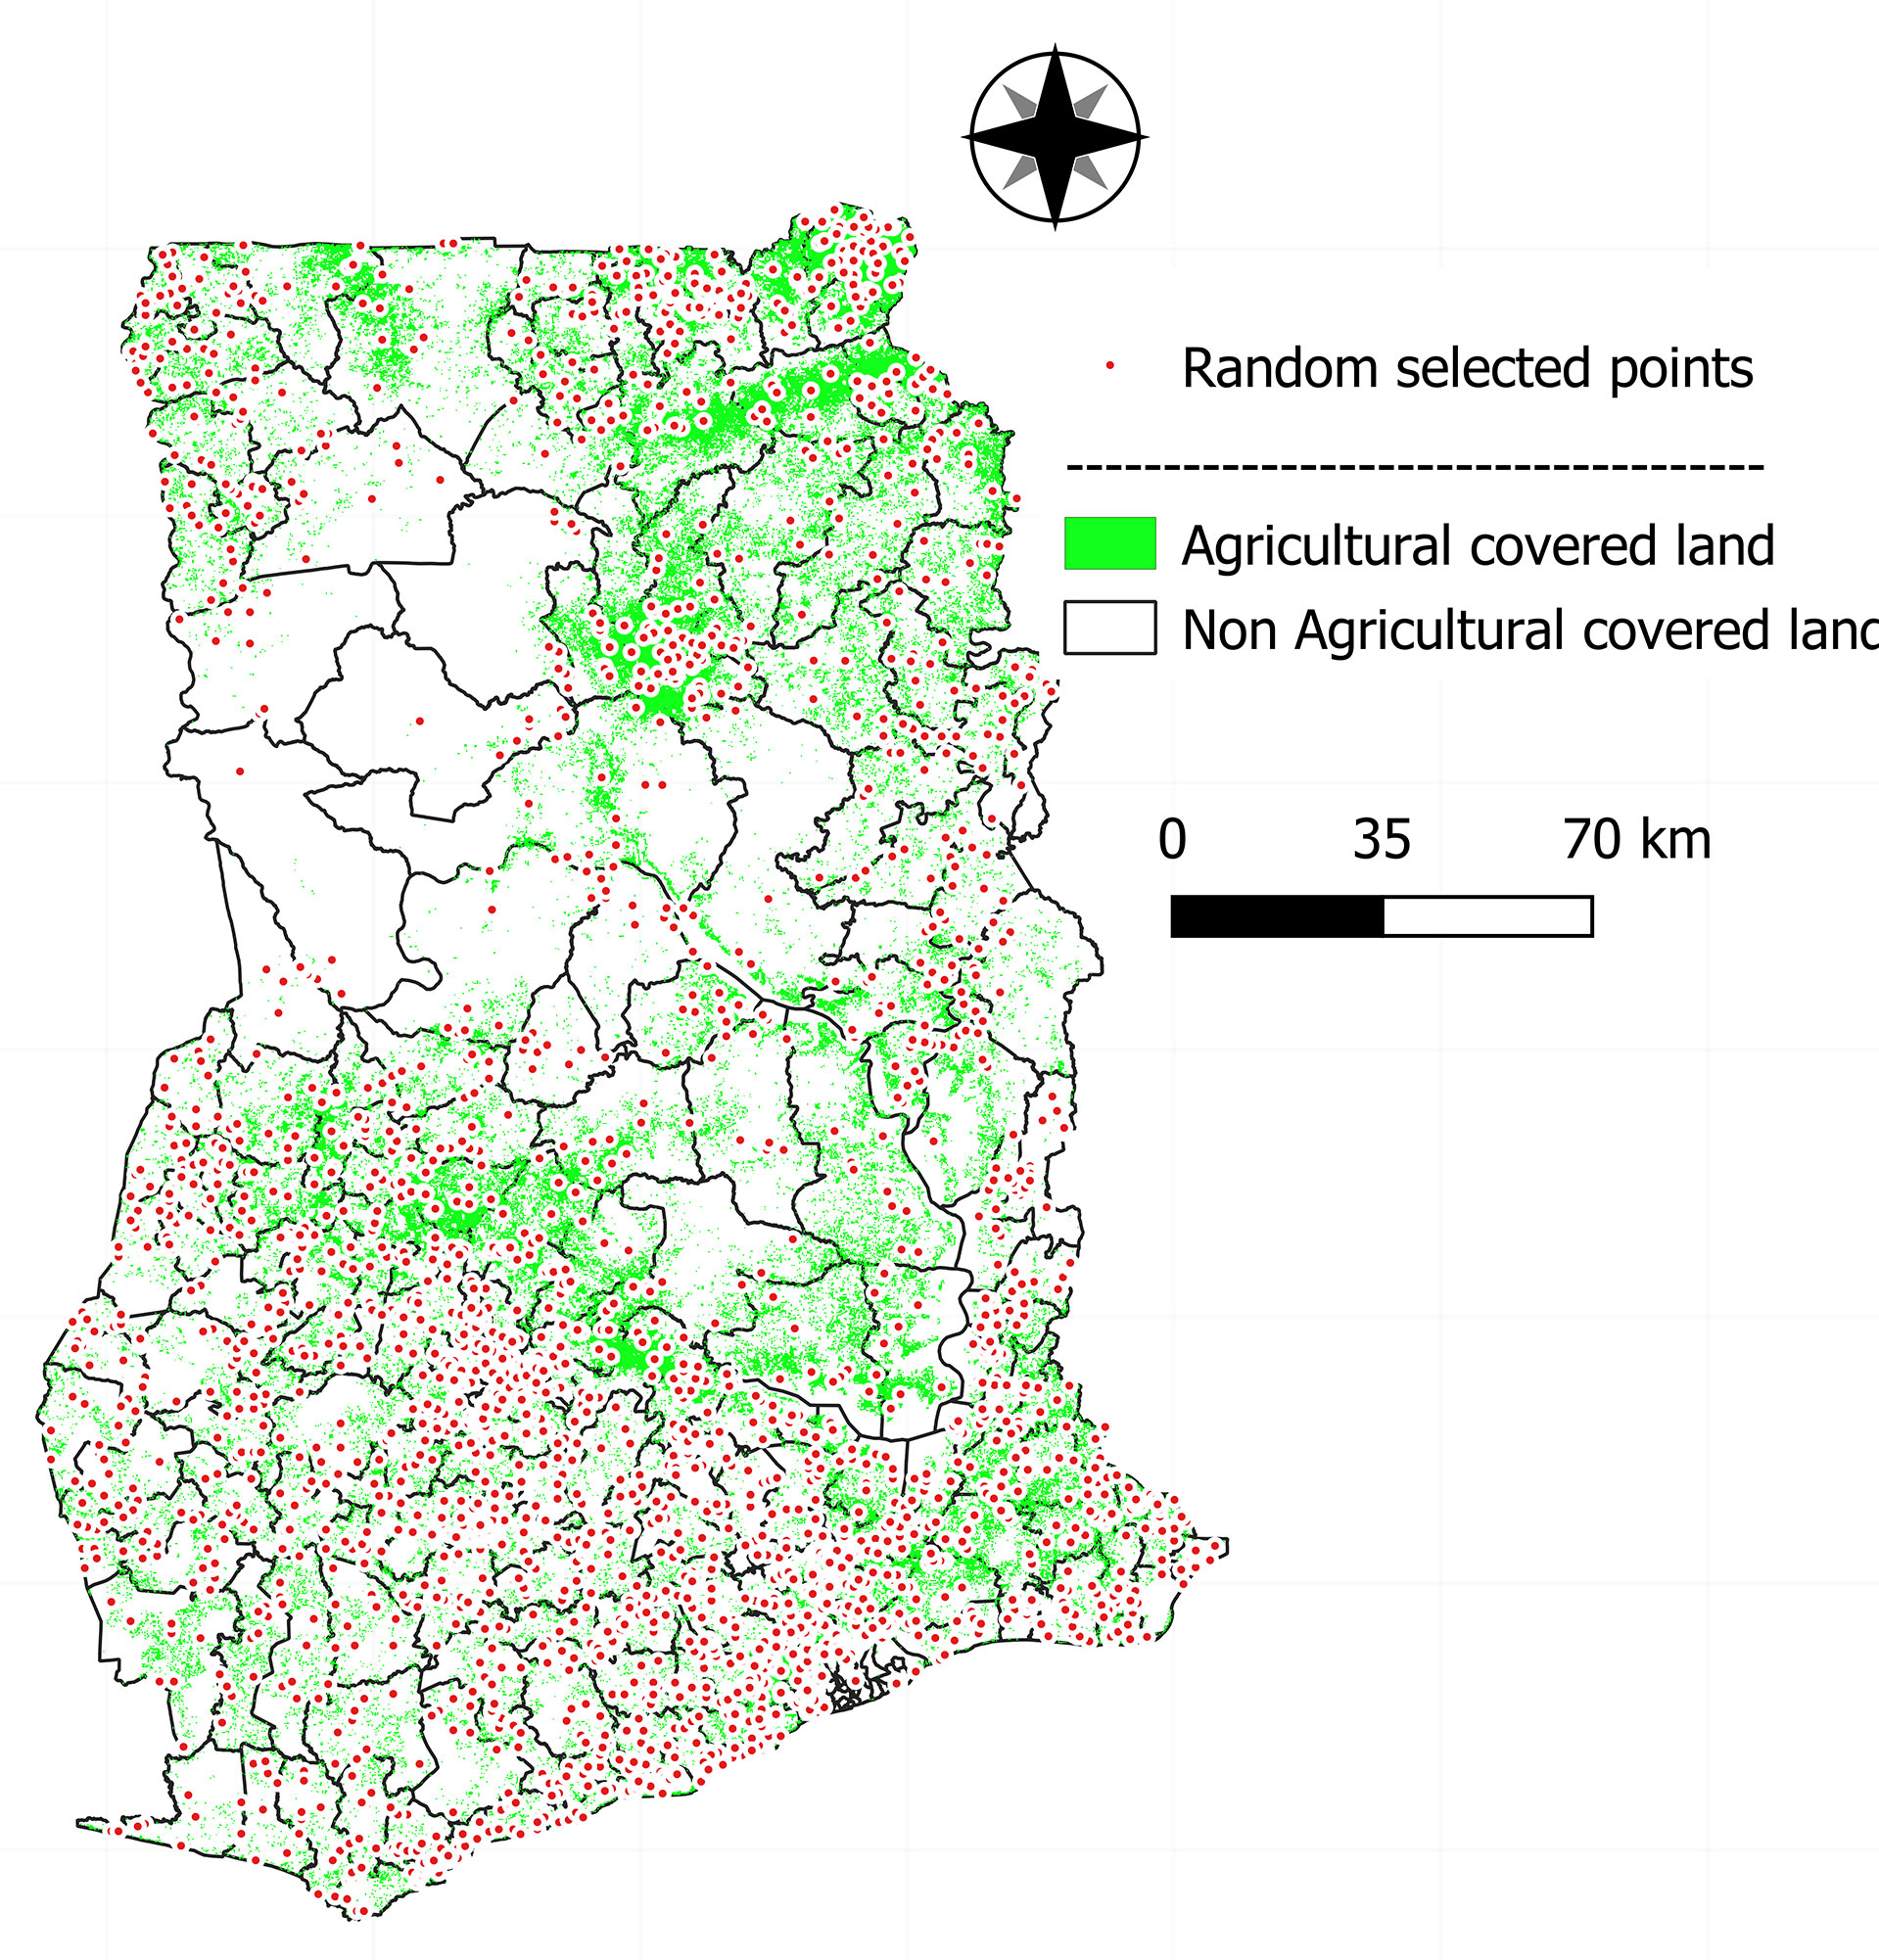
Figure 3 Randomly selected points at district level in Ghana for maize potential yield and yield gap maps.
The weather data extracted from ERA5-Land (20) for the 2,340 randomly selected points at the district level were used to simulate the potential yield at each geographic point. The calibrated LINTUL-1 in this study was used. June 1 (Julian day 152) was considered as the sowing date for the simulation based on the literature and because the period between May to June is widely considered the best time for sowing (29).
The actual maize yields at the district level from the Ghana Open Data Initiative2 were used to calculate the yield gap. For this reason, the observed yields in each district were assigned to selected points within the respective district. Accordingly, the yield gap of maize was calculated for all 2,340 points by subtracting the actual (district-level) yield from the potential yield at each selected point within the districts. QGIS with ordinary kriging was used to predict and extrapolate the potential yield and the yield gap at 1,000 m resolution for the entire country. In addition, the observed yield was mapped with 2000 m resolution using the inverse distance weighting interpolation method. This method of interpolation was chosen due to the low amount of available data, as the observed yield was aggregated at the district level.
2.8. Determinants of yield gap
Multiple linear regression (MLR) was used to identify the determinant factors that contributed to explaining the yield gap in the study sites. The calculated yield gap was used as a dependent variable (y) and other covariates as independent variables (X1, X2, X3, X4, X5, Xn), whereas β was the regression coefficient of each covariate (Eq. 11). Soil, rainfall, fertilizer application rate, and the yield gap data from each site were used to build a dataset. The dataset was randomly split into two parts; 70% of the dataset was used for building, training, and selecting the regression model, and 30% was used to test the model.
The MLR was built based on a stepwise bidirectional elimination method. The Akaike information criterion function (stepAIC) was called from the MASS package in RStudio.3 The AIC method was used to select the best regression model over several possible models based on the AIC score; the model with the lowest AIC score was selected. AIC uses the maximum likelihood estimate (L) and the number of independent variables (K) in the model to calculate the AIC score of the model (Eq. 12; 30). However, to improve the accuracy and reduce the standard error, the model selected according to stepAIC was checked for multicollinearity using the variance inflation factor (VIF), which determines how much the variance of a regression coefficient is inflated because of model multicollinearity. The VIF function in R programming was called from car package.4 Accordingly, the highly correlated variables were dropped from the dataset, and the process was repeated until the AIC function selected the best model with non-multicollinearity; VIF< 10 is considered the tolerance level of multicollinearity according to Kim (31).
Finally, the selected regression model was tested using 30% of the dataset previously determined through a random process for this purpose. The root mean square error (RMSE) and the coefficient of determination (R²) were used to test the accuracy of the model. The RMSE is the square root of the mean of the square of the errors between the predicted yield gap (Pg) and the observed yield gap (Og) in the 30% dataset used to test the model (Eq. 13). The coefficient of determination (R²) shows the fraction of variance in the dependent variable that is explained by the independent variables; it is measured as the ratio of the sum of squares due to regression (RSS) and the total sum of squares (TSS; Eq. 14).
2.9. Statistical analysis
The daily variability of the temperature was studied using the non-parametric Kruskal–Wallis test, which is based on ranking of the observations and does not require the assumption of normality. It compares the medians of three or more unpaired groups; values are sorted from low to high, and analyses are based on distribution of those rankings (32). The simulated potential yield was used to calculate the yield gap from the observed yield for the respective study sites. Duncan’s New Multiple range test was used for the statistical analysis to identify the significance difference for the comparison of the observed yield and of the yield gap among different fertilizer treatments and across the study sites. Multiple linear regression and Pearson correlation coefficient were used to determine the effect and the relationships between the simulated harvest index and the variability of temperature and IPAR between the vegetative and the reproductive stages.
3. Results and discussion
3.1. Soil analysis
The chemical properties of the collected soil samples from the experiment fields are shown in Table 4. The results indicated a low to moderate pH. The measured cation exchange capacity (CEC) was very low in all the study locations, and the low organic matter content indicates low fertility of the soils.
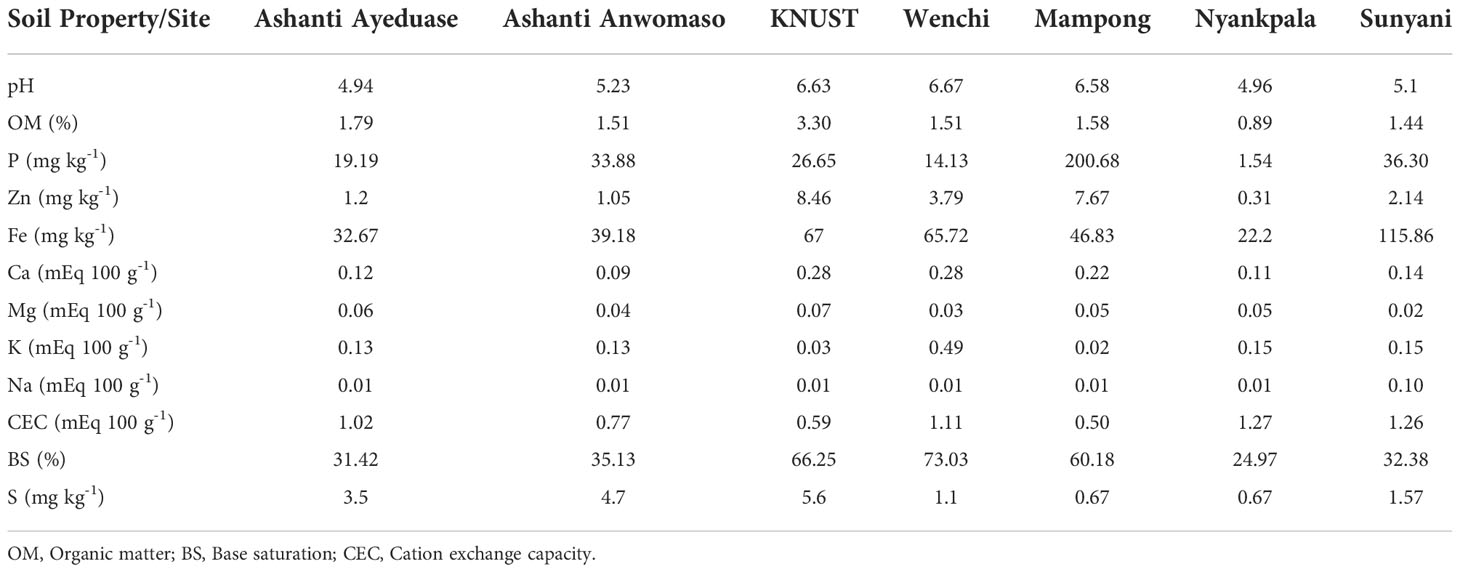
Table 4 Soil properties of sampled soils at the experimental sites.
3.2. Calibration of LINTUL-1
3.2.1. Crop parameters
Figure 4 shows the observed yield in the study sites. An average yield of 4.5 t ha-1 was obtained in Ejura station, which was significantly higher compared to all other study sites. The highest yield in Ejura was 6 t ha-1 from the application of NPS fertilizer. This yield was comparable to the achievable yield of 5 t ha-1 reported by Adu et al. (29) for the Omankwa variety used in the study sites. Therefore, the recorded effective temperature in Ejura was used to calculate the required thermal time for maize to reach anthesis and maturity.
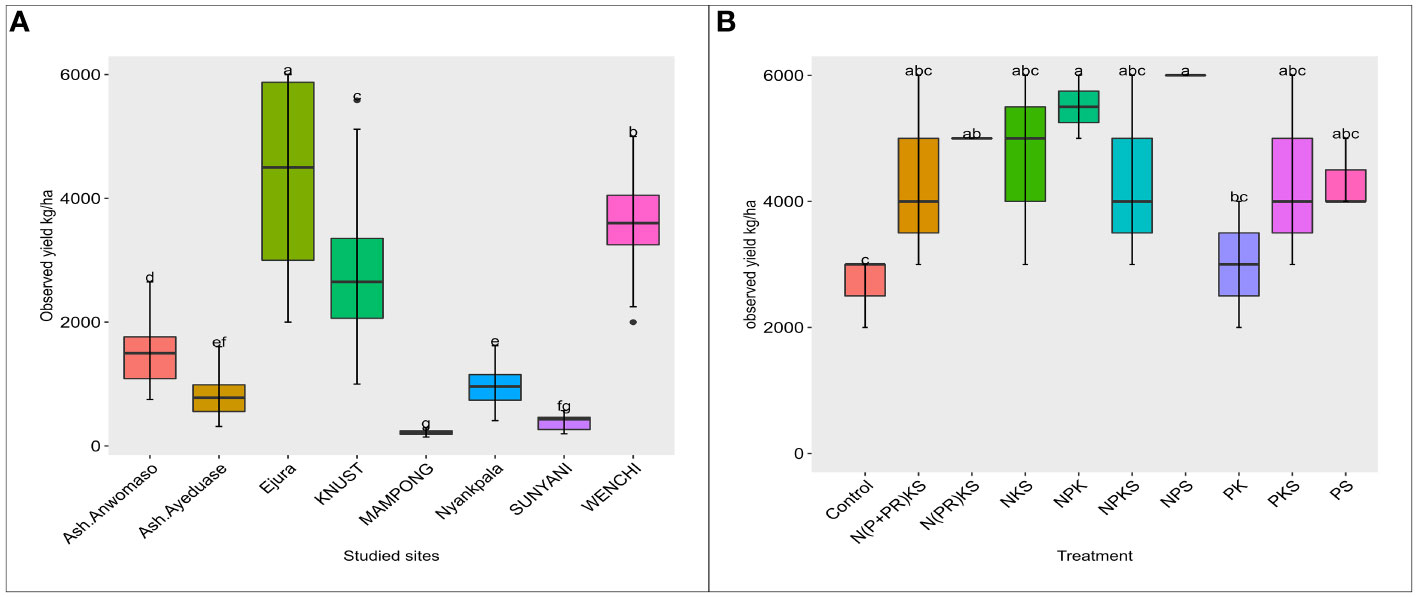
Figure 4 (A) Observed yield among study sites; (B) observed yield at Ejura by treatment. The small letters are the significance of the statistical differences of the treatments. The only meaning is to show which treatment are significantly different and the ones that are not significantly different. The letters were automatically generated by the statistical test.
Table 5 shows the adjusted initial crop parameters for the calibrated LINTUL-1. The thermal time required between sowing and anthesis is somewhat longer in Ghana compared to the original value in the model, which was used in Spain by Farré et al. (26). The calculated values from emergence to anthesis of 1,027 growing degree days (GDD) and 1,796 GDD to maturity were in the range that was reported by Srivastava et al. (27) for two maize varieties (BH660 and Obatanpa). It took 796 GDD in this study for the crop to develop from anthesis to maturity. Similarly, MacCarthy et al. (33) reported 750 GDD for Obatanpa maize. LUE of 2.26 g Mj-1 used in this study was lower than the LUE of 4.6 g Mj-1 used by Farré et al. (26). LUE in sub-Saharan Africa was previously reported to be low at 1.3 g Mj-1 to 1.7 g Mj-1 and dependent upon factors such as nitrogen application and stomatal conductance (34). Similarly, Lopez et al. (35) found that the LUE reported in Nigeria was negatively correlated with total intercepted radiation and with precipitation, while it was positively correlated with nitrogen application. However, the LUE does not exceed 2.5 g Mj-1.
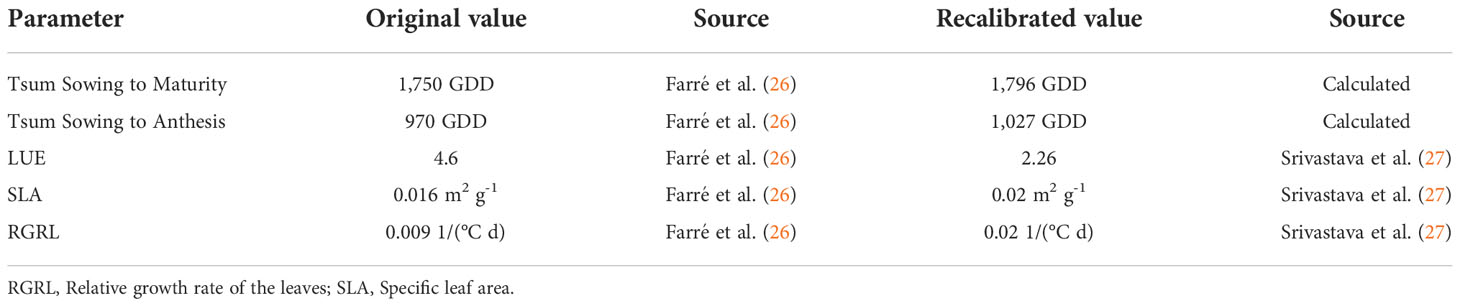
Table 5 Calibrated parameters to simulate the potential yield of maize in Ghana.
3.2.2. Allocation coefficient of dry matter
Figure 5 presents the adjusted allocation coefficient of dry matter. Based on the calculated thermal time from planting to maturity and to anthesis, the allocation coefficient of daily dry matter produced is adjusted to various plant organs. In the early stage, dry matter is totally allocated to vegetative organs, while after anthesis, most of the dry matter is allocated to storage organs (26), which become sink organs (18). The allocation of dry matter to the different organs is more complex, as it is affected by several factors, such as drought. Nakhforoosh et al. (36) and Cai et al. (37) reported that one of the crop strategies to promote drought tolerance is to allocate more dry matter to the roots and less to the aboveground organs. However, LINTUL-1 simulates the potential yield assuming optimal growth conditions and therefore considers the allocation of dry matter to be a function of the accumulated temperature (16).
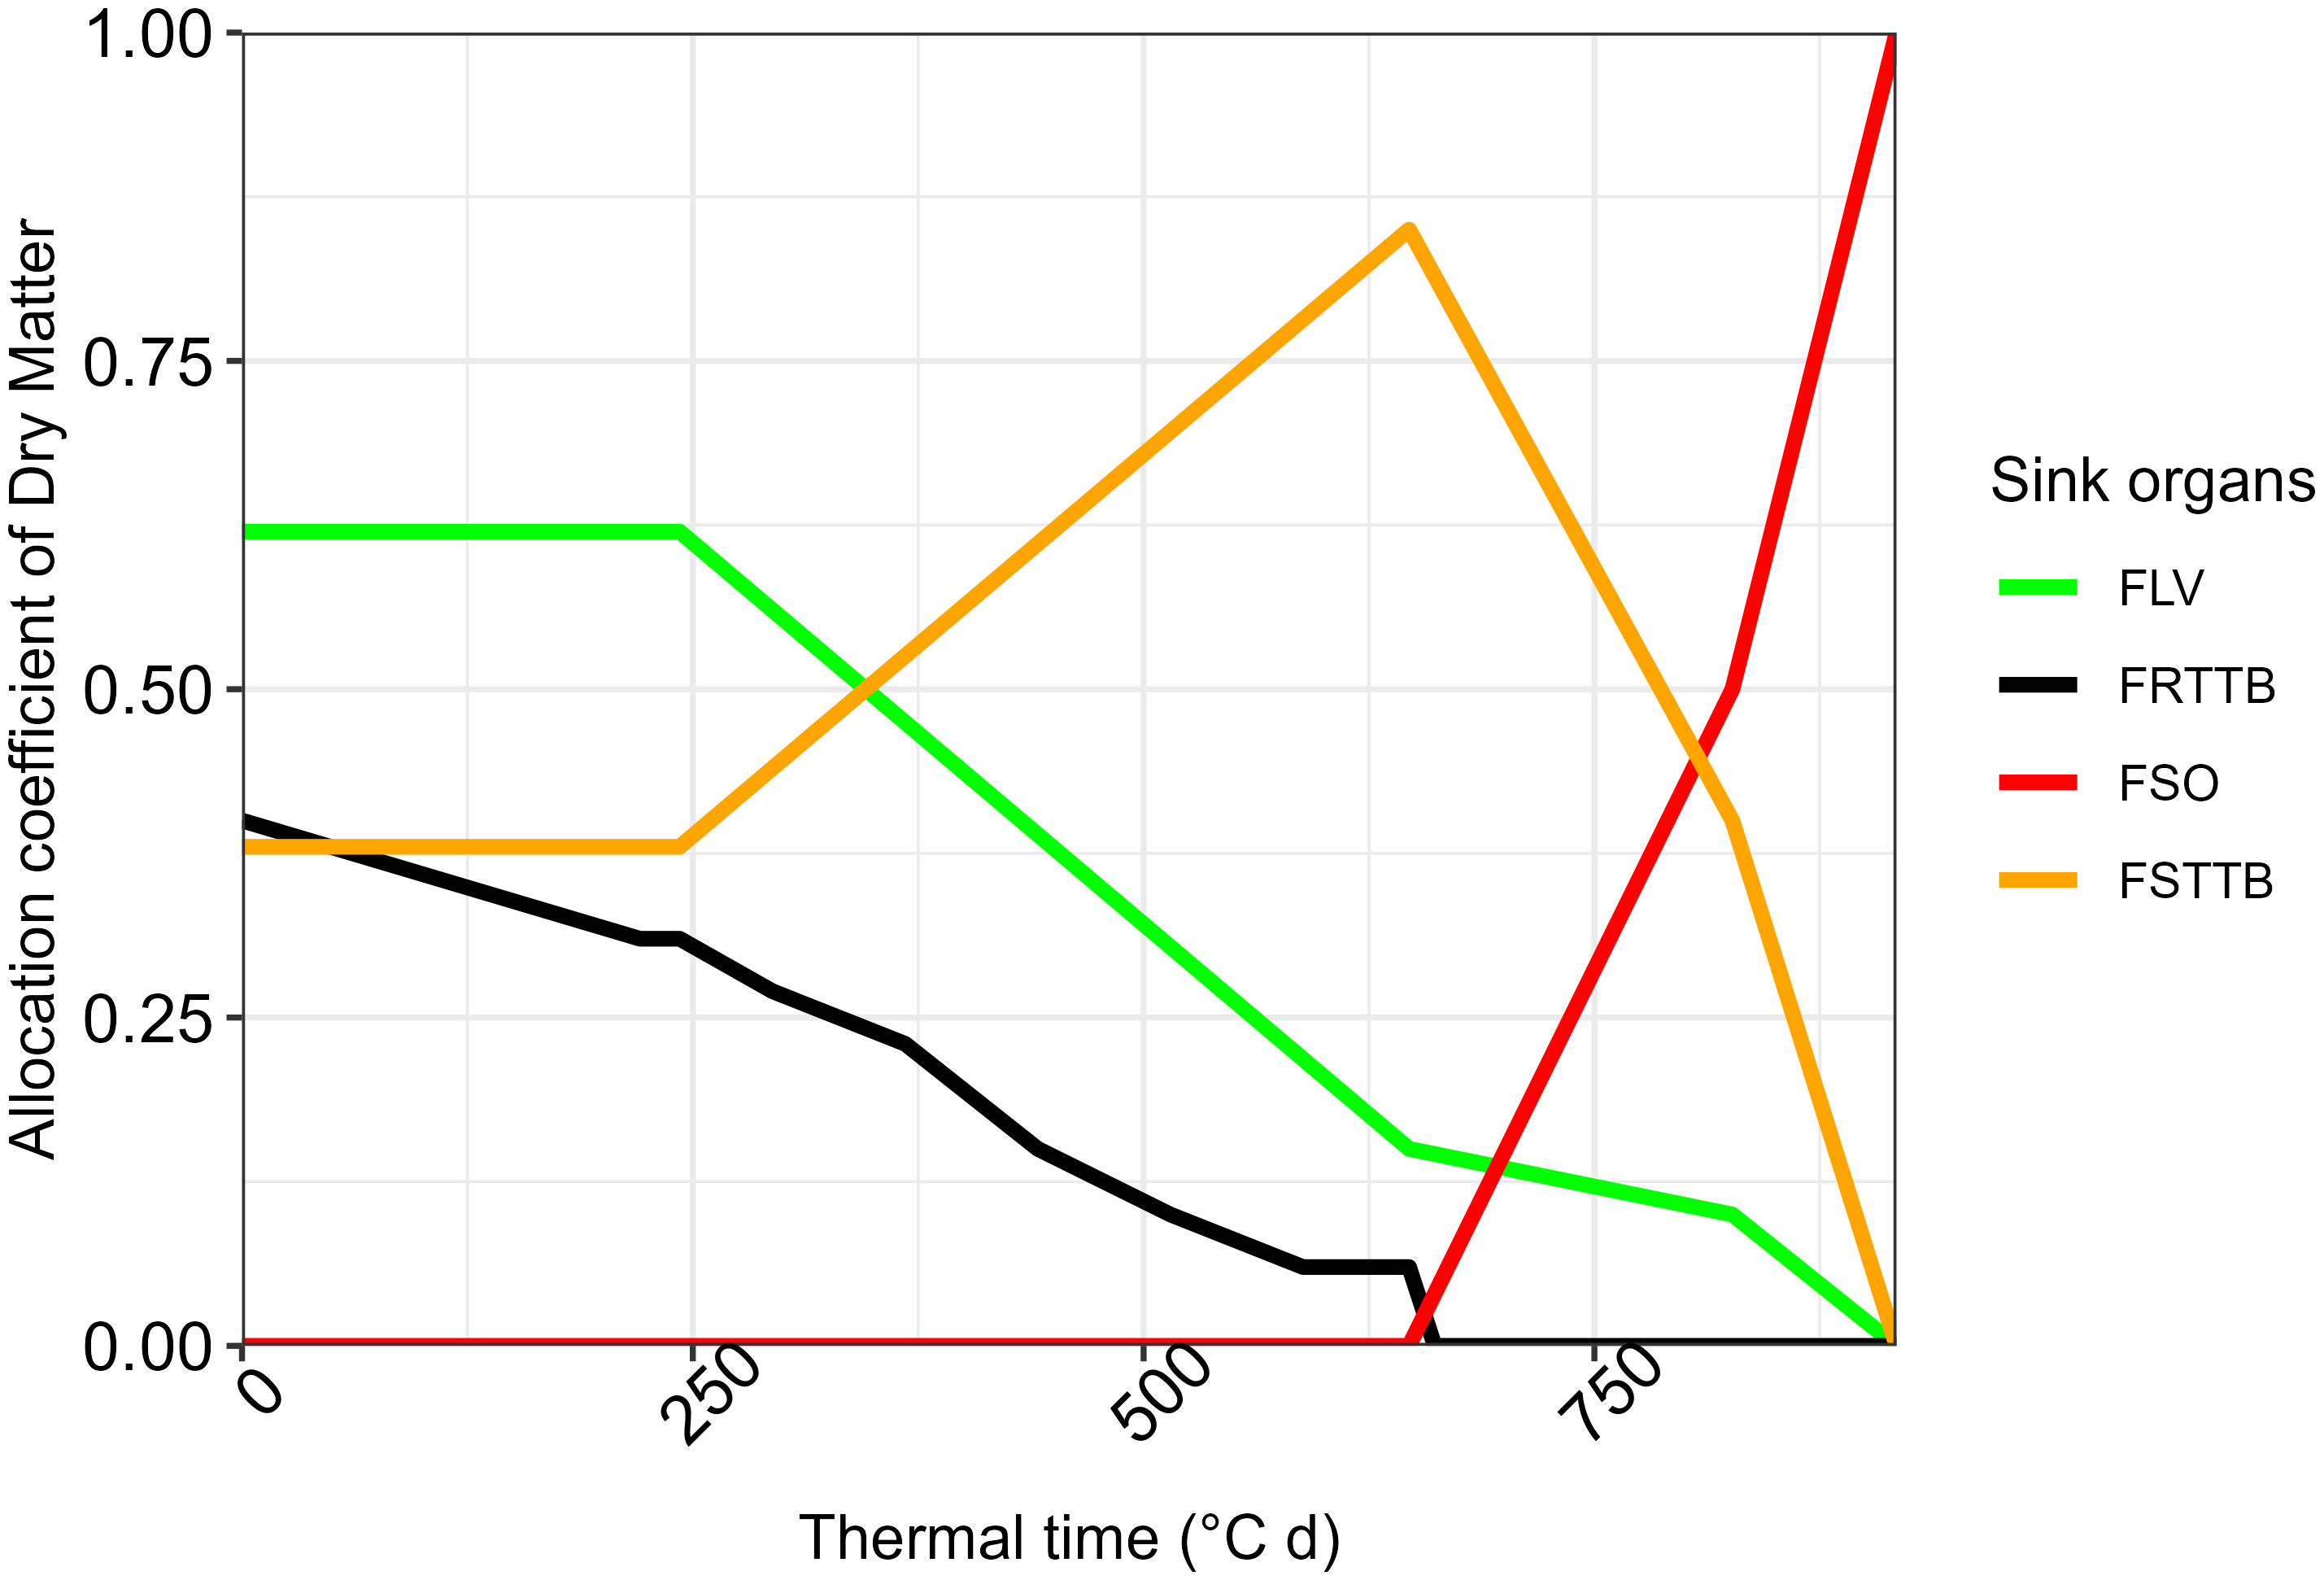
Figure 5 Allocation coefficient of dry matter as fractions. FLV, fraction to leaves; FRTTB, fraction to roots; FSO, fraction to storage organs; FSSTB, fraction to stems.
3.3. LINTUL-1 validation
Figure 6 shows the simulated potential yield and total IPAR. LINTUL-1 was able to simulate a potential yield range between 6.7 t ha-1 and 8.4 t ha-1 in the study sites. The simulated potential yield was slightly higher than the finding of MacCarthy et al. (13), who reported a potential yield of 6.4 t ha-1 in Tamale, located 10 miles from Nyankpala, where LINTUL-1 simulated a potential yield of 7 t ha-1. However, the small difference between our finding and the finding of MacCarthy et al. (13) is explained by the different crop models used: MacCarthy et al. (13) used DSSAT to simulate the potential yield. The potential yield simulated by LINTUL-1 was higher than the potential yield of 4-6 t ha-1 reported by MoFA (38) for most of the released maize varieties in the country. The reported results by MoFA (38) on the potential yield were based on field research rather than crop models, which explains the high potential yield simulated in our study compared to MoFA (38). Due to the low availability of data, we depended upon these studies to validate LINTUL-1 simulations.
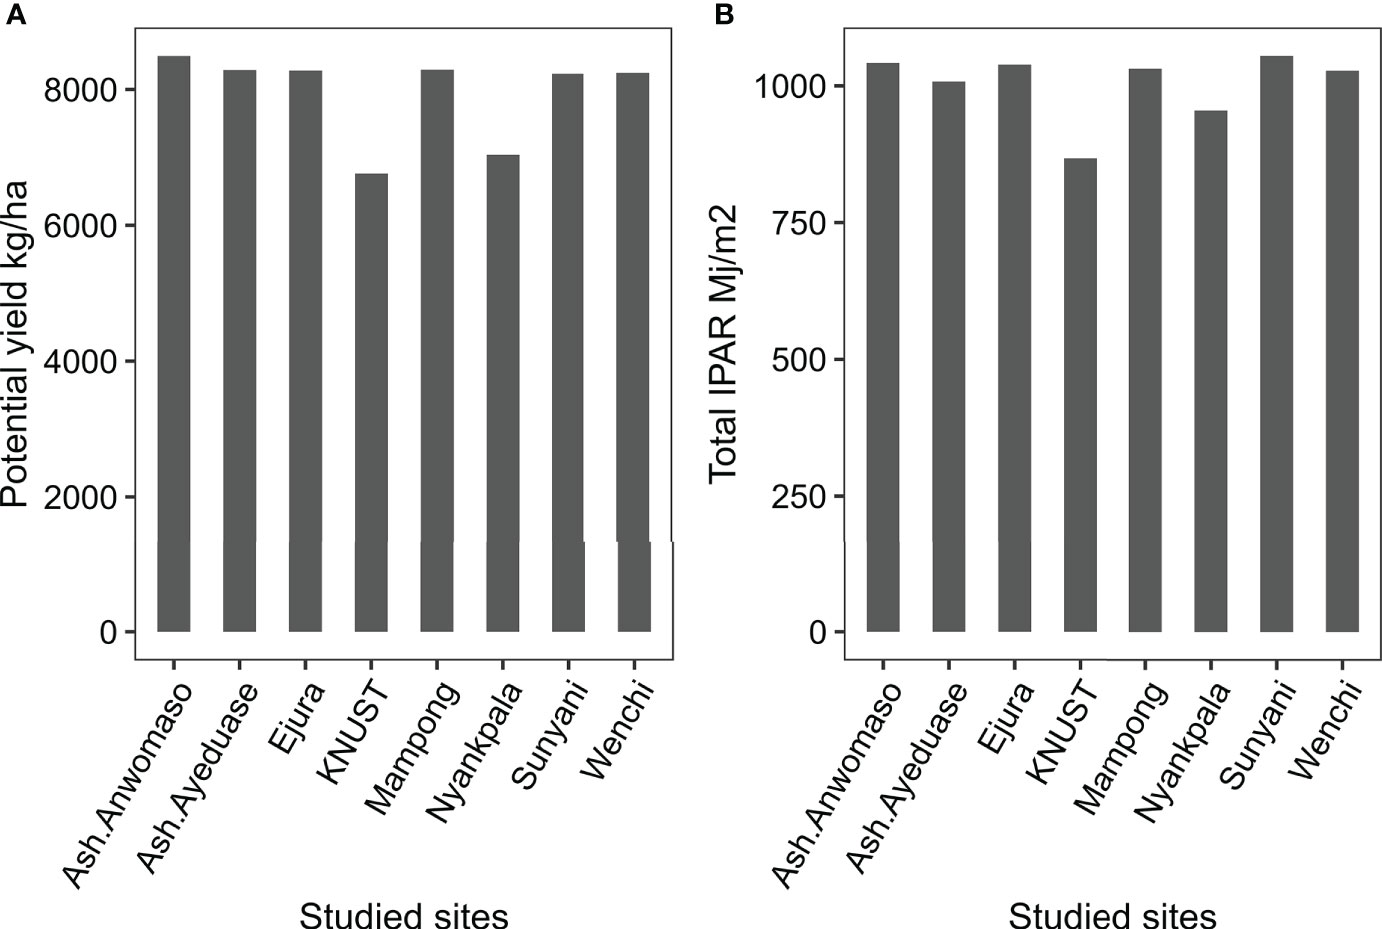
Figure 6 (A) Simulated yield potential of maize by LINTUL-1 and (B) total intercepted photosynthetic active radiation.
Results show that the potential yield of maize in the study sites was highly dependent on the IPAR and on temperature variability. Accordingly, the high simulated potential yield in Ashanti Anwomaso was due to the high IPAR (1,041 Mj m-2), as compared to KNUST site, where the simulated potential yield was 6.7 t ha-1 under the lowest IPAR (867 Mj m-2) (Figure 6). Similarly, Srivastava et al. (27) reported the yield of maize, simulated by LINTUL-5 under water limitation (39), to be highly dependent upon radiation and temperature.
3.4. Temperature variability
Table 6 shows that the temperature variability on a daily basis was significantly different among stations according to the Kruskal–Wallis rank-sum test. Temperature particularly drives the crop development in the model, determining the growth duration of the development stages and, with that, the partitioning coefficient of dry matter over time.
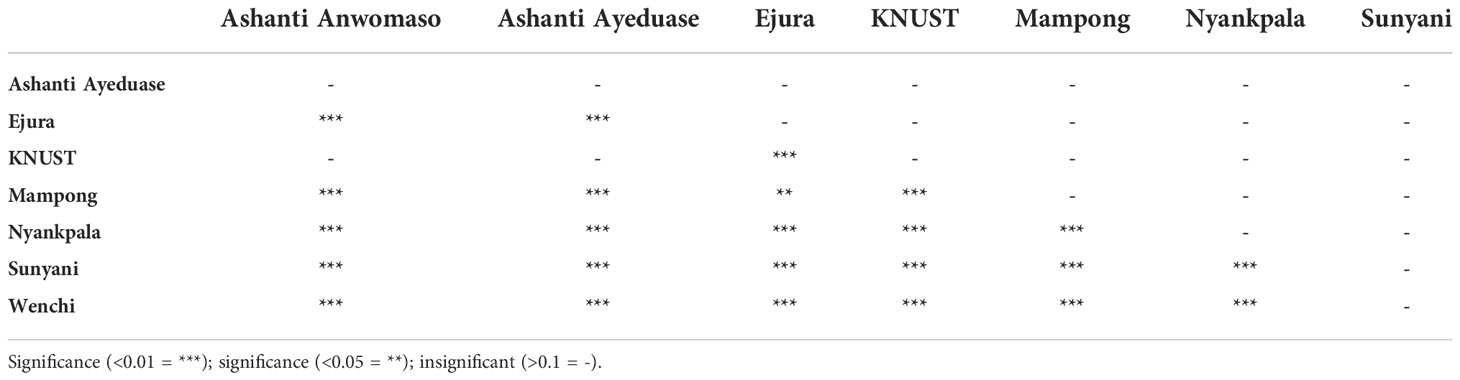
Table 6 Results of the Kruskal–Wallis significance test for daily temperature variability.
3.5. Temperature effect on crop growth
Figure 7 presents the growth duration at each station to reach maturity. The growth duration was longer in Ashanti (Anwomaso and Ayeduase) and in KNUST as compared to all other sites, i.e., 104 days in the simulation and 108 days in the field. This was due to the low average temperature recorded in these study sites (25°C) compared to the other sites (Table 7). The crop cycle was faster in Mampong, i.e., 91 days in the simulation and 95 days in the field. The rapid development of maize in Mampong is explained by the high average daily temperature of 28°C. The small fluctuation between the duration recorded from the field and that obtained from the simulation could be explained by measurement errors during field sampling. These results reveal the importance of temperature as a determinant factor of the phenological growth and ultimate yield of maize. The effect of temperature on the crop cycle was also reported by Amir and Sinclair (40), who found that cool temperatures cause an extension of the growth cycle. Temperatures on the African continent have risen during the last two decades (41), for instance, by 0.5°C in the north and 0.4°C in the southern regions of Ghana in the last decade (42). Temperature increases will have a significant depressing effect on the yield of maize and on crops in general. This calls for an emergent response to reduce the risk of low yield and low resource use efficiency in Ghana.
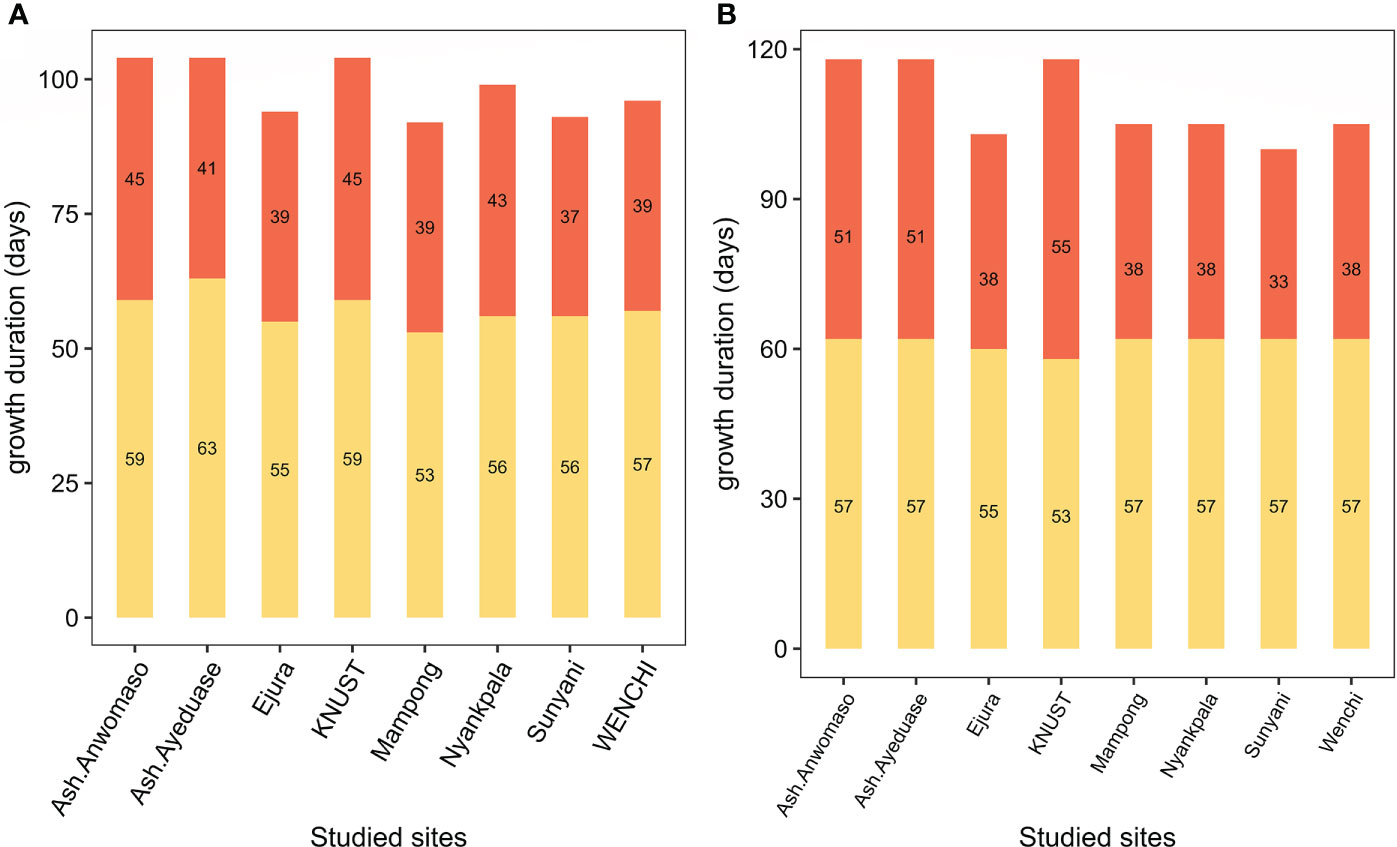
Figure 7 Julian days required by maize to reach anthesis and maturity in Ghana according to (A) LINTUL-1 simulation and (B) measurement in the field. The lower part of the bar is the time to anthesis, and the upper part is the time to maturity.
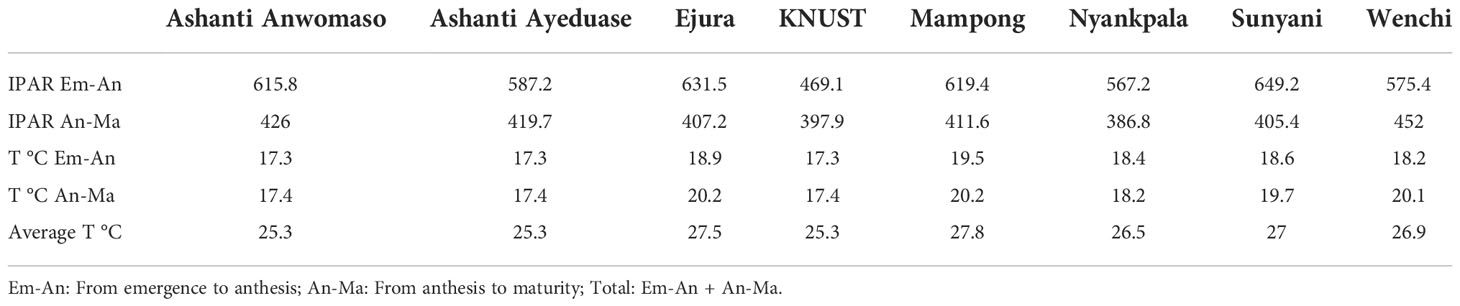
Table 7 Daily average intercepted photosynthetic active radiation (IPAR) and temperature (T) in the study locations.
3.6. Harvest index
Figure 8 shows the simulated harvest index (HI) and shoot biomass under the potential conditions. The HI simulation is a function of both temperature and solar radiation. High temperatures reduce the growth cycle of the crop and, therefore, the HI. However, when the IPAR is high, the simulated dry matter increases, which increases the HI. Variability in the temperatures and IPAR during the phenological growth of the crop leads to high fluctuations in the simulated HI.
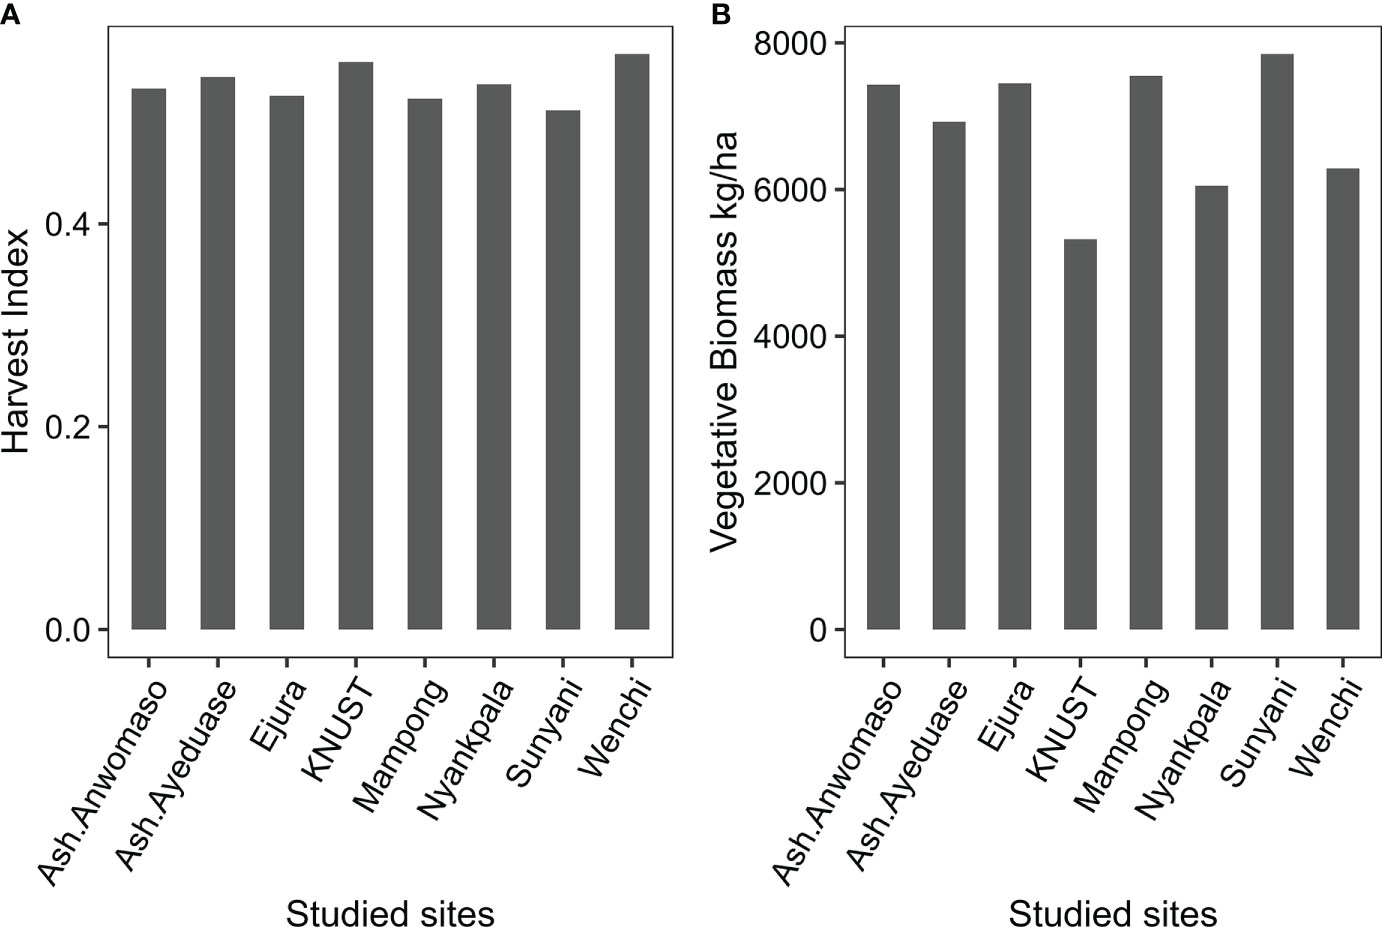
Figure 8 (A) Harvest index and (B) shoot biomass simulated in the study locations using LINTUL-1.
The HI simulated for Wenchi was 0.58 and for Sunyani was 0.51. The crop cycle duration was almost the same for these two stations, yet the vegetative stage in Wenchi was longer by two days compared to Sunyani because the temperature in Wenchi was lower during the vegetative stage (18.2°C). The regenerative stage duration in Wenchi was the same as Sunyani (Figure 7). However, the IPAR during the vegetative stage was higher in Sunyani (649.2 Mj m-2) than in Wenchi (575.45 Mj m-2). On the other hand, the IPAR was high during the reproductive stage in Wenchi (451.55 Mj m-2) and low in Sunyani (404.8 Mj m-2). Thus, more vegetative biomass was simulated in Sunyani, while a higher economic yield was simulated in Wenchi.
A similar logic was observed when comparing Nyankpala (HI = 0.53) and Wenchi (HI = 0.58). In Nyankpala, only 393 Mj m-2 IPAR was recorded during the regenerative stage. In KNUST, the simulated HI was 0.5, which was higher than that of Sunyani. This is explained by the low temperature in KNUST that extended the crop cycle compared to Sunyani (Figure 8). However, even with the high HI in KNUST, the simulated grain yield and vegetative biomass were low compared to Sunyani because the positive effect of temperature was not supported by IPAR, which was lower (Figure 6).
Harvest index was 92%, explained by the variability of temperature and of IPAR between the vegetative and the regenerative stage of the crop. However, only the amount of IPAR during the vegetative stage significantly affected the HI; high IPAR during this stage significantly reduced the HI. While the high IPAR during the regenerative stage appears to have had a positive effect on the HI with a correlation coefficient of (r = 0.42), its effect was not significant. Temperatures during the reproductive stage and during the vegetative stage were negatively correlated with the HIs of r = -0.31 and r = -0.54, respectively, though not statistically significant due to the small size of the dataset. However, the effect of temperature on crop growth and yield was very clear. For example, the temperature was lower in Ashanti (Anwomaso and Ayeduase) and KNUST as compared to the other sites, which caused the crop cycle to be longer (Figure 7) and favorably affected the HI. This study reveals that both solar radiation and temperature have a considerable effect on maize HI and grain yield. This was also reported by Hou et al. (43), who found that the yield of maize decreased by 0.83 t ha-1 with a 1°C increase in the seasonal mean temperature, while a 0.85 t ha-1 reduction was observed per 100 Mj decrease in accumulated PAR.
3.7. Yield gap quantification
Figure 9 shows the calculated yield gap as the difference between the simulated potential yield and observed yield in the study sites. This approach was used in several studies to quantify the yield gap (44). In this study, the quantified maize yield gap was between 17% and 98.2% of the potential yield. Similarly, MacCarthy et al. (13) found that the yield gap in the northern regions of Ghana was between 59% and 75% under farmer practice, while it was between 29% and 59% under enhanced farmer practices. The yield gap in sub-Saharan African countries is the largest in the world at 64-80% (12), and the yield gap in Ghana is generally around the same range. Accordingly, this study confirms the large maize yield gap in Ghana.
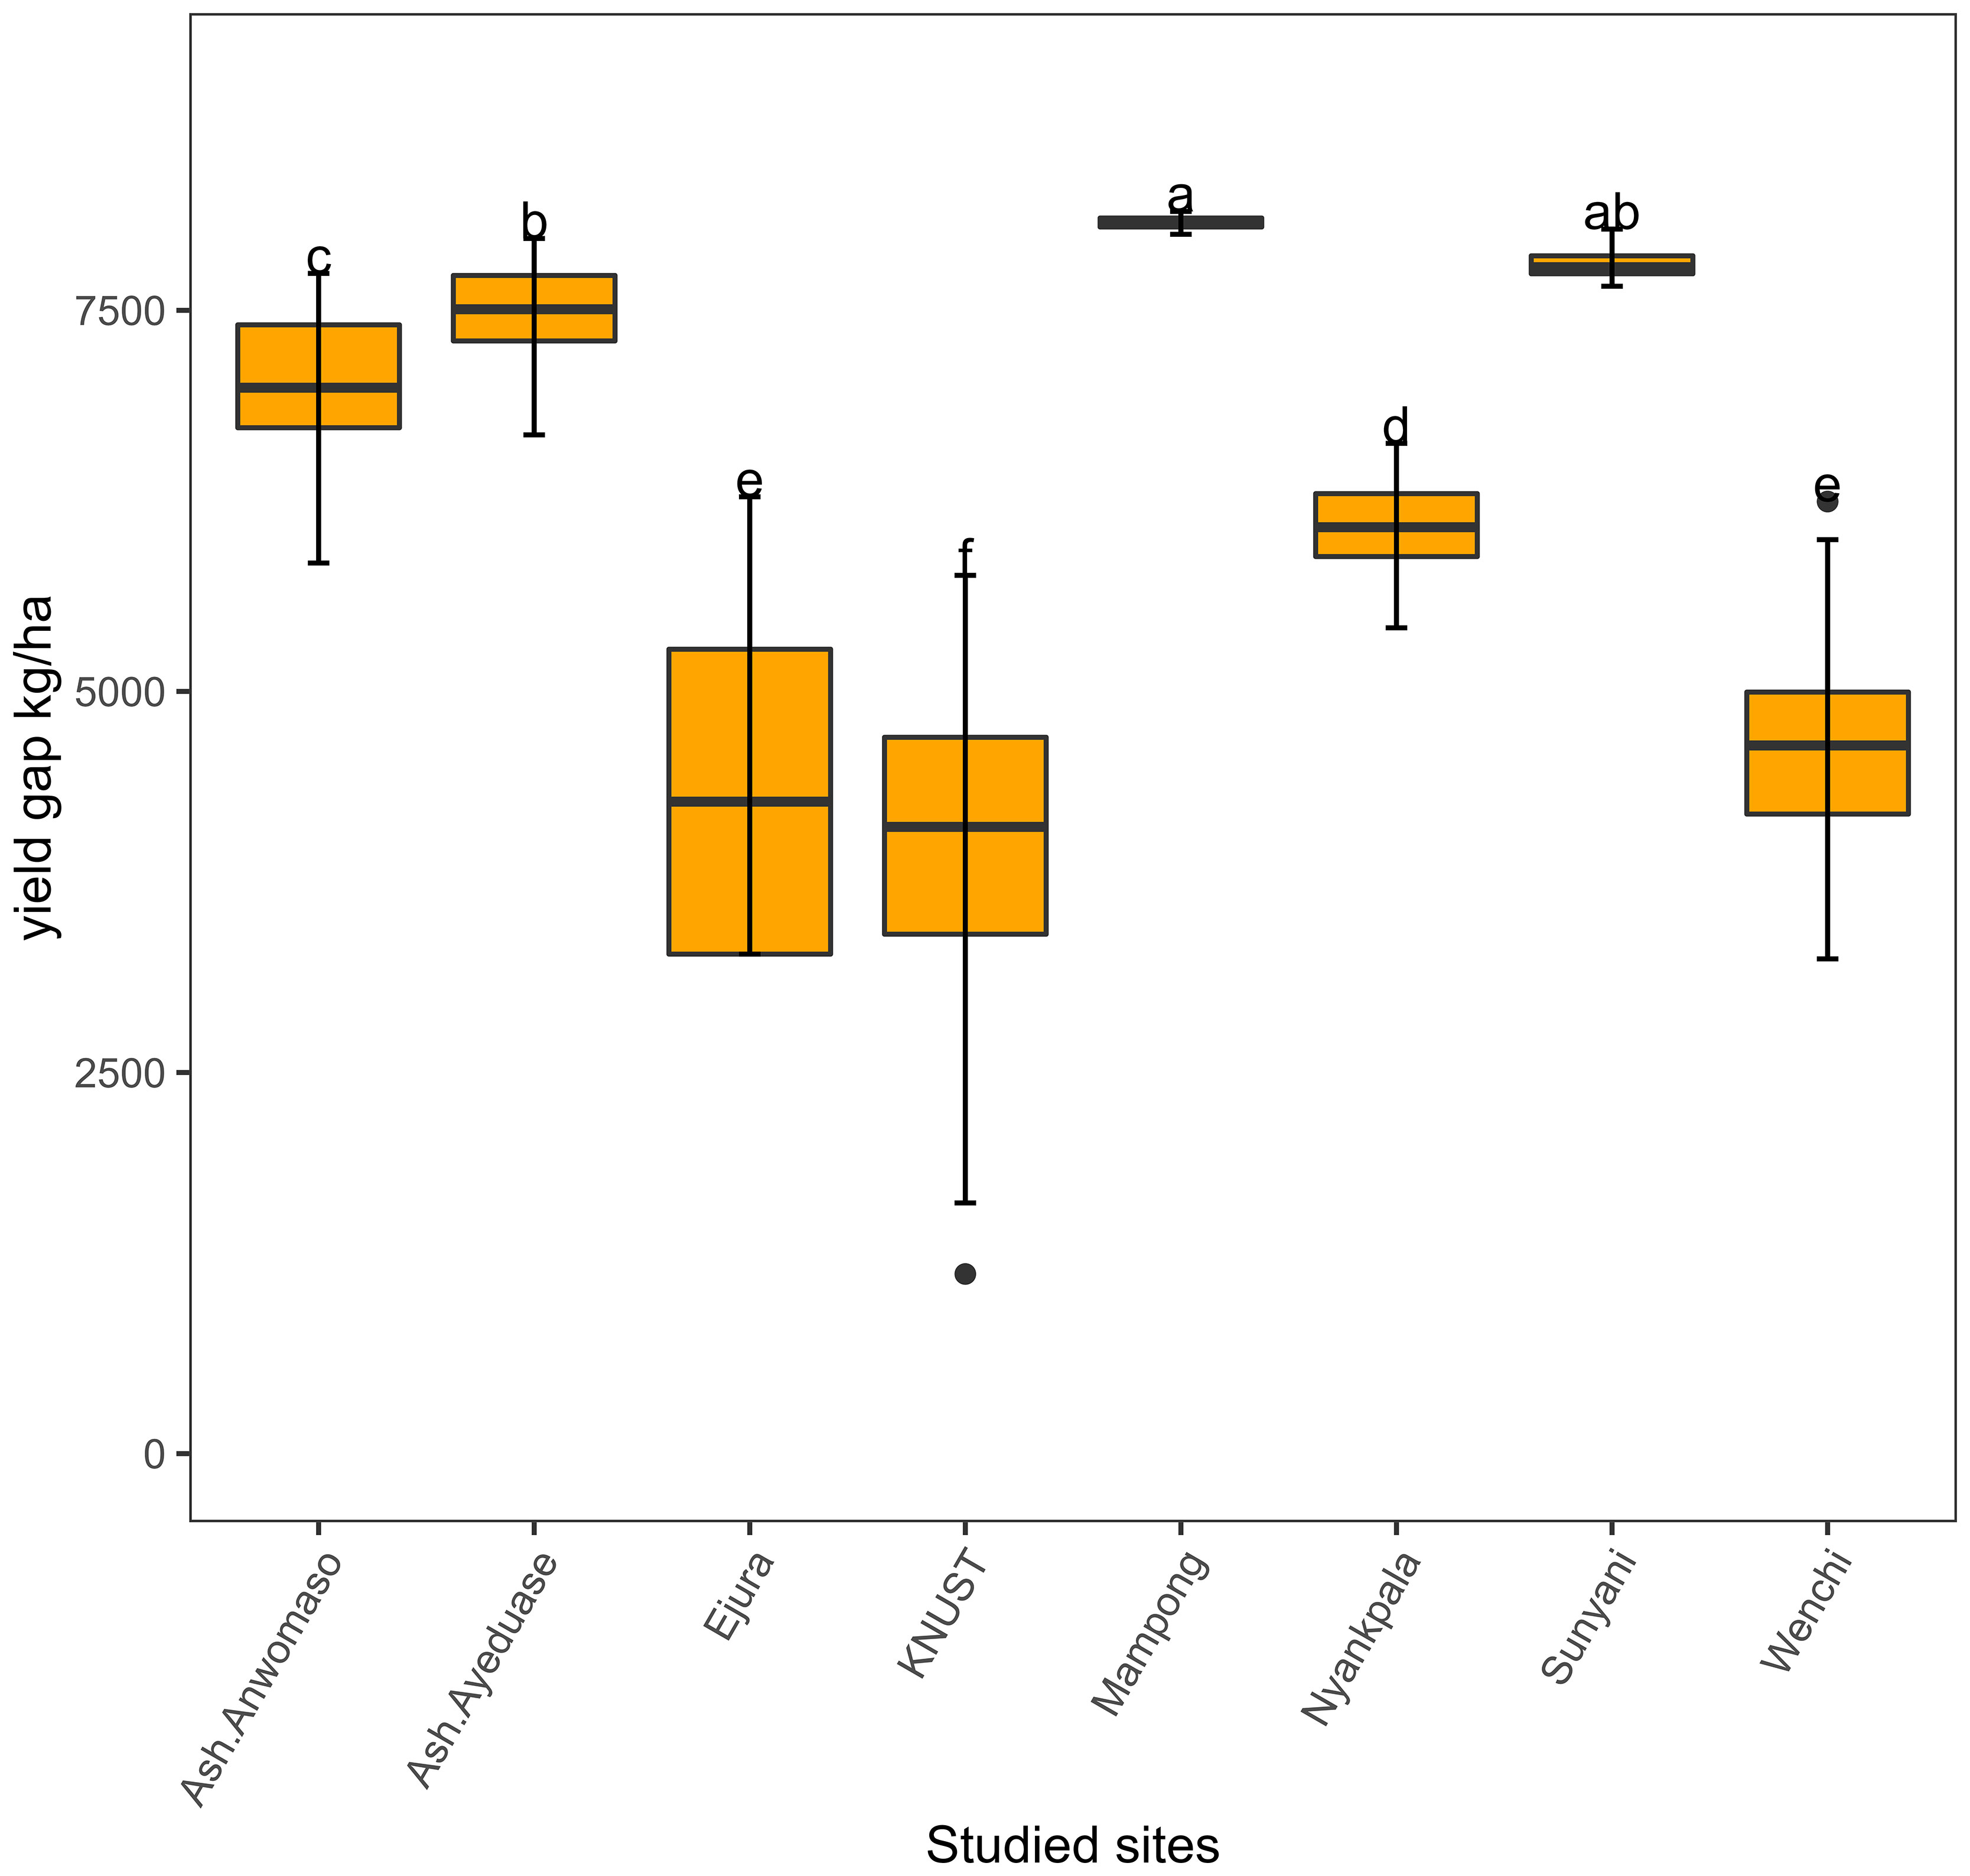
Figure 9 Yield gap in the study sites, calculated as the difference between simulated potential yield and observed yield at each site. The small letters are the significance of the statistical differences of the treatments. The only meaning is to show which treatment are significantly different and the ones that are not significantly different. The letters were automatically generated by the statistical test.
3.8. Yield gap analysis
Figure 10 proves the accuracy of the MLR in explaining the yield gaps in this study. The MLR explained 81.5% (RMSE = 734.5 kg ha-1) of the variability in the yield gap through 12 variables selected by the AIC bidirectional selection method. The angle between the regression line and the 1:1 line is small, supporting the accuracy of the MLR in explaining the yield gap in this study based on the covariates presented in Table 8. In addition, the predicted yield gap by the MLR model was almost equal to the observed yield gap in the study sites, given that the points are centered around the 1:1 line.
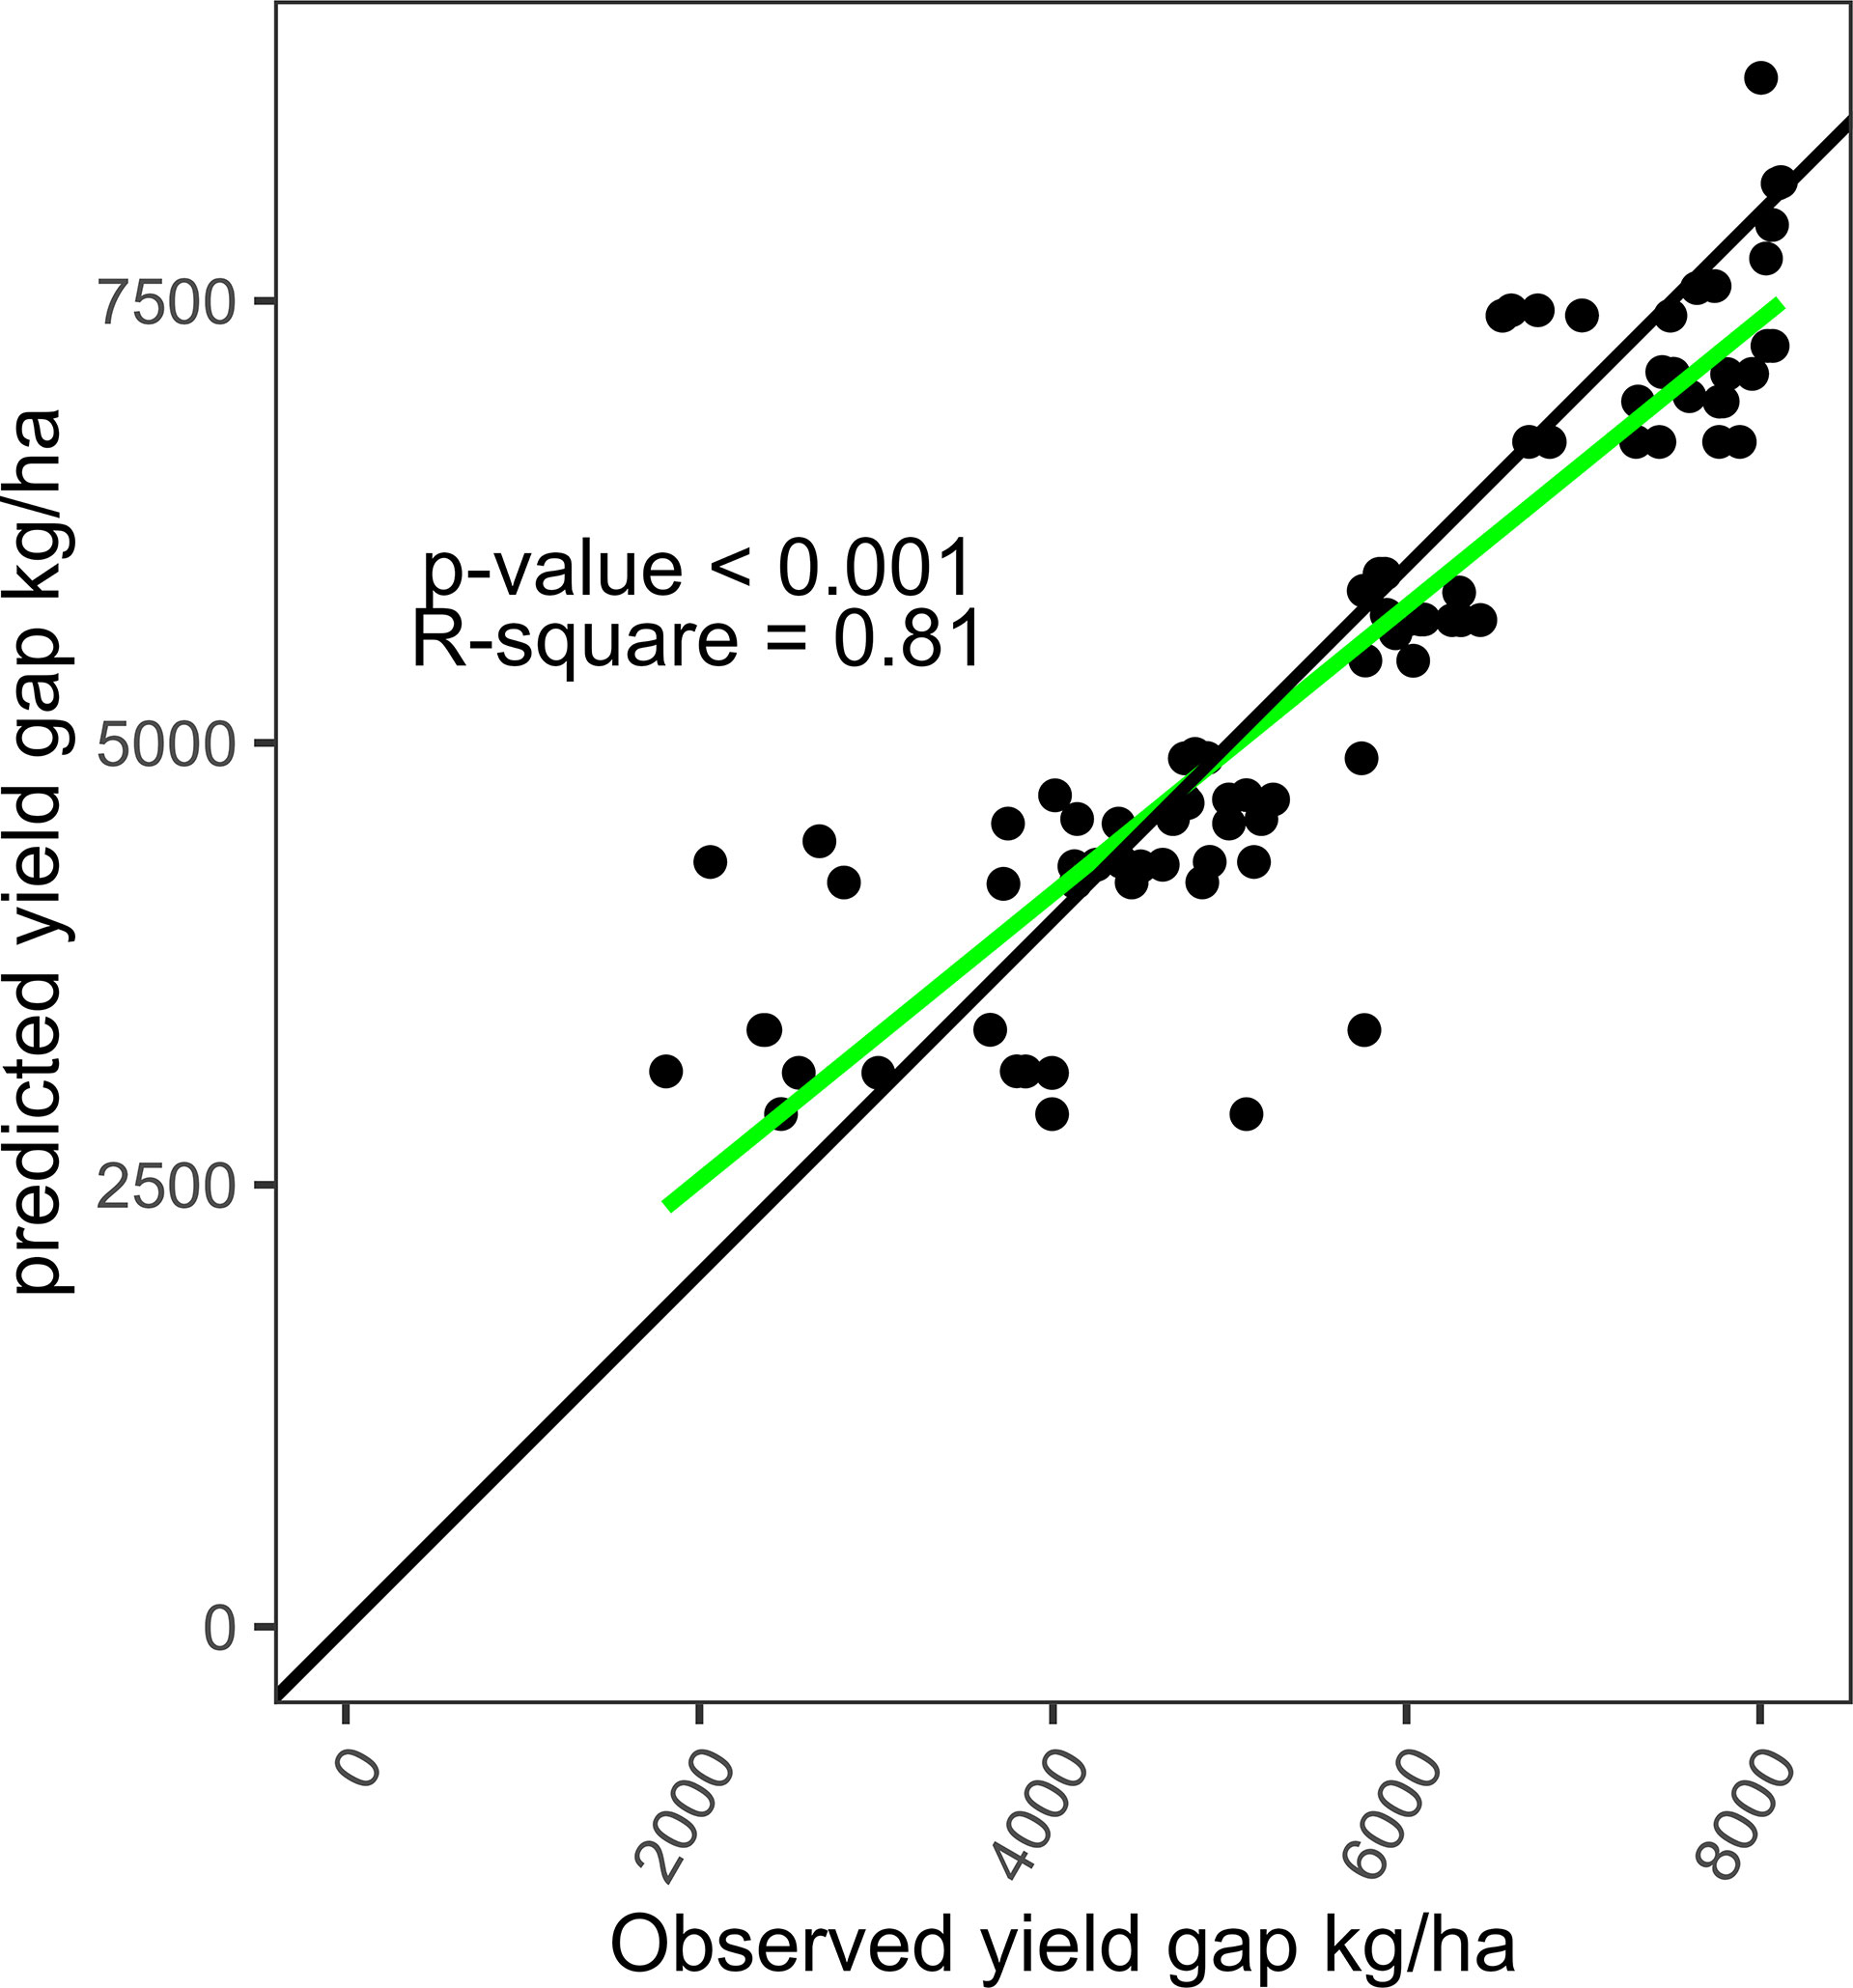
Figure 10 MLR accuracy in explaining the yield gap using soil, fertilizer, and rainfall as variables. The green line corresponds to the regression line, and the black line is the 45-degree line (1:1).
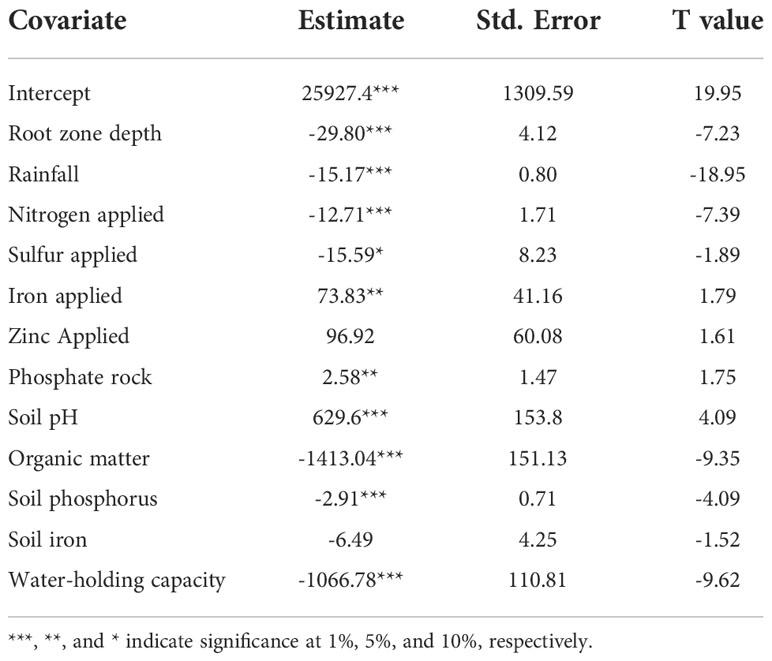
Table 8 Factors influencing maize yield gap in the study area based on the MLR.
Table 8 summarizes the factors that drive closing the yield gap. Organic matter, pH, soil water-holding capacity, root zone length depth, rainfall, soil zinc, soil iron, nitrogen fertilizer, sulfur fertilizer, and phosphate rock were determined to be the major factors explaining the yield gap. In the literature, most studies have explained the yield gap in Ghana and in sub-Saharan Africa as being due to the low application of fertilizers (11). However, the yield gap is widely affected by other factors, including climate, soil physicochemical proprieties, and management practices. Sileshi et al. (45) found that the risk to maize yields is higher in Nitosols compared to Luvisols. Also, the risk of getting a lower yield than expected is higher in soils with low resilience to degradation, such as Ferralsols and Acrisols. The risk of low maize yield was noted to be high in Nitosols when mineral fertilizers were applied. In addition, the low response of maize yield to fertilizer has been reported by several studies (6), which raises questions about the contribution of fertilizer in closing the maize yield gap in Ghana. In the same context of the findings from this study, Kouame et al. (8) found that 50% of maize yield variability under farm conditions could be explained by Tmin, Tmax, soil water-holding capacity, root zone depth, sand content, phosphate and nitrogen fertilizers, and pH. In on-station conditions, 64% of maize yield variability was explained by Tmax, soil water-holding capacity, root zone depth, sand content, phosphate and nitrogen fertilizers, pH, rainfall, elevation, clay and silt content, organic matter, and potassium (8). The effects of temperature and solar radiation were not considered as explanatory variables in the statistical regressions of this study because their effect was accounted for in the LINTUL algorithm.
3.8.1. Organic matter, soil water retention, and rainfall
The results of this study show that low soil organic matter was the major factor driving the yield gap. The yield gap decreased by 1.4 t ha-1 with a 1% increase in soil organic matter (Table 8). These findings were comparable to those of Kane et al. (46), who found that increasing the organic matter content in the soil by 1% enhanced maize production by 2.2 t ha-1 under dry conditions. Oldfield et al. (47) mentioned that increasing the soil organic matter in maize production from 0.86% to 3.44% could reduce nitrogen fertilizer by 70%. Soil organic matter in the sites of this study ranged from 0.89% to 3.30%, which is comparably low, suggesting that nitrogen application rates may need to be adjusted to the soil organic matter content. Soil organic matter has several functions in soils, e.g., improving soil water-holding capacity and soil aeration, reducing runoff and erosion, and promoting soil structure through aggregation (48). Fertile soil should generally contain at least 4% organic matter (49) to provide a productive and resilient system. However, even with high organic matter, the application of mineral fertilizer is important due to the low release rate of nutrients from the organic matter, which may not sufficiently support crop growth, and to prevent soil nutrient depletion from deteriorating soil health over time. Each metric ton of maize grain removes 11 kg, 7.6 kg, 4.8 kg, and 0.9 kg of N, P2O5, K2O, and S, respectively (50). Thus, these nutrients must be replenished through organic and mineral fertilizer applications.
The erratic and low amount of rainfall in the study sites during the growing season (191-570 mm) demonstrates the importance of both soil organic matter and water-holding capacity. The MLR showed that increasing soil water retention by 1 mm reduced the yield gap by 1.06 t ha-1. The volume of available water in the root zone is important in reducing the negative effect of drought on maize grain yield and biomass. Bawa et al. (51) reported that drought affects all the physiological and morphological characteristics of maize, including grain yield, leaf area, and shoot biomass. From 1960 to 2015, the aridity index increased at a rate of 0.2 per decade in Guinea Savannah. There also was an increase in the frequency of drought occurrences, with a decline in the pattern of rainfall (52). In the Transitional zone, rainfall has been dramatically fluctuating over the years, with an increasing frequency of erratic rainfall (53). These conditions are not favorable for maize growers in Ghana (29). This study also highlights the effect of rainfall on the yield gap; a 1 mm increase in rainfall reduced the yield gap by 15 kg ha-1.
The ability of the soil to retain water is important under these drought conditions. Lawes et al. (54) reported that the effect of the soil water-holding capacity on crop yield is significant only when the rainfall season starts late, with a low amount of rainfall. The MLR in this study considered only the individual effect of each variable; the interaction between soil water-holding capacity and rainfall was not considered, nor were the temporal aspects of rainfall. Therefore, further studies and analysis considering the interactions between different variables could be beneficial.
3.8.2. Roots zone depth
A 1 cm increase in the root zone depth reduced the yield gap by 29 kg ha-1. The root zone depth in soils is limited by the presence of a hard rock layer, a high concentration of heavy metals, low soil pH, or high electrical conductivity (>12 S m-1) in the soil layers (55). Low aeration and high sodicity are the most influential factors in reducing the root zone depth for maize (24). The average root zone depth in sub-Saharan Africa, as in Ghana, is around 1 m (56), while maize roots can reach a depth of 1.6 m (57). Good distribution of the roots in the soil accompanied by a deep root zone are important in mitigating drought stress by increasing access to water during the growing season (58). This study confirms the correlation between the yield gap (actual yield) and the root zone depth. However, the status of all the factors affecting root development in the soils in Ghana should be reviewed.
3.8.3. Soil pH
Soil pH is the third largest contributor to the yield gap in the study locations (Table 8). The yield gap typically increases by 629 kg ha-1 when the pH increases by one unit. This is contrary to the findings of The et al. (59), who reported that increasing the soil pH improves maize yield because it improves the soil CEC and reduces the aluminum and iron oxide in the soil solution, thus increasing the availability of nutrients. Yet, the pH range in the test soils was narrow and near optimal.
3.8.4. Fertilizer application and yield gap
Figure 11 shows the effect of different fertilizer combinations on the yield gap. According to the MLR, the application of sulfur and nitrogen fertilizers significantly affected the yield gap. A 1 kg increase in sulfur and nitrogen application reduced the yield gap by 15.5 kg ha-1 and 12.73 kg ha-1, respectively. Similarly, the yield gap recorded for the NPK+S treatment in Wenchi was the lowest of all the treatments. Similar results for sulfur fertilizer were observed in all other study sites except Sunyani, where no NPK+S treatment was used. In Mampong, the yield gap was very high; the lowest gap was obtained with the control treatment due to severe drought. Several studies have reported that incorporation of secondary and micronutrients into fertilizer formulations helps increase maize yield in Ghana. For instance, Kugbe et al. (60) determined that application of 14 kg of S and 2.7 kg of B and Zn per hectare with NPK increased the yield by 30%. Agyin-Birikorang et al. (61) found that the application of S and Zn with NPK increased the yield by an average of 60% in the Savannah zones.
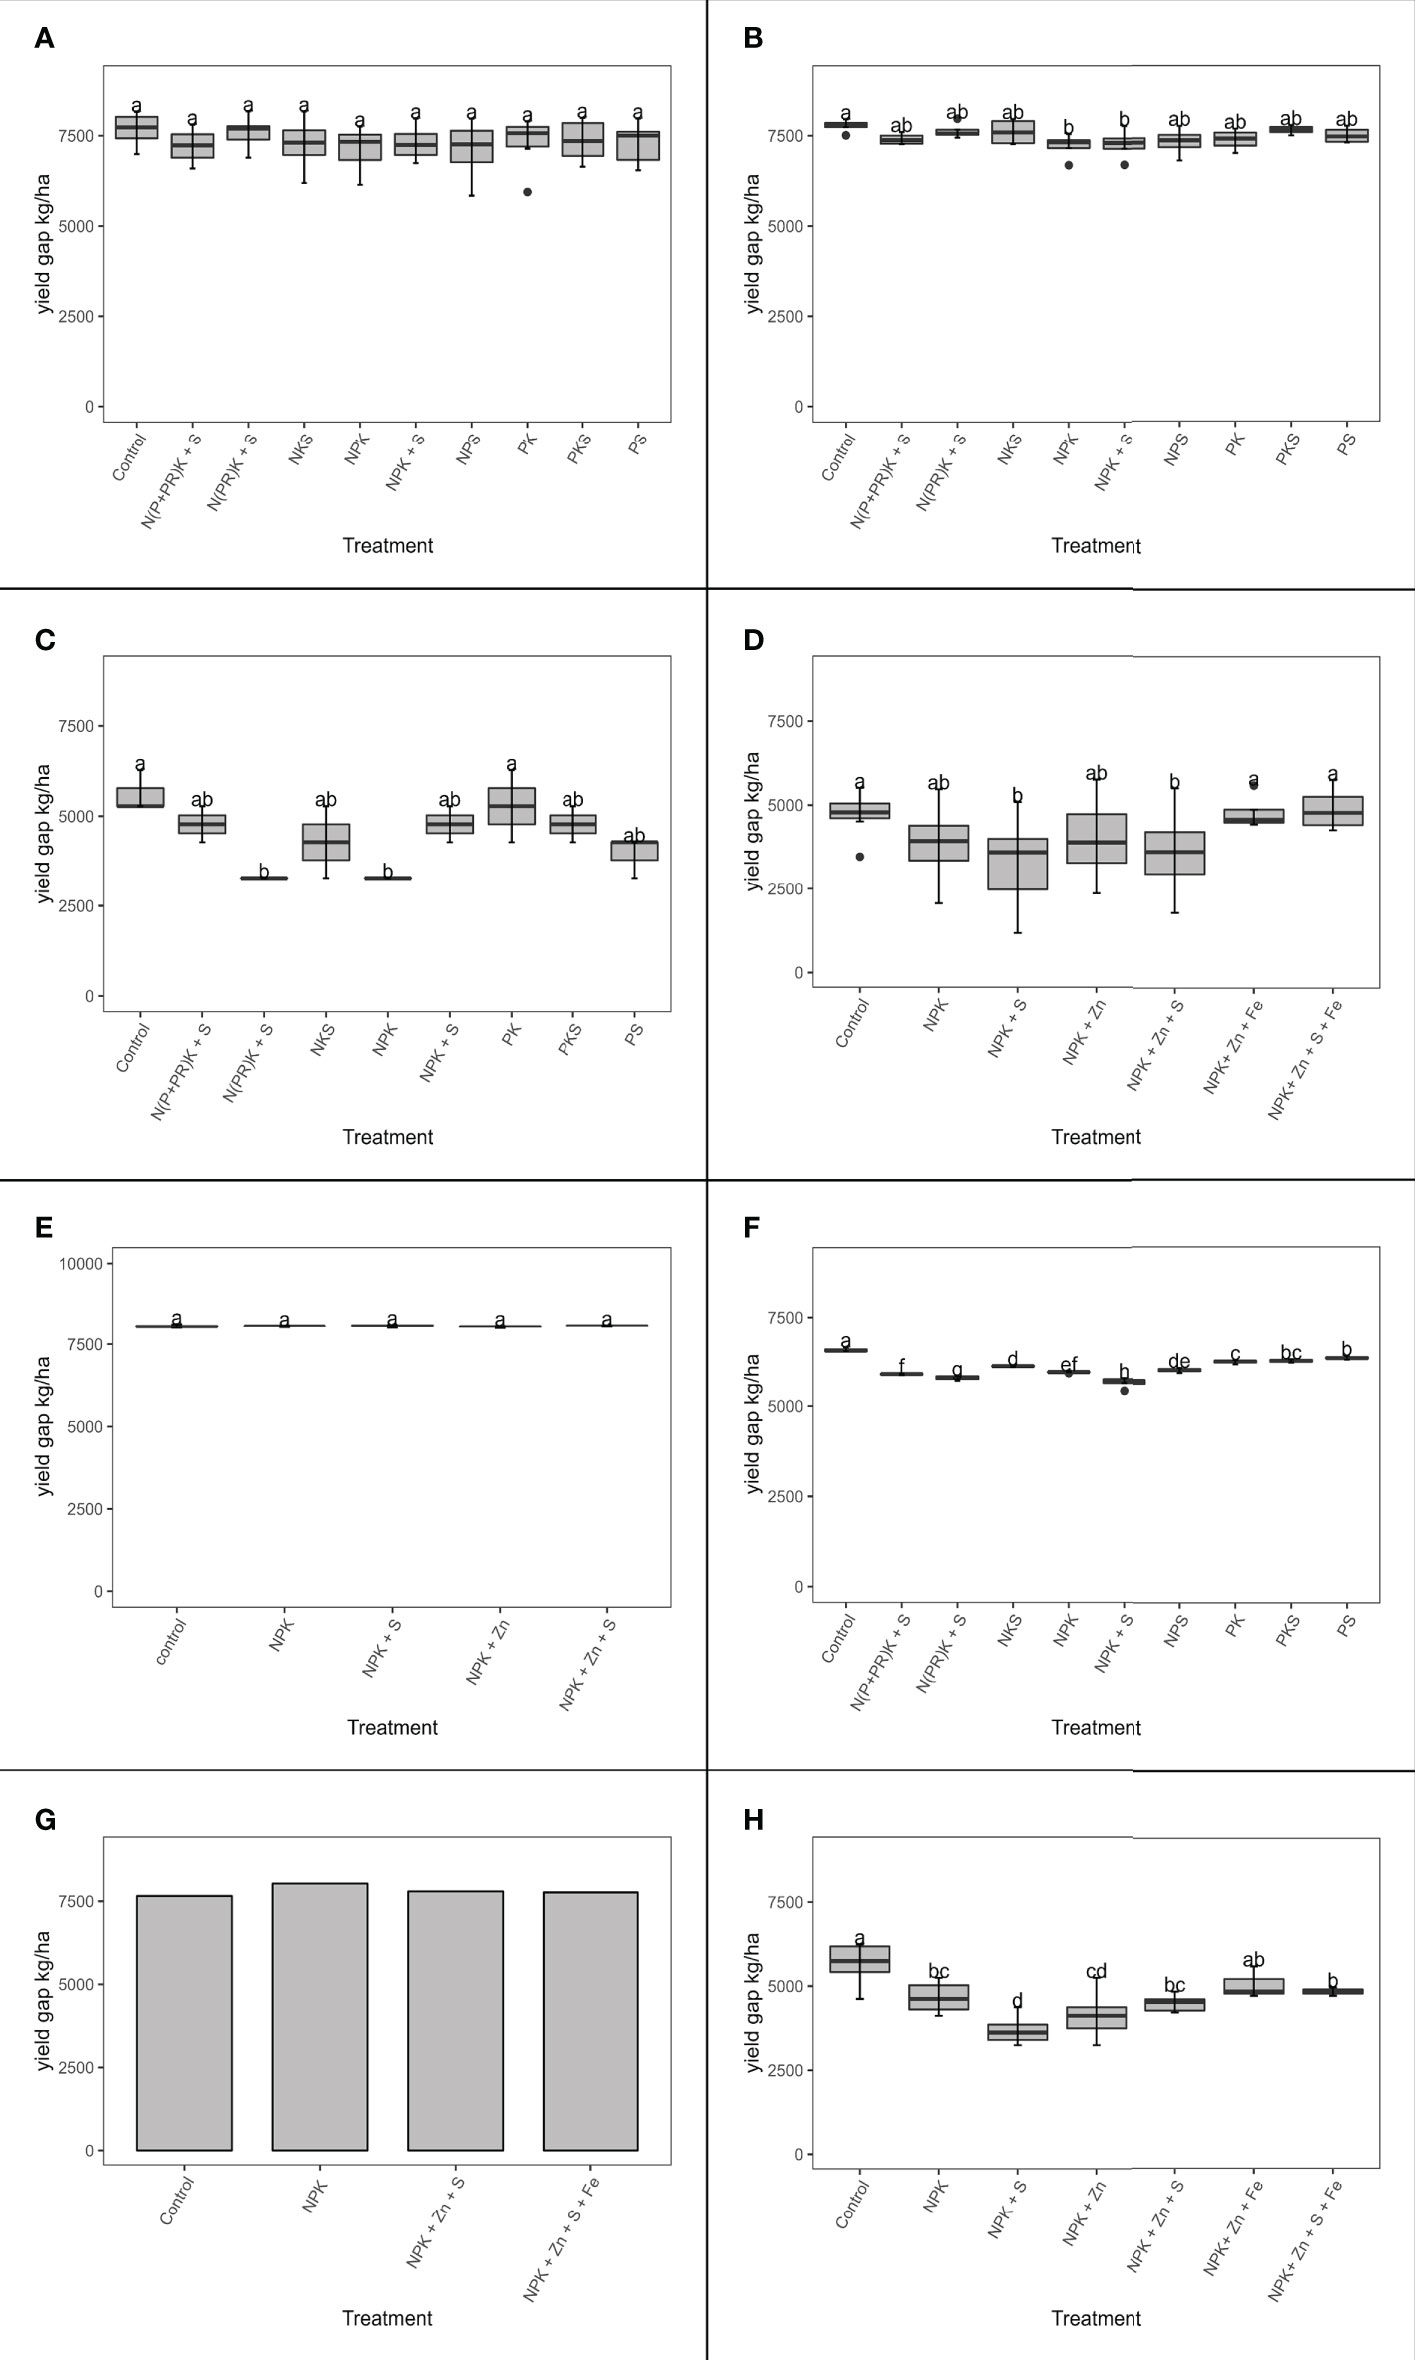
Figure 11 Statistical comparison of the yield gap recorded for each fertilizer treatment based on Duncan’s new multiple range test in the study sites: (A) Ashanti Anwomaso; (B) Ashanti Ayeduase; (C) Ejura; (D) KNUST; (E) Mampong; (F) Nyankpala; (G) Sunyani; and (H) Wenchi. The small letters are the significance of the statistical differences of the treatments. The only meaning is to show which treatment are significantly different and the ones that are not significantly different. The letters were automatically generated by the statistical test.
In this study, only the application of sulfur with NPK at 10-15 kg ha-1 appeared to reduce the yield gap of maize. However, the effect of sulfur application was significant only in Nyankpala and Wenchi and was not statistically significant in other study sites. For example, in Ashanti Anwomaso the yield gap with the application of NPK+S was the lowest, but this was not significantly different from the other treatments. The difference was also not significant at the KNUST site. The high response of yield to sulfur application may have resulted from the low soil sulfur content of 0.67-5.6 mg of sulfur per kilogram of soil, which is below the critical level of 8-13 mg of sulfur per kilogram of soil (62). In Wenchi, the omission of sulfur reduced the observed yield by 11% and increased the yield gap by 19%, which corroborates Agyin-Birikorang et al. (61), who reported the omission of sulfur reduced yield by 35%.
The application of phosphate, potassium, and zinc did not significantly affect the yield gap based on the MLR model. However, phosphate showed a positive effect, reducing the gap by 8 kg ha-1. Essel et al. (63) reported the application of phosphorus significantly increased yield in the Deciduous Forest zone of Ghana. In this study, in Nyankpala the application of NKS resulted in a yield gap of 86% over the potential yield while the application of NPKS resulted in a yield gap of 80%. This reveals that the application of 40 kg ha-1 of phosphorus reduces the yield gap by 6% over the potential yield.
Potassium fertilizer did not significantly affect the yield gap of maize. Similar results were obtained by Essel et al. (63). Atakora et al. (64) reported that increasing potassium fertilizer from 0 to 90 kg K2O ha-1 increased the yield from 2.5 t ha-1 to 2.7 t ha-1, which reflects the low use efficiency of potassium in Ghanaian soil. Soil exchangeable potassium at these study sites was between 0.01 and 0.49 mEq 100 g-1, which is below the critical level of 0.6 mEq 100 g-1 to grow maize (65). While yield response to potassium would be expected, that was not the case. Therefore, further studies will be needed to understand the dynamics of potassium in Ghanaian soils.
The application of 1 kg of iron significantly increased the yield gap by 73 kg ha-1, which highlights the negative effect of iron on maize yield. Foliar application of iron at the rate of 5 kg ha-1 was practiced in this study. Some leaf burns were observed where foliar iron was applied. The defoliation observed might have been due to the high concentration of iron in the solution and the pH of the water used to prepare the solution. In the same context, Fernández and Ebert (66) reported that leaf burn negatively impacts crop performance and reduces yield. The rise in soil content of iron reduced the yield gap significantly by 6.5 kg ha-1, thus proving again that the foliar application of iron was the main reason behind the negative effect of iron in this study. Therefore, soil application of iron might be more preferred in Ghana based on the MLR results. However, more investigations are recommended in this regard.
3.9. Maize potential yield and yield gap map in Ghana
Figure 12 shows the potential yield simulated by LINTUL-1 for all agroecological zones of Ghana. A potential yield of between 5.4 t ha-1 in the southern regions and 8.6 t ha-1 in the northern regions was determined. The potential yield of maize was found to follow an increasing pattern from the southern to the northern regions. This is explained by the high intercepted radiation in the northern regions compared to the south, as also observed by Yang et al. (67). Tanu et al. (68) found the cloud cover index in the southern regions to be higher compared to the northern regions, further explaining this radiation pattern for Ghana.
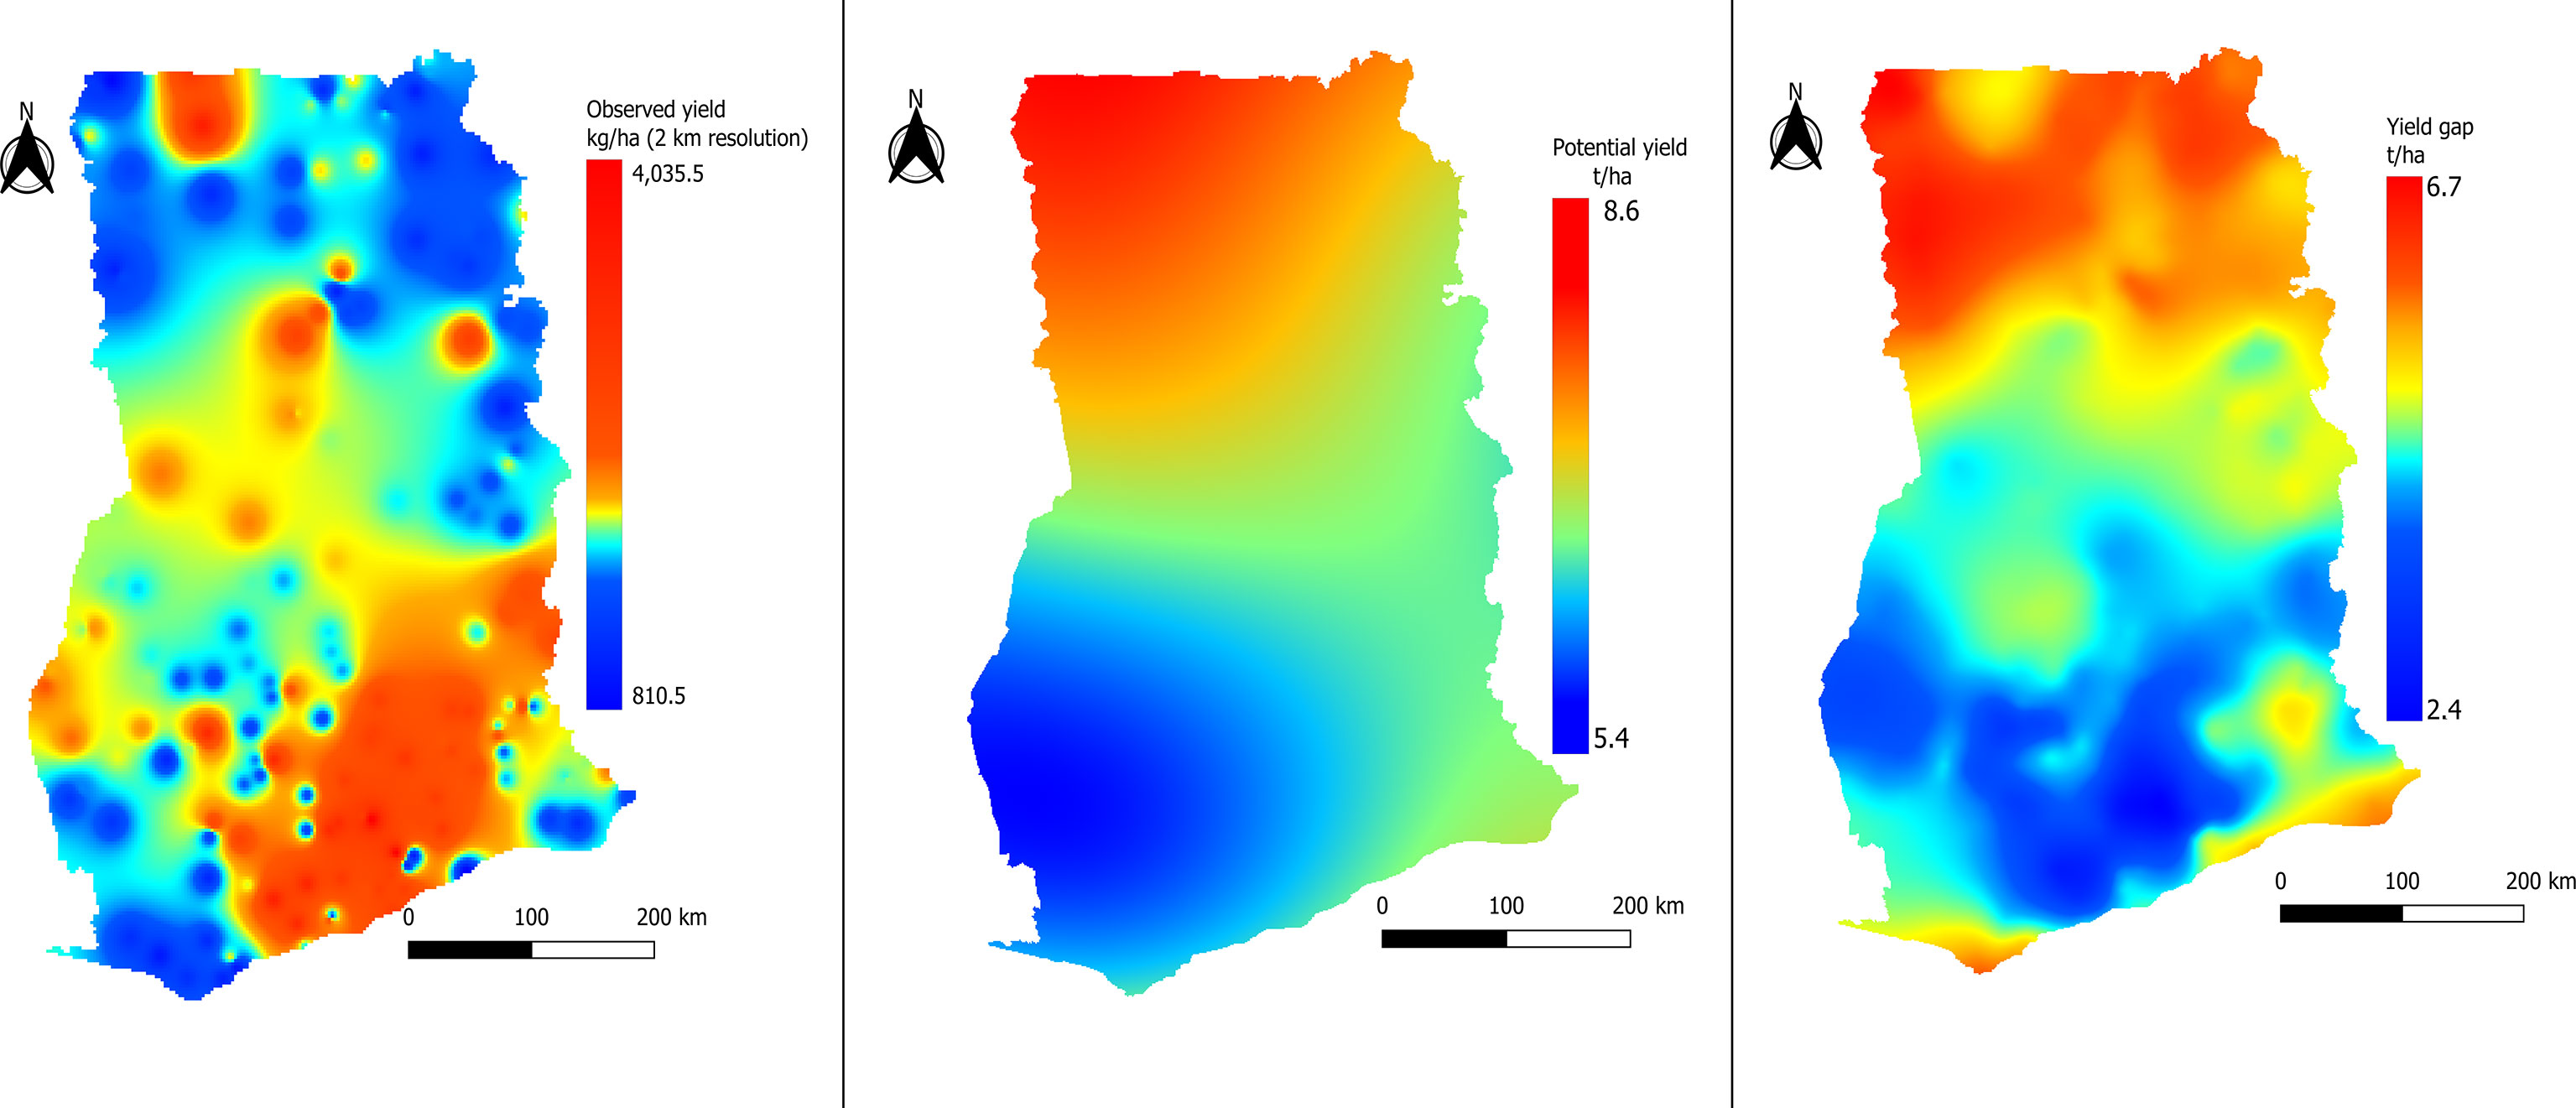
Figure 12 Map of observed yield based on inverse distance weighting interpolation (QGIS) at left. And maps of potential yield and yield gap of maize based on ordinary kriging (2,340 points) at right).
The yield gap follows the same pattern as the potential yield. A huge yield gap was found in the northern regions, while the gap was lower in the southern regions of Ghana. This pattern results from the high potential yield in the northern part of the country compared to the southern part and the low observed yields in the north compared to the south. According to Atiah et al. (69), the variability in the observed yield in Ghana is caused by the variability in rainfall, soil moisture, temperature, and management practices. However, Atiah et al. (69) reported that rainfall and soil moisture have a negative effect on the observed yield in Ghana, which does not concur with our findings.
The low yield in the northern regions is mostly associated with rainfall variability (13) and soil fertility (70). This study reveals that solar radiation also contributes to the yield variability across the country. Air temperature is another factor that affects the observed yield through its effect on the phenological development of the crop. Similarly, Cudjoe et al. (71) found that in northern Ghana maize yield decreases with increased temperature; an increase of 0.1°C reduced maize yield by 0.1 t ha-1.
In addition to all the factors related to management practices and the ecosystem, socioeconomic factors also contribute to the variability in the observed maize yield. Mbanya (72) reported that access to improved seeds, fertilizer, product marketing, processing, and utilization affect crop yield in Ghana. Access to credit was also found to affect farmer productivity, indirectly through its effect on the ability of farmers to purchase inputs or adopt new technologies. In general, farmers in the southern part of the country have more access to markets, credit, extension services, and inputs sources, as they are closer to the big cities and to the ports than farmers in the northern regions. Knowledge gaps also contribute to yield variability.
4. Conclusion
This study found that the LINTUL-1 model can simulate the potential yield of maize in the various agroecological zones in Ghana. High intercepted photosynthetic active radiation in the northern regions create the possibilities for a high potential yield in the northern Ghana, which is not well exploited. However, a higher temperature in the north compared to the south counters some of this potential through its effect on the phenological growth duration. Temperature variability was found to be a major factor that affects the harvest index and therefore the economic yield. High temperature during the regenerative stage accelerates crop growth, while the grain-filling period becomes short. The effect of temperature might be compensated for when high solar radiation is intercepted by the crop, especially during the reproductive stage.
Based on the data collected in eight different locations with 296 different data points, the MLR model enhanced by Akaike information criterion explained 81% of the yield gap. Several factors other than fertilizer were found to explain the yield gap of maize, including soil organic matter, soil water-holding capacity, root zone depth, rainfall, and fertilizer application, particularly nitrogen and sulfur. This study shows that the yield gap decreased by 1.4 t ha-1 with a 1% increase in soil organic matter. Soil organic matter is key for a healthy soil, as it favorably affects all physical, chemical, and (micro)biological properties, and it is especially critical for soil structure, fertility, and water-holding capacity. This finding may encourage researchers to seek interventions to help farmers to manage their fields by focusing their investments on enhancing soil organic matter. An increase in soil pH was found to negatively affect yield within the observed range, which should be studied further as it contradicts common knowledge. Yet, the pH range in the test soils was narrow and near optimal.
Sulfur was found to increase yield, which adds to the evidence that it could be the fourth major nutrient for maize production in Ghana, to be added to the recommended application of NPK. This study underlines the fact that the yield gap of maize in Ghana cannot be closed by only increasing the application of fertilizer. An integrative approach that considers multiple soil health-related properties will be needed to close the yield gap in Ghana.
The methodology used in this study efficiently quantified and explained a large part of the yield gap for maize in Ghana. Rainfall was found to be the main driver for productivity, along with soil water-holding capacity and root zone depth, all of which affect water availability to the plant. Further studies are therefore needed to quantify the water-limited yield levels in Ghana for a more comprehensive explanation of the yield gap caused by edaphic and management factors, in addition to radiation and temperature.
Data availability statement
The raw data supporting the conclusions of this article will be made available by the authors, without undue reservation.
Author contributions
Methodology, formal analysis, original draft preparation, and validation, MB; Conceptualization, supervision, resources, and data curation, PB; Conceptualization and supervision, IK and AK; Supervision, KD; and Conceptualization and resources, WA. All authors have read and agreed to the final manuscript.
Funding
This research was funded by FERARI, https://ifdc.org/projects/fertilizer-research-and-responsible-implementation-ferari/.
Acknowledgments
We are grateful to the Fertilizer Research and responsible Implementation (FERARI) program, managed by the International Fertilizer Development Center (IFDC), for the support of the first author in his master’s degree at ESAFE-UM6P. Especially for this publication, we are thankful to Dr. William Adzawla of IFDC FERARI for the guidance and to Julie Kohler for the English editing.
Conflict of interest
The authors declare that the research was conducted in the absence of any commercial or financial relationships that could be construed as a potential conflict of interest.
Publisher’s note
All claims expressed in this article are solely those of the authors and do not necessarily represent those of their affiliated organizations, or those of the publisher, the editors and the reviewers. Any product that may be evaluated in this article, or claim that may be made by its manufacturer, is not guaranteed or endorsed by the publisher.
Footnotes
- ^ https://ifdc.org/projects/fertilizer-research-and-responsible-implementation-ferari/.
- ^ https://data.gov.gh/.
- ^ https://cran.r-project.org/package=MASS.
- ^ https://cran.r-project.org/package=car.
References
1. Wongnaa CA, Awunyo-Vitor D, Mensah A, Adams F. Profit efficiency among maize farmers and implications for poverty alleviation and food security in Ghana. Sci Afr (2019) 6:e00206 . doi: 10.1016/J.SCIAF.2019.E00206
2. IFPRI and MoFA. Ghana’s maize market. MoFA-IFPRI market brief 1. Washington, DC: International Food Policy Research Institute (IFPRI (2020). doi.org/10.2499/P15738COLL2.133696.
3. IFPRI. Maize productivity in Ghana (2014). Available at: https://www.ifpri.org/publication/maize-productivity-ghana (Accessed February 24, 2022).
4. Worqlul AW, Dile YT, Jeong J, Adimassu Z, Lefore N, Gerik T, et al. Effect of climate change on land suitability for surface irrigation and irrigation potential of the shallow groundwater in Ghana. Comput Electron Agric (2019) 157:110–25. doi: 10.1016/J.COMPAG.2018.12.040
5. Tsiboe F, Egyir IS, Anaman G. Effect of fertilizer subsidy on household level cereal production in Ghana. Sci Afr (2021) 13:e00916. doi: 10.1016/j.sciaf.2021.e00916
6. Adzawla W, Atakora WK, Kissiedu IN, Martey E, Etwire PM, Gouzaye A, et al. Characterization of farmers and the effect of fertilization on maize yields in the Guinea savannah, Sudan savannah, and transitional agroecological zones of Ghana. EFB Bioeconomy J (2021) 1:100019. doi: 10.1016/J.BIOECO.2021.100019
7. Maman G, Idriss S, Wortmann C. Crop yield response to fertilizer relative to soil properties in Sub-Saharan Africa. Soil Sci Soc America J (2018) 82(4):862–70. doi: 10.2136/sssaj2018.02.0066
8. Kouame KKA, Bindraban PS, Kissiedu IN, Atakora WK, El Mejahed K. Evaluation and geospatial analysis of variability in maize yield response to fertilizer (NPK) using modeling in ghana. IFDC FERARI research report no. 7. (2021).
9. Bindraban PS, Stoorvogel JJ, Jansen DM, Vlaming J, Groot JJR. Land quality indicators for sustainable land management: proposed method for yield gap and soil nutrient balance. Agric. Ecosyst Environ (2000) 81(2):103–12. doi: 10.1016/S0167-8809(00)00184-5
10. van Ittersum MK, Cassman KG, Grassini P, Wolf J, Tittonell P, Hochman Z. Yield gap analysis with local to global relevance–a review. Field Crops Res (2013) 143:4–17. doi: 10.1016/J.FCR.2012.09.009
11. van Loon MP, Adjei-Nsiah S, Descheemaeker K, Akotsen-Mensah C, van Dijk M, Morley T, et al. Can yield variability be explained? integrated assessment of maize yield gaps across smallholders in Ghana. Field Crops Res (2019) 236:132–44. doi: 10.1016/J.FCR.2019.03.022
12. Danquah EO, Beletse Y, Stirzaker R, Smith C, Yeboah S, Oteng-Darko P, et al. Monitoring and modelling analysis of maize (Zea mays l.) yield gap in smallholder farming in Ghana. Agriculture (2020) 10(9):420. doi: 10.3390/AGRICULTURE10090420
13. MacCarthy DS, Adiku SG, Freduah BS, Kamara AY, Narh S, Abdulai AL. Evaluating maize yield variability and gaps in two agroecologies in northern Ghana using a crop simulation model. South Afr J Plant Soil (2018) 35(2):137–47. doi: 10.1080/02571862.2017.1354407
14. Mahallati MN. Advances in modeling saffron growth and development at different scales. Saffron (2020), 139–67. doi: 10.1016/B978-0-12-818638-1.00009-5
15. Jones JW, Hoogenboom G, Porter CH, Boote KJ, Batchelor WD, Hunt LA, et al. The DSSAT cropping system model. Eur J Agron (2003) 18(3-4):235–65. doi: 10.1016/S1161-0301(02)00107-7
16. Spitters CJT. Crop growth models: Their usefulness and limitations. Acta Hortic (1990) 267):349–68. doi: 10.17660/ACTAHORTIC.1990.267.42
17. Nyombi K. Understanding growth of East Africa highland banana: experiments and simulation. Wageningen University and Research (2010). Available at: https://edepot.wur.nl/132641.
18. Kooman PL, Haverkort AJ. Modelling development and growth of the potato crop influenced by temperature and daylength: LINTUL-POTATO. In: Potato ecology and modelling of crops under conditions limiting growth. Dordrecht: Springer (1995). p. 41–59. doi: 10.1007/978-94-011-0051-9_3
19. Shibu ME, Leffelaar PA, van Keulen H, Aggarwal PK. LINTUL3, a simulation model for nitrogen-limited situations: Application to rice. Eur J Agron (2010) 32(4):255–71. doi: 10.1016/J.EJA.2010.01.003
20. Muñoz-Sabater J. ERA5-land hourly data from 1981 to present. Copernicus Climate Change Service (C3S) Climate Data Store (CDS (2019). doi: 10.24381/cds.e2161bac
21. Nelson D, Sommers L. Total carbon, organic carbon, and organic matter. In: Methods of soil analysis: Part 2. chemical and microbiological properties, (America:American Society of Agronomy, Inc., Soil Science Society) 2nd edition (1983). doi: 10.2134/agronmonogr9.2.2ed.c29
22. Bray RH, Kurtz LT. Determination of total, organic, and available forms of phosphorus in soils. Soil Sci (1945) 59(1):39–46. doi: 10.1097/00010694-194501000-00006
23. Page AL, Miller RH, Keeney DR. Methods of soil analysis. part 2. chemical and microbiological properties. American Society of Agronomy. Inc Soil Science Society of America (1982). p. 1159.
24. Leenaars JGB, Claessens L, Heuvelink GBM, Hengl T, Ruiperez González M, van Bussel LGJ, et al. Mapping rootable depth and root zone plant-available water holding capacity of the soil of sub-Saharan Africa. Geoderma (2018) 324:18–36. doi: 10.1016/J.GEODERMA.2018.02.046
25. van Oijen M, Leffelaar P. Lintul-1: potential crop growth. wageningen university, models and data library, plant production systems, vol. 10. Wageningen University, Crop Ecology (2010). Available at: https://models.pps.wur.nl/lintul-1-simple-crop-growth-model-simulate-growth-under-potential-growing-conditions.
26. Farré I, Van Oijen M, Leffelaar PA, Faci JM. Analysis of maize growth for different irrigation strategies in northeastern Spain. Eur J Agron (2000) 12(3–4):225–38. doi: 10.1016/S1161-0301(00)00051-4
27. Srivastava AK, Ceglar A, Zeng W, Gaiser T, Mboh CM, Ewert F. The implication of different sets of climate variables on regional maize yield simulations. Atmosphere (2020) 11(2):180. doi: 10.3390/atmos11020180
28. Friedl M, Sulla-Menashe D. MCD12Q1 MODIS/Terra+Aqua land cover type yearly L3 global 500m SIN grid V006 [ (2019). NASA EOSDIS Land Processes DAAC (Accessed 2022-08-29).
29. Adu G, Abdulai M, Alidu H, Nustugah S, Buah S, Kombiok J, et al. Recommended production practices for maize in Ghana. (ResearchGate) (2014). doi: 10.13140/2.1.4376.3527.
30. Lord D, Qin X, Geedipally SR. Fundamentals and data collection. Highway Saf Analytics Modeling (Elsevier) (2021), 17–57. doi: 10.1016/B978-0-12-816818-9.00010-X
31. Kim JH. Multicollinearity and misleading statistical results. Korean J Anesthesiol. (2019) 72(6):558–69. doi: 10.4097/kja.19087
32. Simoni S, Padoan S, Nadeau DF, Diebold M, Porporato A, Barrenetxea G, et al. Hydrologic response of an alpine watershed: Application of a meteorological wireless sensor network to understand streamflow generation. Water Resour Res (2011) 47(10):W10524. doi: 10.1029/2011wr010730
33. MacCarthy DS, Adiku SGK, Freduah BS, Gbefo F, Kamara AY. Using CERES-maize and ENSO as decision support tools to evaluate climate-sensitive farm management practices for maize production in the northern regions of Ghana. Front Plant Sci (2017) 8:31(31). doi: 10.3389/FPLS.2017.00031
34. Tsujimoto Y, Pedro JA, Boina G, Murracama MV, Tobita S, Oya T, et al. An application of digital imagery analysis to understand the effect of n application on light interception, radiation use efficiency, and grain yield of maize under various agro-environments in northern Mozambique. Plant Production Sci (2016) 20(1):12–23. doi: 10.1080/1343943x.2016.1240013
35. Lopez G, Kolem HB, Srivastava AK, Gaiser T, Ewert F. A model-based estimation of resource use efficiencies in maize production in Nigeria. Sustainability (2019) 11(18):5114. doi: 10.3390/SU11185114
36. Nakhforoosh A, Nagel KA, Fiorani F, Bodner G. Deep soil exploration vs. topsoil exploitation: distinctive rooting strategies between wheat landraces and wild relatives. Plant Soil (2021) 459(1–2):397–421. doi: 10.1007/S11104-020-04794-9/FIGURES/8
37. Cai F, Zhang Y, Mi N, Ming H, Zhang S, Zhang H, et al. The effect of drought and sowing date on dry matter accumulation and partitioning in the above-ground organs of maize. Atmosphere (2022) 13(5):677. doi: 10.3390/ATMOS13050677
38. MoFA. Agriculture in Ghana, facts and figures. ministry of food and agriculture, statistics, research and information directorate (SRID) (2015). Available at: https://mofa.gov.gh.
39. Wolf J. Wageningen University:Department(s) Plant Production Systems (2012). Available at: https://research.wur.nl/en/publications/user-guide-for-lintul5-simple-generic-model-for-simulation-of-cro.
40. Amir J, Sinclair TR. A model of the temperature and solar-radiation effects on spring wheat growth and yield. Field Crops Res (1991) 28(1–2):47–58. doi: 10.1016/0378-4290(91)90073-5
41. Iyakaremye V, Zeng G, Ullah I, Gahigi A, Mumo R, Ayugi B. Recent observed changes in extreme high-temperature events and associated meteorological conditions over Africa. Int J Climatol. (2022) 42(9):4522–37. doi: 10.1002/JOC.7485
42. Oduro C, Shuoben B, Ayugi B, Beibei L, Babaousmail H, Sarfo I, et al. Observed and coupled model intercomparison project 6 multimodel simulated changes in near-surface temperature properties over Ghana during the 20th century. Int J Climatol. (2022) 42(7):3681–701. doi: 10.1002/JOC.7439
43. Hou P, Liu Y, Liu W, Yang H, Xie R, Wang K, et al. Quantifying maize grain yield losses caused by climate change based on extensive field data across China. Res. Conserv Recycling (2021) 174:105811. doi: 10.1016/J.RESCONREC.2021.105811
44. Boling AA, Bouman BAM, Tuong TP, Konboon Y, Harnpichitvitaya D. Yield gap analysis and the effect of nitrogen and water on photoperiod-sensitive jasmine rice in north-east Thailand. NJAS: Wageningen J Life Sci (2021) 58(1–2):11–9. doi: 10.1016/J.NJAS.2010.05.001
45. Sileshi G, Akinnifesi FK, Debusho LK, Beedy T, Ajayi OC, Mong’omba S. Variation in maize yield gaps with plant nutrient inputs, soil type and climate across sub-Saharan Africa. Field Crops Res (2010) 116(1):1–13. doi: 10.1016/j.fcr.2009.11.014
46. Kane DA, Bradford MA, Fuller E, Oldfield EE, Wood SA. Soil organic matter protects US maize yields and lowers crop insurance payouts under drought. Environ Res Lett (2021) 16(4):044018. doi: 10.1088/1748-9326/ABE492
47. Oldfield EE, Bradford MA, Wood SA. Global meta-analysis of the relationship between soil organic matter and crop yields. SOIL (2019) 5(1):15–32. doi: 10.5194/SOIL-5-15-2019
48. Murphy BW. Impact of soil organic matter on soil properties–a review with emphasis on Australian soils. Soil Res (2015) 53(6):605–35. doi: 10.1071/SR14246
49. Logah V, Ewusi-Mensah N, Tetteh FKM. Soil organic carbon and crop yield under different soil amendments and cropping systems in the semi-deciduous forest zone of Ghana. J Plant Sci (2011) 6(4):165–73. doi: 10.3923/jps.2011.165.173
50. Heckman JR, Sims JT, Beegle DB, Coale FJ, Herbert SJ, Bruulsema TW, et al. Nutrient removal by corn grain harvest. Agron J (2003) 95(3):587–91. doi: 10.2134/AGRONJ2003.5870
51. Bawa A, Addai IK, Kugbe JX. Evaluation of some genotypes of maize (Zea mays l.) for tolerance to drought in northern Ghana. Res Plant Biol (2015) 5(6):1–12.
52. Incoom ABM, Adjei KA, Odai SN. Rainfall variabilities and droughts in the savannah zone of Ghana from 1960-2015. Sci Afr (2020) 10:1–16. doi: 10.1016/J.SCIAF.2020.E00571
53. Adjei-Nsiah S. Cropping systems, land tenure and social diversity in wenchi, Ghana: Implications for soil fertility management. Wageningen Univ Res (2006).
54. Lawes RA, Oliver YM, Robertson MJ. Integrating the effects of climate and plant available soil water holding capacity on wheat yield. Field Crops Res (2009) 113(3):297–305. doi: 10.1016/J.FCR.2009.06.008
55. Leenaars JGB, Hengl T, Ruiperez González M, Mendes de Jesus JS, Heuvelink GBM, Wolf J, et al. Root Zone Plant-Available Water Holding Capacity of the Sub-Saharan Africa soil, version 1.0. Gridded functional soil information (dataset RZ-PAWHC SSA v. 1.0). ISRIC Report 2015/02. Collaboration project of Africa Soil Information Service (AfSIS) and Global Yield Gap and Water Productivity Atlas (GYGA) (Wageningen, the Netherlands:ISRIC - World Soil Information) (2015) :108.
56. Boateng E, Yangyuoru M, Breuning-Madsen H, MacCarthy DS. Characterization of soil-water retention with coarse fragments in the densu basin of Ghana. West Afr J Appl Ecol (2013) 21(1):31–46.
57. Gao Y, Xie Y, Jiang H, Wu B, Niu J. Soil water status and root distribution across the rooting zone in maize with plastic film mulching. Field Crops Res (2014) 156:40–7. doi: 10.1016/J.FCR.2013.10.016
58. Gardner WR. Relation of root distribution to water uptake and availability. Agron J (1964) 56(1):41–5. doi: 10.2134/AGRONJ1964.00021962005600010013X
59. The C, Calba H, Zonkeng C, Ngonkeu ELM, Adetimirin VO, Mafouasson HA, et al. Responses of maize grain yield to changes in acid soil characteristics after soil amendments. Plant Soil (2006) 284(1–2):45–57. doi: 10.1007/S11104-006-0029-9
60. Kugbe JX, Kombat R, Atakora W. Secondary and micronutrient inclusion in fertilizer formulation impact on maize growth and yield across northern Ghana. Cogent Food Agric (2019) 5(1):1–11. doi: 10.1080/23311932.2019.1700030
61. Agyin-Birikorang S, Tindjina I, Adu-Gyamfi R, Dauda HW, Fugice J, Sanabria J. Managing essential plant nutrients to improve maize productivity in the savanna agroecological zones of northern Ghana: the role of secondary and micronutrients. J Plant Nutr (2022) 0(0):1–20. doi: 10.1080/01904167.2022.2027984
62. Pandey RN, Girish BH. Extractants and critical limits of available soil sulphur for maize (Zea mays l.). J Indian Soc Soil Sci (2007) 55(3):304–12.
63. Essel B, Abaidoo RC, Opoku A, Ewusi-Mensah N. Economically optimal rate for nutrient application to maize in the semi-deciduous forest zone of Ghana. J Soil Sci Plant Nutr (2020) 20(4):1703–13. doi: 10.1007/S42729-020-00240-Y/FIGURES/3
64. Atakora WK, Fosu M, Marthey F. Modeling maize production towards site specific fertilizer recommendation in Ghana. Global J Sci Frontier Res (2014) 14(6):71–81.
65. Adeoye GO, Agboola AA. Critical levels for soil pH, available p, K, zn and Mn and maize ear-leaf content of p, Cu and Mn in sedimentary soils of south-Western Nigeria. Fertilizer Res (1985) 6(1):65–71. doi: 10.1007/BF01058165
66. Fernández V, Ebert G. Foliar iron fertilization: A critical review. J Plant Nutr (2007) 28(12):2113–24. doi: 10.1080/01904160500320954
67. Yang Y, GUO X, Liu H, Liu G, Liu W, Ming B, et al. The effect of solar radiation change on the maize yield gap from the perspectives of dry matter accumulation and distribution. J Integr Agric (2021) 20(2):482–93. doi: 10.1016/S2095-3119(20)63581-X
68. Tanu M, Amponsah W, Yahaya B, Bessah E, Ansah SO, Wemegah CS, et al. Evaluation of global solar radiation, cloudiness index and sky view factor as potential indicators of ghana’s solar energy resource. Sci Afr (2021) 14:e01061. doi: 10.1016/J.SCIAF.2021.E01061
69. Atiah WA, Amekudzi LK, Akum RA, Quansah E, Antwi-Agyei P, Danuor SK. Climate variability and impacts on maize (Zea mays) yield in Ghana, West Africa. Q J R Meteorol. Soc (2022) 148(742):185–98. doi: 10.1002/QJ.4199
70. Antwi M, Duker AA, Fosu M, Abaidoo RC. Geospatial approach to study the spatial distribution of major soil nutrients in the northern region of Ghana. Cogent Geosci (2016) 2(1):1201906. doi: 10.1080/23312041.2016.1201906
71. Cudjoe GP, Antwi-Agyei P, Gyampoh BA. The effect of climate variability on maize production in the ejura-sekyedumase municipality, Ghana. Climate (2021) 9(10):145. doi: 10.3390/cli9100145
Keywords: LINTUL-1 model, light use efficiency, site-specific nutrient management, potential yield, determinants of the yield gap
Citation: Boullouz M, Bindraban PS, Kissiedu IN, Kouame AKK, Devkota KP and Atakora WK (2022) An integrative approach based on crop modeling and geospatial and statistical analysis to quantify and explain the maize (Zea mays) yield gap in Ghana. Front. Soil Sci. 2:1037222. doi: 10.3389/fsoil.2022.1037222
Received: 05 September 2022; Accepted: 03 November 2022;
Published: 30 November 2022.
Edited by:
Renu Pandey, Indian Agricultural Research Institute (ICAR), IndiaReviewed by:
Rajanna Ga, Directorate of Groundnut Research (ICAR-DGR), IndiaSurajit Mondal, Research Complex for Eastern Region (ICAR), India
Copyright © 2022 Boullouz, Bindraban, Kissiedu, Kouame, Devkota and Atakora. This is an open-access article distributed under the terms of the Creative Commons Attribution License (CC BY). The use, distribution or reproduction in other forums is permitted, provided the original author(s) and the copyright owner(s) are credited and that the original publication in this journal is cited, in accordance with accepted academic practice. No use, distribution or reproduction is permitted which does not comply with these terms.
*Correspondence: Prem S. Bindraban, cGJpbmRyYWJhbkBpZmRjLm9yZw==