 Arcadius Martinien Agassin Ahogle1,2*
 Sammy Letema1Gertrud Schaab3Veronica Ngure4Abraham R. Mwesigye5
 Nicholas K. Korir6
- 1Department of Spatial and Environmental Planning, Kenyatta University, Nairobi, Kenya
- 2Department of Soil Science, Faculty of Agronomic Sciences, University of Abomey-Calavi, Abomey-calavi, Benin
- 3Faculty of Information Management and Media, Karlsruhe University of Applied Sciences, Karlsruhe, Germany
- 4Department of Biological Sciences, Laikipia University, Nyahururu, Kenya
- 5School of Forestry, Environment and Geographical Sciences, College of Agriculture and Environmental Sciences, Makerere University-Kampala, Kampala, Uganda
- 6Department of Agricultural Science and Technology, Kenyatta University, Nairobi, Kenya
Introduction: With urbanization and industrialization in the developing world, urban and peri-urban agriculture is increasingly contributing to urban food systems, employment, and income generation opportunities. However, urbanization and industrialization may release harmful pollutants, including heavy metals and trace elements into agricultural soils, posing ecological, environmental and public health concerns. This paper assessed the potential risks of soil contamination with heavy metals and trace elements in peri-urban farmlands in Nairobi city catchment in Kenya.
Methods: A total of 60 soil samples were collected from ten vegetable farming zones (S1-S10) and processed following standard protocols. The concentrations of As, Cd, Co, Cr, Cu, Fe, Hg, Mn, Ni, Pb, V and Zn were analyzed in the samples using inductively coupled plasma-mass spectrometry (ICP-MS).
Results and discussion: Results revealed that the soil samples have elevated concentrations of As, Cd, Co, Cr, Cu, Fe, Hg, Mn, Ni, Pb, V and Zn, with some elements including As (1.7%), Cd (13.3%), Mn (80%), Pb (1.7%) and Zn (11.7%) exceeding the permissible thresholds for agricultural soils. The spatial distribution of the elements exhibited three similar distribution patterns with slight variations between the hotspot sites of the different elements: (i) Co and Mn, (ii) Cu and Cr and (iii) As, Cd, Fe, Hg, Pb and Zn, while Ni and V exhibited singular spatial distributions compared to other elements. Elements such as As, Cd, Co, Fe, Hg, Mn, Pb and Zn appeared to be of anthropogenic enrichment, while Cr, Cu, Ni and V appeared to originate mainly from lithogenic and natural sources. The elements As, Cd, Hg and Pb exhibited high ecological risks, with Cd contributing about 46-66% of the overall ecological risk. The sampling sites S1, S5, S7, S9 and S10 depicted the highest ecological risks of 145, 103, 146, 121 and 146, respectively. The findings call for proper zoning of suitable agricultural areas and sound waste management protocols in urban and peri-urban landscapes. Further, remediation of contaminated soils and farmers’ sensitization are recommended for ecological and public health risk alleviation.
1. Introduction
Agriculture plays a multifunctional and crucial role in urban and peri-urban landscapes (1) due to its significant contribution to urban food systems, employment, income opportunities, and sustainability of ecosystem services (2). Urban and peri-urban agriculture (UPA) aids in controlling urban air and thermal temperature generated by expanded impervious land surfaces (3). In Sub-Saharan Africa, Asia and Latin America, UPA is deeply embedded in citizens’ livelihood and not only contributes substantially to urban diet diversification, but also represents an essential source of income for both local and international produce markets (4). However, urban and peri-urban agriculture in the developing world resides in a contrasted and sometimes illegal environment with substantial risks of pollution from domestic, urban and industrial waste and emissions (5, 6). The expansion of urban areas and their fringes has been accompanied by intensive dissemination and accumulation of metal elements in soil and water bodies (7). This has resulted in widespread concerns regarding water quality, soil contamination, and the safety of agricultural products supplied to metropolitan populations (8–10).
Peri-urban landscapes are characterized by presence of mosaic of urban infrastructures, relatively dense road network, industrial areas and relatively large farmland mainly supplying fruit and vegetable to city dwellers (4). In contrast to rural soils, urban and peri-urban soils are highly disturbed and exposed to different anthropogenic activities in or round cities, which often result in significant contamination and degradation of soil intrinsic physicochemical and biological processes (11; 12). Soil acts as a sink in the environment and accumulates the metal elements emitted leading to excessive long-term toxicity (13). Heavy metal contamination in urban and peri-urban agricultural soils, has become a severe environmental and public health concern over the last decades (14–16).
Metal elements can originate from natural sources (volcanic emission and rock weathering) and anthropogenic activities such as industrial waste, urban emissions, mining operations, thermal power plants, metallurgy, electronics, textiles, and wastewater irrigation (17, 18). The level of heavy metals and trace elements diffusion induced by anthropogenic activities has been estimated to be higher than the natural diffusion sources (19).
Plant exposure to contaminated soil at farm level results in metal element accumulation in edible plant portions, entering the food chains (20). Although some of the elements such as iron (Fe), manganese (Mn), cobalt (Co), copper (Cu), chromium (Cr), nickel (Ni), zinc (Zn), and molybdenum (Mo) are necessary in trace quantities for plants, animal and human metabolisms, they become toxic and harmful when they exceed the recommended thresholds (18). Metals such as lead (Pb), mercury (Hg), cadmium (Cd), vanadium (V) and arsenic (As) have no known importance to human metabolism and adversely affect the health of plants, animals and humans even at very low concentrations (21, 22). The adverse effects of heavy metals and trace elements contamination on human health are numerous, complex to treat, and in severe cases, they can cause death (23).
Previous studies in Kenya reported an increased burden of potentially harmful metal elements in soil, water bodies and consumed vegetables. Kinuthia et al. (24) reported high levels of Cd, Cr, Hg, Ni, Pb and Tl (Thallium) in soil and open drainage canal water in the industrial area of Nairobi city. Other studies including Inoti et al. (25), Karanja et al. (26), Mungai et al. (27)Mutune et al. (28), Nyandika et al. (29) recorded concentrations of different metal elements in vegetable and irrigation water from different locations in urban and peri-urban areas of Kenya that were above permissible levels.
Despite this plethora of studies, there is limited information on the extent of contamination of heavy metals and trace elements in urban and peri-urban agricultural soils, from which fresh horticultural products are grown and supplied to the metropolitan markets (30). Less is also known about the spatial distribution of heavy metals and trace elements at small-scale farmland level in the city catchment. Few studies have emphasized the magnitude of the ecological risks related to heavy metals and trace elements contamination in urban and peri-urban farmlands in Kenya, especially with a combination of a wide range of metal elements that this paper assessed. Therefore, this paper reports on the levels of heavy metals and trace elements concentration, their spatial distribution and their potential ecological risk in peri-urban soils in Nairobi city catchment, Kenya.
2. Materials and Methods
2.1. Study area and sampling sites
The paper is based on a study carried out in peri-urban agricultural landscapes located in Nairobi city catchment in Kenya. The area lies on the north-eastern side of Nairobi city between 1°14’32” and 1°29’21” S latitude and between 36°57’59” and 37°07’30” E longitude (Figure 1). The area is a plateau with elevation varying between 1440 and 1610 m altitude. Predominant soils include deep and well-developed black to dark-greyish clays and dark-greyish-brown calcareous soils suitable for agricultural production (31). The catchment is endowed with an extended water drainage system composed of Nairobi River with two tributaries, Ngong and Mathare Rivers flowing through the capital city Nairobi and Athi Rivers flowing through Athi River Town, the industrial area (Athi Rivers Town) and the export processing zone (EPZ) wastewater treatment plant. These urban streams serve various purposes, including farm irrigation, and domestic and industrial uses. The area experiences significant urbanization with population growth and extensive industrial development. Urbanization and industrialization have resulted in increased environmental pollution from the discharge of untreated domestic and industrial wastewater in the river network (32, 33). Various horticultural activities are conducted year-round along the rivers owing to the availability of irrigation water.
2.2. Sample collection and preparation
An exploration of the catchment was carried out to identify fruits and vegetable farmlands bounded by Nairobi River and Athi River in the catchment. After mapping the farmlands, a stratification of the study area based on agricultural land location and potential contamination sources such as domestic sewage, urban wastewater, industrial areas and the presence of settlements was conducted to subdivide the study area into distinct sampling stations. The farmland segregation considered their locations in the catchment: farmlands located around medium to high density residential and industrial areas, along roads, along rivers before and after wastewater treatment plant effluent discharge point (Table 1). This led to the subdivision of the area into ten relatively homogeneous sampling stations, S1 to S10 (Figure 1; Table 1). A detailed description of the sampling sites including the coordinate is provided in the Supplementary Materials (Table S1). In each sampling station, triplicate composites soil samples were collected in the dry season of September (n = 3 x 10 = 30) and during the wet season of November (n = 3 x 10 = 30) in 2021. A total of six composite soil samples (three per season) obtained at each sampling station from eight to ten random sampling points arranged in a zig-zag sampling pattern were collected using a stainless-steel soil auger from topsoil layer (0-20 cm depth). Each sample was double packaged in a sealed and clean polythene bag and transported to the laboratory for preparation. The samples were air-dried for four weeks, finely grounded and sieved to less than 1 mm and stored in plastic zip lock bags awaiting laboratory analysis for heavy metals and trace elements.
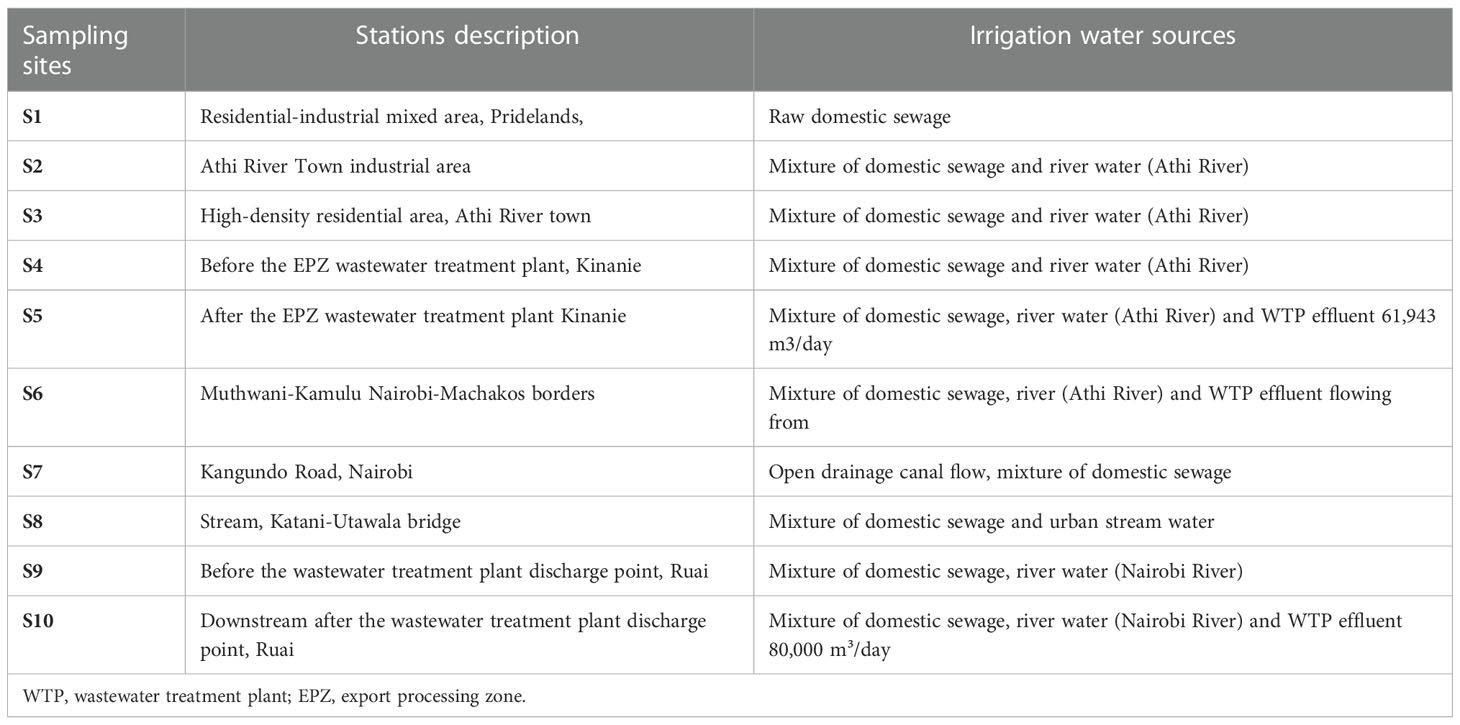
Table 1 Sampling sites characteristics.
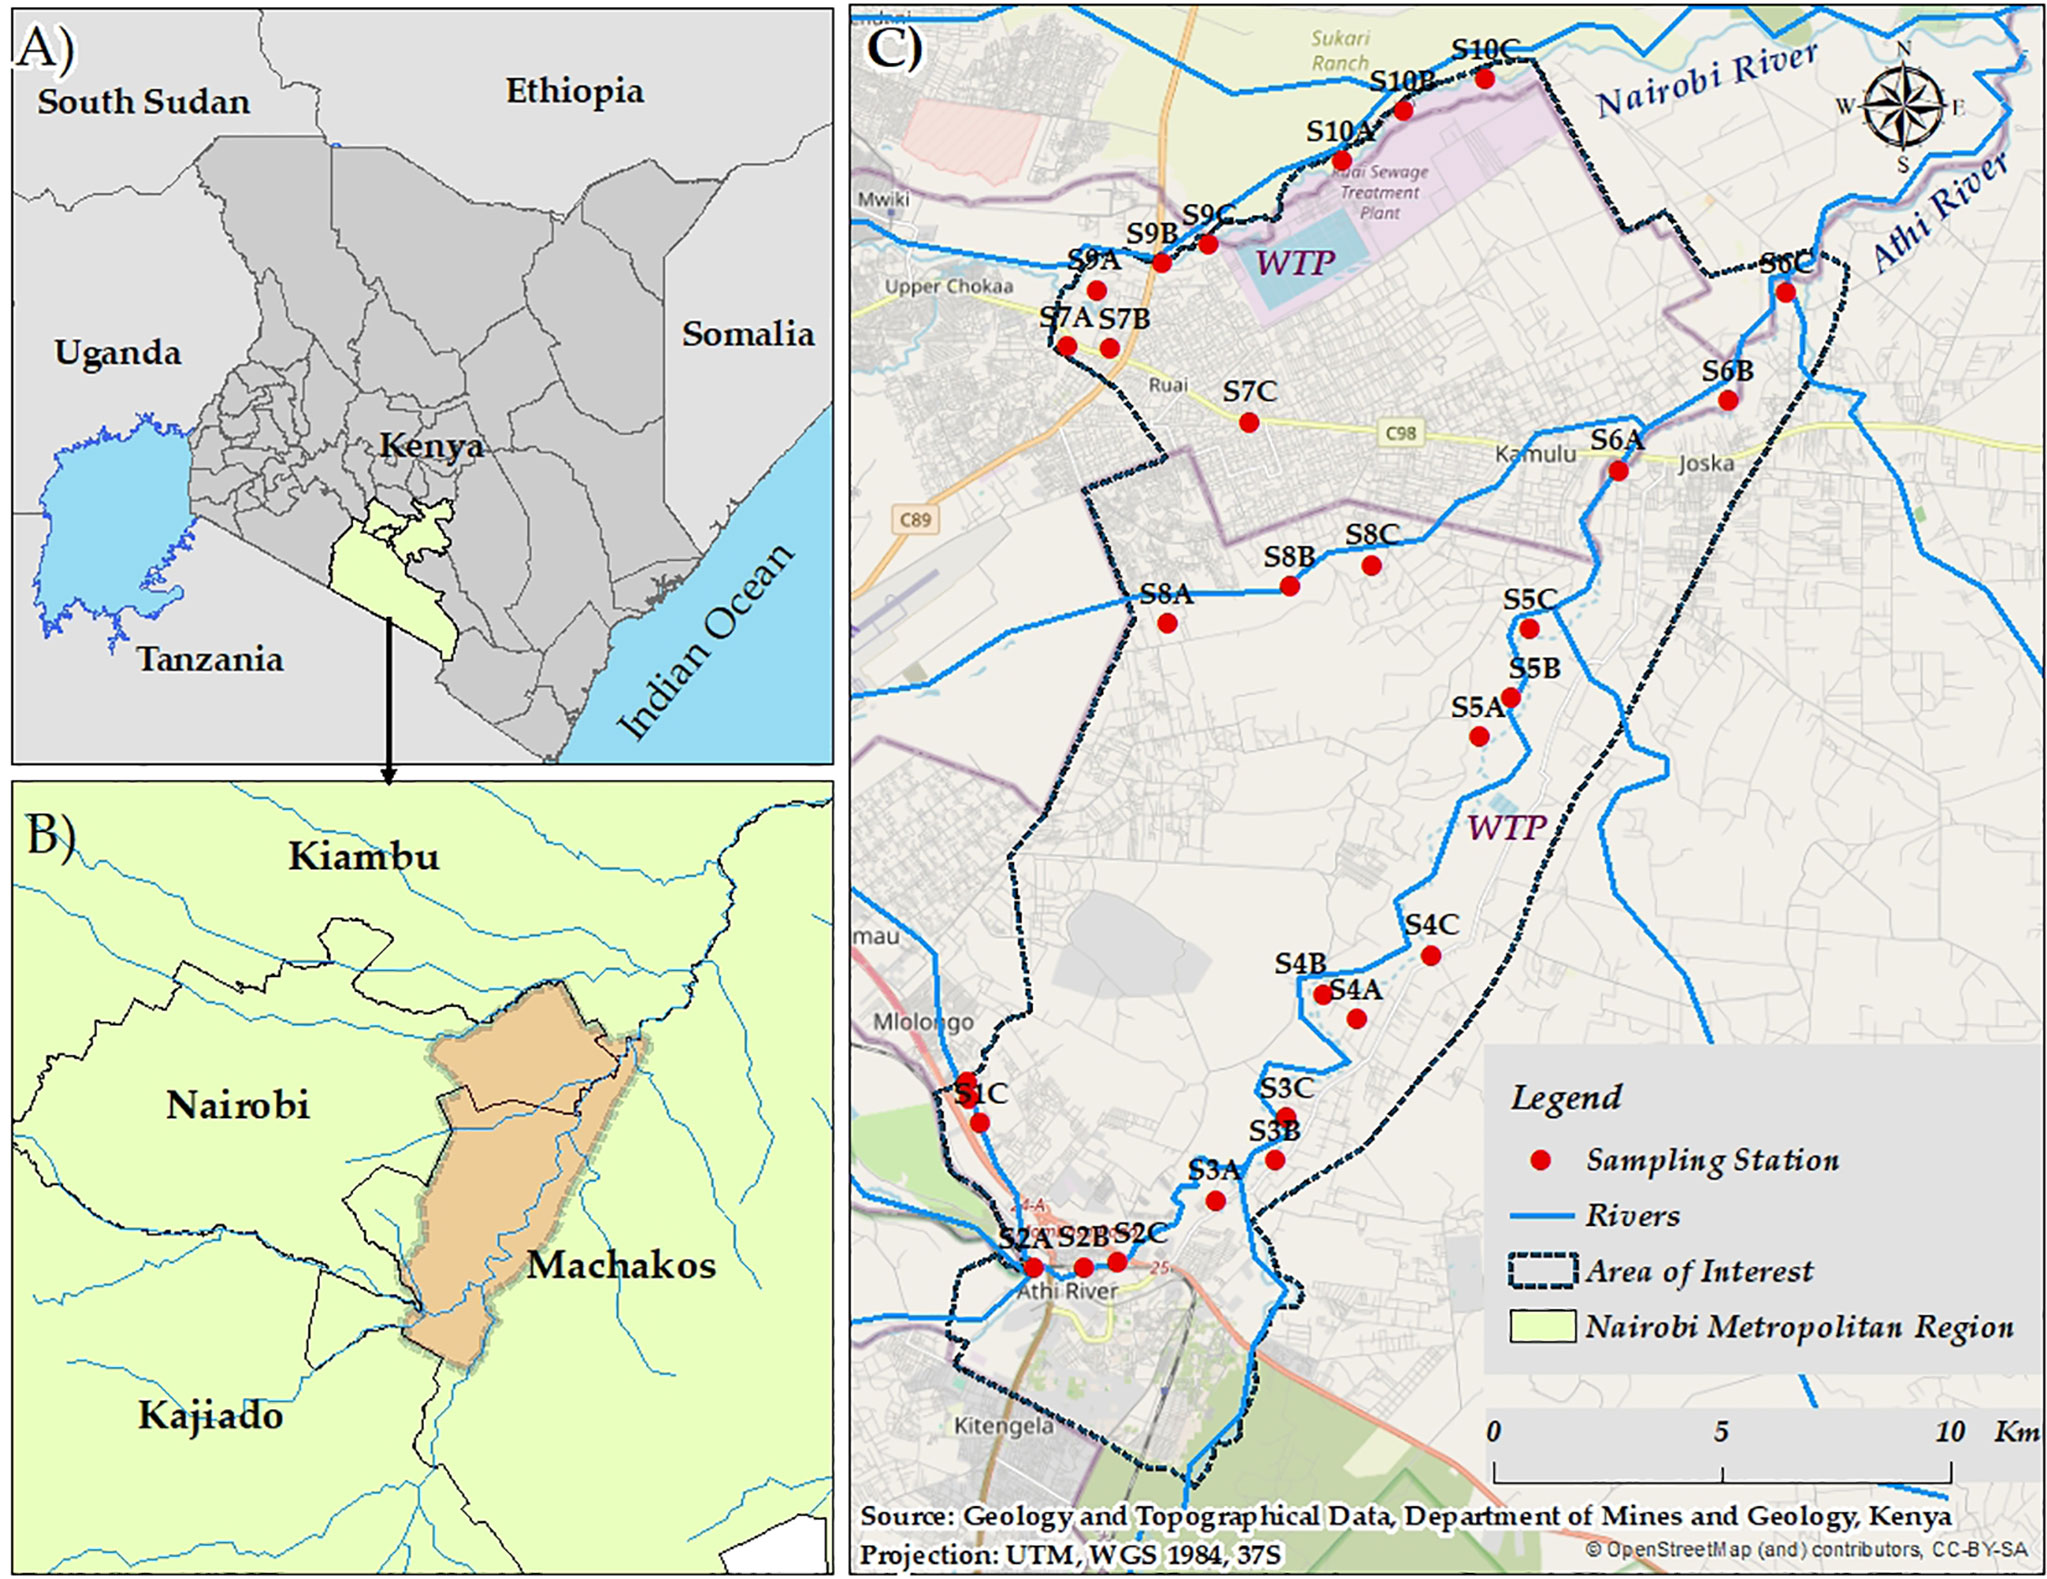
Figure 1 Sketch map of the study area showing the sampling sites in Nairobi city catchment, Kenya; (A) countries; (B) Nairobi Metropolitan Region; (C) Area of interest; WTP, wastewater treatment plant.
2.3. Heavy metals and trace elements analysis
About 0.5 mg of soil were digested in perfluoroalkoxy (PFA) vials using 2.5 ml hydrofluoric acid (HF; 40% Analytical Reagent-AR), 2.0 ml HNO3 (70%, Trace Analytical Grade-TAG), 1.0 ml HClO4 (70%, AR) and 2.5 ml Milli-Q water in a 48-place Tefloncoated graphite block digester (Model A3, Analysco Ltd., UK). Elemental concentrations in digest solutions were analyzed by inductively coupled plasma mass spectrometry (ICP-MS, Th ermo-Fisher iCAP-Q model). The concentrations of 28 elements, including As, Cd, Cr, Co, Cu, Fe, Mn, Ni, Pb, V and Zn were measured by ICP-MS with ‘‘in-sample switching’’ between three operational modes standard mode and kinetic energy discrimination with either He or H2 as the cell gas to reduce polyatomic interferences. Internal standards included Sc (10 μg.l−1), Ge (10 μg.l−1), Rh (5 μg.l−1) and Ir (2 μg.l−1) in 2% trace analytical grade (TAG) HNO3. External multi-element calibration standards (Claritas-PPT grade CLMS-2, Certiprep) included elements in the concentration range of 0–100 μg.l−1. The Hg analysis was performed using thermal decomposition amalgamation with an atomic absorption spectrophotometry. All laboratory analyses were performed in the School of Biosciences, Nottingham University in the United Kingdom.
2.4. Soil pollution and ecological risk assessments
2.4.1. Enrichment factor
The Enrichment Factor (EF) is a single element index that allows to determine the contribution of anthropogenic activities to heavy metal and trace element concentrations in soil. The determination of EF is based on a low variability occurrence metals, usually Fe, Al, Ca, Ti, Sc or Mn, which serve as reference metals (34). In this paper, iron (Fe) was used as reference element for EF computation as shown in Equation 1 (35).
Where Cn is the concentration of the given element in the soil sample collected, Fe is the concentration of iron in the given sample, GB is the background concentration of the element in the uncontaminated soils while FeE is the background concentration of iron. The EF values between 0.5 and 1.5 indicate utterly natural sources of heavy metals whereas values above 1.5 indicate anthropogenic enrichment. The heavy metals and trace elements concentrations of the upper continental crust by Wedepohl (36) were used as background values.
2.4.2. Pollution load index
The Pollution Load Index (PLI) is used to assess the overall extent of metals and trace elements contamination in soil. The PLI is widely used compared to other pollution indices for it gives a simple and comparative soil quality condition related to heavy metals and trace elements contamination using all analyzed elements (37). The PLI is computed as the nth root of the product of single pollution index (PI) of all the metals analyzed (Equations 2 and 3). Soil quality is classified as polluted when PLI exceeds 1.
2.4.3. Potential ecological risk ( and RI)
The ecological risk related to heavy metals and trace elements contamination in the farmland was assessed using Hakanson ecological risk index (RI). RI is used to evaluate the extent of the threat related to heavy metal and trace element contamination to human health, ecosystem and environmental sustainability (38). To compute RI, each metal’s single pollution index (PI) was multiplied by its toxicity response coefficient, giving the single metal ecological risks, which were then summed into a single value (Equations 4 and 5). The toxicity response coefficient for RI defined by Hakanson (38) included As (10), Cd (30), Cr (2), Cu (5), Hg (40), Ni (5), Pb (5) and Zn (1). The ecological risk was estimated only for these elements.
Where n, and represent the number of heavy metals and trace elements, the single index of the ecological risk, and the toxicity response coefficient. Soil quality classification based on and RI values is presented in Table 2.
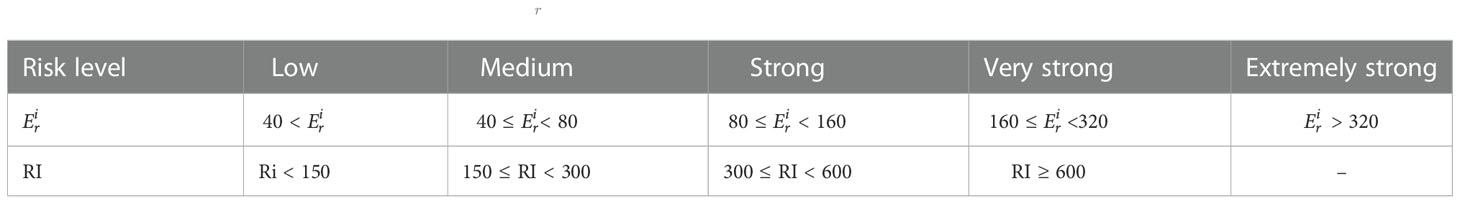
Table 2 Hakanson potential ecological risk levels ( and RI).
2.5. Quality control and assurance
All soil samples were prepared and analyzed in replicates. The reagents used for sample digestions and laboratory tests were analytical reagents (AR) or trace analytical grade (TAG) reagents supplied by Fisher Scientific, UK. In each analytical run, blanks and certified reference materials (CRMs) were included to provide realistic limits of detection and limit of quantification of each element. Average limit of detection (LOD) were As (0.005 mg/kg); Cd (0.002 mg/kg); Co (0.001 mg/kg); Cr (0.047 mg/kg); Cu (0.032 mg/kg); Fe (1.040 mg/kg); Hg (0.001 ng); Mn (0.035 mg/kg), Ni (0.048 mg/kg); Pb (0.026 mg/kg); V (0.048 mg/kg) and Zn (2.659 mg/kg). Heavy metals and trace elements recoveries were assessed in each analytical run using certified reference material BCR–142R – Light sandy soil (IRMM, 2007). The average recoveries were Cd (96.64%); Ni (87.17%); Pb (91.23%) and Zn (96.39%).
2.6. Data analysis
Heavy metals and trace elements concentrations in soil at the different sites were screened for normal distribution using Shapiro-Wilk test (39) and variance homogeneity was tested using Bartlett’s test (40). Log or Box-Cox data transformations were applied where necessary to achieve normality and variance homogeneity conditions. One-way ANOVA was used to determine significant differences between heavy metals and trace elements in the sampling sites (S1-S10) while Tukey’s post hoc test was used to separate the means at 5% significance level threshold. The spatial distribution of heavy metals and trace elements in the catchment was explored using geostatistical modelling and ordinal kriging in ArcMap 10.8.2. Ordinal kriging is one of the most employed interpolation techniques in environmental modelling (41). It allows estimating a value of a specific parameter at an unsampled location based on the application of a geospatial algorithm on the results of sampled locations. For each element, the ordinal kriging was fitted based on variogram analysis. The most accurate model was selected by comparing the shape of the curve of the experimental variogram to the curve of the mathematical functions (42). Pearson correlation matrix was used to assess the correlation between the elements (43). Additionally, principal component analysis (PCA) followed by hierarchical clustering on principal component analysis (HCPC) was performed to establish the relationship between the heavy metals and trace elements and their potential sources (44). All the statistical analyses were performed in R statistical software version 4.1.2 (45). ANOVA was implemented with the car package, and Pearson correlation was run using the packages Hmisc (46), PerformanceAnalytics (47), ggstatsplot (48) and corrplot (49). PCA and HCPC were performed with the packages ade4 (50), FactomineR (51), and Factoextra (52).
3. Results
3.1. Concentration of heavy metals and trace elements in agricultural soils in Nairobi city catchment
The average (mean ± standard deviation) and the range of heavy metals and trace elements concentration in soil observed in the different sites are presented in Table 3. The concentrations of all the heavy metals and trace elements except Pb exhibited significantly higher variation across the sites (p < 0.01).
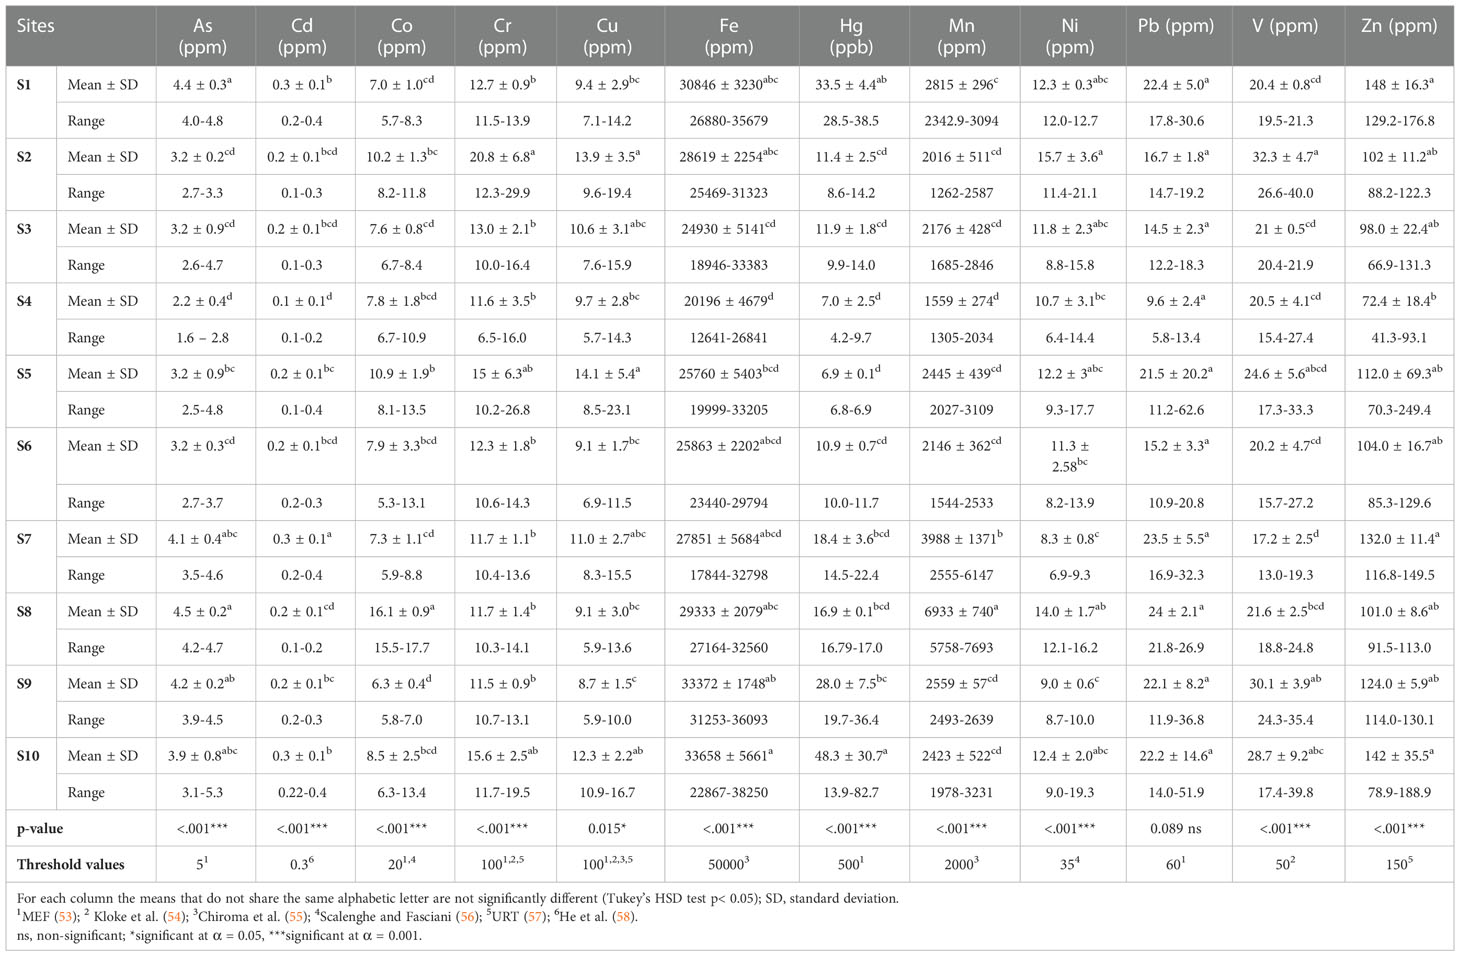
Table 3 Heavy metals and trace elements concentrations in soil in Nairobi city catchment.
Arsenic (As) concentrations ranged between 1.6 and 5.3 mg/kg. The sites S1, S7, S8, S9 and S10 recorded the highest As concentrations at 4.8, 4.6, 4.7, 4.5, and 5.3 mg/kg, respectively. Although only 1.7% of the samples (at S10) showed above the permissible concentration of As for agricultural soil, 43.3% of the samples showed concentrations very close to the threshold value of 5 mg/kg (53). The average concentration of As in the soil per site appeared in the descending order S8 > S1 > S9 > S7 > S10 > S5 > S3 > S6 > S2 > S4.
Cadmium (Cd) concentration in soil varied between 0.1 and 0.4 mg/kg, and the sites S1, S5, S7, S9 and S10 recorded the highest Cd concentrations (0.4 mg/kg). Above permissible threshold concentration of Cd for agricultural soil of 0.3 mg/kg (53) was observed for 13.3% of the samples, which originated from the sites S1, S5, S7, and S10. Additionally, 55% of the samples recorded a concentration close to the threshold concentration (0.2 ≤ Cd< 0.3).
Cobalt (Co) concentration in the soil ranged from 5.3 to 17.7 mg/kg, with the sites S2, S5, and S8 recording the highest concentrations of 11.8, 13.5, and 17.7 mg/kg, respectively. Soil concentrations of Co for the different sites were within the recommended range (≤ 20 mg/kg) for agricultural use (53, 58).
Chromium (Cr) concentrations in the soil varied between 6.5 and 29.9 mg/kg and were below the threshold concentration for agricultural soil of 100 mg/kg (57). The highest Cr concentrations in soil were recorded at S2, S5 and S10 with 29.9, 26.8, and 19.5 mg/kg, respectively. The sites ranked according to Cr content in soil were in the descending order, S2 > S5 > S10 > S3 > S1 > S8 > S7 > S6 > S4 > S9.
Copper (Cu) concentration in soil ranged from 6.5 to 23.1 mg/kg and the highest concentrations were recorded at S2 (19.4 mg/kg), S5 (23.1 mg/kg), and S10 (16.7 mg/kg). The Cu contents in soils were lower than the permissible limit of 100 mg/kg for agricultural soil (55, 57). The Cu concentrations ranking in the sampling sites were in the decreasing order S5 > S2 > S10 > S7 > S3 > S4 > S1 > S8 > S6 > S9.
Iron (Fe) concentrations in soil varied between 17, 844 and 38, 250 mg/kg, which were within the permissible range of 50, 000 mg/kg Fe for agricultural soil. The highest Fe contents in soil were recorded at S1 (35, 679 mg/kg), S9 (36, 093 mg/kg) and S10 (38, 250 mg/kg).
The mercury (Hg) concentrations in soil ranged from 6.8 to 82.7 µg/kg, with the highest concentrations in soil recorded at S1 (38.5 µg/kg), S9 (36.4 µg/kg) and S10 (82.7 µg/kg). The Hg concentrations in all the sites were within the permissible limit of 500 µg/kg for agricultural soil (53). The concentration of Hg in soil in the sites appeared in the order S10 > S1 > S9 > S7 > S8 > S3 > S2 > S6 > S4 > S5.
Manganese (Mn) content in soil ranged between 1, 262 and 7, 693 mg/kg, with the sites S8 and S7 recording the highest concentrations. Mn contents above the permissible range of 2000mg/kg for agricultural soil (55) were recorded in the sites S1, S2, S3, S5, S6, S7, S8, S9 and S10 with 80% of the samples. Considering the concentration of Mn in soil, the sites were in the order S8 > S7 > S1 > S9 > S5 > S10 > S3 > S6 > S2 > S4.
Nickel (Ni) concentrations in the soil varied between 6.4 and 21.1 mg/kg. In all the sites, Ni concentrations were within the permissible range of 35 mg/kg for agricultural soil (56). The sites S1, S2, S5, S8, and S10 recorded the highest concentrations of Ni, between 14.0 and 21.1 mg/kg.
Lead (Pb) concentrations in the soil ranged between 5.8 and 62.6 mg/kg, with the highest concentration recorded at the sites S5 (62.6 mg/kg) and S10 (51.9 mg/kg). Pb concentrations were within the permissible limit of 60 mg/kg for agricultural soil (53) for all the sites except S5, with 1.7% of the samples. The sites based on Pb concentrations were in the decreasing order S5 > S8 > S7 > S1 > S10 > S9 > S2 > S6 > S3 > S4.
Vanadium (V) concentrations in soil samples ranged between 13 and 40 mg/kg. The highest V concentration in soil was recorded at S2 and the sites ranking in the decreasing order were S2 > S9 > S10 > S5 S8 > S3 > S4> S1 > S6 > S7. Vanadium concentrations in the soil from all the sites were within the limit range of 50 mg/kg for agricultural soil (54).
Zinc (Zn) concentrations in the soil varied between 41.3 and 249.4 mg/kg. The sites S1, S5 and S10 exhibited above permissible Zn limit (150 mg/kg) for agricultural soil (57), which represented 11.7% of the samples. Additionally, 13.3% of the samples showed concentrations very close to the threshold value. The sites were ranked according to Zn concentrations in soil in the decreasing order S1 > S10 > S7 > S5 > S9 > S5 > S6 > S2 > S8 > S3 > S4.
3.2. Spatial distribution patterns of heavy metals and trace elements in agricultural soils in Nairobi city catchment
The spatial distribution of the twelve elements (Figure 2) illustrated the distinct zones of lower or higher concentrations. Although the spatial distributions of the different heavy metals and trace elements were not uniform across the catchment, the patterns of their spatial distributions exhibited some similarities and dissimilarities. Three similar distribution patterns were observed across the catchment with slight variation between the hotspot sites for the different heavy metals and trace elements: (i) Co and Mn, (ii) Cu and Cr and (iii) As, Cd, Fe, Hg, Pb and Zn. For As, the leading hotspots sites were S1, S7, S8, S9 and S10; for Cd and Zn it was S1, S5, S7, S9 and S10; for Co and Mn it was S8; for Cr and Cu it was S2, S5 and S10; for Fe it was S1, S8, S9 and S10; for Pb it was S1, S5, S7, S8, S9 and S10, while for Hg it was S1, S9 and S10. The elements Ni and V exhibited singular spatial distribution compared to other elements with the sites S1, S2, S5, S8 and S10 being the hotspots for Ni and the sites S2, S9 and S10 being the hotspots for V.
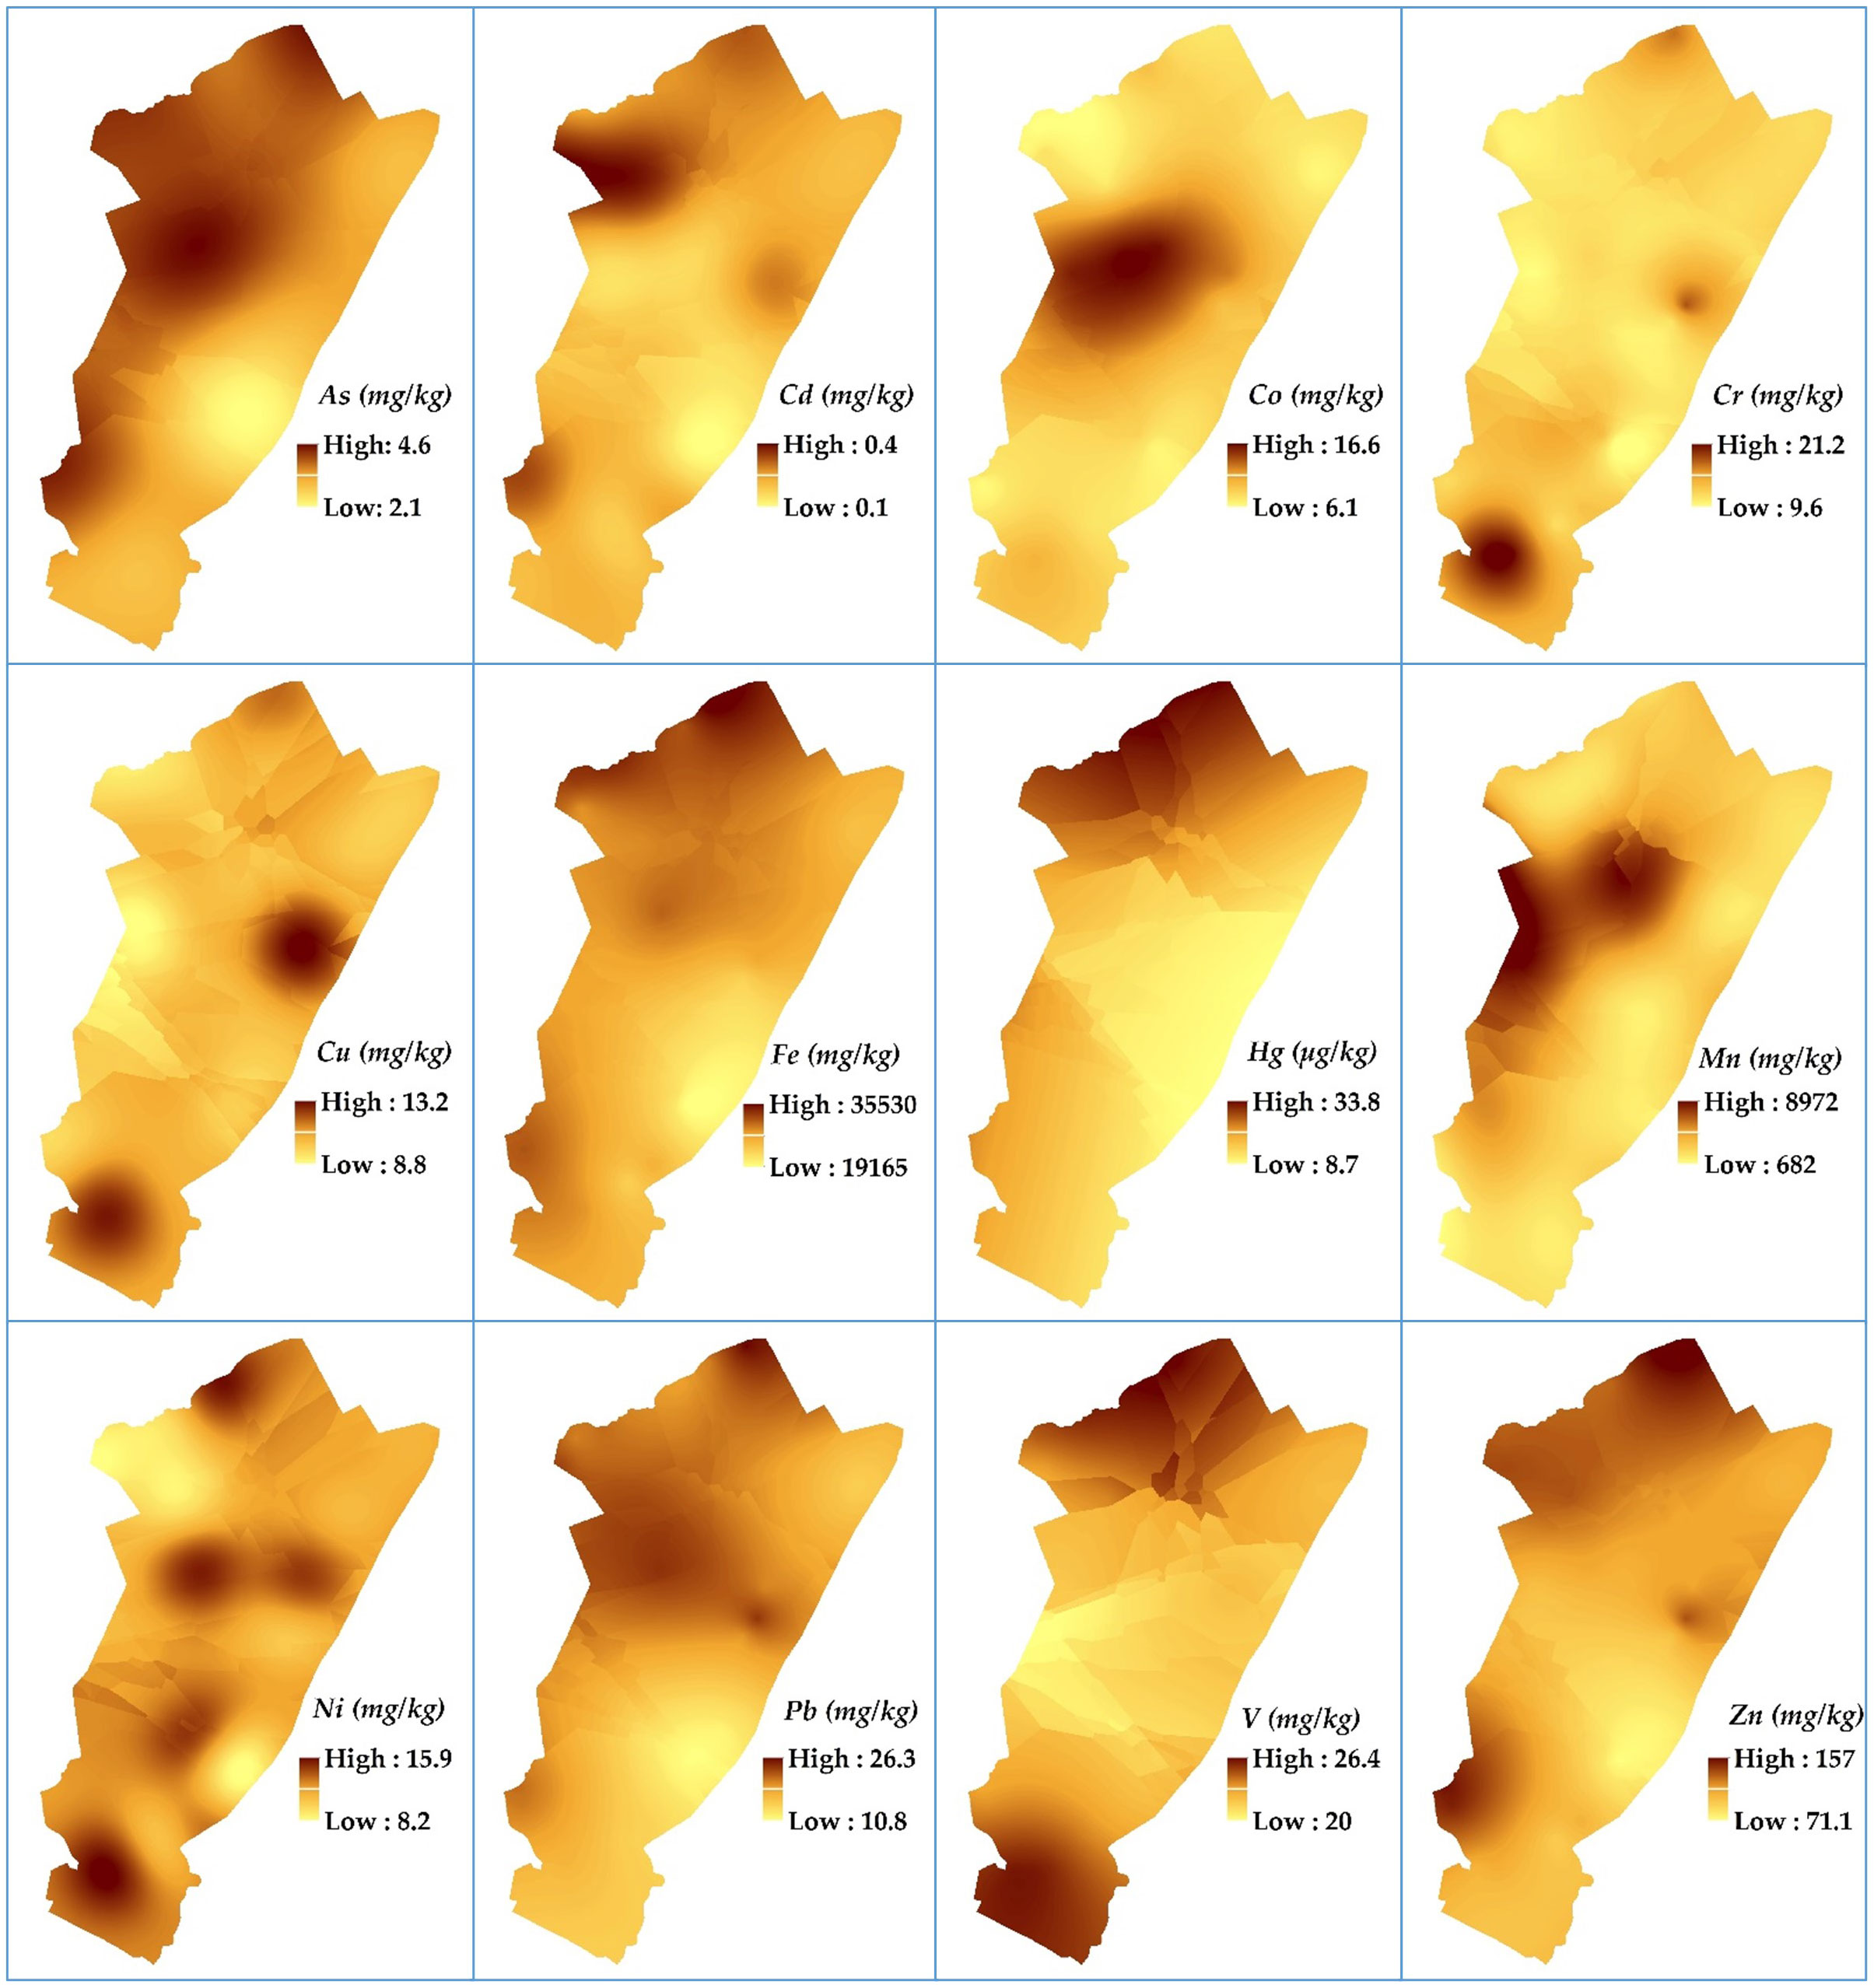
Figure 2 Spatial distribution of heavy metals and trace elements in agricultural soils across Nairobi city catchment.
3.3. Soil contamination and pollution in Nairobi city catchment
The Pollution Load Index (PLI) computed using the twelve heavy metals and trace elements (equation 3) showed a significant variation in pollution levels across the sites (p< 0.001) ranging from 0.67 to 1.35 (Figure 3). Pollution indices were in the decreasing order S10 > S8 > S1 > S7 > S2 > S9 > S5 > S3 > S6 > S4. The average PLI of the sites S1, S7, S8 and S10 were classified as polluted (PLI > 1). Besides, for the sites S2, S5 and S9, 50%, 33.3% and 50% of the samples were classified as contaminated, respectively.
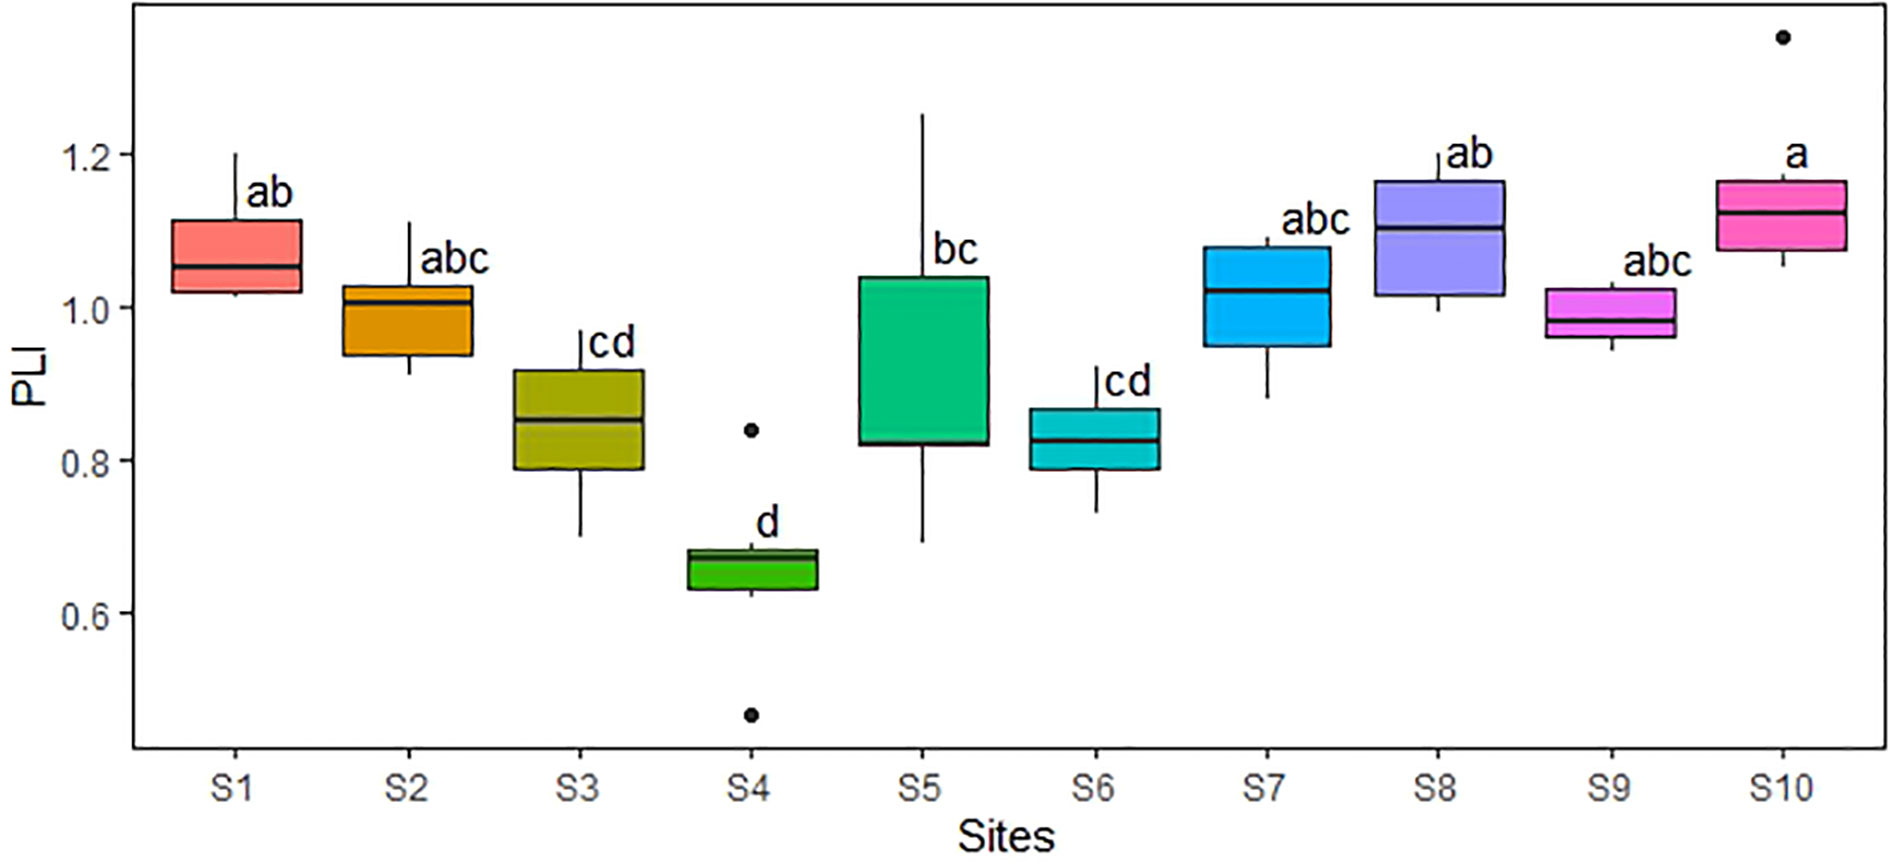
Figure 3 Box plot showing the Pollution Load Index (PLI) in agricultural soils in Nairobi city catchment. Box plots that are not sharing the same letter(s) are significantly different at α = 0.001.
3.4. Heavy metals and trace element sources apportionment in agricultural soils in Nairobi city catchment
3.4.1. Enrichment factor of heavy metals and trace elements
The Enrichment Factor (equation 1) of the heavy metals and trace elements in peri-urban agricultural soils are displayed in Table 4. The EF values for Ni (0.4-1.1), Cr (0.3-0.8), and V (0.3-0.8) were lower than 1.5, indicating that they were of lithogenic or natural sources. The EF values exceeded 1.5 in all the sites for the elements As (1.7-2.2), Cd (1.5-3.6), Mn (4.2-14), and Zn (2.1-3.9), which indicated that these metal elements originated from anthropogenic sources. The EF values for Co (0.4-1.6), Cu (0.4-1.9), Hg (0.1-2.0) and Pb (0.6-3.4) ranged from less than 1.5 at some sites: Co (S1-S7 and S9); Cu (S1-S4 and S6-S10), Hg (S1-S9) and Pb (S2-S6) to exceeding 1.5 at other sites: Co (S8 and S10), Cu (S5), Hg (S10), Pb (S1 and S7-S10). This indicated that these metals have both anthropogenic and natural or lithogenic sources depending on the sites. For example, the EF values for Co at the sites S8 and S10, the EF values of Cu at S5 and the one of Hg at S10 indicate enrichment from anthropogenic activities. The EF values for Pb were higher at S1 (0.9-1.9), S5 (0.9-3.4), S7 (1.2-2.1), S8 (1.5-1.6), S9 (0.6-2.1), and S10 (0.7-2.9) indicating that Pb concentrations in the soil at these sites were of anthropogenic origin.
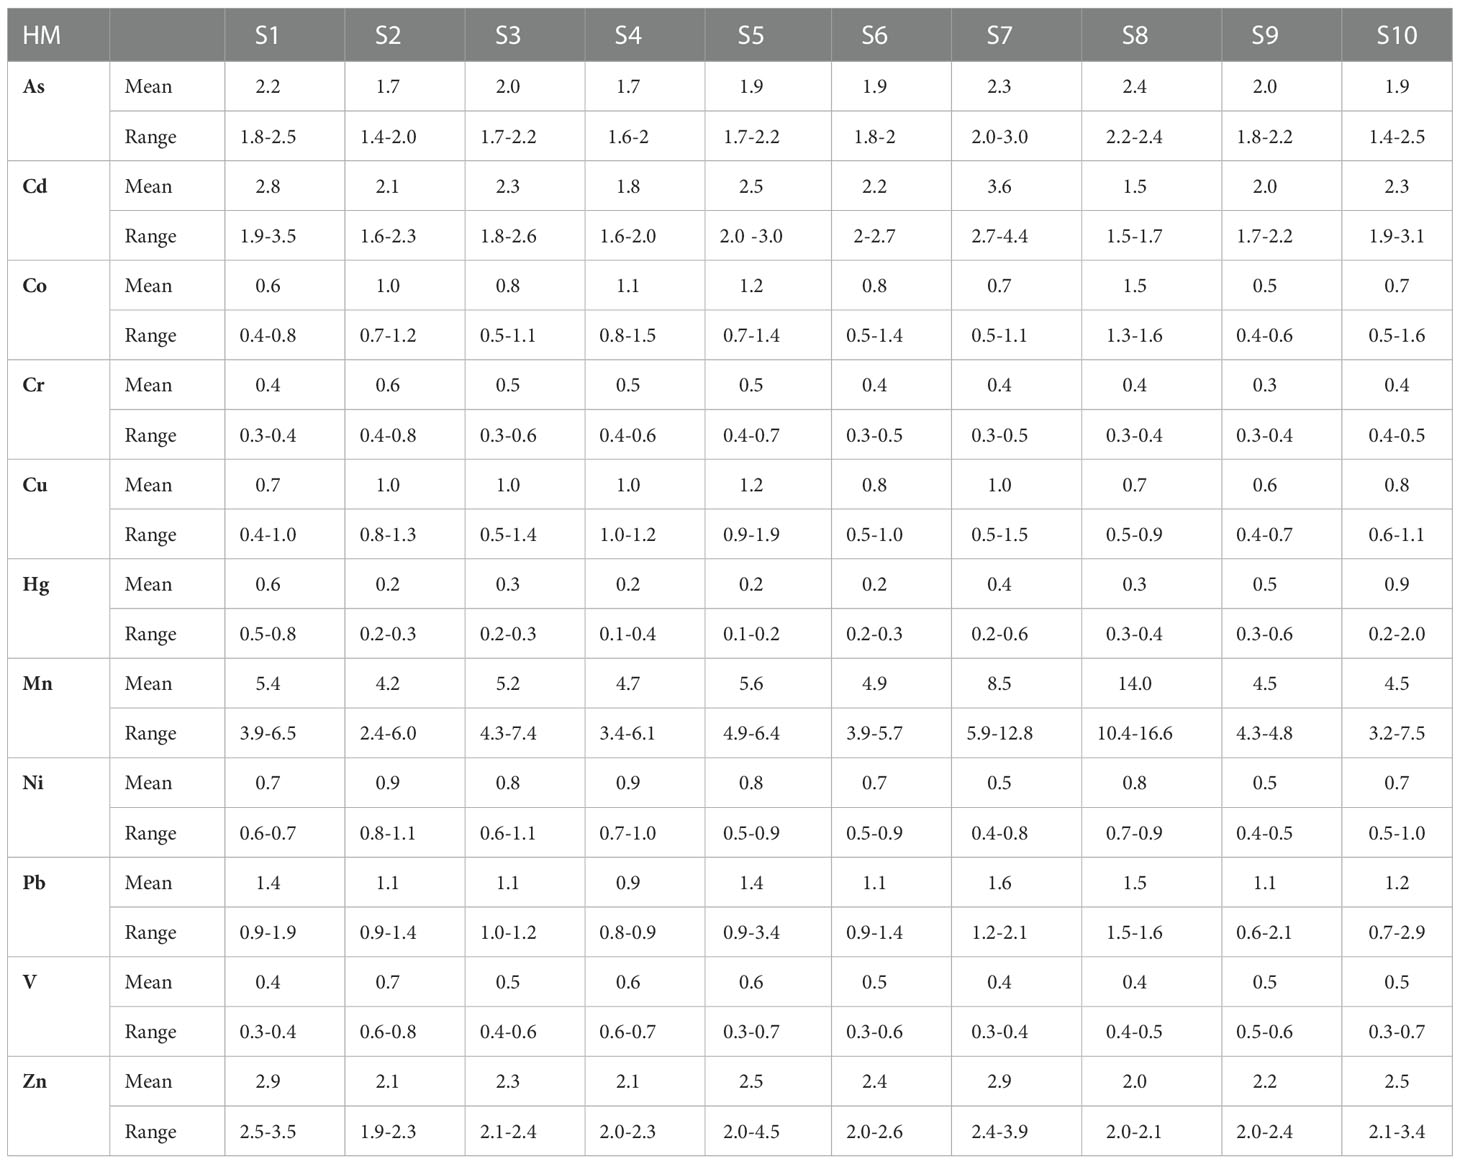
Table 4 Soil heavy metals and trace elements enrichment factor (EF) in Nairobi city catchment.
3.4.2. Correlation between heavy metals and trace elements
The correlation matrix between the heavy metals and trace elements (Figure 4) showed significant relationships between the different elements, informing about their potential sources. At 0.001 statistical significance level, strong and positive correlation was observed between As and Pb (r = 0.83), Cd and Zn (r = 0.95), Cr and Cu (r = 0.92), and Pb and Zn (r = 0.86). In contrast, there was strong negative correlation between As and Ni (r = -0.85), Cd and Co (r = -0.85), and Co and Zn (r = -0.83). At the 0.01 statistical significance level, strong and positive correlation was observed between As and Cd (r = 0.73), As and Zn (r = 0.78), Cd and Fe (r = 0.73), Cd and Pb (r = 0.77), and Fe and Zn (r = 0.78); whereas strong negative correlation was observed between Cd and Ni (r = -0.75), Co and Fe (r = -0.72), Cr and Mn (r = -0.78), Ni and Pb (r = -0.77), and Ni and Zn (r = -0.71). At 0.05 statistical significance level, strong and positive correlation was observed between As and Fe (r = 0.69), and Ni and V (r = 0.68) and strong negative correlation was observed between As and V (r = -0.67), Cu and Mn (r = -0.68), Hg and Ni (r = -0.59), Mn and V (r = -0.65), and Pb and V (r = -0.70). The strongest correlations (≥ 0.85) were recorded between Cd and Co, Cd and Zn, Cr and Cu, and Pb and Zn.
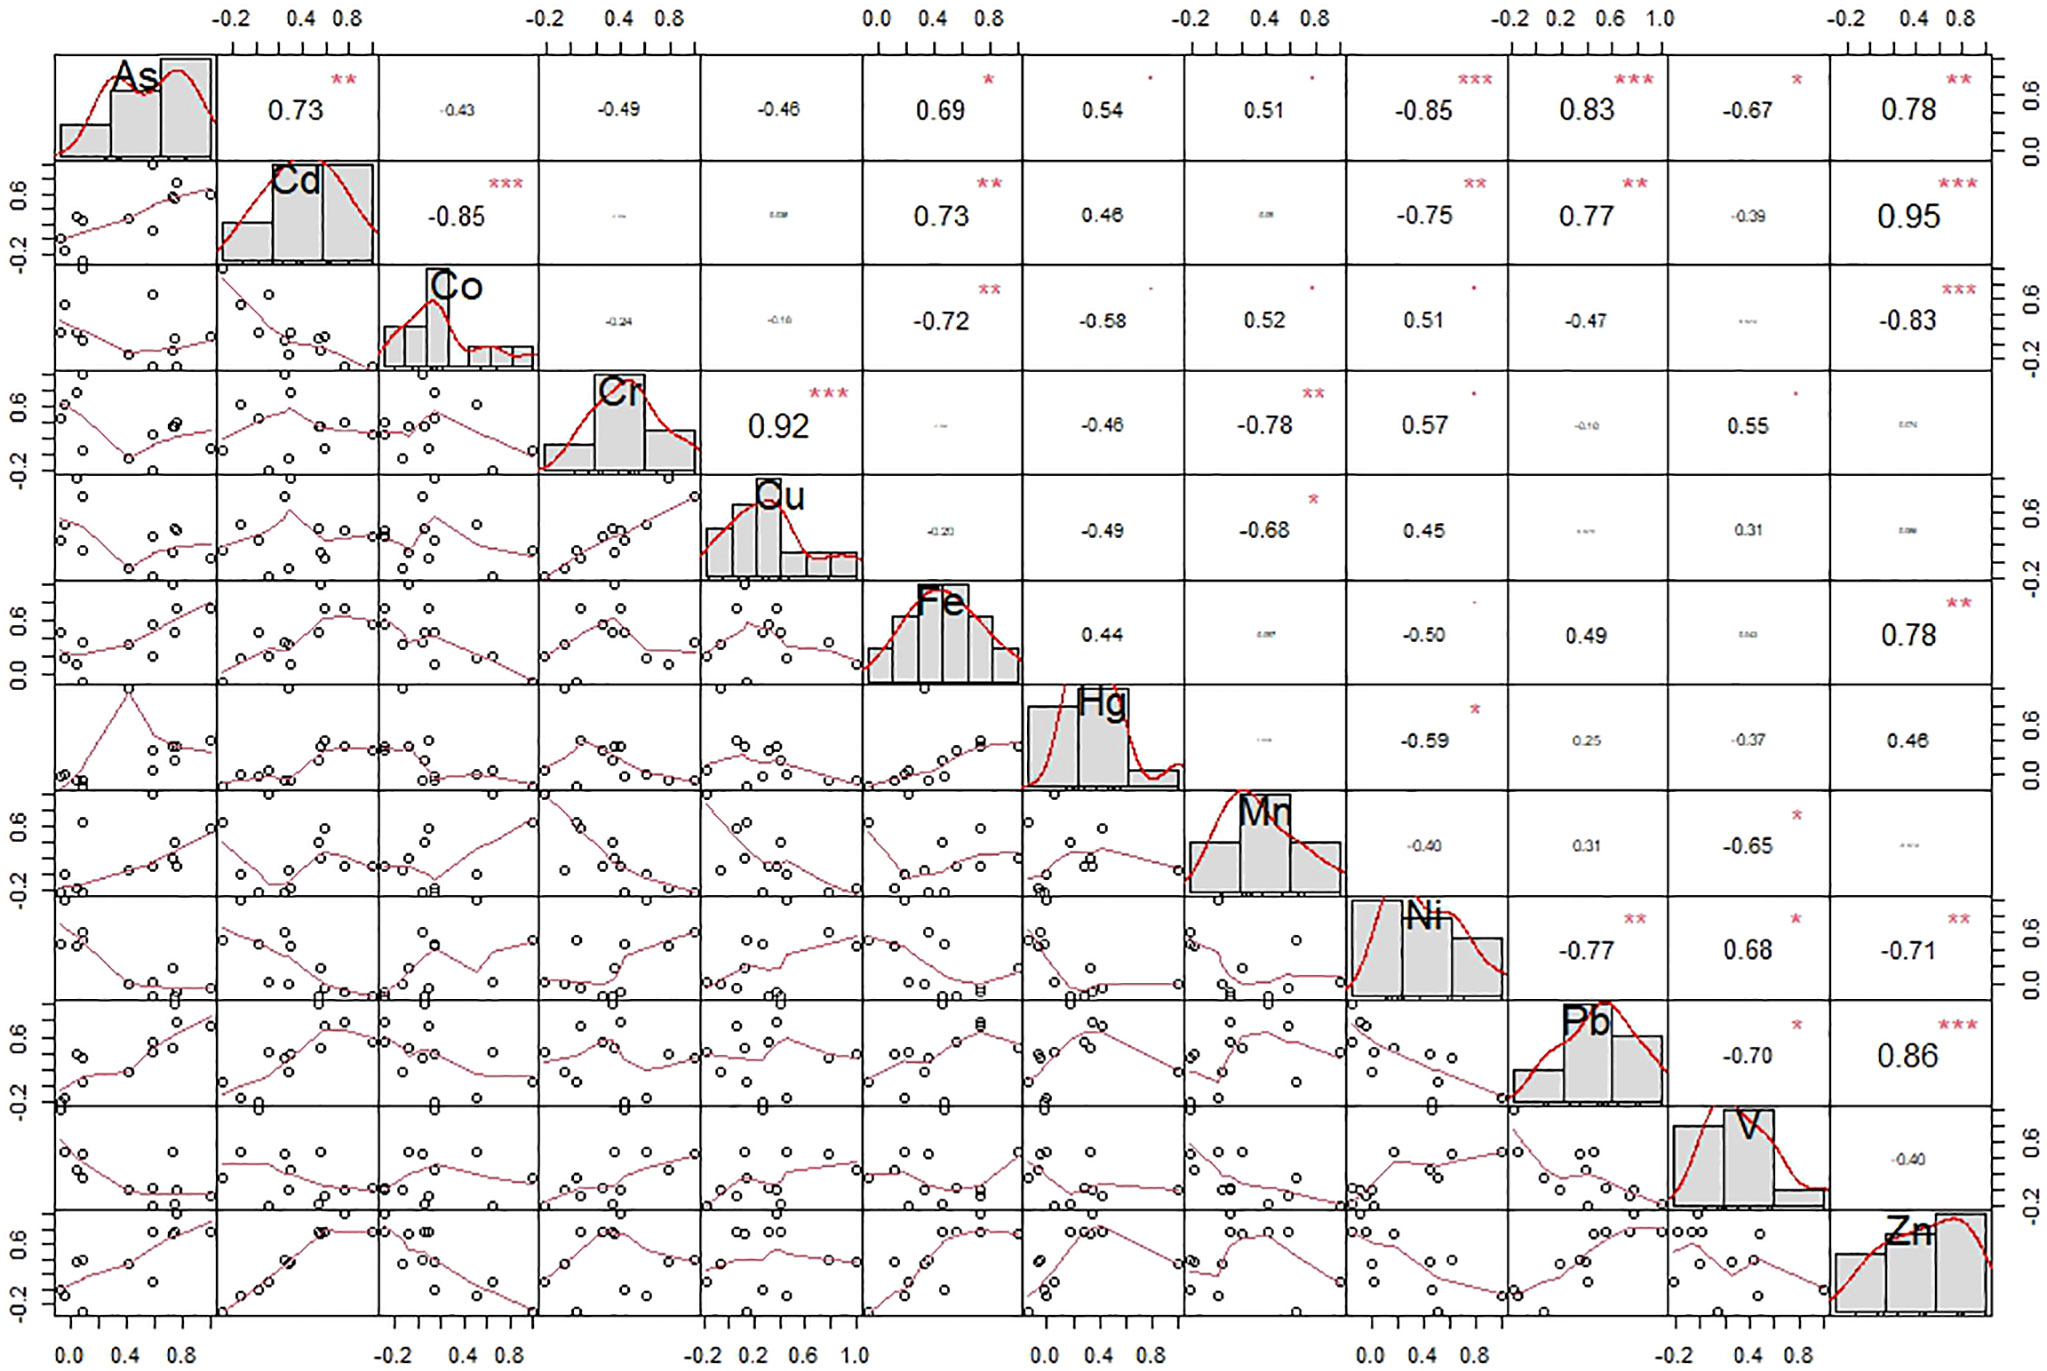
Figure 4 Pearson correlation matrix of heavy metals and trace elements in agricultural soils in Nairobi catchment. Non-significant correlation with a p-value close to 0.05; ∗significant at α = 0.05; ∗∗significant at α = 0.01; ∗∗∗significant at α = 0.001; small front size correlation coefficients (r) stand for non-significant correlations.
3.4.3. Multivariate analysis on heavy metals and trace elements
Principal component analysis (PCA) performed on heavy metals and trace elements concentrations in soil revealed that the first three principal components explained 75% of the total variance and adequately described the interrelations between the elements (Figure 5A). The first principal component (PC1) represented 36% of the total variance and exhibited a high loading factor for As, Cd, Fe, Hg, Pb and Zn (Figure 5A). The second principal component accounted for 22% of the total variance with high loading scores for Cr, Cu, Ni, and V, while the third principal component accounted for 17% and loaded the highest score for Co and Mn (Supplementary Materials Table S3). The results of hierarchical cluster on principal components (HCPC) performed on PCA results differentiated the twelve heavy metals and trace elements into three independent groups (Figure 5B). The PCA and HCPC results indicated that soil’s Cr, Cu, Ni and V contents originated from natural sources. In contrast, Pb, Hg, As, Zn, Fe, Cd, Mn, and Co showed significant inputs from anthropogenic sources.
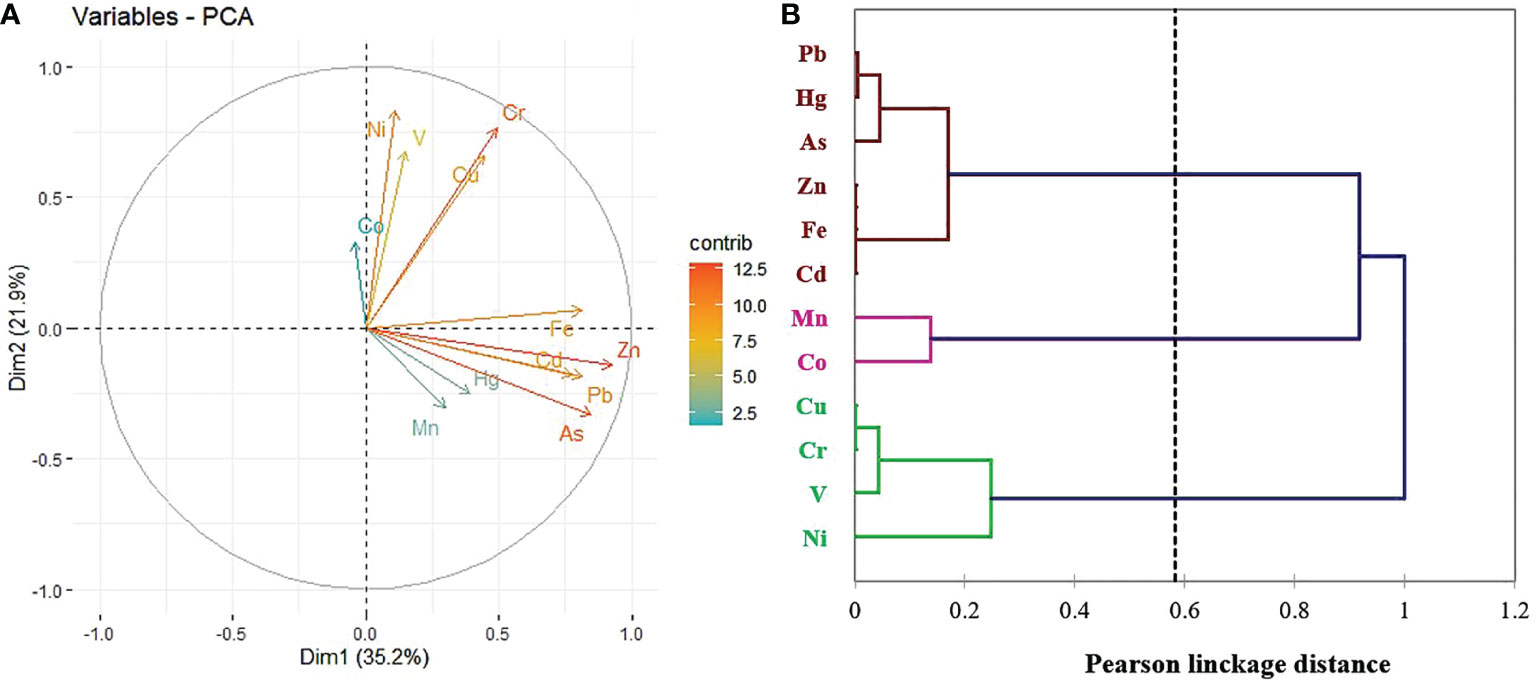
Figure 5 Heavy metals and trace elements association - (A) principal components analysis and (B) clustergram.
3.5. Potential Ecological Risk ( and RI) in agricultural soils in Nairobi city catchment
The soils were screened to determine the potential ecological risk related to heavy metal and trace element contamination and the findings are presented in Table 5. The average single metal ecological risk (equation 4) and the cumulative ecological risk RI (Equation 5) showed a significant variation among the elements and across the sites ranging from 0.7 to 96.3 and from 63.0 to 146.20, respectively. The for As (11-22.24) in the soils were less than the lowest Hakanson threshold of 40, indicating low ecological risk. The highest for As were recorded at S1, S5, S6, S8, S9 and S10. The of Cd ranged from 35.8 to 96.3 indicating low ecological risk (S4), moderate ecological risk (S2, S3, S5, S6, S8, S9, and S10) and considerable ecological risk (S7 and S1).
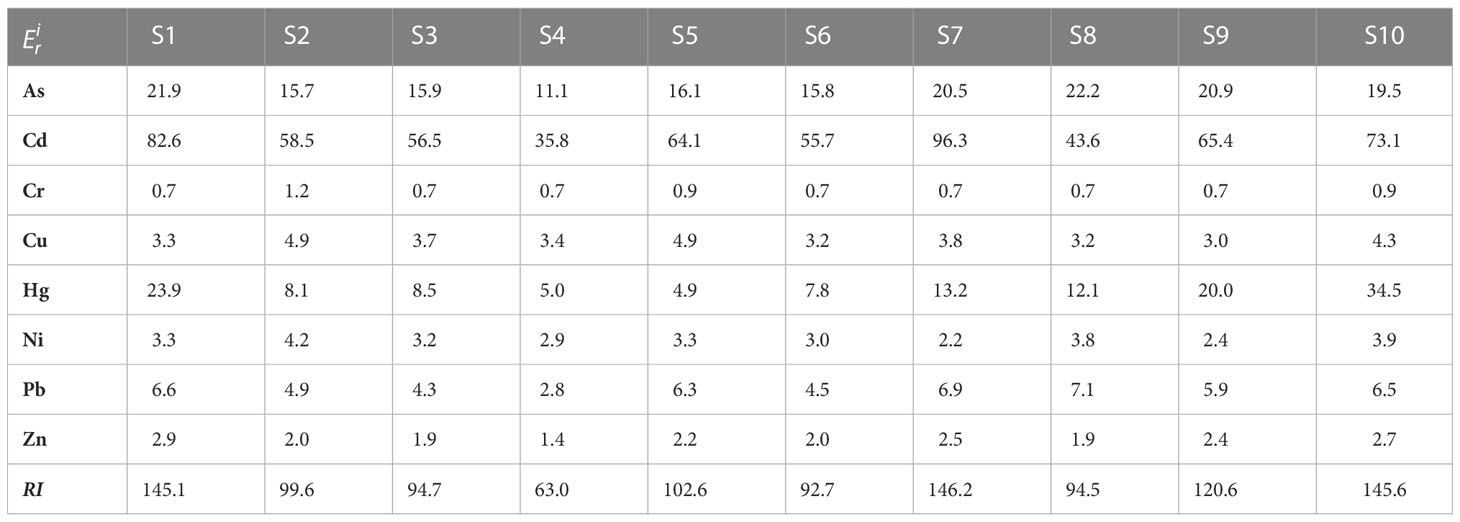
Table 5 Potential Ecological Risk (RI) of heavy metals and trace elements contamination in agricultural soils in Nairobi city catchment.
The related to Cr (0.6-1.2), Cu (3.0-4.9), Ni (2.2-4.2), Hg (5.0-34.5), and Pb (2.8-7.1) were less than the lowest risk threshold of 40 and were therefore classified as low risk. However, the of Hg content in the soil were higher at the site S10 (34.5), S1 (23.9) and S9 (20.0). Among all the metals and trace elements, Cd exhibited the highest contribution to the cumulative ecological risk (RI) with a contribution ranging from 46.1% to 65.9%.
The contributions of the metals elements to RI were in the following descending order Cd > As > Hg > Pb > Cu > Ni > Zn > Cr (see Table S2 in Supplementary Materials). The overall RI ranged from 63 to 146, which indicated that the cumulative risk related to all the heavy metals and trace elements contamination in the soils were classified as low ecological risk. However, the sites S1 (145.1), S7 (146.2), S9 (120.6) and S10 (145.6) showed the highest ecological risks that were close to the threshold values of 150 (Table 2) while S4 exhibited the lowest ecological risk.
4 Discussion
This paper has reported on the contamination of agricultural soils with heavy metals and trace elements in peri-urban farmlands in Nairobi city catchment in Kenya. The findings contribute to a modest but increasing corpus of empirical studies on monitoring heavy metals and trace elements contamination in urban and peri-urban farmlands in the developing countries. The results imply the presence of the twelve analyzed heavy metals and trace elements (As, Cd, Co, Cr, Cu, Fe, Hg, Mn, Ni, Pb, V, and Zn) in all the farmlands across the catchment. Our findings are consistent with previous studies (24, 29, 59–61) which emphasized the growing trend in different heavy metals and trace elements contamination in Nairobi urban and peri-urban areas. The spatial distribution of the elements across the catchment were not uniform and the hotspots of the elements mainly influenced by the characteristics of the sampling stations. Despite these dissimilarities in the spatial distribution patterns of the different elements across the catchment, certain homologies were observed between (i) Co and Mn, (ii) Cu and Cr and (iii) As, Cd, Fe, Hg, Pb and Zn, while Ni and V showed different distribution pattern. The similarities in the patterns of spatial distribution of the different heavy metals and trace elements can substantially explain their sources and guide in monitoring and remediation measures (62, 63). For all the metal elements except Co, Cu, Cr and Mn, the farmlands along Nairobi River and its tributaries (S8-S10) were more polluted compared to those along Athi River. This is consistent with Bagnis et al. (17) and Njuguna et al. (64) who highlighted a higher contamination risk along Nairobi River and its tributaries which are more polluted with domestic and industrial waste compared to Athi River.
The combination of the correlation analysis, the EF index, PCA and HCPC confirmed the association observed in the spatial distribution of heavy metal and trace elements. The metal elements Cu, Cr, Ni and V in the farmlands originated primarily from lithogenic or natural sources whereas As, Cd, Co, Fe, Hg, Mn, Pb and Zn showed significant enrichment from anthropogenic activities. The anthropogenic sources of heavy metals and trace elements in peri-urban agricultural soils include urban wastewater or urban stream irrigation, industrial effluents, aerial emission from industries and traffic network, urban infrastructure construction sites and effluent discharge from wastewater treatment plants and industries (65). The presence of Cu, Cr, Ni and V in the soils could be attributable to their parent materials’ weathering, local pedologic properties, and atmospheric deposition via wind-blown dust (66). Direct leaching from rocks and sediments can create significant dissemination of heavy metals and trace elements (67). The elements Cr, Cu, Ni, and V in soil may also occur through aerial deposition from aerosols, continental dust, volcanic emissions, crude coal, petroleum materials or waste and sewage sludge incineration (68). Although our findings suggested a natural enrichment of the elements Cr, Cu, Ni, and V, in Nairobi city catchment peri-urban soils, their occurrence has often been associated with wastewater irrigation, urban and industrial waste, leather tanning, industrial effluent and emission (24, 69). The metal elements Fe and Mn were the most abundant metals in all the farmlands across the catchment, which is attributed to the concentration of these two elements in the continental crust (36). Besides, Mn and Fe are abundantly released from their oxides form, resulting in extensive quantities of both elements in soil (70, 71). However, anthropogenic activities can also lead to excessive amounts of Fe and Mn in the environment (72), especially from waste and effluent from steel production industries and mining activities that can make their way to agricultural soil via wastewater and urban stream irrigation (73).
The sites where farm irrigation is primarily based on sewage (S1), urban wastewater or wastewater treatment plant effluents (S5, S9 and S10), and urban open drainage canal water flow (S7) exhibited the highest heavy metals and trace elements contamination for As, Cd, Hg, Fe, Pb, V and Zn (Figure 2; Table 3). These findings corroborate those by Arora et al. (74) and Li et al. (75) who pointed out that industrial effluents and wastewater and urban wastewater are significant source of heavy metals and trace elements diffusion in African urban centers.
The higher contents of Cr and Cu in the farmlands S2, S5 and S10 could be attributed to industrial related activities (S2) and wastewater treatment plant effluents (S5 and S10). The concentrations of Pb and Zn in soil were higher in farmlands along automobile roads or highways (S7). This is consistent with Fayiga et al. (76), Huang et al. (77) and Zou et al. (6), who highlighted that agricultural soils near heavy traffic roads are often contaminated with Pb and Zn. Indeed, Zn and Pb are substantially present in the fuel used in most low and middle-income countries (78–80).
The level of Hg contamination was higher in farmland irrigated on urban wastewater and wastewater treatment plant affluent. The occurrence of Hg in the catchment could originate from industrial activities and urban garbage (81). This findings corroborate those of Yang et al. (82) in an industrial region in China and Adeyemi and Ojekunle (83) in Ogun state in Nigeria, who pointed out that Hg contamination in agricultural soil are substantially associated to industrial activities. The highest concentration of As, Co and Mn observed at S8 (along Katani Utawala bridge) could be explained by the valley landform of the area that can lead to metal elements’ accumulation during rain runoff. The farmlands irrigated with wastewater treatment plant effluent mixed flow (S5 and S10) recorded generally high concentration for all the elements. The use of untreated or partially treated wastewater and sewage for irrigation has been proven as the main entry point of heavy metals and traces elements to urban and peri-urban agricultural soils (84).
The classification of the level of contamination of the sites based on the pollution load index (PLI) was slightly different from the one based on the cumulative ecological risk (Figure 3; Table 5). The differences observed between the two classification is related to the fact that the PLI is based on all the metals analyzed (12 in this paper) while the ecological risk by Hakanson (38) is based on eight heavy metals and trace elements (As, Cd, Cr, Cu, Hg, Ni, Pb and Zn), considered as the most toxic (19, 34).
The environmental contamination with heavy metals and trace elements in the farmlands in this paper exhibited significant ecological risks, representing a serious threat to environmental sustainability and human health. The elements As, Cd, Hg and Pb showed the highest single metal ecological risk () with Cd and As holding the highest contribution to the cumulative ecological risk (57.1% and 16.6%). The level of ecological risk recorded for each element reflected its spatial distribution pattern across the catchment, with the hotspot sampling sites exhibiting the highest ecological risk. This is consistent with Lv et al. (85) who concluded that the spatial distribution provides an important basis for contaminated sites remediation and ecological risk management. The single ecological risk observed in this study were higher than those reported in previous studies conducted in urban and peri-urban areas in Kenya (59, 60, 86). Nonetheless, our results are consistent with and add to those of Mungai and Wang (59)Ndungu et al. (60), and Olando et al. (86), who pointed out the high risk of Hg and Cd in and around Nairobi city soils. The lowest Cd risk factor at S4 could be attributed to decantation and lateral dismissal of particles along river flows, which can naturally make highly polluted stream water less harmful as it flows downstream (87). However, the river receives wastewater treatment plant effluent at S5 and becomes more contaminated, hence the higher Cd single ecological risk (38). This is clearly illustrated in the variation of the pollution load index (PLI) between the sites (Figure 3), where the values of the PLI decreased with the flow of the river (S1-S4) and became higher at S5.
Despite the significant level of ecological risk exhibited by the single metals Cd, As, Hg and Pb the cumulative ecological risk (RI), which represent the overall risk based on the eight heavy metals and trace elements by (38), for all the sites were classified as low ecological risk. The values of the cumulative ecological risk concealed the extent of ecological risk exhibited by the single metal risk index. Thus, an environmental compartment may be considered as having a low cumulative ecological risk, yet one or more elements may be having elevated ecological risk. Therefore, we argue that the cumulative ecological risk index is not completely efficient in evaluating the extent of ecological risk related to heavy metals and trace elements contamination.
Heavy metals and trace elements can bioaccumulate in edible portion of plant or livestock feeding on grasses or scavenging animals like local pigs, which can later make their way into the food chains (30, 88). Furthermore, farmers in permanent contact with the soil are exposed to inhalation and dermal contact (89). As heavy metals and trace elements contamination even in minimal concentration can cause serious health risks, efficient and regular monitoring as well as regulations enforcement measures are eminent in urban and peri-urban agro-systems in Nairobi city catchment.
5. Conclusion
This paper assessed the presence and concentrations of 12 heavy metals and trace elements - As, Cd, Co, Cr, Cu, Fe, Hg, Mn, Ni, Pb, V and Zn in peri-urban agricultural soils in Nairobi city catchment, Kenya. All the 12 elements were detectable in the soil, with As, Cd, Mn, Pb and Zn exceeding their permissible limits in agricultural soil at 1.7%, 13.3%, 80%, 1.7% and 11.7%, respectively. Although the concentrations of some of the elements including As (43.3%), Cd (55%) and Zn (13.3%) were within the permissible ranges for agricultural soil at many sites, the concentrations were close to the threshold values and may accumulate with time and pose serious risk. The spatial distributions of the different heavy metals and trace elements were not uniform across the catchment; however, three similar distribution patterns were observed. The heavy metals and trace elements (i) Co and Mn, (ii) Cu and Cr, and (iii) As, Cd, Fe, Hg, Pb, and Zn demonstrated similar distribution patterns across the catchment with slight variations between their hotspot, whereas the elements Ni and V exhibited singular spatial distribution compared to other metals elements. The elements As, Cd, Co, Fe, Hg, Mn, Pb and Zn showed anthropogenic enrichment, while Cu, Cr, Ni and V appeared to originate mainly from lithogenic and natural sources. The ecological risk related to Cd, As, Hg and Pb are of serious concern in all the sites. Heavy metals and trace elements’ concentrations in the farmlands were linked to urban wastewater, sewage sludge discharge and industrial and wastewater treatment plant effluents used for farm irrigation. Reducing heavy metals and trace elements concentrations from these sources to the rivers coupled with efficient management of urban waste are important for controlling heavy metals and trace elements contamination in urban and peri-urban areas. The spatial distribution patterns of heavy metals and trace elements provide physical planning officers and policy maker in Nairobi metropolitan region an efficient tool that can be use in efficient land use zoning for agricultural land. Peri-urban agricultural lands need regular monitoring of contamination to inform farmers and policy makers on waste management implications, ecological risks for eventual prevention or remediation measures. Farmers need to be sensitized to the implication of their farmland locations and irrigation water sources for food quality and public health risk alleviation. The findings point to a need for upscaling data at ecosystem scale for proper land use zoning of suitable agricultural land and linking potential risks to their point as well as the ecosystem for effective curbing of ecological and public health risks associated with heavy metals and trace elements contamination.
Data availability statement
The original contributions presented in the study are included in the article/Supplementary Material. Further inquiries can be directed to the corresponding author.
Author contributions
AMAA conceived and designed the research, performed fieldwork, prepared the samples, before mailing them to Nottingham University for metals elements analysis, analyzed the data and wrote the original draft paper. ARM and VN supervised the samples preparation. SL, NK and GS supervised the research and approved the final version. All the authors reviewed and edited the manuscript before it was submitted for publication. All authors contributed to the article and approved the published version.
Funding
This study was partially funded by the German Academic Exchange Service (DAAD) in the “In Country In Region” PhD program at Kenyatta University in Kenya, Reference Number 91744410.
Acknowledgments
The authors would like to thank the German Academic Exchange Service (DAAD) for financial support and the School of Biosciences, University of Nottingham (UK) for logistic support in laboratory analysis.
Conflict of interest
The authors declare that the research was conducted in the absence of any commercial or financial relationships that could be construed as a potential conflict of interest.
Publisher’s note
All claims expressed in this article are solely those of the authors and do not necessarily represent those of their affiliated organizations, or those of the publisher, the editors and the reviewers. Any product that may be evaluated in this article, or claim that may be made by its manufacturer, is not guaranteed or endorsed by the publisher.
Supplementary material
The Supplementary Material for this article can be found online at: https://www.frontiersin.org/articles/10.3389/fsoil.2022.1048057/full#supplementary-material
References
1. Zhu Z, Chu F, Dolgui A, Chu C, Zhou W, Piramuthu S. Recent advances and opportunities in sustainable food supply chain: A model-oriented review. Int J Prod. Res (2018) 56(17):5700–22. doi: 10.1080/00207543.2018.1425014
2. Zezza A, Tasciotti L. Urban agriculture, poverty, and food security: Empirical evidence from a sample of developing countries. Food Policy (2010) 35(4):265–73. doi: 10.1016/j.foodpol.2010.04.007
3. Wang C, Wang Z-H, Yang J. Urban water capacity: Irrigation for heat mitigation. Comput. Environ Urban Syst (2019) 78:101397. doi: 10.1016/j.compenvurbsys.2019.101397
4. Padgham J, Jabbour J, Dietrich K. Managing change and building resilience: A multi-stressor analysis of urban and peri-urban agriculture in Africa and Asia. Urban Climate (2015) 12:183–204. doi: 10.1016/j.uclim.2015.04.003
5. Jampani M, Amerasinghe P, Liedl R, Locher-Krause K, Hülsmann S. Multi-functionality and land use dynamics in a peri-urban environment influenced by wastewater irrigation. Sustain Cities Soc (2020) 62: 102305. doi: 10.1016/j.scs.2020.102305
6. Zou J, Dai W, Gong S, Ma Z. Analysis of spatial variations and sources of heavy metals in farmland soils of Beijing suburbs. PloS One (2015) 10(2):e0118082. doi: 10.1371/journal.pone.0118082
7. Pouyat RV, Page-Dumroese DS, Patel-Weynand T, Geiser LH. Forest and rangeland soils of the united states under changing conditions: A comprehensive science synthesis. Cham: Springer Nature (2020). doi: 10.1007/978-3-030-45216-2
8. Ramlan, Basir-Cyio M, Napitupulu M, Inoue T, Anshary A, Mahfudz, et al. Pollution and contamination level of Cu, cd, and Hg heavy metals in soil and food crop. Int J Environ Sci Technol (2022) 19(3):1153–64. doi: 10.1007/s13762-021-03345-8
9. Sun Y, Shao Y. Measuring visitor satisfaction toward peri-urban green and open spaces based on social media data. Urban Forest. Urban Green. (2020) 53:126709. doi: 10.1016/j.ufug.2020.126709
10. Zaynab M, Al-Yahyai R, Ameen A, Sharif Y, Ali L, Fatima M, et al. Health and environmental effects of heavy metals. J King Saud Univ - Sci (2022) 34(1):101653. doi: 10.1016/j.jksus.2021.101653
11. Huang C-C, Liang C-M, Yang T-I, Chen J-L, Wang W-K. Shift of bacterial communities in heavy metal-contaminated agricultural land during a remediation process. PloS One (2021) 16(7):e0255137. doi: 10.1371/journal.pone.0255137
12. Tresch S, Moretti M, Le Bayon R-C, Mäder P, Zanetta A, Frey D, et al. A gardener's influence on urban soil quality [Original research]. Front Environ Sci (2018) 6:25(25). doi: 10.3389/fenvs.2018.00025
13. Ali W, Mao K, Zhang H, Junaid M, Xu N, Rasool A, et al. Comprehensive review of the basic chemical behaviours, sources, processes, and endpoints of trace element contamination in paddy soil-rice systems in rice-growing countries. J Hazard. Mater. (2020) 397:122720. doi: 10.1016/j.jhazmat.2020.122720
14. Chen H, Teng Y, Lu S, Wang Y, Wang J. Contamination features and health risk of soil heavy metals in China. Sci Total Environ (2015) 512-513:143–53. doi: 10.1016/j.scitotenv.2015.01.025
15. Graefe S, Buerkert A, Schlecht E. Trends and gaps in scholarly literature on urban and peri-urban agriculture [Review]. Nutr. Cycl. Agroecosys. (2019) 115(2):143–58. doi: 10.1007/s10705-019-10018-z
16. Liu H, Lyu J. Drive mechanisms of soil quality changes in peri-urban areas [Article]. Land (2021) 10(2):1–21. doi: 10.3390/land10020171
17. Bagnis S, Boxall A, Gachanja A, Fitzsimons M, Murigi M, Snape J, et al. Characterization of the Nairobi river catchment impact zone and occurrence of pharmaceuticals: Implications for an impact zone inclusive environmental risk assessment. Sci Total Environ (2020) 703:134925. doi: 10.1016/j.scitotenv.2019.134925
18. Saha JK, Selladurai R, Coumar MV, Dotaniya ML, Kundu S, Patra AK. Agriculture, soil and environment. In: Saha JK, Selladurai R, Coumar MV, Dotaniya ML, Kundu S, Patra AK, editors. Soil pollution - an emerging threat to agriculture. Singapore: Springer (2017). p. 1–9. doi: 10.1007/978-981-10-4274-4_1
19. Adimalla N, Wang H. Distribution, contamination, and health risk assessment of heavy metals in surface soils from northern telangana, India. Arab. J Geosci. (2018) 11(21):684. doi: 10.1007/s12517-018-4028-y
20. Nica DV, Bura M, Gergen I, Harmanescu M, Bordean D-M. Bioaccumulative and conchological assessment of heavy metal transfer in a soil-plant-snail food chain. Chem Cent J (2012) 6(1):55. doi: 10.1186/1752-153X-6-55
21. Tchounwou PB, Yedjou CG, Patlolla AK, Sutton DJ. Heavy metal toxicity and the environment. Exp Suppl (2012) 101:133–64. doi: 10.1007/978-3-7643-8340-4_6
22. Zhaoyong Z, Mamat A, Simayi Z. Pollution assessment and health risks evaluation of (metalloid) heavy metals in urban street dust of 58 cities in China. Environ Sci pollut Res (2019) 26(1):126–40. doi: 10.1007/s11356-018-3555-0
23. García-Niño WR, Pedraza-Chaverrí J. Protective effect of curcumin against heavy metals-induced liver damage. Food Chem Toxicol (2014) 69:182–201. doi: 10.1016/j.fct.2014.04.016
24. Kinuthia GK, Ngure V, Beti D, Lugalia R, Wangila A, Kamau L. Levels of heavy metals in wastewater and soil samples from open drainage channels in Nairobi, Kenya: community health implication. Sci Rep (2020) 10(1):8434. doi: 10.1038/s41598-020-65359-5
25. Inoti KJ, Fanuel K, George O, Paul O. Assessment of heavy metal concentrations in urban grown vegetables in thika town, Kenya. Afr J Food Sci (2012) 6(3):41–6. doi: 10.5897/ajfs10.072
26. Karanja NN, Njenga M, Prain G, Kang’ethe E, Kironchi G, Githuku C, et al. Assessment of environmental and public health hazards in wastewater used for urban agriculture in Nairobi, Kenya. Trop subtropical agroecosys. (2010) 12(1):85–97.
27. Mungai TM, Owino AA, Makokha VA, Gao Y, Yan X, Wang J. Occurrences and toxicological risk assessment of eight heavy metals in agricultural soils from Kenya, Eastern Africa. Environ Sci pollut Res (2016) 23(18):18533–41. doi: 10.1007/s11356-016-7042-1
28. Mutune A, Makobe M, Abukutsa-Onyango M. Heavy metal content of selected African leafy vegetables planted in urban and peri-urban Nairobi, Kenya. Afr J Environ Sci Technol (2014) 8(1):66–74.
29. Nyandika H, Kitur E, Nzeve J. Selected trace elements evaluation in soil from an urban farming area. Int J Hum Capital Urban Manage (2020) 5(3):187–98. doi: 10.22034/IJHCUM.2020.03.01
30. Mng'ong'o M, Munishi LK, Ndakidemi PA, Blake W, Comber S, Hutchinson TH. Accumulation and bioconcentration of heavy metals in two phases from agricultural soil to plants in usangu agroecosystem-Tanzania. Heliyon (2021) 7(7):e07514. doi: 10.1016/j.heliyon.2021.e07514
31. Scott RM. The soil of Nairobi-machakos area 1:100,000. In: Soil survey division of the East African agricuture and forestry research organisation, directorate of oversea survey, 1st ed. (1985). p. 3014.
32. K'Oreje KO, Vergeynst L, Ombaka D, De Wispelaere P, Okoth M, Van Langenhove H, et al. Occurrence patterns of pharmaceutical residues in wastewater, surface water and groundwater of Nairobi and kisumu city, Kenya. Chemosphere (2016) 149:238–44. doi: 10.1016/j.chemosphere.2016.01.095
33. Kitheka JU. Salinity and salt fluxes in a polluted tropical river: The case study of the athi river in Kenya. J Hydrol.: Reg. Stud (2019) 24:100614. doi: 10.1016/j.ejrh.2019.100614
34. Kowalska JB, Mazurek R, Gąsiorek M, Zaleski T. Pollution indices as useful tools for the comprehensive evaluation of the degree of soil contamination–a review. Environ Geochem. Health (2018) 40(6):2395–420. doi: 10.1007/s10653-018-0106-z
35. Mwesigye AR, Young SD, Bailey EH, Tumwebaze SB. Population exposure to trace elements in the kilembe copper mine area, Western Uganda: A pilot study. Sci Total Environ (2016) 573:366–75. doi: 10.1016/j.scitotenv.2016.08.125
36. Wedepohl HK. The composition of the continental crust. Geochim. Cosmochim. Acta (1995) 59(7):1217–32. doi: 10.1016/0016-7037(95)00038-2
37. Li W, Wang D, Wang Q, Liu S, Zhu Y, Wu W. Impacts from land use pattern on spatial distribution of cultivated soil heavy metal pollution in typical rural-urban fringe of northeast China. Int J Environ Res Public Health (2017) 14(3):336. doi: 10.3390/ijerph14030336
38. Hakanson L. An ecological risk index for aquatic pollution control.a sedimentological approach. Water Res (1980) 14(8):975–1001. doi: 10.1016/0043-1354(80)90143-8
39. Shapiro SS, Wilk MB. An analysis of variance test for normality (complete samples). Biometrika (1965) 52(3/4):591–611. doi: 10.2307/2333709
40. Bartlett MS. Properties of sufficiency and statistical tests. proceedings of the royal society of London. Ser A-Math. Phys Sci (1937) 160(901):268–82. doi: 10.1098/rspa.1937.010
41. Van Huynh C, Pham TG, Nguyen LHK, Nguyen HT, Nguyen PT, Le QNP, et al. Application GIS and remote sensing for soil organic carbon mapping in a farm-scale in the hilly area of central Vietnam. Air Soil Water Res (2022) 15:11786221221114777. doi: 10.1177/11786221221114777
42. Gia Pham T, Kappas M, Van Huynh C, Hoang Khanh Nguyen L. Application of ordinary kriging and regression kriging method for soil properties mapping in hilly region of central Vietnam. ISPRS Int J Geo-Inf. (2019) 8(3). doi: 10.3390/ijgi8030147
43. Lv J. Multivariate receptor models and robust geostatistics to estimate source apportionment of heavy metals in soils. Environ pollut (2019) 244:72–83. doi: 10.1016/j.envpol.2018.09.147
44. Gbedomon RC, Salako VK, Schlaepfer MAJN. Diverse views among scientists on non-native species. Neo Biota (2020) 54:49–69.
45. R Core Team. R: A language and environment for statistical computing. r foundation for statistical computing (2021). Available at: https://www.R-project.org/.
46. Esser DE. When we launched the government's agenda': Aid agencies and local politics in urban Africa [Article]. J Modern Afr Stud (2012) 50(3):397–420. doi: 10.1017/S0022278X12000171
47. Peterson BG, Carl P, Boudt K, Bennett R, Ulrich J, Zivot E, et al. Package ‘performanceanalytics’. R Team Coop. (2018) 3:13–4.
48. Patil I. Visualizations with statistical details: The'ggstatsplot'approach. J Open Source Softw. (2021) 6(61):3167. doi: 10.21105/joss.03167
49. Wei T, Simko V, Levy M. Package “corrplot”: Visualization of a correlation matrix. (2021), 2017.
50. Thioulouse J, Dray S, Dufour A-B, Siberchicot A, Jombart T, Pavoine S. Multivariate analysis of ecological data with ade4. New York: Springer (2018). doi: 10.1007/978-1-4939-8850-1_4
51. Husson F, Lê S, Pagès J. Analyse de données avec r. Presses universitaires de Rennes (2016) Rennes. Available at: https://hal.archives-ouvertes.fr/hal-01292429.
52. Kassambara A, Mundt F. Package ‘factoextra’: Extract visualize the results of multivariate data analyses. R package version 1.5 (2017) 76(2). Available at: https://cran.microsoft.com/snapshot/2016-11-30/web/packages/factoextra/factoextra.pdf.
53. MEF. Government decree on the assessment of soil contamination and remediation needs (214/2007, march 1, 2007). In: Ministry of the environment (MEF). Finland: Ministry of the Environment (2007). Available at: https://www.finlex.fi/en/laki/kaannokset/2007/en20070214.pdf.
54. Kloke A, Sauerbeck DR, Vetter H. The contamination of plants and soils with heavy metals and the transport of metals in terrestrial food chains. In: Changing metal cycles and human health. Berlin, Heidelberg: Springer (1984).
55. Chiroma TM, Ebewele RO, Hymore FK. Comparative assessment of heavy metal levels in soil, vegetables and urban grey waste water used for irrigation in yola and Kano. Int refereed J Eng Sci (2014) 3(2):01–9.
56. Scalenghe R, Fasciani G. Soil heavy metals patterns in the torino Olympic winter games venue (E.U.). Soil Sediment Contam.: Int J (2008) 17(3):205–20. doi: 10.1080/15320380802006905
57. URT. Soil quality standard - the environmental management regulation. United Repurbllic of Tanzania, Dar es Salaam, URT. (2007). Available at: https://www.fao.org/faolex/results/details/en/c/LEX-FAOC151538/.
58. He Z, Shentu J, Yang X, Baligar VC, Zhang T, Stoffella PJ. Heavy metal contamination of soils: sources, indicators and assessment. J Environ Indic (2015) 9:17–8.
59. Mungai TM, Wang J. Heavy metal pollution in suburban topsoil of nyeri, kapsabet, voi, ngong and juja towns, in Kenya. SN Appl Sci (2019) 1(9):960. doi: 10.1007/s42452-019-0996-0
60. Ndungu AW, Yan X, Makokha VA, Githaiga KB, Wang J. Occurrence and risk assessment of heavy metals and organochlorine pesticides in surface soils, central Kenya. J Environ Health Sci Eng (2019) 17(1):63–73. doi: 10.1007/s40201-018-00326-x
61. Ngweme GN, Atibu EK, Al Salah DMM, Muanamoki PM, Kiyombo GM, Mulaji CK, et al. Heavy metal concentration in irrigation water, soil and dietary risk assessment of amaranthus viridis grown in peri-urban areas in Kinshasa, democratic republic of the Congo. Watershed Ecol Environ (2020) 2:16–24. doi: 10.1016/j.wsee.2020.07.001
62. Gong Y, Zhao D, Wang Q. An overview of field-scale studies on remediation of soil contaminated with heavy metals and metalloids: Technical progress over the last decade. Water Res (2018) 147:440–60. doi: 10.1016/j.watres.2018.10.024
63. Sun L, Guo D, Liu K, Meng H, Zheng Y, Yuan F, et al. Levels, sources, and spatial distribution of heavy metals in soils from a typical coal industrial city of tangshan, China. CATENA (2019) 175:101–9. doi: 10.1016/j.catena.2018.12.014
64. Njuguna SM, Yan X, Gituru RW, Wang Q, Wang J. Assessment of macrophyte, heavy metal, and nutrient concentrations in the water of the Nairobi river, Kenya. Environ Monit Assess (2017) 189(9):454. doi: 10.1007/s10661-017-6159-0
65. Sellami S, Zeghouan O, Dhahri F, Mechi L, Moussaoui Y, Kebabi B. Assessment of heavy metal pollution in urban and peri-urban soil of setif city (High plains, eastern Algeria). Environ Monit Assess (2022) 194(2):126. doi: 10.1007/s10661-022-09781-4
66. Ghasemi Siani M, Mehrabi B, Ganerod M, Holwell DA, Yang HJ, Karimi Shahraki B. Origin of FeTi mineralization in the late Jurassic to early Cretaceous kahnouj ophiolitic complex, makran accretionary prism, SE Iran. Lithos (2022) 426-427:106784. doi: 10.1016/j.lithos.2022.106784
67. Genchi G, Carocci A, Lauria G, Sinicropi MS, Catalano A. Nickel: Human health and environmental toxicology. Int J Environ Res Public Health (2020) 17(3):679. doi: 10.3390/ijerph17030679
68. Chen L, Liao Y, Ma X, Niu Y. Effect of co-combusted sludge in waste incinerator on heavy metals chemical speciation and environmental risk of horizontal flue ash. Waste Manage (2020) 102:645–54. doi: 10.1016/j.wasman.2019.11.027
69. Zhang Z, Zheng D, Xue Z, Wu H, Jiang M. Identification of anthropogenic contributions to heavy metals in wetland soils of the karuola glacier in the qinghai-Tibetan plateau. Ecol Indic (2019) 98:678–85. doi: 10.1016/j.ecolind.2018.11.052
70. Holmström H, Salmon UJ, Carlsson E, Petrov P, Öhlander B. Geochemical investigations of sulfide-bearing tailings at kristineberg, northern Sweden, a few years after remediation. Sci Total Environ (2001) 273(1):111–33. doi: 10.1016/S0048-9697(00)00850-0
71. McMahon ME, Santucci RJ, Glover CF, Kannan B, Walsh ZR, Scully JR. A review of modern assessment methods for metal and metal-oxide based primers for substrate corrosion protection [Review]. Front Mater. (2019) 6:190. doi: 10.3389/fmats.2019.00190
72. Liu G, Wang J, Liu X, Liu X, Li X, Ren Y, et al. Partitioning and geochemical fractions of heavy metals from geogenic and anthropogenic sources in various soil particle size fractions. Geoderma (2018) 312:104–13. doi: 10.1016/j.geoderma.2017.10.013
73. Yan Y, Han L, Yu R-l, Hu G-r, Zhang W-f, Cui J-y, et al. Background determination, pollution assessment and source analysis of heavy metals in estuarine sediments from quanzhou bay, southeast China. CATENA (2020) 187:104322. doi: 10.1016/j.catena.2019.104322
74. Arora M, Kiran B, Rani S, Rani A, Kaur B, Mittal N. Heavy metal accumulation in vegetables irrigated with water from different sources. Food Chem (2008) 111(4):811–5. doi: 10.1016/j.foodchem.2008.04.049
75. Li F, Huang J, Zeng G, Yuan X, Li X, Liang J, et al. Spatial risk assessment and sources identification of heavy metals in surface sediments from the dongting lake, middle China. J Geochem. Explor (2013) 132:75–83. doi: 10.1016/j.gexplo.2013.05.007
76. Fayiga AO, Ipinmoroti MO, Chirenje T. Environmental pollution in Africa. Environ. Dev Sustain. (2018) 20(1):41–73. doi: 10.1007/s10668-016-9894-4
77. Huang Y, Li T, Wu C, He Z, Japenga J, Deng M, et al. An integrated approach to assess heavy metal source apportionment in peri-urban agricultural soils. J Hazard. Mater. (2015) 299:540–9. doi: 10.1016/j.jhazmat.2015.07.041
78. Jones F, Bankiewicz D, Hupa M. Occurrence and sources of zinc in fuels. Fuel (2014) 117:763–75. doi: 10.1016/j.fuel.2013.10.005
79. Maas S, Scheifler R, Benslama M, Crini N, Lucot E, Brahmia Z, et al. Spatial distribution of heavy metal concentrations in urban, suburban and agricultural soils in a Mediterranean city of Algeria. Environ pollut (2010) 158(6):2294–301. doi: 10.1016/j.envpol.2010.02.001
80. Yang S, Gu S, He M, Tang X, Ma LQ, Xu J, et al. Policy adjustment impacts cd, Cu, Ni, Pb and zn contamination in soils around e-waste area: Concentrations, sources and health risks. Sci Total Environ (2020) 741:140442. doi: 10.1016/j.scitotenv.2020.140442
81. Xu J, Bravo AG, Lagerkvist A, Bertilsson S, Sjöblom R, Kumpiene J. Sources and remediation techniques for mercury contaminated soil. Environ Int (2015) 74:42–53. doi: 10.1016/j.envint.2014.09.007
82. Yang Q, Li Z, Lu X, Duan Q, Huang L, Bi J. A review of soil heavy metal pollution from industrial and agricultural regions in China: Pollution and risk assessment. Sci Total Environ (2018) 642:690–700. doi: 10.1016/j.scitotenv.2018.06.068
83. Adeyemi AA, Ojekunle ZO. Concentrations and health risk assessment of industrial heavy metals pollution in groundwater in ogun state, Nigeria. Sci Afr (2021) 11:e00666. doi: 10.1016/j.sciaf.2020.e00666
84. Sayo S, Kiratu JM, Nyamato GS. Heavy metal concentrations in soil and vegetables irrigated with sewage effluent: A case study of embu sewage treatment plant, Kenya. Sci Afr (2020) 8:e00337. doi: 10.1016/j.sciaf.2020.e00337
85. Lv Y, Kabanda G, Chen Y, Wu C, Li W. Spatial distribution and ecological risk assessment of heavy metals in manganese (Mn) contaminated site [Original research]. Front Environ Sci (2022) 10:942544. doi: 10.3389/fenvs.2022.942544
86. Olando G, Olaka LA, Okinda PO, Abuom P. Heavy metals in surface sediments of lake naivasha, Kenya: Spatial distribution, source identification and ecological risk assessment. SN Appl Sci (2020) 2(2):279. doi: 10.1007/s42452-020-2022-y
87. Wichelns D, Drechsel P. Meeting the challenge of wastewater irrigation: economics, finance, business opportunities and methodological constraints. Water Int (2011) 36(4):415–9. doi: 10.1080/02508060.2011.593732
88. Ngure V, Kinuthia G. Health risk implications of lead, cadmium, zinc, and nickel for consumers of food items in migori gold mines, Kenya. J Geochem. Explor (2020) 209:106430. doi: 10.1016/j.gexplo.2019.106430
Keywords: peri-urban agriculture, wastewater irrigation, ecological risk, soil pollution, food safety, spatial distribution
Citation: Ahogle AMA, Letema S, Schaab G, Ngure V, Mwesigye AR and Korir NK (2023) Heavy metals and trace elements contamination risks in peri-urban agricultural soils in Nairobi city catchment, Kenya. Front. Soil Sci. 2:1048057. doi: 10.3389/fsoil.2022.1048057
Received: 19 September 2022; Accepted: 12 December 2022;
Published: 12 January 2023.
Edited by:
Christos Damalas, Democritus University of Thrace, GreeceReviewed by:
Chengyu Xie, Xiangtan University, ChinaHansong Chen, Zhejiang Normal University, China
Fathy Elbehiry, Kafrelsheikh University, Egypt
Copyright © 2023 Ahogle, Letema, Schaab, Ngure, Mwesigye and Korir. This is an open-access article distributed under the terms of the Creative Commons Attribution License (CC BY). The use, distribution or reproduction in other forums is permitted, provided the original author(s) and the copyright owner(s) are credited and that the original publication in this journal is cited, in accordance with accepted academic practice. No use, distribution or reproduction is permitted which does not comply with these terms.
*Correspondence: Arcadius Martinien Agassin Ahogle, YWhvZ2xlYXJjYWRpdXNAZ21haWwuY29t