 Isaac J. Madsen
 Janice M. Parks
 Maren L. Friesen2
- 1Department of Crop and Soil Sciences, Washington State University, Pullman, WA, United States
- 2Department of Plant Pathology, Washington State University, Pullman, WA, United States
- 3Department of Entomology, Washington State University, Pullman, WA, United States
Intercropping is an ancient agricultural management practice quickly re-gaining interest in mechanized agricultural systems. Mechanized management practices have led to a decreased biodiversity at the macro- and micro-fauna levels. These agricultural practices have also resulted in the degradation of soil and long-term inefficiencies in land, water, and nutrients. The inland Pacific Northwest (iPNW) of the United States of America is a wheat-dominated cropping system. The integration of winter and spring legumes and oilseeds has improved the biodiversity and nutrient-use efficiency of the cropping systems. This article examines the feasibility of pea-canola (peaola) intercropping in dryland production systems of the iPNW. In two site years, small plot peaola trials were established near Davenport, WA. Overall, the land equivalence ratio (LER) of peaola was found to be 1.46, showing an increase in efficiency of the system. Increasing the N fertilizer application rates did not affect peaola yield, indicating that peaola has low demand for N inputs. The effects of peaola on insects and bacterial diversity were examined on replicated large scale strip trials. Peaola was found to have significantly greater numbers of beneficial insects than the monoculture controls. There were no significant differences between the diversity of the soil bacterial communities found in peaola vs. pea and canola monocultures. However, we found that the strict core soil bacterial microbiome of peaola was larger than the monocultures and included core members from both the canola and pea soil microbiomes. In conclusion, the widespread adoption of peaola would likely increase the biodiversity and increase the land use efficiency of dryland production systems in the iPNW.
Introduction
Most industrial agriculture systems are monocultures with the only feasible option for increased diversity being crop rotation. Subsistence agriculture on the other hand has long relied on multispecies systems (1). These multispecies systems prohibit the use of chemicals and are not easily adapted to mechanization and the economies of scale prevalent in large-scale industrial agriculture. To incorporate intercropping into large-scale industrial systems, the feasibility should be considered as well as the ecological benefits. Oilseed-legume intercrops have been shown to be compatible with large-scale adoption, primarily due to complementary plant architectures and the fact that intercropping broad-leafed plants lends itself to grassy weed control (2). One such oilseed-legume intercropping system of particular interest in the inland Pacific Northwest (iPNW) is pea-canola intercrops (peaola). For the purposes of this study, the iPNW region is defined as the areas of Oregon, Washington, and Idaho east of the Cascade Mountain range in the United States of America.
Peas (Pisum aestivum) and canola (Brassica napus) are both grown in the iPNW and are grown as fall- or spring-seeded crops (3). Dryland production systems are dominated by wheat production, and like canola and peas, winter and spring wheats are both produced in the region. The iPNW has a strong precipitation gradient, with precipitation increasing from west to east across the dryland production region. The dry western part of the iPNW is dominated by winter wheat—fallow cropping sequences, while in the wet eastern portion, annual cropping is common in a winter wheat—spring wheat—spring legume rotation (4). Winter peas and canola have both been used to extend the cropping sequence in the grain fallow rotation by replacing every other wheat crop (4). In the annual cropping zone, the spring legume part of the rotation is frequently replaced with spring canola due to price and herbicide options. The use of group 1 herbicides to control grassy weeds, which can be difficult in wheat production systems, is allowed for use in both winter and spring canola (5).
Canola has been shown to be a useful tool for improving the water and nutrient efficiency as a nutrient catch crop and increasing the water infiltration when grown in rotation (6–8). The increase in efficiency is most likely due to the deep-rooting nature of canola plants. The increase in infiltration is thought to be caused by canola having tap roots as compared with the fibrous roots of wheat (8). Despite these benefits, canola has also been shown to reduce the yield of the subsequent wheat crop in some instances due to the inability of canola, as a Brassica, to form symbiotic relationship with arbuscular mycorrhizal fungi (AMF) (9, 10). In contrast, peas offer the advantage of being able to form symbiotic relationships with AMF and nitrogen (N)-fixing bacteria that are housed in root structures known as nodules. As such, peas can introduce more biologically available N to this system since N is released when nodules decompose and AMF can mineralize N from decomposing plant matter through improving the activity of soil enzymes (11–13). As canola does not form relationships with these microorganisms under normal circumstances, these sources of essential plant nutrients could become available to canola or the following crops in this intercropping system. Therefore, it is likely that peas bring a cascading suite of bacteria and fungi that do not normally form relationships with canola.
Due to the ability of legumes to host symbiotic bacteria that conduct biological N fixation, they have frequently been included in intercropping systems. A number of studies that assessed the effects of N rate on peaola productivity have been conducted (14). Most of these trials were conducted in Canada on spring canola and show a mixed effect of N land equivalence ratio (LER) and the relative yields of peas and canola. In some instances, LER has been shown to decline with increasing N while the relative yield of canola increases (15). The spring-crop-dominated systems of Canada are significantly different from the winter-wheat-dominated production region of the iPNW however.
In addition to the questions regarding N rate, intercropping systems should improve production through increasing the ecological diversity, increasing the resilience, and increasing the resource-use efficiency (16). In theory, the combination of peas and canola will result in greater resource-use efficiency due to their differing microbial interactions and subsequent increase in microbial diversity. This has been observed in studies on other intercropping systems (17–21). Peaola may also offer an increase in the adaptive capacity of a crop, as peas and canola can fill different ecological niches across the landscape. Additionally, both canola and peas come to maturation in slightly offset timelines with flowering occurring at different times, thereby reducing the overall vulnerability to acute environmental stress and pests. Aphid pests and seed predators impact both canola and pea (22, 23). Offset times of flowering and production can lead to lower rates of brassica pest outbreaks in either member of a polyculture (24). In terms of broad ecological mechanisms, doubling the species number on a single piece of ground at the macro (plant) scale may have cascading effects on various interacting communities such as pests, beneficial insects, and soil microbial communities (25, 26).
This study has three principal objectives. The first objective was to assess the LER of winter and spring peaola in the iPNW. The second was to assess the effect of N fertilizer rate on the relative yields of peas and canola as well as LER in winter peaola. The third objective was to assess the changes in insects and soil microbial communities in peaola vs. the corresponding monocultures. We hypothesize (2) that both winter and spring peaola intercropping in the iPNW will outperform the respective monocultures as measured by LER; (3) that increasing N rate in peaola will not increase the overall productivity of the system; (4) that the microbial communities associated with the peaola cropping systems will develop a microbial community distinct from both the pea and the canola monocultures; and (5) that the peaola cropping system will have more beneficial insects and less pests than the monoculture controls.
Methods
Yield, Land Equivalence Ratio, and N Response
The small plot (1.7 × 9 m) trials were conducted near Davenport, WA, and were seeded and harvested with small plot research equipment. The small plot experiment was laid out using a randomized complete block design with four plot replicates per treatment combination. The two controls were monoculture canola with 67 kg N ha−1 and monoculture peas with 0 kg N ha−1. The three treatments were peaola at different N rates (0, 33, and 67 kg N ha−1). N applications were made using urea-ammonium nitrate and streamed on using a CO2 backpack sprayer in the spring. During the 2020 growing season, these applications were made just prior to precipitation. However, in the 2021 growing season, there was little to no spring precipitation and the fertilizer was simply applied in March.
A Fabro double disk no-till drill was used to seed the plots into no-till winter wheat chemical fallow. The winter pea variety Goldenwood (ProGene Plant Research, LLC) was used in both the monoculture and the intercropping plots, while Plurax (Rubisco Seeds) was used as the canola variety of choice. Both Goldenwood and Plurax have been successfully grown in the iPNW. The peas and canola were planted in the same row at the same time for both the 2020 and the 2021 cropping years. Typically, peas are planted later in the fall than canola in Eastern Washington. However, in this study, the planting date was a compromise between peas and canola with a late August planting date. Grassy weed herbicide applications were made in the spring of 2020 and 2021. The whole plot yield was sampled, and the peas and canola were separated using an M-2B clipper mill from A. T. Ferrell & Company Bluffton, Indiana.
The large-scale replicated spring peaola strip trials (11 × 61 m) were established on 9 April 2020 near Colfax, WA. The large-scale strip trials included 4 replicates of canola monoculture, pea monoculture, and peaola. Placement of replicates was randomized. The strips were direct seeded into stubble from the previous year's winter wheat crop using a no-till Cross Slot drill. A winter pea variety (Goldenwood from ProGene Plant Research, LLC) was used, as there was a concern that early and aggressive growth of spring peas would outcompete the early stages of canola growth, The spring-type canola was a Clearfield canola variety from DynaGro 200 CL. Fertilizers were applied in furrow at planting with 101 kg N ha−1 applied to the canola monoculture, 51 kg N ha−1 applied to the peaola, and 0 kg N ha−1 applied to the monoculture peas. Beyond (imazomox) and select (clethodim) herbicides were applied in late May. The strips were harvested on 14 September of 2020 and weighed using a weigh wagon. As the harvested pea-canola mix was dumped into the weigh wagon, a small amount (~1 kg) was sampled from the grain stream using a polyvinyl chloride (PVC) pipe. The peas and canola were separated using an M-2B clipper mill from A. T. Ferrell & Company Bluffton, Indiana. The peas and canola were then weighed individually and were applied to the overall grain yield which was used to calculate the relative pea and canola yield on a per hectare basis.
Land equivalence ratio was calculated using Equation 1, where ICp and ICc were the intercropping pea and canola yield, respectively, and Mp and Mc were the monoculture pea and canola yield, respectively. Mp and Mc were calculated by calculating the mean of all four replicates for peas and canola, respectively (27). The LER for each individual peaola plot was calculated using the same Mp and Mc within each year.
Insect Class and Abundance
Insect samples were collected at the Colfax location in the spring of 2020 as the small plot experiments in Davenport were not considered suitably large enough to conduct an adequate insect sampling. The large-scale strips were oriented roughly north to south lengthwise. The insect samples were taken 10 m from the north end of the strips and 3 m east side of the plot to ensure a uniform sampling location between plots. The insects were identified and categorized into a functional group. The functional groups were pollinators (Hymenoptera in the Apoidea superfamily and Diptera in the Syrphid family), parasites (Hymenoptera in the families Braconidae and Ichneumonidae), predators [Araneae (spiders) and Coleoptera in the family Coccinellidae (ladybeetles)], and herbivores (Hemiptera in the families Aphidae, Miridae, and Pendatomidae, all larval Lepidoptera, and Coleoptera in the family Curculionidae). For analyses, these pollinators, parasites, and predators were classified broadly as beneficial arthropods, while the herbivores were classified as pest arthropods.
Soil Microbial Community Analysis
Microbial Soil Sample Collection
Soil samples were collected on 14 July 2020 from the large-scale strip trials located near Colfax, WA, to a depth of 10 cm. This corresponded with early flowering of canola. Three samples were taken within each replication (four canola monoculture, four pea monoculture, and four peaola) toward the middle of the plot, resulting in twelve samples per treatment. Once collected, the samples were put in a cooler and transported to WSU where they were kept at −20°C until DNA extraction.
DNA Extraction and Sequencing
The DNA was extracted using a Kingfisher DNA extraction machine following the Earth Microbiome Project's protocol for the QIAGEN® MagAttract® PowerSoil® DNA KF Kit. A no-soil blank was added to each extraction plate to control for cross-contamination. A high-sensitivity dsDNA quantification was performed using a Qubit following the manufacturer's protocol. The amplification of the 16S V4 region was done using the primers 515F: 5′-GTGCCAGCMGCCGCGGTAA-3′ and 806R: 5′-GGACTACHVGGGTWTCTAAT-3′ using the Thermo Scientific DreamTaq DNA Polymerase following the manufacturer's instructions. The thermocycler program was denaturation at 95°C for 3 min; 30 cycles of 95°C for 45 s, 50°C for 60 s, and 72°C for 90 s; final elongation at 72°C for 10 min; and an infinite hold at 15°C. An agarose gel electrophoresis was performed to confirm the presence of correctly sized amplicons at ~300 bp.
The DNA was sent to Michigan State University's Research Technology Support Facility for an Illumina Amplicon sequencing of the 16S V4 region on the MiSeq v2 Standard platform, resulting in 250-bp paired end reads. The ZymoBIOMICS Microbial Community Standard II (Log Distribution) was included in place of our extraction negative. A negative control was added by the sequencing center.
Soil Biology Data Analysis
The sequences were analyzed using the QIIME2 version 2021.8 on WSU's Kamiak High Performance Computing Cluster. The bacteria were classified using “qiime feature-classifier classify-sklearn” with the Silva 138 99% OTUs from 515F/806R classifier found on the QIIME2 data resources page. The mitochondria and chloroplasts were filtered out before analyzing the diversity metrics. The samples were analyzed at a depth of 10,201 in QIIME2 to determine the diversity of the microbial communities. The analysis of our alpha-rarefaction plot proved to be sufficient in showing the full diversity of our samples. Identification of the bacterial core microbiome was done using “qiime feature-table core-features” with the mitochondria and chloroplasts filtered out. We chose to use the strict bacterial core microbiome with core members being present in 100% of the tested samples. Boxplots were made using the raw data generated by the QIIME2 version 2021.8 using the R version 4.0.3 in the RStudio version 1.2.5001. P-values were adjusted using the Benjamini–Hochberg FDR correction.
Results
Yield, Land Equivalence Ratio, and N Response
Both canola and pea yields were significantly higher in 2020 than in 2021 (Table 1). The 2020–2021 growing season was an unusually dry growing season compared with the 2019–2020 growing season. The greatest difference was in the spring, precipitations in March, May, and June in 2020 were higher than in 2021 (Figure 1). In addition to 2021 being a drought year, the last few weeks of June were abnormally hot, resulting in stress during flowering for the winter peas. The year also had a significant effect on the LER (p < 0.05; Figure 2), and there was a significant interaction between year and the cropping system on pea yield (p < 0.0001).
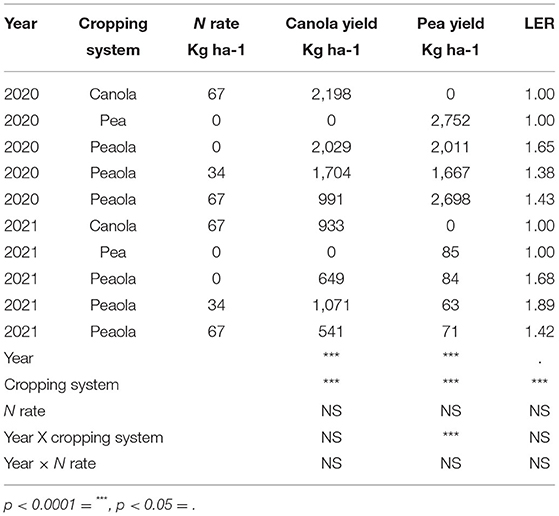
Table 1. Significance of year, cropping system, and N rate on yield and LER at Davenport small plot trials.
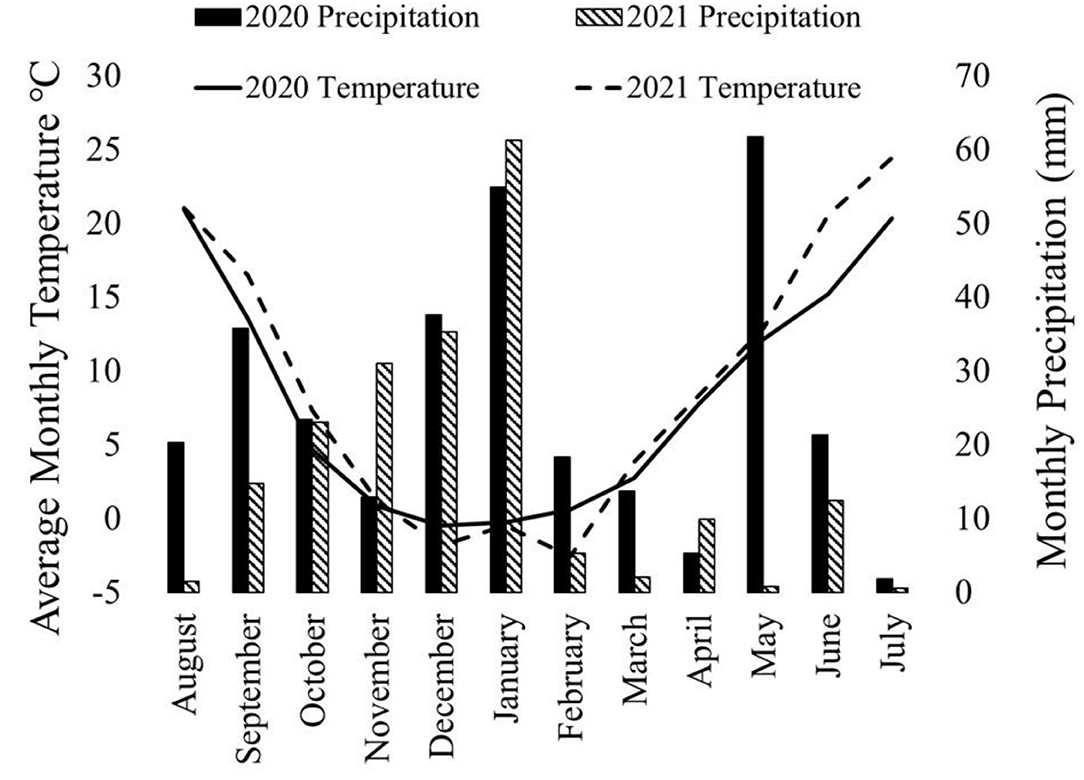
Figure 1. Precipitation and temperature on a month-by-month basis for the 2019–2020 growing season and the 2020–2021 growing season. Spring (March, April, and May) precipitation was substantially higher in 2020 than 2021. Additionally, June and July average temperatures were warmer in 2021 than in 2020. This chart was developed using data from WSU AgWeatherNet (https://weather.wsu.edu/).
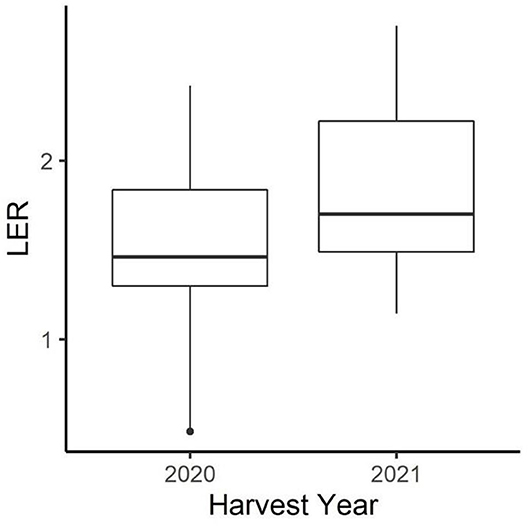
Figure 2. Distribution of peaola LER across all treatments in 2020 and 2021. The year 2021, which had much lower yields, had a higher average LER across all peaola treatments.
The cropping system was shown to have a significant main effect on the canola yield, the pea yield, and the LER (Table 1). The average LER across both years and locations was 1.63 for the peaola compared to the normalized value of 1 for the monocultures. The N fertilization rate was not shown to have a significant effect on canola yield, pea yield, or LER in either year. The relative yields of both peas and canola were calculated as components of the LER (Figure 3).
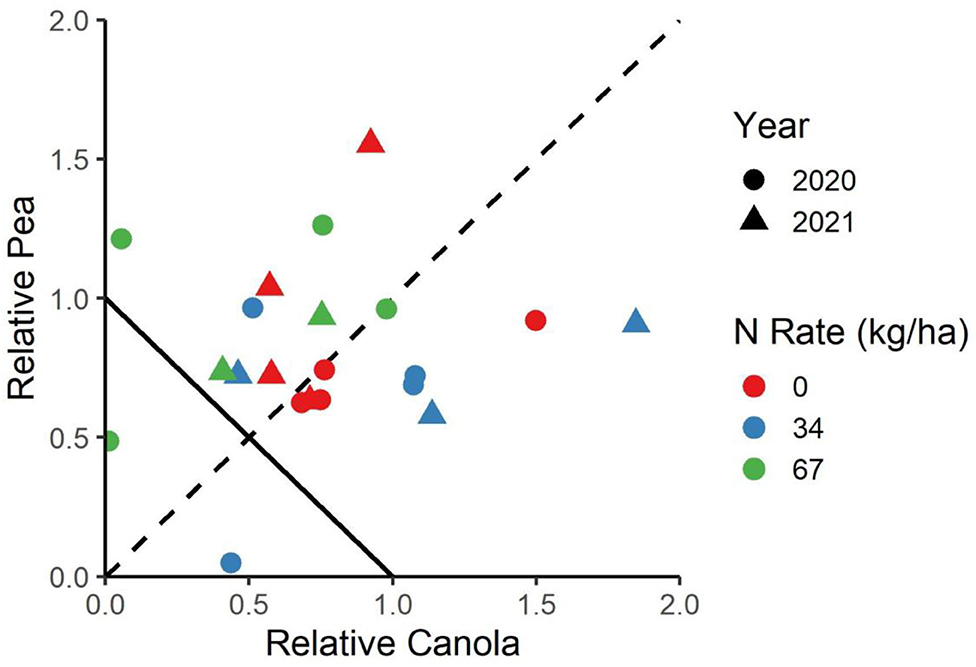
Figure 3. The relative yield of canola and peas in the canola system. The negative-sloped line from (0.1) to (1.0) indicates the LER of the monocultures, while the dashed line indicates to which degree the peas or canola are favored.
At the strip trial near Colfax, the LER of the peaola (1.37) was not significantly different from the LER of the monocultures (Table 2). The average yield of the canola was not significantly different between the intercropped (805 kg ha−1) to the monoculture (778 kg ha−1) strips. However, the yield of peas was significantly reduced in the intercropped (489 kg ha−1) when compared to the monoculture pea yields (1,427 kg ha−1).
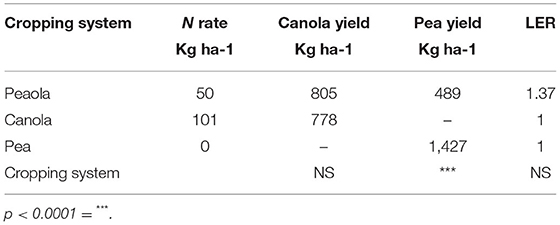
Table 2. Spring canola yield at Colfax location.
Insect Class and Abundance
Herbivores (mostly pea aphids) were significantly higher in pea-only plots (p < 0.001, GLMM, Figure 4). Beneficial insects, including pollinators, parasitoid wasps, and ladybugs, were significantly higher in peaola trials compared to either peas or canola (p = 0.0107, GLMM, Figure 5). Consequently, even though peaola contained peas and was located at the same site, the intercropping strategy greatly reduced the threat of pea aphids. This was likely driven by the presence of more beneficial insects in peaola, including two primary biocontrol agents for aphids (wasps and ladybugs).
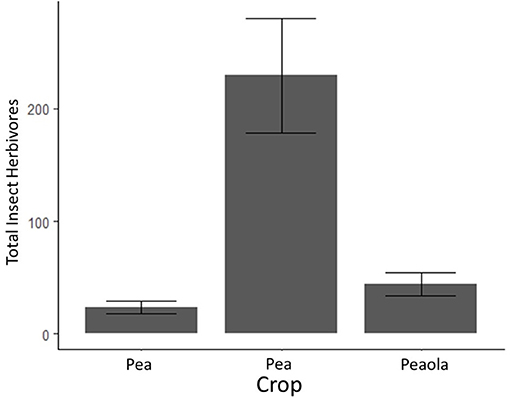
Figure 4. Average counts of beneficial insects (and estimated standard errors) based on 2020 field survey. The bars with error bars that do not overlap are significantly different. Output estimates from negative binomial generalized linear mixed model.
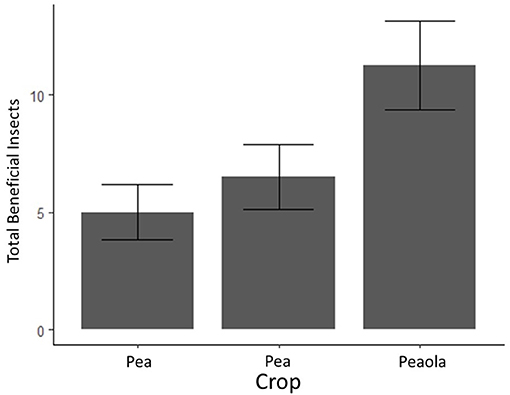
Figure 5. Average counts of insect herbivores (and estimated standard errors) based on 2020 field survey. The bars with error bars that do not overlap are significantly different. Output estimates from negative binomial generalized linear mixed model.
Soil Microbial Community Analysis
The analysis of our microbial community standard revealed that we were able to detect the included bacteria at their appropriate abundance down to bacteria present at a relative abundance of 0.089%. The measures of α-diversity-Shannon diversity index, Observed Features, and Evenness-did not show any significant differences (p < 0.05) or trends (0.05 ≤ p ≤ 0.1) between pea monoculture, canola monoculture, and peaola soils. It was found that the microbial communities in the monoculture pea soil are trending toward being richer than the monoculture canola soil as determined by the Faith's Phylogenetic Diversity index (Kruskal–Wallis Test, n1 = 12, n2 = 12, H = 5.60, p = 0.0537; Figure 6). However, no significant differences or trends were found in the community richness of the peaola soil and pea monoculture soil (Kruskal–Wallis Test, n1 = 12, n2 = 12, H = 1.47, P = 0.3380) and canola monoculture soil (Kruskal–Wallis Test, n1 = 12, n2 = 12, H = 0.653, P = 0.4189) as determined by the Faith's Phylogenetic Diversity index (Figure 6).
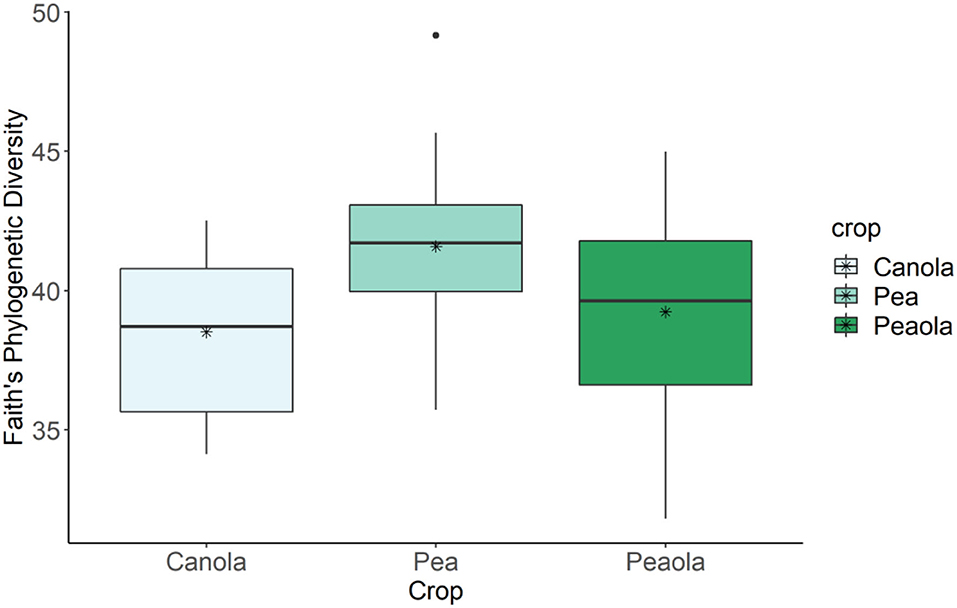
Figure 6. Results of Faith's Phylogenetic Diversity index for canola, pea, and peaola soils. The microbial communities in the monoculture pea soil are trending toward being richer than the monoculture canola soil as determined by the Faith's Phylogenetic Diversity index (Kruskal–Wallis Test, n1 = 12, n2 = 12, H = 5.60, P = 0.0537). No significant difference or trend was found in the community richness of the peaola soil and pea monoculture soil (Kruskal–Wallis Test, n1 = 12, n2 = 12, H = 1.47, P = 0.3380) and canola monoculture soil (Kruskal–Wallis Test, n1 = 12, n2 = 12, H = 0.653, P = 0.4189) as determined by the Faith's Phylogenetic Diversity index. * is the mean.
The measures of β-diversity–Jaccard distance, Bray-Curtis distance, and unweighted UniFrac distance–did not show any significant differences (P < 0.05) or trends (0.05 ≤ P ≤ 0.1) between pea monoculture, canola monoculture, and peaola soils. Using the weighted UniFrac distance, we did find a trend toward there being a difference in the community composition between pea and canola monoculture soils (PERMANOVA, F = 2.06, P = 0.0705), and between peaola and canola monoculture soils (PERMANOVA, F = 1.72, P = 0.0705). No significant difference or trend was found between the pea monoculture and peaola soils (PERMANOVA, F = 1.06, P = 0.3500; Figure 7).
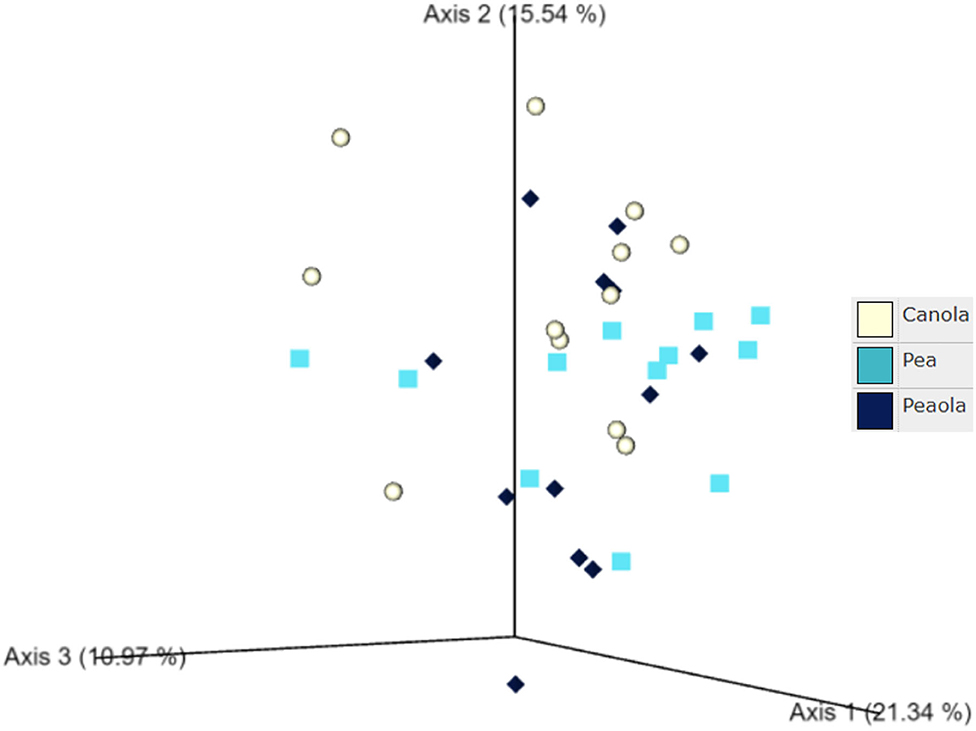
Figure 7. Ordination showing the results of the Weighted UniFrac Distance comparison performed between the different cropping systems. A trend was found toward there being a difference in the community composition of the pea and canola monoculture soils (PERMANOVA, F = 2.06, P = 0.0705) and the peaola and canola monoculture soils (PERMANOVA, F = 1.72, P = 0.0705). No significant difference or trend was found between the pea monoculture and peaola soils (PERMANOVA, F = 1.06, P = 0.3500).
When looking at the makeup of the strict bacterial core microbiome, we found that the peaola core microbiomes consisted of 34 members, the pea core microbiome consisted of 23 members, and the canola core microbiome consisted of 29 members (Table 3). Overall, there were 13 bacteria that were shared across all three core microbiomes. Out of the canola core microbiome, 8 additional bacteria were shared with peaola, and out of the pea core microbiome, 3 additional bacteria were shared with peaola. Peaola had 10 core members that were not shared with either the pea or canola core microbiomes.
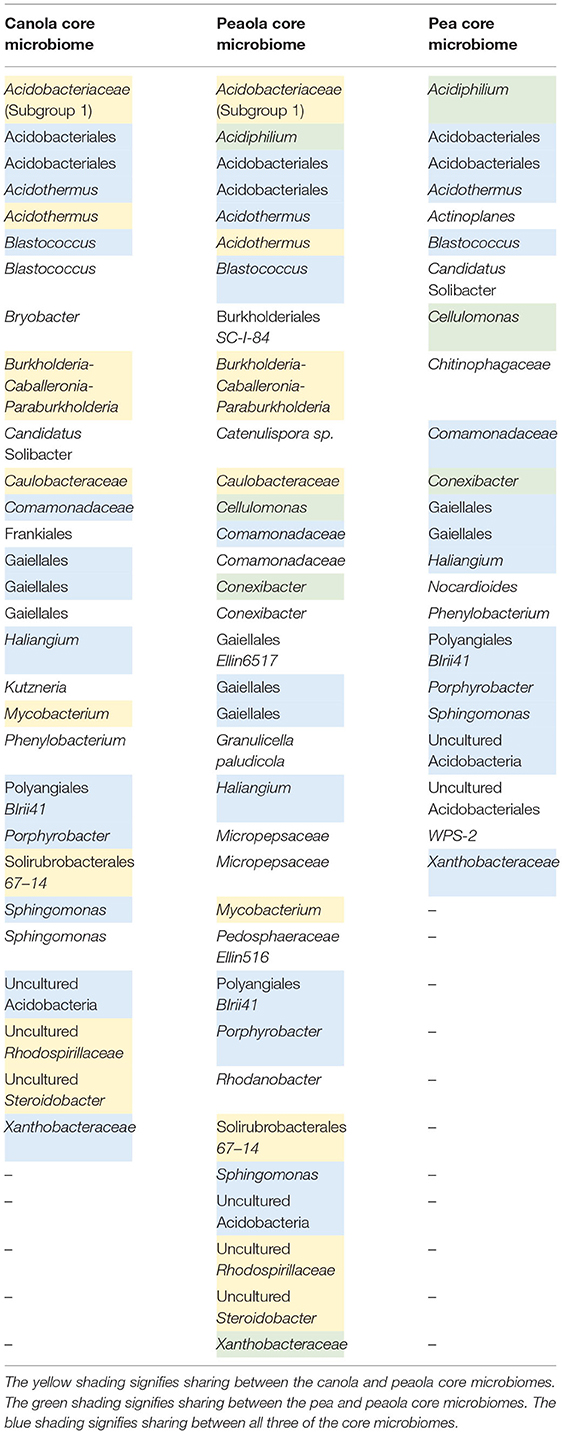
Table 3. Strict bacterial core microbiomes for canola, pea, and peaola.
Discussion
Yield, Land Equivalence Ratio, and N Response
During the 2020–2021 cropping season, the location of the winter peaola trials experienced extreme meteorological drought when compared with the 2019–2020 cropping season (Figure 8). The drought may be responsible for the overall reductions in yield between 2020 and 2021 harvests. In addition to the lack of precipitation, record-breaking temperatures were recorded during the last few weeks of June 2021 (28). The heat wave was coincidental with the flowering of the peas and may be partially responsible for the crop failure of the peas. Heat at flowering is known to reduce yield in both peas and canola (29). While yields for both peas and canola were reduced, the LER remained relatively stable increasing slightly from 2020 to 2021 (Figure 2). The increase in LER from 2020 to 2021 indicates that the intercropping may be less vulnerable to extreme weather events than the corresponding monocultures. In fact, if LER is used as the measurement of choice, the peaola systems may be slightly antifragile when compared to the monoculture cropping systems. The stability of LER over time has previously been noted as a feature of intercropping systems and appears to be a feature of peaola systems in the iPNW (2).
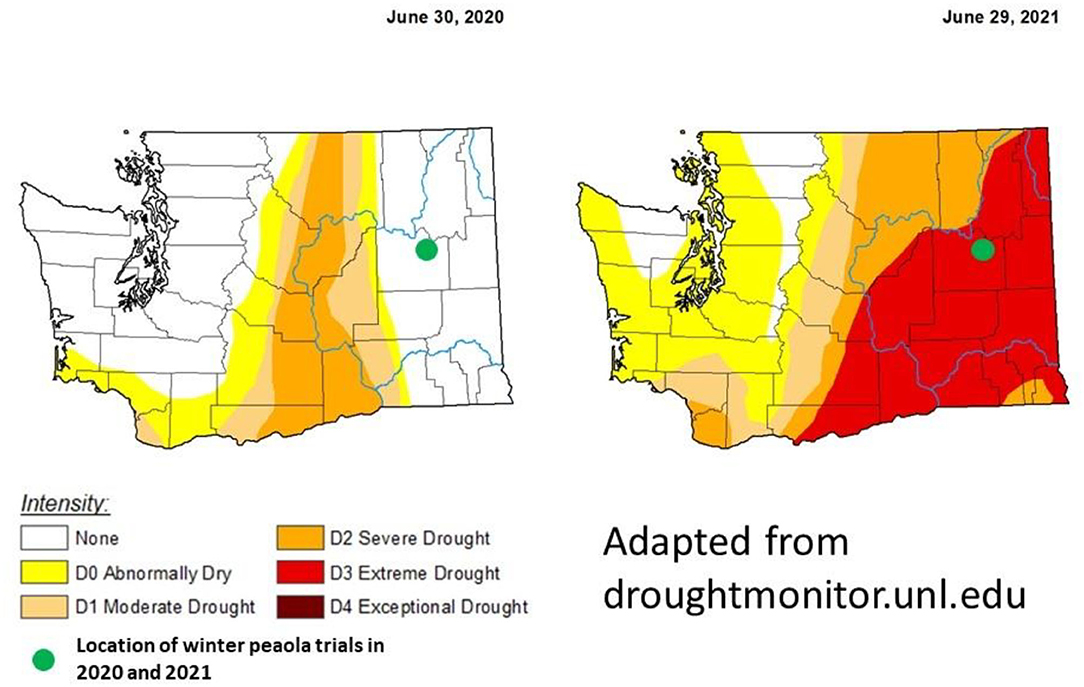
Figure 8. Comparison the meteorological drought conditions from the last week of June in 2020 to the last week of June in 2021. The location of this trial in Davenport, WA, experienced a drought-free year during the 2020–2021 growing season. However, during the 2020–2021 growing season, Davenport experienced extreme drought. These maps were adapted from droughmonitor.unl.edu. The U.S. Drought Monitor is jointly produced by the National Drought Mitigation Center at the University of Nebraska-Lincoln, the United States Department of Agriculture, and the National Oceanic and Atmospheric Administration. Map courtesy of NDMC.
The peaola system did not appear to benefit from increasing the rates of synthetic N fertilizer in either 2020 or 2021. In a review of legume-oilseed intercropping, Dowling et al. (14) included five studies which assessed the effect of N rate on LER of peaola intercropping systems and found that increasing N rate reduced LER in some instances. In some instances, increasing N rate has been shown to increase the relative yield of the canola while the LER of peaola decreases (15). However, the yield and LER data presented here showed that the N rate has no effect on LER, canola, and pea yield in the peaola treatments (Table 1).
The lack of a response to increasing N rate should not be interpreted as conclusive evidence that peaola negates the need for N fertilization. A positive crop response to fertilizer inputs is dependent on the fertilizer being a limiting factor in production. As noted above, in 2021, the crop yield was most likely limited by extreme weather events rather than N supply. However, the lack of a positive effect from N fertilizer in 2019–2020 requires further explanation. Previous studies conducted in the region have shown that monoculture winter canola does not always respond to increasing N applications in a manner that would be expected (30). The lack of response of canola to N in the iPNW may be due to deep soils, unaccounted for mineralization, and/or canola being an exceptional nutrient scavenger (30). This could be the reason why we did not see a response of canola to N fertilizer within the peaola cropping system in 2020. While these results indicate that peaola production would benefit relatively little from synthetic N additions, further research is required to conclusively demonstrate that peaola yield is not positively impacted by N inputs.
Future research may choose to address the potential for transfer of N from peas to canola to be able to determine if plant-plant-microbe interactions are responsible for the increased LER with decreased synthetic N inputs of peaola. Such research would likely require the use of stable isotopes. Regardless of whether the N is transferred from the peas to the canola during the peaola cropping year, incorporating peaola as opposed to monoculture canola should provide rotational N, thereby reducing the dependence of the entire cropping systems on synthetic N. The reduced need for synthetic N inputs in the peaola system will serve to increase the adaptive capacity of the overall cropping system to the economic and supply chain stress, which may impact the availability and cost of synthetic fertilizers.
The relative yield of peas to canola showed that the winter peaola systems did not strongly favor either pea or canola yield (Figure 3). The relative yields are calculated based on the monoculture checks and do not represent the yield of canola in relation to the pea yield. The relative yield allows for an analysis of which species might be favored with a particular intercrop, which may have important implications on the economics of the system as legume and oilseed prices may move independently of each other. In a review of six peaola data sets, Fletcher et al. (2) found that in dramatically overyielding peaola crops, peas were favored over canola. However, the data presented here align with most of the peaola studies reviewed in that the systems has an overall LER of 1.63 and does not strongly favor either peas or canola (2).
Insect Class and Abundance
The abundance of insects by class was shown to shift based on intercropping at Colfax in 2020. Peaola was shown to have significantly greater numbers of beneficial insects among the monoculture systems. Meanwhile, both the canola and the peaola had significantly lower herbivores than the pea monoculture. Whether or not these shifts in populations result in higher economic thresholds for pest insects in peaola over peas cannot be determined from these data. However, future work should look at developing the economic thresholds for insecticide applications in peaola as compared to canola and peas.
Soil Microbial Community Analysis
Considering that we saw no significant differences between the diversity of the peaola soil bacterial community and the soil bacterial communities of pea and canola, it can be concluded that intercropping did not increase the diversity of the soil bacterial community. This is not surprising, however, since in previous studies done in other intercropping systems, only slight changes were observed in the soil bacterial community (17, 20). Despite the lack of significant differences in the diversity of the soil bacterial communities, we did see differences in the composition of the strict bacterial core microbiome. The peaola core microbiome appears to be influenced by both the pea and canola core microbiomes, as it consists of members from both. In addition, it also appears that the peaola core microbiome contains members not observed in the canola and pea core microbiomes, suggesting it could be producing a soil environment unique from what is created by canola and pea. This is supported by the findings of another study that found that the root exudates of intercropped plants differed from when they were grown individually (31). In addition, this provides evidence that under the peaola intercropping system, canola is potentially interacting with microorganisms that it does not normally associate with in monoculture.
To begin to test the hypothesis that canola can interact with microorganisms that are not normally available to it in monoculture, we will need to determine how the rhizosphere and root microbiomes are changing. In studies that have focused on how intercropping impacts the diversity of the bacterial community in the rhizosphere and root microbiomes, it has been found that they experience an increase in their diversity compared to their monoculture counterparts (17, 18, 20). This is likely due to the fact that the plant rhizosphere and root systems are more selective environments than the soil is. Therefore, it will be important for future work to investigate how the rhizosphere and root microbiomes are changing under this intercropping system to fully understand how the microbial community and function in peaola are impacted.
Conclusions
Peaola is a promising production strategy for the iPNW and other regions dominated by large-scale mechanized monoculture agriculture (2, 14). Peaola appears to consistently outyield the monoculture production systems on a land unit basis and does not appear to benefit from the addition of synthetic N. In a drought year (2021), the efficiency of peaola compared to the monocultures on a land basis exceeded that of peaola on a “typical” year (2020). Additionally, the peaola was found to have a different strict bacterial core microbiome and insect populations than either of the existing production systems. The effects of the shifts in the strict bacterial core microbiome are not fully understood at this time and should be explored further in the future. The increase in beneficial insects compared with the control may result in decreased insecticide applications through an increase in beneficial insects. Future research should be conducted to better understand the effects of the peaola cropping system on the function of the microbial community, the potential for reduced insecticide inputs, and the movement of N through the peaola system.
While not originally set forth as an objective, one of the most important findings from this trial is the role of peaola in apparent resistance to drought and heat stress. The data from 2021 highlight that in a year with drought and heat stress where one crop fails (peas), an intercropping scheme can provide a more productive system. Since extreme weather events cannot be easily predicted, planting intercrops can be considered a means of increasing adaptive capacity of the system or insuring potential loss. Previous research conducted on sunflower-soybean intercrops increasing moisture was shown to increase the LER (32). Future research should include the introduction of artificial drought and flooding to test the adaptive capacity of the peaola in comparison to the monoculture production system across a range of climate conditions. Continued research of this nature will serve to better understand the adaptive capacity of peaola under a wide range of environmental conditions.
Data Availability Statement
The data presented in the study are deposited in the NCBI repository, accession number PRJNA832758, https://www.ncbi.nlm.nih.gov/sra/?term=PRJNA832758.
Author Contributions
IM designed and carried out the field trials as they relate to field agronomy, wrote the first draft of the manuscript, analyzed the yield, and LER data. MF and JP were responsible for designing and carrying out the microbial sampling plan as well as analyzing the microbial data and writing the sections regarding the soil microbiology. RC was responsible for carrying out the entomological sampling conducting the data analysis on the entomological data. All authors contributed to the article and approved the submitted version.
Funding
This research was supported in part by the WSU Center for Sustaining Agriculture and Natural Resources BIOAg Program (USDA-NIFA #2020-67013-30864 and USDA-NIFA-SARE #GW21-228).
Conflict of Interest
The authors declare that the research was conducted in the absence of any commercial or financial relationships that could be construed as a potential conflict of interest.
Publisher's Note
All claims expressed in this article are solely those of the authors and do not necessarily represent those of their affiliated organizations, or those of the publisher, the editors and the reviewers. Any product that may be evaluated in this article, or claim that may be made by its manufacturer, is not guaranteed or endorsed by the publisher.
References
1. Bybee-Finley KA, Ryan MR. Advancing intercropping research and practices in industrialized agricultural landscapes. Agriculture. (2018) 8:80. doi: 10.3390/agriculture8060080
2. Fletcher AL, Kirkegaard JA, Peoples MB, Robertson MJ, Whish J, Swan AD. Prospects to utilise intercrops and crop variety mixtures in mechanised, rain-fed, temperate cropping systems. In: Crop and Pasture Science, Vol. 67. CSIRO (2016). p. 1252–67. doi: 10.1071/CP16211
3. Maaz T, Wulfhorst JD, McCracken V, Kirkegaard J, Huggins DR, Roth I, et al. Economic, policy, and social trends and challenges of introducing oilseed and pulse crops into dryland wheat cropping systems. Agric Ecosyst Environ. (2018) 253:177–94. doi: 10.1016/j.agee.2017.03.018
4. Kruger C, Allen E, Abatzogou J, Rajagopalan K, Kirby E. Advances in Dryland Farming in the Inland Pacific Northwest. Washington State University Extension (2017). Available online at: http://pubs.cahnrs.wsu.edu/publications/pubs/em108/
5. Schillinger WF. New winter crops and rotations for the Pacific Northwest low-precipitation drylands. Agron J. (2020) 112:3335–49. doi: 10.1002/agj2.20354
6. Maaz T, Pan W, Hammac W. Influence of soil nitrogen and water supply on canola nitrogen use efficiency. Agron J. (2016) 108:2099–109. doi: 10.2134/agronj2016.01.0008
7. Schillinger WF, Paulitz TC. Canola versus wheat rotation effects on subsequent wheat yield. Field Crops Res. (2018) 223:26–32. doi: 10.1016/j.fcr.2018.04.002
8. Williams JD, Reardon CK, Wuest SB, Long DS. Soil water infiltration after oilseed crop introduction into a Pacific Northwest winter wheat-fallow rotation. J Soil Water Conserv. (2020) 75:739–45. doi: 10.2489/jswc.2020.00165
9. Hansen JC, Schillinger WF, Sullivan TS, Paulitz TC. Rhizosphere microbial communities of canola and wheat at six paired field sites. Appl Soil Ecol. (2018) 130:185–93. doi: 10.1016/j.apsoil.2018.06.012
10. Hansen JC, Schillinger WF, Sullivan TS, Paulitz TC. Soil microbial biomass and fungi reduced with canola introduced into long-term monoculture wheat rotations. Front Microbiol. (2019) 10:1488. doi: 10.3389/fmicb.2019.01488
11. Agboola A, Fayemi A. Fixation and excretion of nitrogen by tropical legumes. Agron J. (1972) 64:409–12. doi: 10.2134/agronj1972.00021962006400040001x
12. Qin M, Zhang Q, Pan J, Jiang S, Liu Y, Bahadur A, et al. Effect of arbuscular mycorrhizal fungi on soil enzyme activity is coupled with increased plant biomass. Euro J Soil Sci. (2019) 71:84–92. doi: 10.1111/ejss.12815
13. Verzeaux J, Hirel B, Dubois F, Lea P, Tétu T. Agricultural practices to improve nitrogen use efficiency through the use of arbuscular mycorrhizae: basic and agronomic aspects. Plant Sci. (2017) 264:48–56. doi: 10.1016/j.plantsci.2017.08.004
14. Dowling A, Sadras OV, Roberts P, Doolette A, Zhou Y, Denton MD. Legume-oilseed intercropping in mechanised broadacre agriculture – a review. Field Crops Res. (2021) 26:107980. doi: 10.1016/j.fcr.2020.107980
15. VanKoughnet B. On-Farm evaluation of peaola intercropping. In: Manitoba Pulse and Soybean Growers. Agri Skills Inc. (2016). Available online at: https://manitobapulse.ca/wp-content/uploads/2018/02/On-Farm-Evaluation-of-Peola-2016.pdf
16. Verbruggen E, Kiers E. Evolutionary ecology of mycorrhizal functional diversity in agricultural systems: AMF in agriculture. Evol Applic. (2010) 3:547–60. doi: 10.1111/j.1752-4571.2010.00145.x
17. Bargaz A, Noyce G, Fulthorpe R, Carlsson G, Furze J, Jensen E, et al. Species interactions enhance root allocation, microbial diversity and P acquisition in intercropped wheat and soybean under P deficiency. Appl Soil Ecol. (2017) 120:179–88. doi: 10.1016/j.apsoil.2017.08.011
18. Cao X, Luo J, Wang X, Chen Z, Liu G, Khan M, et al. Responses of soil bacterial community and Cd phytoextraction to a sedum alfredii-oilseed rape (Brassica napus L. and Brassica juncea L.) intercropping system. Sci Total Environ. (2020) 723:138152. doi: 10.1016/j.scitotenv.2020.138152
19. Granzow S, Kaiser K, Wemheuer B, Pfeiffer B, Daniel R, Vidal S, et al. The effects of cropping regimes on fungal and bacterial communities of wheat and faba bean in a greenhouse pot experiment differ between plant species and compartment. Front Microbiol. (2017) 8:902. doi: 10.3389/fmicb.2017.00902
20. Mwakilili A, Mwaikono K, Herrera S, Midega C, Magingo F, Alsanius B, et al. Long-term maize-Desmodium intercropping shifts structure and composition of soil microbiome with stronger impact on fungal communities. Plant Soil. (2021) 467, 437–50. doi: 10.21203/rs.3.rs-221776/v1
21. Zheng B, Zhang X, Chen P, Du Q, Zhou Y, Yang H, et al. Improving maize's N uptake and N use efficiency by strengthening roots' absorption capacity when intercropped with legumes. PeerJ. (2021) 9:e11658. doi: 10.7717/peerj.11658
22. Weiss MJ, McLeod P, Schatz BG, Hanson BK. Potential for insecticidal management of flea beetle (Coleoptera: Chrysomelidae) on canola. J Econ Entomol. (1991) 84:1597–603. doi: 10.1093/jee/84.5.1597
23. Buntin DG, Raymer PL. Pest status of aphids and other insects in winter canola in Georgia. J Econ Entomol. (1994) 87:1097–104. doi: 10.1093/jee/87.4.1097
24. Silva JHC, Saldanha AV, Carvalho PMR, Machado CFM, Flausino BF, Antonio AC. The interspecific variation of plant traits in brassicas engenders stronger aphid suppression than the intraspecific variation of single plant trait. J Pest Sci. (2022) 9:723–34. doi: 10.1007/s10340-021-01421-z
25. Jones GA, Gillett JL. Intercropping with sunflowers to attract beneficial insects in organic agriculture. Flen. (2005) 88:91–6. doi: 10.1653/0015-4040(2005)088[0091:IWSTAB]2.0.CO;2
26. Ponti L, Altieri MA, Gutierrez AP. Effects of crop diversification levels and fertilization regimes on abundance of Brevicoryne brassicae (L.) and its parasitization by Diaeretiella rapae (M'Intosh) in broccoli. Agric Forest Ent. (2007) 9:209–14. doi: 10.1111/j.1461-9563.2007.00330.x
27. Mead R, Willey RW. The concept of a ‘land equivalent ratio' and advantages in yields from intercropping. Exp Agric. (1980) 16:217–28. doi: 10.1017/S0014479700010978
28. Ansah EO, Walsh OS. Impact of 2021 drought in the Pacific Northwest. Crops Soils. (2021) 54:46–9. doi: 10.1002/crso.20145
29. Mohapatra C, Chand R, Tiwari JK, Singh AK. Effect of heat stress during flowering and pod formation in pea (Pisum sativum physiology L). Mol Biol Plants. (2020) 26:1119–25. doi: 10.1007/s12298-020-00803-4
30. Porter MJ, Pan WL, Schillinger WF, Madsen IJ, Sowers KE, Tao H. Winter canola response to soil and fertilizer nitrogen in semiarid mediterranean conditions. Agron J. (2020) 112:801–14. doi: 10.1002/agj2.20119
31. Badri D, De-la-Peña C, Lei Z, Manter D, Chaparro J, Guimarães R, et al. Root secreted metabolites and proteins are involved in the early events of plant-plant recognition prior to competition. PLoS ONE. (2012) 7:e46640. doi: 10.1371/journal.pone.0046640
Keywords: intercrop, peaola, canola, pea (field), soil microbiome
Citation: Madsen IJ, Parks JM, Friesen ML and Clark RE (2022) Increasing Biodiversity and Land-Use Efficiency Through Pea (Pisum aestivum)-Canola (Brassica napus) Intercropping (Peaola). Front. Soil Sci. 2:818862. doi: 10.3389/fsoil.2022.818862
Received: 20 November 2021; Accepted: 20 April 2022;
Published: 30 June 2022.
Edited by:
Patricia Dorr De Quadros, University of Waterloo, CanadaReviewed by:
Esmaeil Rezaei-Chiyaneh, Urmia University, IranSajjad Raza, Nanjing University of Information Science and Technology, China
Copyright © 2022 Madsen, Parks, Friesen and Clark. This is an open-access article distributed under the terms of the Creative Commons Attribution License (CC BY). The use, distribution or reproduction in other forums is permitted, provided the original author(s) and the copyright owner(s) are credited and that the original publication in this journal is cited, in accordance with accepted academic practice. No use, distribution or reproduction is permitted which does not comply with these terms.
*Correspondence: Isaac J. Madsen, aXNhYWNfbWFkc2VuQHdzdS5lZHU=