 Fatma Rekik
 Harold M. van Es
- Soil Health Laboratory, School of Integrative Plant Science, Soil and Crop Sciences section, Cornell University, Ithaca, NY, United States
A holistic view on possible determinants of human health within a poor subsistence farming community is important to addressing pressing issues surrounding hidden hunger. This survey study assesses the mineral nutrition of women in rural tribal communities of Jharkhand, India, and its possible connection with the mineral status of the soils and the staple crop rice. Associations were explored with inherent and dynamic life features namely geography; socio-demographics; and agronomic, processing and cooking practices. A total of 43 soil and rice and 35 human hair samples were collected from 43 rice fields and their associated households. All samples were analyzed for micronutrients and toxic elements, which included As, B, Ba, Cd, Cr, Cu, Fe, Mn, Mo, Ni, Pb, Se, Sr, V and Zn. Soil samples were additionally analyzed for biological and physical indicators. Kruskal-Wallis ANOVA tests and regularized regressions methods (ridge and lasso) were performed on qualitative parameters with respect to the soil, rice and hair mineral content. For soil data, associations existed between (i) livestock management and Mo and Cd levels in the soil, and (ii) most soil micronutrients and toxic elements with districts and soil textural groups. For rice, Fe concentrations differed among variety types (traditional> hybrid> improved), Cu between landscape positions (midland > lowland), Mn, Ba and Pb among soil textural classes, and Cr, Ba and Pb among districts. In hair, Cd significantly differed between cooking water sources (well water > other), Mn between rice cooking methods (absorption > boil and drain), and Fe, Cr and Ba between the hair-dyed groups. Linear regressions with quantitative variables such as age, household size, number of years farming, fertilization duration (as proxy for land size ownership) and hair sampling length (cm) showed that only hair Ni and Cr were significantly affected by land size ownership, and that the latter mineral is also affected by hair sampling length. The regularized regressions revealed many interlinkages between soil and humans through the rice crop intermediate, as well as between socio-demographics and human health, albeit complex and indirect. To this end, associations were in many cases uninterpretable, yet, they present insight into the confounding factors and possible challenges in the assessment of soil-to-human mineral interlinkages. Future studies are advised to account for these to pinpoint direct and causational relationships in the soil-to-human pathway.
Introduction
Nutritional Interlinkages
Myriad factors define the health of our ecosystems and its constituents. For instance, the health of our soils depends directly on a combination of inherent (geological) and dynamic (both natural and anthropogenic) features (1). The health of humans, like that of crops, is also defined by both genetics and interactions with the external environment. Yet, somewhat uniquely, human health is subject to a complex network of interactive factors like age, wealth, and lifestyle, some of which are controllable while others are not. Lifestyle encompasses many elements, the most notable and indispensable being diet ─ the hallmark of human nutrition. However, diet and specifically its mineral composition is in itself subject to many factors that ultimately affect what ends up being consumed, absorbed and utilized, be it nutrient or toxic element. Such factors include food processing methods, cooking methods, and drinking and cooking water sources, among others (2).
Due to this complexity, the soil to human interlinkages have rarely been studied and seldom at a household level (3, 4). Researchers who did study this interlinkage often overlooked the role of socio-demographic and environmental factors, including the soil’s physical and biological properties that make up a healthy soil. For example, (5) proved that interlinkages exist among Se in soil, grain and hair (as a human bioindicator) in Hebei Province, China to which they attributed the prevalence of Keshan Disease (Se deficiency) in areas with soils, grains and individuals deficient in Se. However, they did not factor in the residents’ agronomic, demographic and lifestyle effects. Similarly, based on studies conducted in India, Nepal and Bangladesh, (6–8), respectively, concluded that there exists a strong significant relationship between Zn content in soil, grain and humans. Yet, they did not consider the effect of soil biological and physical properties. Similar relationships were also established by two other studies by (9, 10) that found high incidence of esophageal cancer in Iran and South Africa associated with substantially low soil Mo and Zn concentrations in food grains and hair and nail samples, but they too overlooked the aforementioned potential external factors. Lastly, (11, 12) concluded a connection between human health as evidenced by long life expectancy in the agricultural areas of Jiangsu and Hubei Provinces, China and the mineral status of the soil, staples and water of that region. Beyond these studies, not much research on this topic has been conducted.
Recently, the Soil Health Institute in partnership with the Friedman School of Nutrition Science and Policy at Tufts University evaluated literature on the relationships between soil health and food nutritional quality (13) and also concluded that little comprehensive research of this nature has been conducted. However, assessing the direct effect of soil health on human nutrition requires approaches different than those deployed in the past since, as previously explained, the soil-to-human mineral transmission is not straightforward, and human nutrition is more complex than the nutritional profile of crops ingested. Also, spatial distribution of nutrients is another key feature underscoring resource heterogeneity and its impact on ecosystem constituents. That is, the micronutrient and toxicity status of soils, plants and humans is not fixed and varies more greatly over space than it does over time (14). Moreover, most global citizens derive their food from varied geographical areas, sometimes through imports from across continents. The admixing of foods from varied sources, often with unknown source locations, thereby prevents explicit analysis of soil, plant, and human health linkages. For these reasons and due to the many confounding factors in diets, the best opportunity for studying the soil-human health linkages may be in subsistence farming communities like those in Jharkhand, India where most food consumption involves locally grown crops. A human survey that accompanies sample collection is a prime way to gather valid information for the evaluation of these external factors.
Soil-Crop-Human Nutrition in Jharkhand, India and its Complexities
Jharkhand is a state in Eastern India that is home to about 40% of the country’s total mineral resources (15). It ranks first in coal, second in iron ore, and third in copper ore reserves, among other important minerals. Conversely, Jharkhand also innately has physically “exhausted, biologically poor and nutrient deficient agricultural soils” (16), which are predominantly sandy loam to loam texture with low pH (4.5-6.5) and low fertility (17). A large proportion of Jharkhand’s soils are deficient in at least one essential nutrient, e.g., 66% are P deficient; 18% are K deficient; 18% are Zn deficient; and 60% are B deficient (17, Shukla et al., 2018).
On the human health front, Jharkhand is considered one of India’s most vulnerable and highest health burden states (18). Intra-household discrimination against women in rural areas and food consumption disparity often leads them to consume the leftovers of their husbands and children, leading to a suboptimal diet in quantity and quality (personal communication). Thirty-five percent of Jharkhand rural women have below-normal body mass index (BMI), and in many districts, more than 85% of women are anemic, marking the highest prevalence in the country (Ministry of Home Affairs 2014, Ministry of Health and Family Welfare 2016). The maternal mortality ratio of 312 is higher than the national average of 254 (17). However, even within Jharkhand, the variation in health status between districts and even villages is apparent (17; Ministry of Home Affairs 2014; Ministry of Health and Family Welfare 2016). Due to this discrepancy between natural-resource-richness and severe malnutrition and poverty, the State suffers from what is termed “the resource curse” (19).
Nutrient deficiencies in humans sometimes arise as a result of the low bioavailability of nutrients in the soil and/or the foods ingested as a result of the presence of anti-nutrients such as heavy metals (in soils and plants) or phytate (in plants; 20). Phytic acid (phytate) is the primary source of phosphorous in many plant seeds, contributing approximately 70% of total phosphorus, and plays a role in inhibiting fungal infection in seeds (21). From a human nutrition standpoint, phytate is notorious for its anti-nutrient property as it is a strong chelator, which renders essential dietary nutrients including minerals (Ca, Zn, Mg, Mn and Fe), proteins and amino acids unavailable for human absorption and/or utilization.
The issue of the parboiling – the process of soaking, steaming and drying – of Jharkhand’s staple crop rice is another determinant of human nutrition. In the early 1900’s, it was discovered that the consumption of non-parboiled rice was associated with beriberi disease, a vitamin B1 deficiency (22), and patients who switched their intake to parboiled rice recovered from it (22). In addition to a higher concentration of vitamin B1, parboiled rice is noted for its higher concentrations of macro and micro minerals, including Ca, Cu, Fe, and Zn. This nutritional richness is a result of the solubilization of these minerals and their migration from the aleurone and germ into the starchy endosperm that is eaten (23). Yet, the retention pattern of minerals in the endosperm is the result of many interactions involving the physical location of the mineral in the grain, its solubility during soaking, its migration ratio as well as the milling resistance of the parboiled grain (23). The nutritional benefits of parboiled rice are therefore variable, mostly due to the lack of uniform commercial and household parboiling methods.
Conversely, rice milling has a negative effect on the total concentrations of certain mineral nutrients, notably Fe, Zn, Cu and Mg. Concentration of these nutrients in polished rice can be 75% less than partially milled or brown rice since most nutrients are found in the outer grain layers that are typically removed (21). As a result, polished rice makes deficiencies common in rice-eating communities where it is the major energy source. Milling also tends to favorably reduce phytate content in rice since over 80% is concentrated in the outer bran layers (24). This in turn benefits the minerals’ bioavailability.
Nutrient bioavailability is the amount of a nutrient acquired through food intake that can be absorbed by the human gut and utilized by the body. It is the bioavailable amount of micronutrients in a meal, rather than the total amount, that is the critical factor for human nutrition (21). Most staples, like rice, contain relatively low levels of bioavailable Fe and Zn (e.g., about 5%), and some studies have suggested strategies to enhance bioavailability of essential mineral elements including the reduction of phytate content in grains. This relies on changes in food preparation practices that include soaking cereals to allow leaching and degradation of water-soluble phytate (25). This method was shown to reduce the phytate content in maize by up to 36% and in brown rice by up to 91% (26, 27). Similarly, parboiling significantly diminished phytate content in finger millet (28). Similarly, oat, wheat and rice bran samples treated by a hydrothermal autoclaving process showed a 94, 95 and 96% decrease in phytate content, respectively (29).
A myriad of other factors that may affect bioavailability include the state of natural resources (soil and water); crop genetics; agronomic practices; food processing, storage and preparation; consumer demographics (age, medical history, household size, wealth, farming experience, etc.); and the array of nutrients ingested at a single time (since the intake of one nutrient may influence the availability of another; 21). The objective of this study was to assess the role of environment, demographics, and social practices with particular emphasis on agronomic, food processing, dietary and health practices, in soil, rice, and human mineral health of Jharkhand women-farmers.
Materials and Methods
Sampling, Surveying and Laboratory Analyses
Jharkhand is characterized with a geology that consists mostly of Archean granites and gneisses, and some schists in the capitol, Ranchi (30). These parent materials are generally nutrient-poor but have varying chemical and mineralogical compositions (31–34). Portions of our study area also include basalt (Hazaribagh district), laterite and alluvium (Gumla district), and mica (Giridih district; 35). Alfisols, Entisols and Inceptisols are the dominant soil orders (SoilGrids250m Version 2.0 (36, 37) (1:250,000 scale; retrieved from 30). Alfisols account for 72%, 71%, 64%, 62%, and 43% of the total land area of Hazaribagh, Ranchi, Giridih, Bokaro and Gumla districts, respectively, while 35% of West Singhbum are mapped as Entisols (30). Information is not available for Ramgarh district as it was historically a subdivision of larger Hazaribagh.
Surface-soil (0 to 15 cm depth) and subsoil samples (30 to 40 cm depth) were collected in a previous 2015 study (38) from stratified randomly selected rice fields that spanned seven districts in Jharkhand, namely Bokaro, Giridih, Gumla, Hazaribagh, Ramgarh, Ranchi and West Singhbum (Figure 1). One kg of soil was collected by combining and thoroughly mixing five soil slices per depth increment within a radius of 3 m of the position of interest. GPS coordinates, altitude, village name, and landscape position data were recorded at each sampling location. Samples were air dried and shipped to Cornell University (Ithaca, NY, USA) for soil health assessment following the protocol of the Comprehensive Assessment of Soil Health (CASH) approach which includes the analysis of physical, biological and chemical soil properties, including wet aggregate stability (WAS), available water capacity (AWC), surface (PR<15) and subsurface (PR>45) compaction, total soil organic matter (OM), active carbon (AC), protein, respiration, pH and a suite of mineral elements (1).
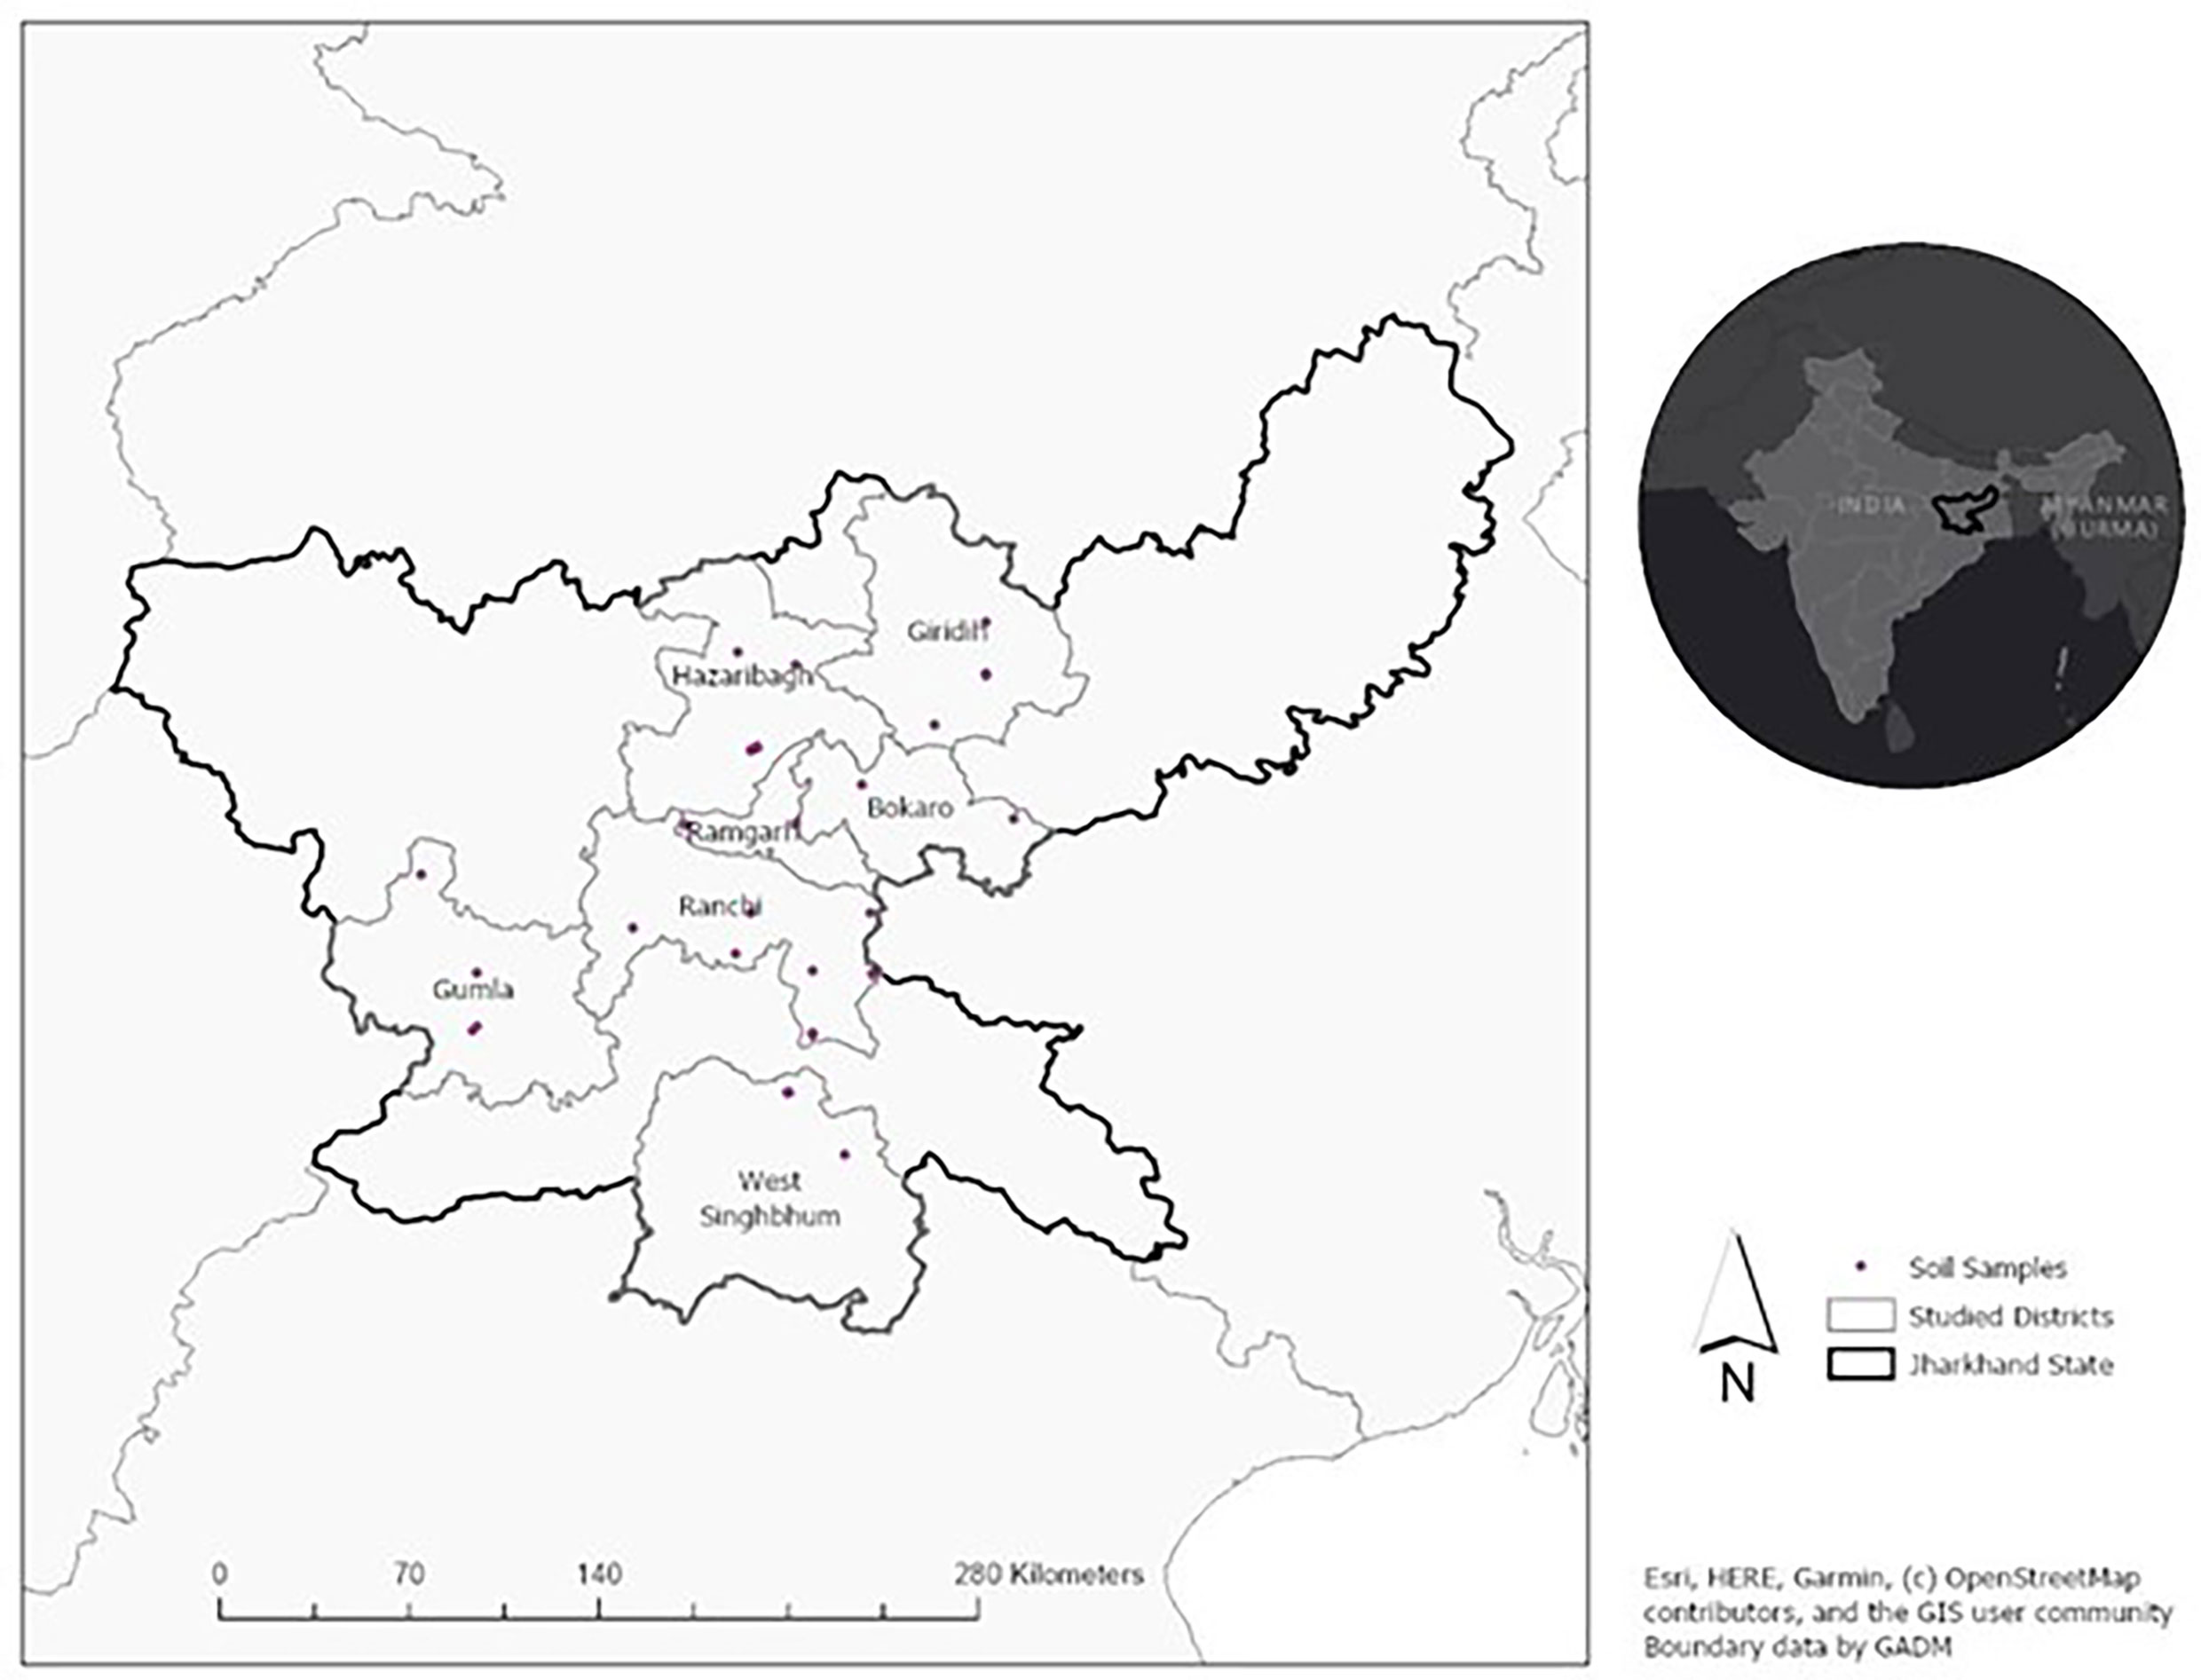
Figure 1 Map of Jharkhand, India with district boundaries and soil sampling sites (15). Permission received from Elsevier.
Forty-three sampling sites were revisited in 2018 for rice and hair sampling. We collected approximately one handful of stored rice that was grown on the fields from which soil was previously sampled. We also collected hair samples to serve as a nutrition bioindicator by cutting a portion of the longest strand of hair from a female head of household (grandmother or mother, else eldest daughter/daughter-in-law) who was subsisting on the fields from which the rice and soil were sampled. The amount of hair sampled varied among individuals based on what was permitted (comb remains vs. snippets); eight subjects refused to give hair samples due to superstitious beliefs. Samples which totaled 35 hair and 43 rice samples were transported to the Cornell Nutrient Analysis Laboratory (Ithaca, NY, USA) for mineral analyses which included As, B, Ba, Cd, Cr, Cu, Fe, Mn, Mo, Ni, Pb, Se, Sr, V and Zn [described in full in Rekik and van Es (16)].
Participants were also asked to answer a series of survey questions about their rice growing, processing and cooking practices as well as their dietary, health and nutritional routines in the form of a questionnaire (Table 1). Demographic and socioeconomic information was also collected. All participants consented to their participation, and approval to conduct this study was obtained from the Cornell University Institutional Review Board and the local Ethical Committee of Ekjut in Jharkhand, India.
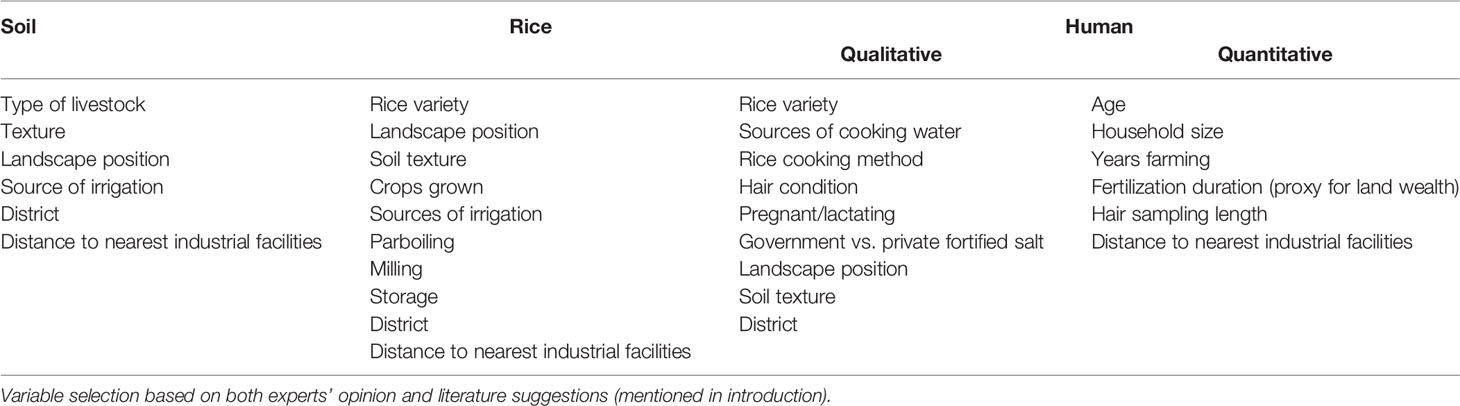
Table 1 Variables assessed at each of the soil, rice and human levels using Kruskal-Wallis one-way ANOVA and regularized regression.
Soil minerals were extracted using a Mehlich-III solution whereas rice and hair samples were digested using nitric and perchloric acids following the methods described in Rekik and van Es (16). Minerals from all media were subsequently quantified by Inductively Coupled Plasma Optical Emission Spectroscopy (ICP–OES, Varian 730-ES, Mulgrave, Victoria, Australia).
Spatial and Statistical Analyses
Industrial facilities, including mines and large-scale plants, were located using satellite-based real imagery (Google Earth Pro v. 7.3) – a method used by the Ministry of Mines of India to track illegal mining (39). We identified 73 industrial facilities surrounding our sample households across Jharkhand. The “Near” spatial analysis function on ArcGIS Pro Software (v. 2.4.1) was used to compute the distance to the nearest facility for each sampling location. The distribution of the nearest distances from sample households ─ ranging from 850 m to 51 km ─ were severely right-skewed and required a log10 transformation.
Due to the small sample size and the slight deviations from normality, Kruskal-Wallis one-way Analysis of Variance (ANOVA) ─ a non-parametric test ─ was conducted on the soil, rice and hair mineral concentrations as a function of the surveyed geographic, demographic, agronomic and processing categorical variables, which were selected based on a combination of experts’ opinion and consulted literature (Table 1). Furthermore, a multiple linear regression model was constructed to assess the continuous factors that may be influencing soil, rice and human health. These include age, household size, years of farming, fertilization duration (a proxy for land size ownership), hair sampling length and proximity to industrial facilities. This study portion only focuses on the micro-minerals (B, Cr, Cu, Fe, Mn, Mo, Ni, Se, V, Zn) and toxic elements (As, Ba, Cd, Pb, Sr) and the anti-nutrient phytate.
These quantitative and qualitative predictors were also deployed in ridge and lasso regressions which are data regularization methods that deal with multicollinearity, i.e., non-independence of predictor variables (40). These methods thus stabilize the estimates of predictors by penalizing large coefficients, thereby reducing the overall variance. This bias-variance tradeoff method results in underestimated effects where a higher penalty term λ is associated with higher underestimated coefficients. In this study, the data were standardized and the best penalty terms λ (0 ─ ∞) were identified through a series of 10-fold cross-validations repeated five times. Model comparisons were conducted between the ridge and lasso approaches based on their RMSEs for the chosen penalty term (or when marginal decreases in RMSE started to taper off), and model output was interpreted. This was undertaken for the three nutritionally important health indicators Zn, Fe and Ca and the toxic elements Pb and Cd, and their top five predictors are reported. At this stage, six detected outliers (hair Zn ~ [2000 ppm]; hair Cu ~ [210 ppm]; hair Sr ~ [80 ppm]; soil Zn ~ [40 ppm]; soil S ~ [5000 ppm]; and soil P ~ [40 ppm]) were removed. Microsoft Excel (v. 2016) and the R-Project for Statistical Computing (v. 3.6.2.; packages “glmnet” and “caret”) were used for data preparation and statistical analyses.
Results and Discussions
Survey Results
The mean age of the study participants was 37 years, with about half in the mid-30s to mid-40s age range. The average household size was seven members, and the average number of years farming was 24. Since land ownership is considered a sensitive topic for the rural people of Jharkhand who are threatened by illegal land grabbing and transfers (17), participants were asked about the amount of time needed to fertilize all their fields as an implicit indicator of how much land they own. Upon categorizing them, 45% of our sample have marginal (up to 1 ha), 14% small (1 to 2 ha), 25% medium (2 to 4 ha) and 12% large (above 4 ha) landholding sizes, a similar distribution to Hossain et al. (41). As for rice production, 86% of respondents grow only rice, while the remaining five grow rice and other crops, notably greens, legumes and pulses. Approximately 60% grow only one rice variety, while the rest grow two or more rice varieties. Approximately 45% grow hybrid (modern) rice, 30% improved rice, and the remaining 25% traditional varieties. Four respondents do not use any macronutrient fertilizers, two use only diammonium phosphate (DAP) while the rest use both DAP and urea in their paddy cultivation. None used micronutrient fertilizer. As for organic amendments, all but three households applied either one or a combination of cow (Bos taurus) or goat (Capra aegagrus hircus) manure. All respondents stated that they allow livestock to roam in their fields after harvest, including cattle (Bos taurus), goat (Capra aegagrus hircus), oxen (Bos taurus), buffalo (Bubalus bubalis), chicken (Gallus gallus domesticus), pig (Sus), and sheep (Ovis aries). All respondents collect rice straw after harvest, and all but three feed it to their livestock. Of those, all but one collect the manure defecated by their livestock and apply it to their fields, thus recycling some nutrients. Some additionally use it for painting walls, flooring, or cooking. Of the 15 that use it for cooking, all but one spread the burnt ashes on the field. As for rice consumption, more than 80% of our respondents consume rice at a rate of more than once a day, while the rest consume it once a day. All respondents consume foods from outside sources at a rate of 3-to-5 kg per week, predominantly including vegetables (onions, tomatoes, potatoes and leafy greens), pulses, and sometimes rice whenever the household stock runs out. All but seven of the participants consume Public Distribution System (PDS) foods, which typically comprises PDS rice and cooking oil. All participants consume at least one type of fortified salt: 14 (33%) use the government (PDS) double fortified salt (iodine and iron) while the majority (67%) prefer another type of fortified salt, typically one containing only iodine. In parboiling rice, there are three distinct methods adopted by our sample: 12 (28%) of respondents boil the rice, 23 (53%) steam it, while the eight remaining (19%) do a combination of both. To cook rice, 27 respondents (63%) use well water while 8 (18%) use handpump water. Two respondents use municipal tap water and another two use river water. The rest use a combination of the former methods. Rice-cooking involves two methods adopted equally in our sample: the boil and drain method, which entails draining the excess starchy and nutrient-rich water after boiling the rice, and the absorption method where the rice entirely soaks in the water that it is cooked in. Twenty-one (49%) of our respondents use the boil and drain method, while the remaining 22 (51%) use the absorption method. As for human health, the average hair length of our participants is 73 cm. Of the 41 that responded to the question on hair cleansing products used, 9 (22%) said they used soap, 24 (59%) shampoo and 2 mud (5%). The rest used a combination of them. Twenty-four (56%) respondents do not have their hair colored, while the remaining 19 (44%) do. At the time of the study, six of our participants were either pregnant or lactating, and six suffered from at least one incidence of diarrhea in the last year.
Social, Environmental and Geographic Differences and Their Relation to Mineral Status
Soil
Results from the the Kruskal-Wallis one-way ANOVA test of soil mineral concentrations as a function of the surveyed geographic, demographic, agronomic and processing categorical variables showed that soil Mo and Cd significantly differed among livestock groups ‘ cow’, ‘cow+other’ and ‘other’ (p=0.04 and p= 0.02, respectively; Figure 2), with the highest median concentrations found in the “other” group. This phenomenon may be due to differences in manure composition of the different animal species. Specifically, poultry manure is known to have higher concentrations of both Mo (42) and Cd (43) than cattle, pigs, horses and sheep, with a ten-fold difference in the case of Mo. Alternatively, this result may be confounded by the feed source by which cattle mostly graze locally, while chickens or pigs are fed from external feed sources. Livestock management did not significantly differ among districts (data not shown).
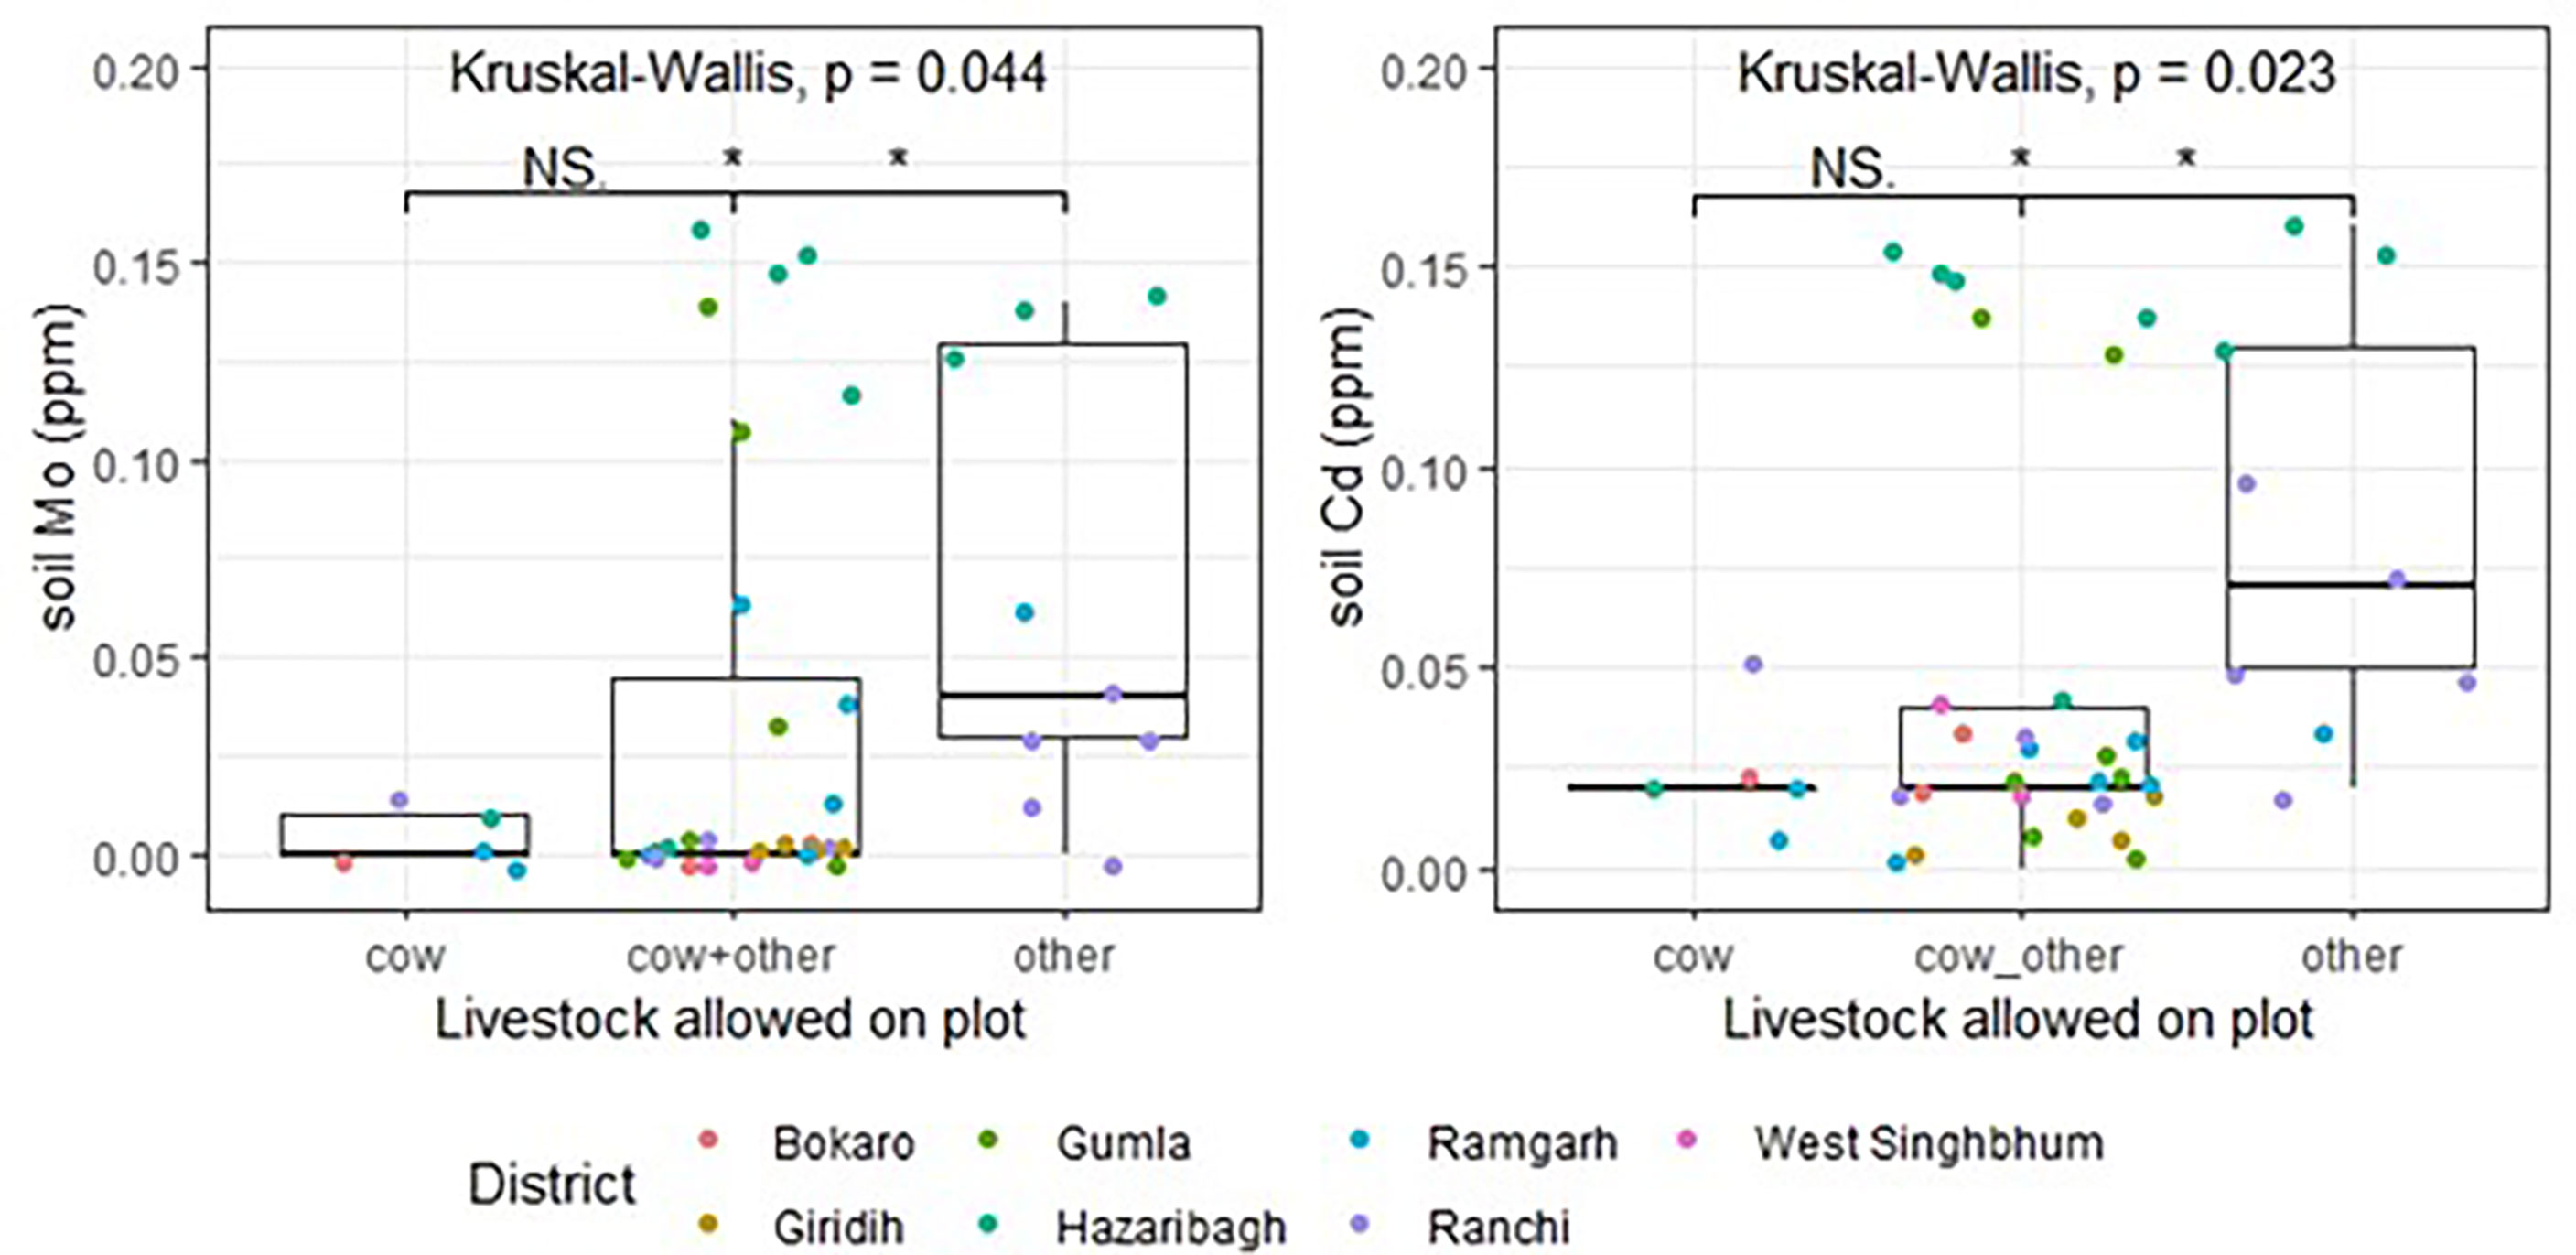
Figure 2 Soil Mo and Cd distribution among livestock groups allowed on plots in fallow season. NS, not significant; * significant at the 0.05 significance level.
Further, soil micronutrients B, Cr, Mo and Zn and soil toxins As, Ba and Cd were significantly different among the districts, with the highest medians found in Hazaribagh district (p= 0.02, p=0.01, p<0.01 and p=0.03, p<0.01, p=0.04 and p<0.01, respectively; Figure 3). Hazaribagh has disproportionately higher concentrations of most of the studied minerals. These differences are likely due to inherent soil differences including mineral composition and texture (mostly medium-textured). Hazaribagh is known for its mineral richness as evidenced by the existence of many mines, especially with coal and limestone (15). Figure 4 illustrates the number of industrial mining facilities that were identified surrounding the sampled households. In general, we infer two main drivers of soil mineral concentration differences in our sample: one is inherent parent material differences, and another is anthropogenic, notably livestock management.
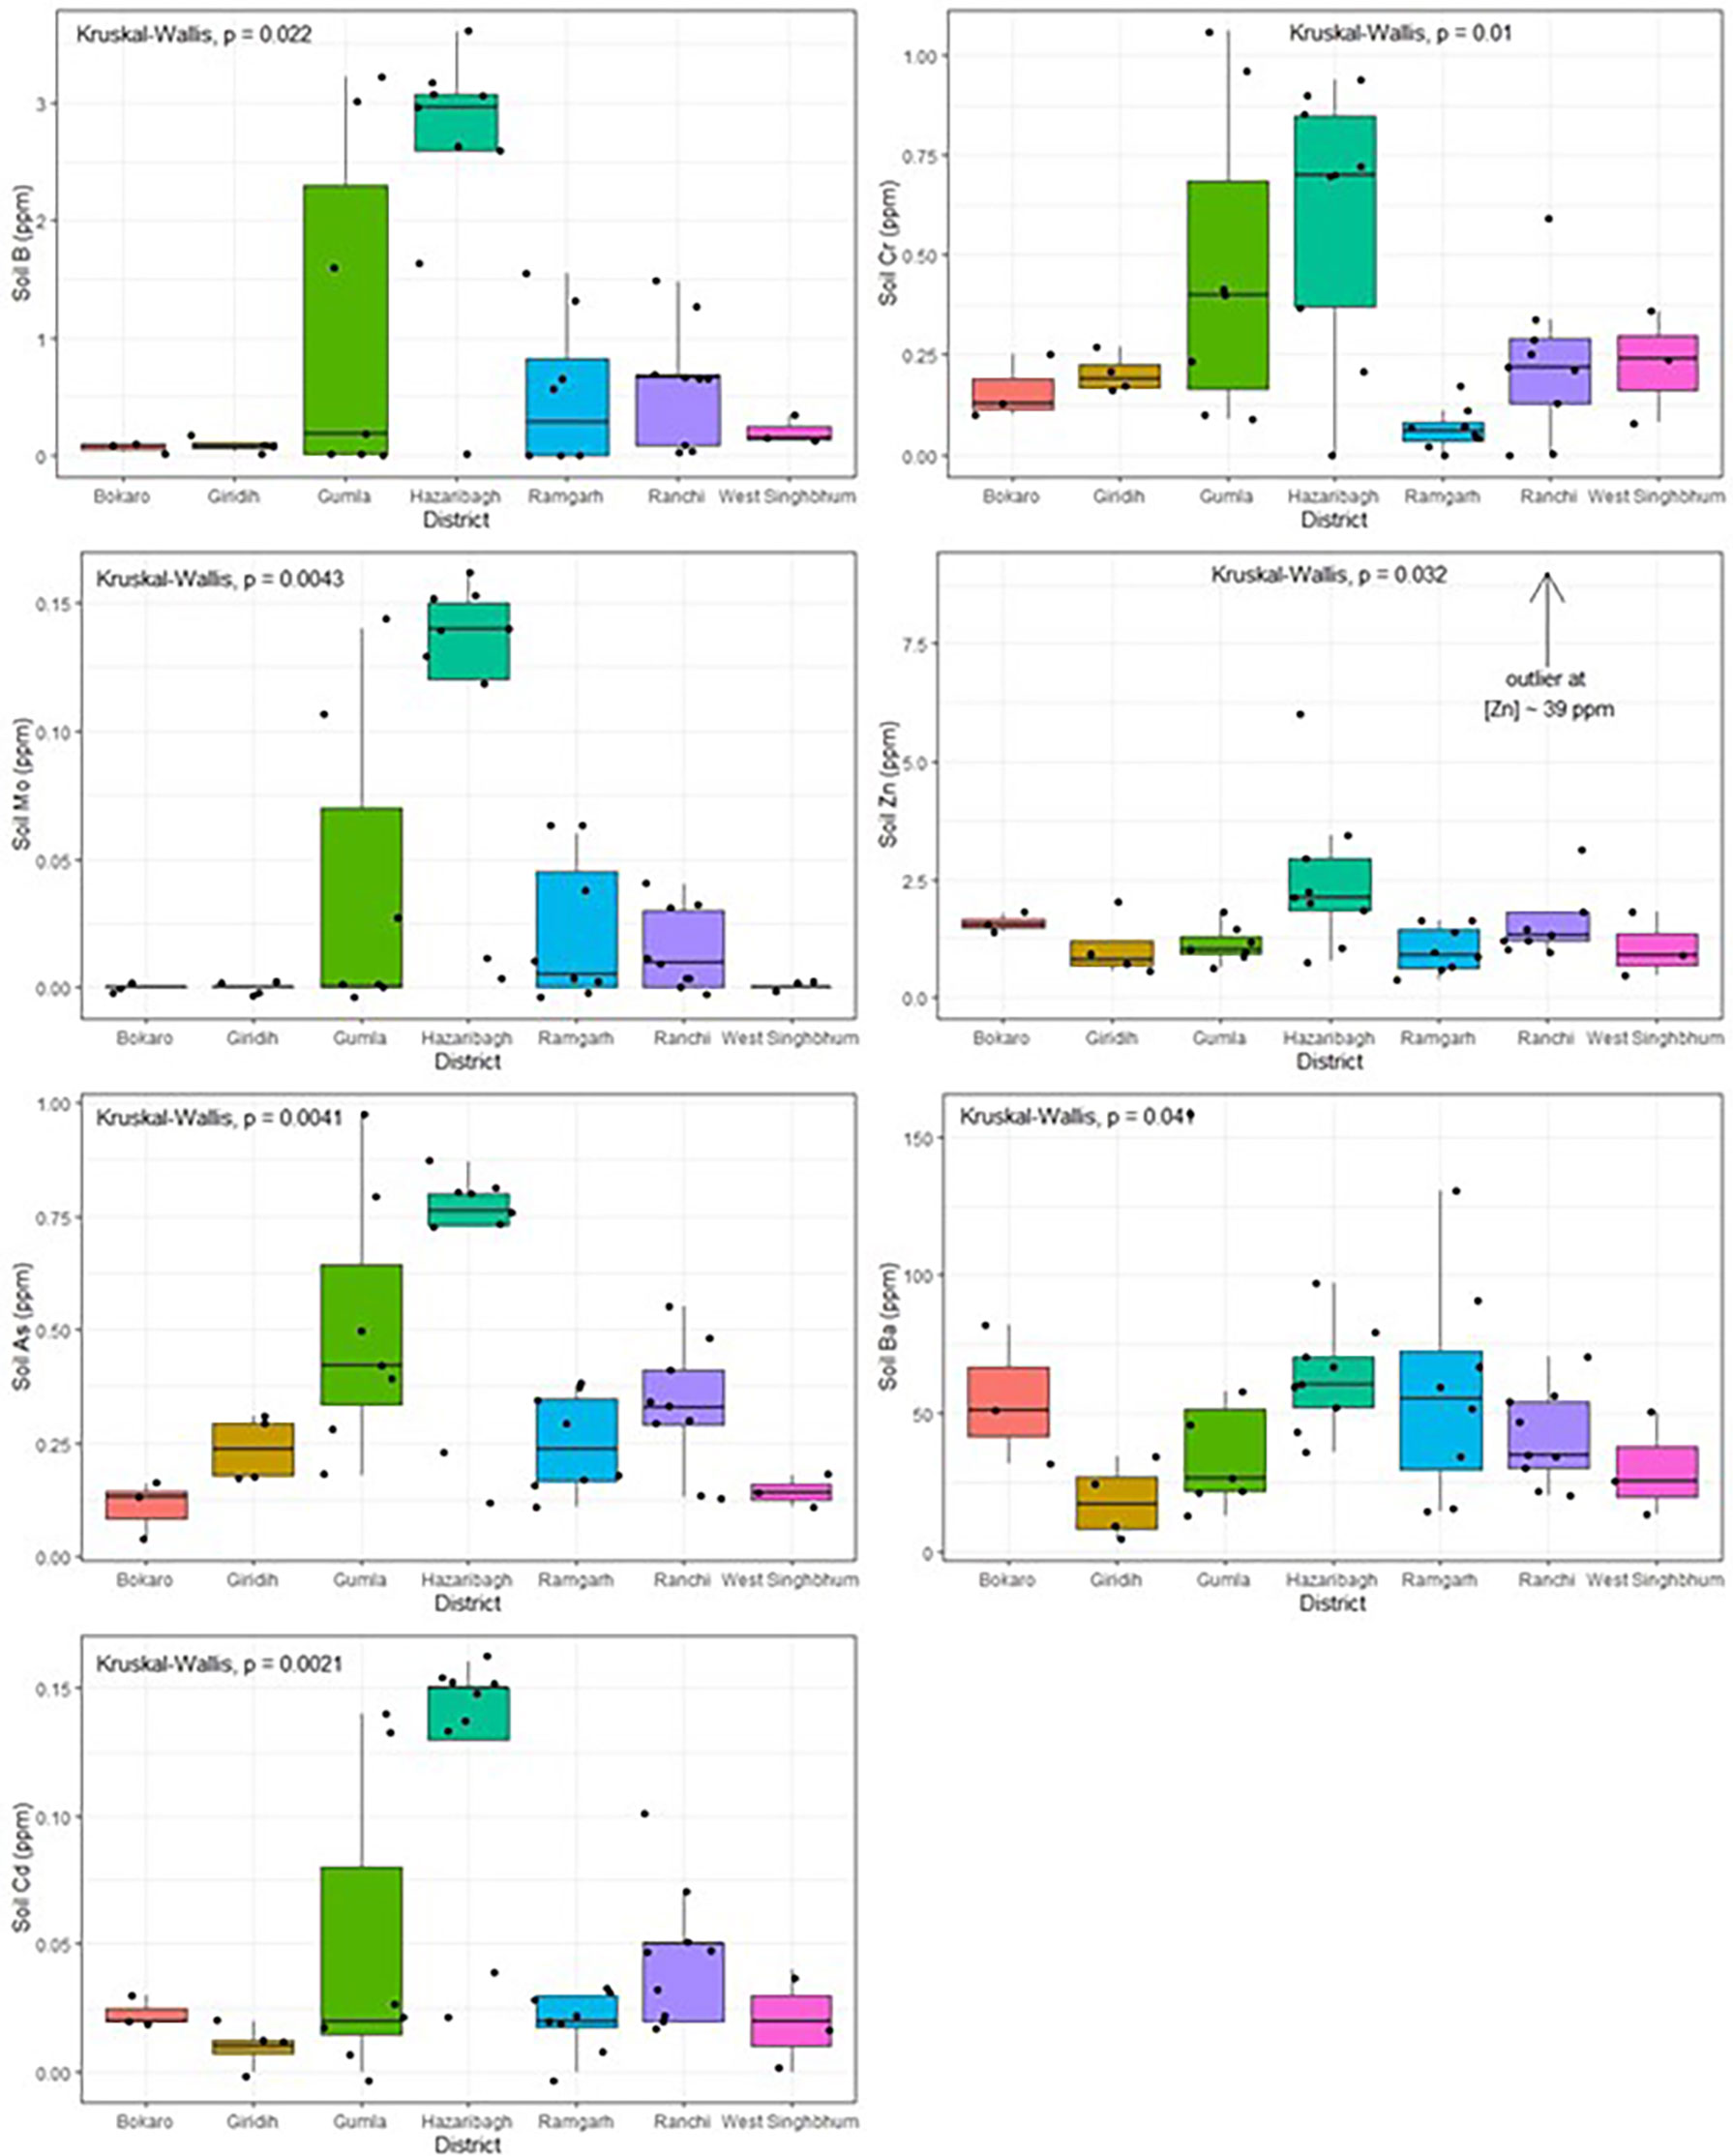
Figure 3 Soil mineral distribution across the seven districts in Jharkhand.
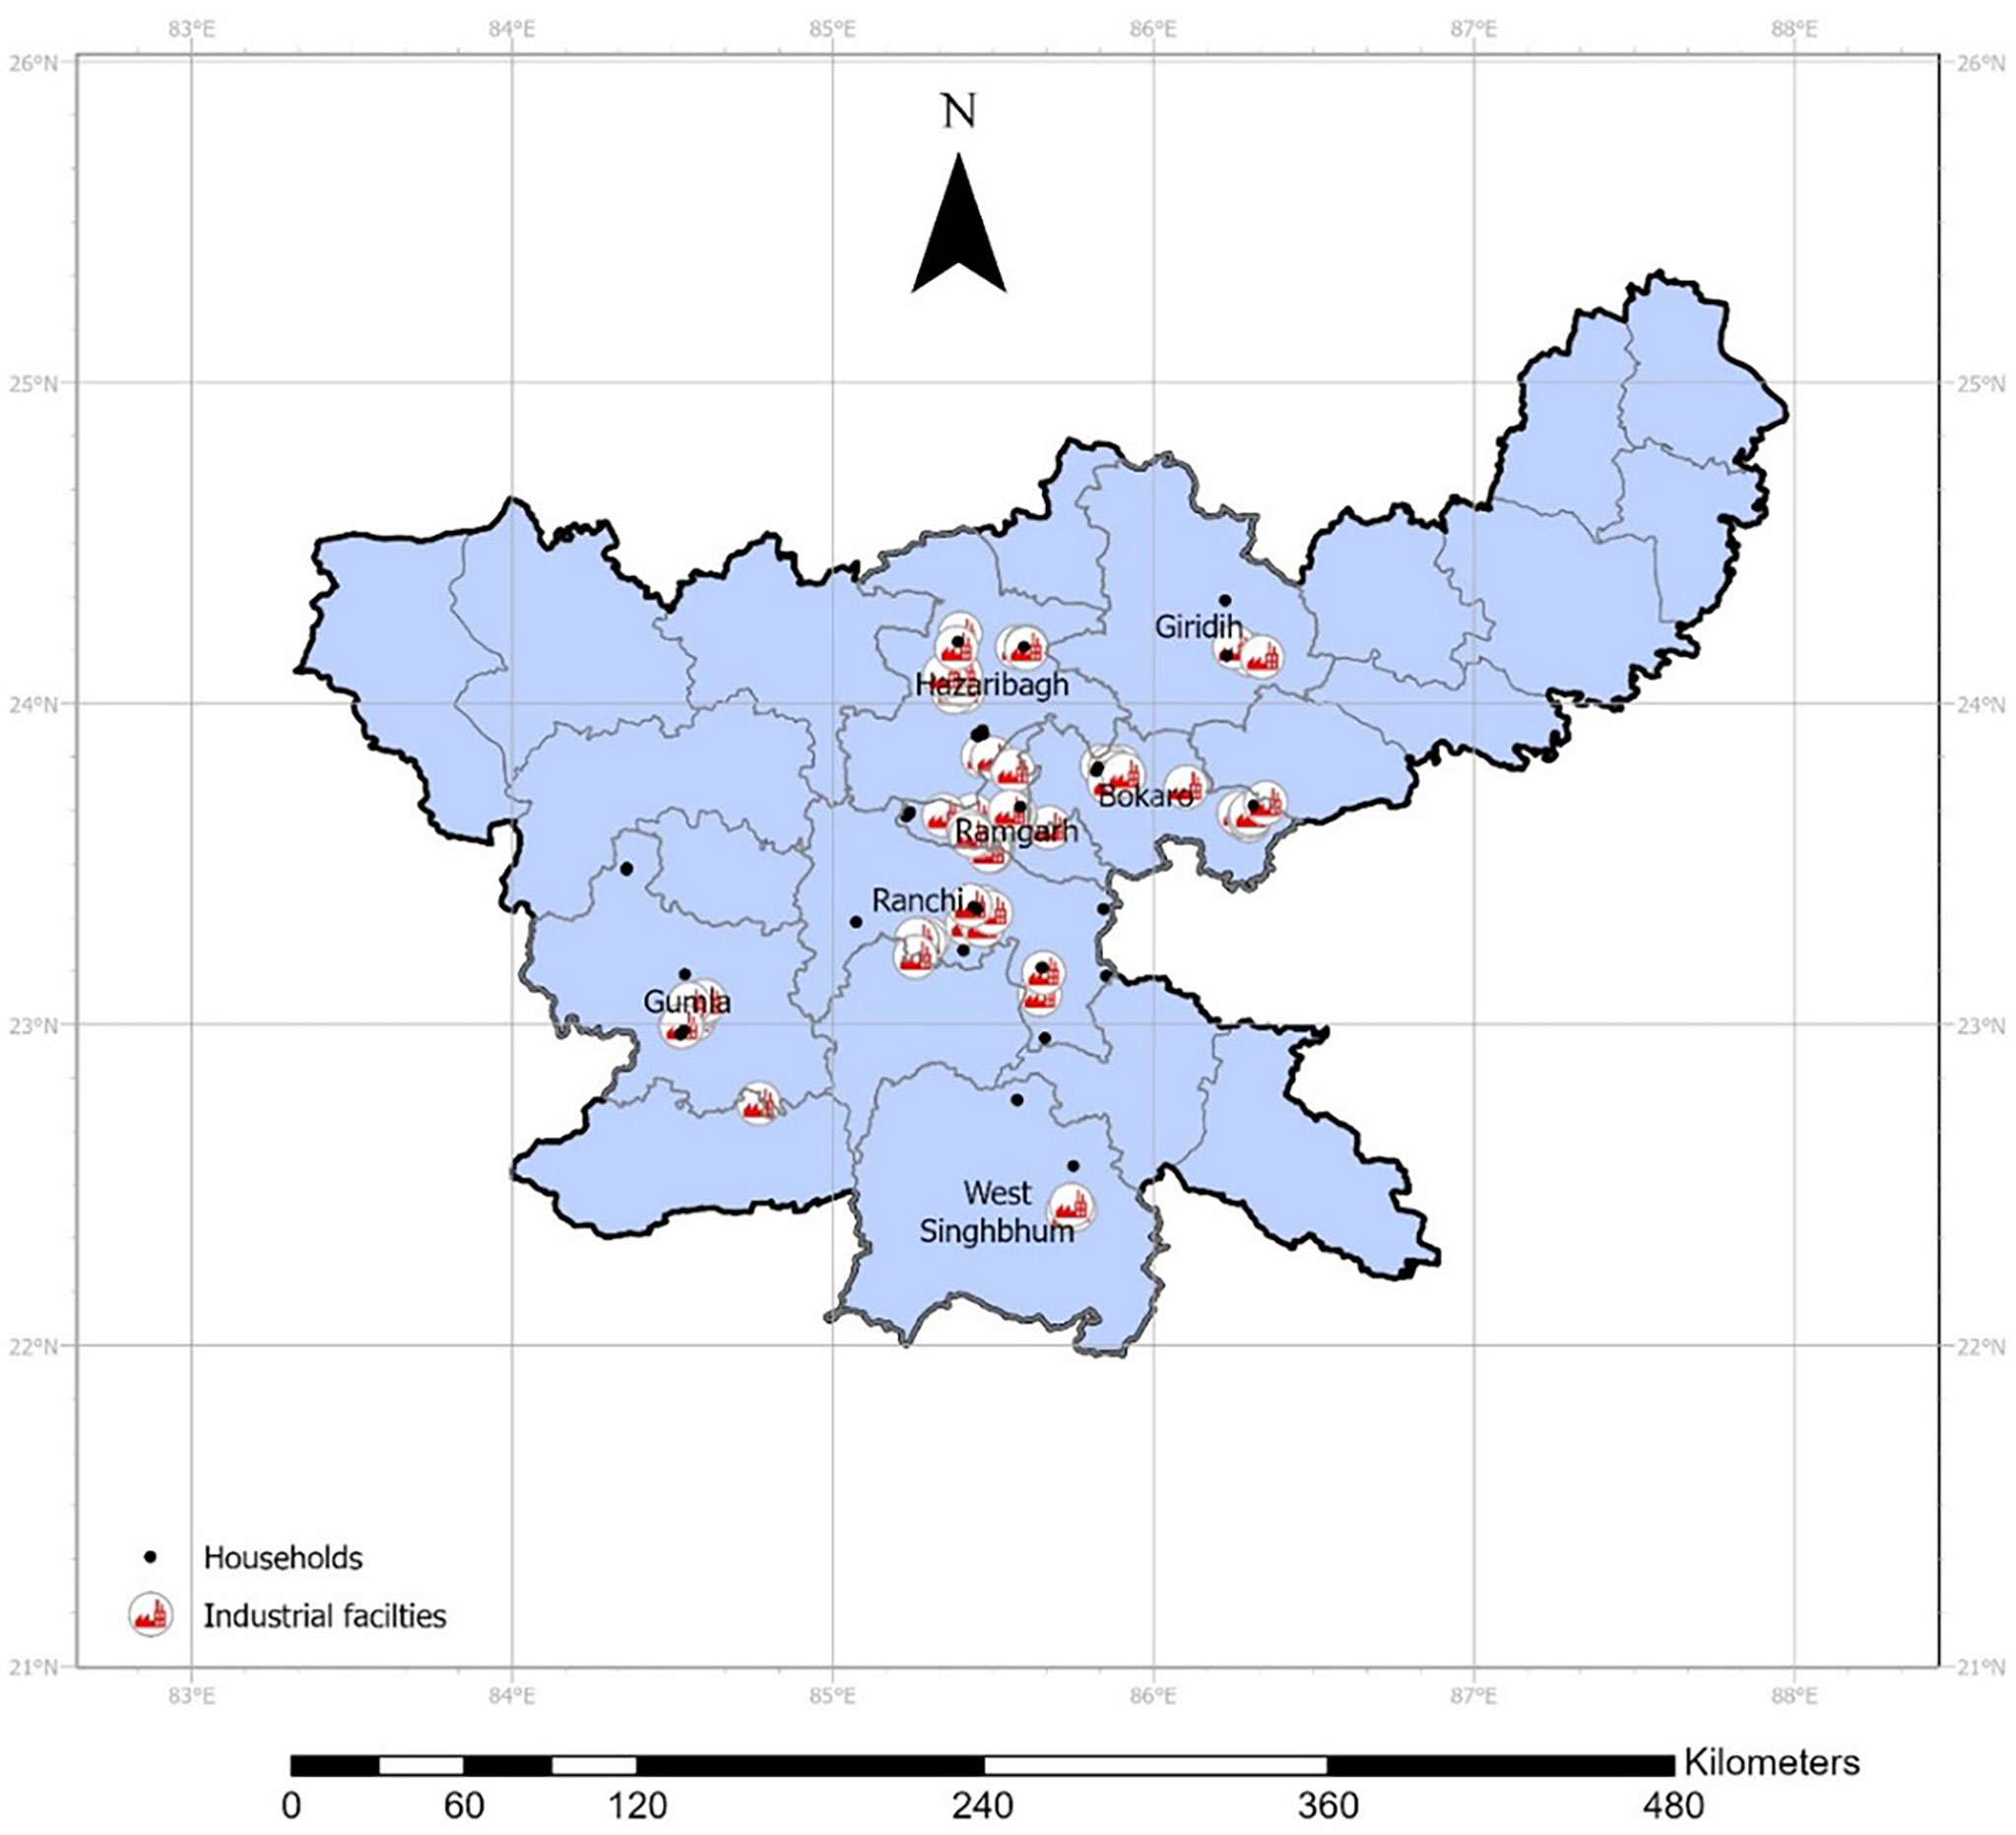
Figure 4 Point locations of households in our study area and surrounding industrial facilities.
Among textural groups, all soil micronutrients except Mn are significantly different, with the highest median concentrations found in medium-textured soils (Figure S1). The higher concentrations in medium-textured soils relative to the fine could be a manifestation of the ease of extraction of minerals in medium-textured soils compared to fine ones, the latter which are known to bind minerals stronger to their surfaces, rendering them relatively unavailable (44). On the other hand, coarse-textured soils have low nutrient retention and are subject to nutrient leaching. This relationship was also seen for soil toxic elements As, Ba, Cd and Sr except Pb, with the finer-textured soils having significantly higher concentrations than the coarse ones (Figure 5). In general, real differences in chemical composition across textural groups are a manifestation of geographical differences, i.e., district-level parent material (p=0.04, data not shown). Soil minerals did not appear to vary significantly by landscape position (middle vs. lowland), by source of irrigation or by log-distance to mines (data not shown). This was despite common knowledge that, in general, topography or soil movement from upslope to downslope is coupled with the downward movement of finer soil particles and their sorb constituents including micronutrients (45, 46). This result also did not capture that different water sources have different mineral composition (47), nor that the mining industry is a source of pollutants in soil (48). However, these relationships depend on context-specific factors and hence were not detected in our study.
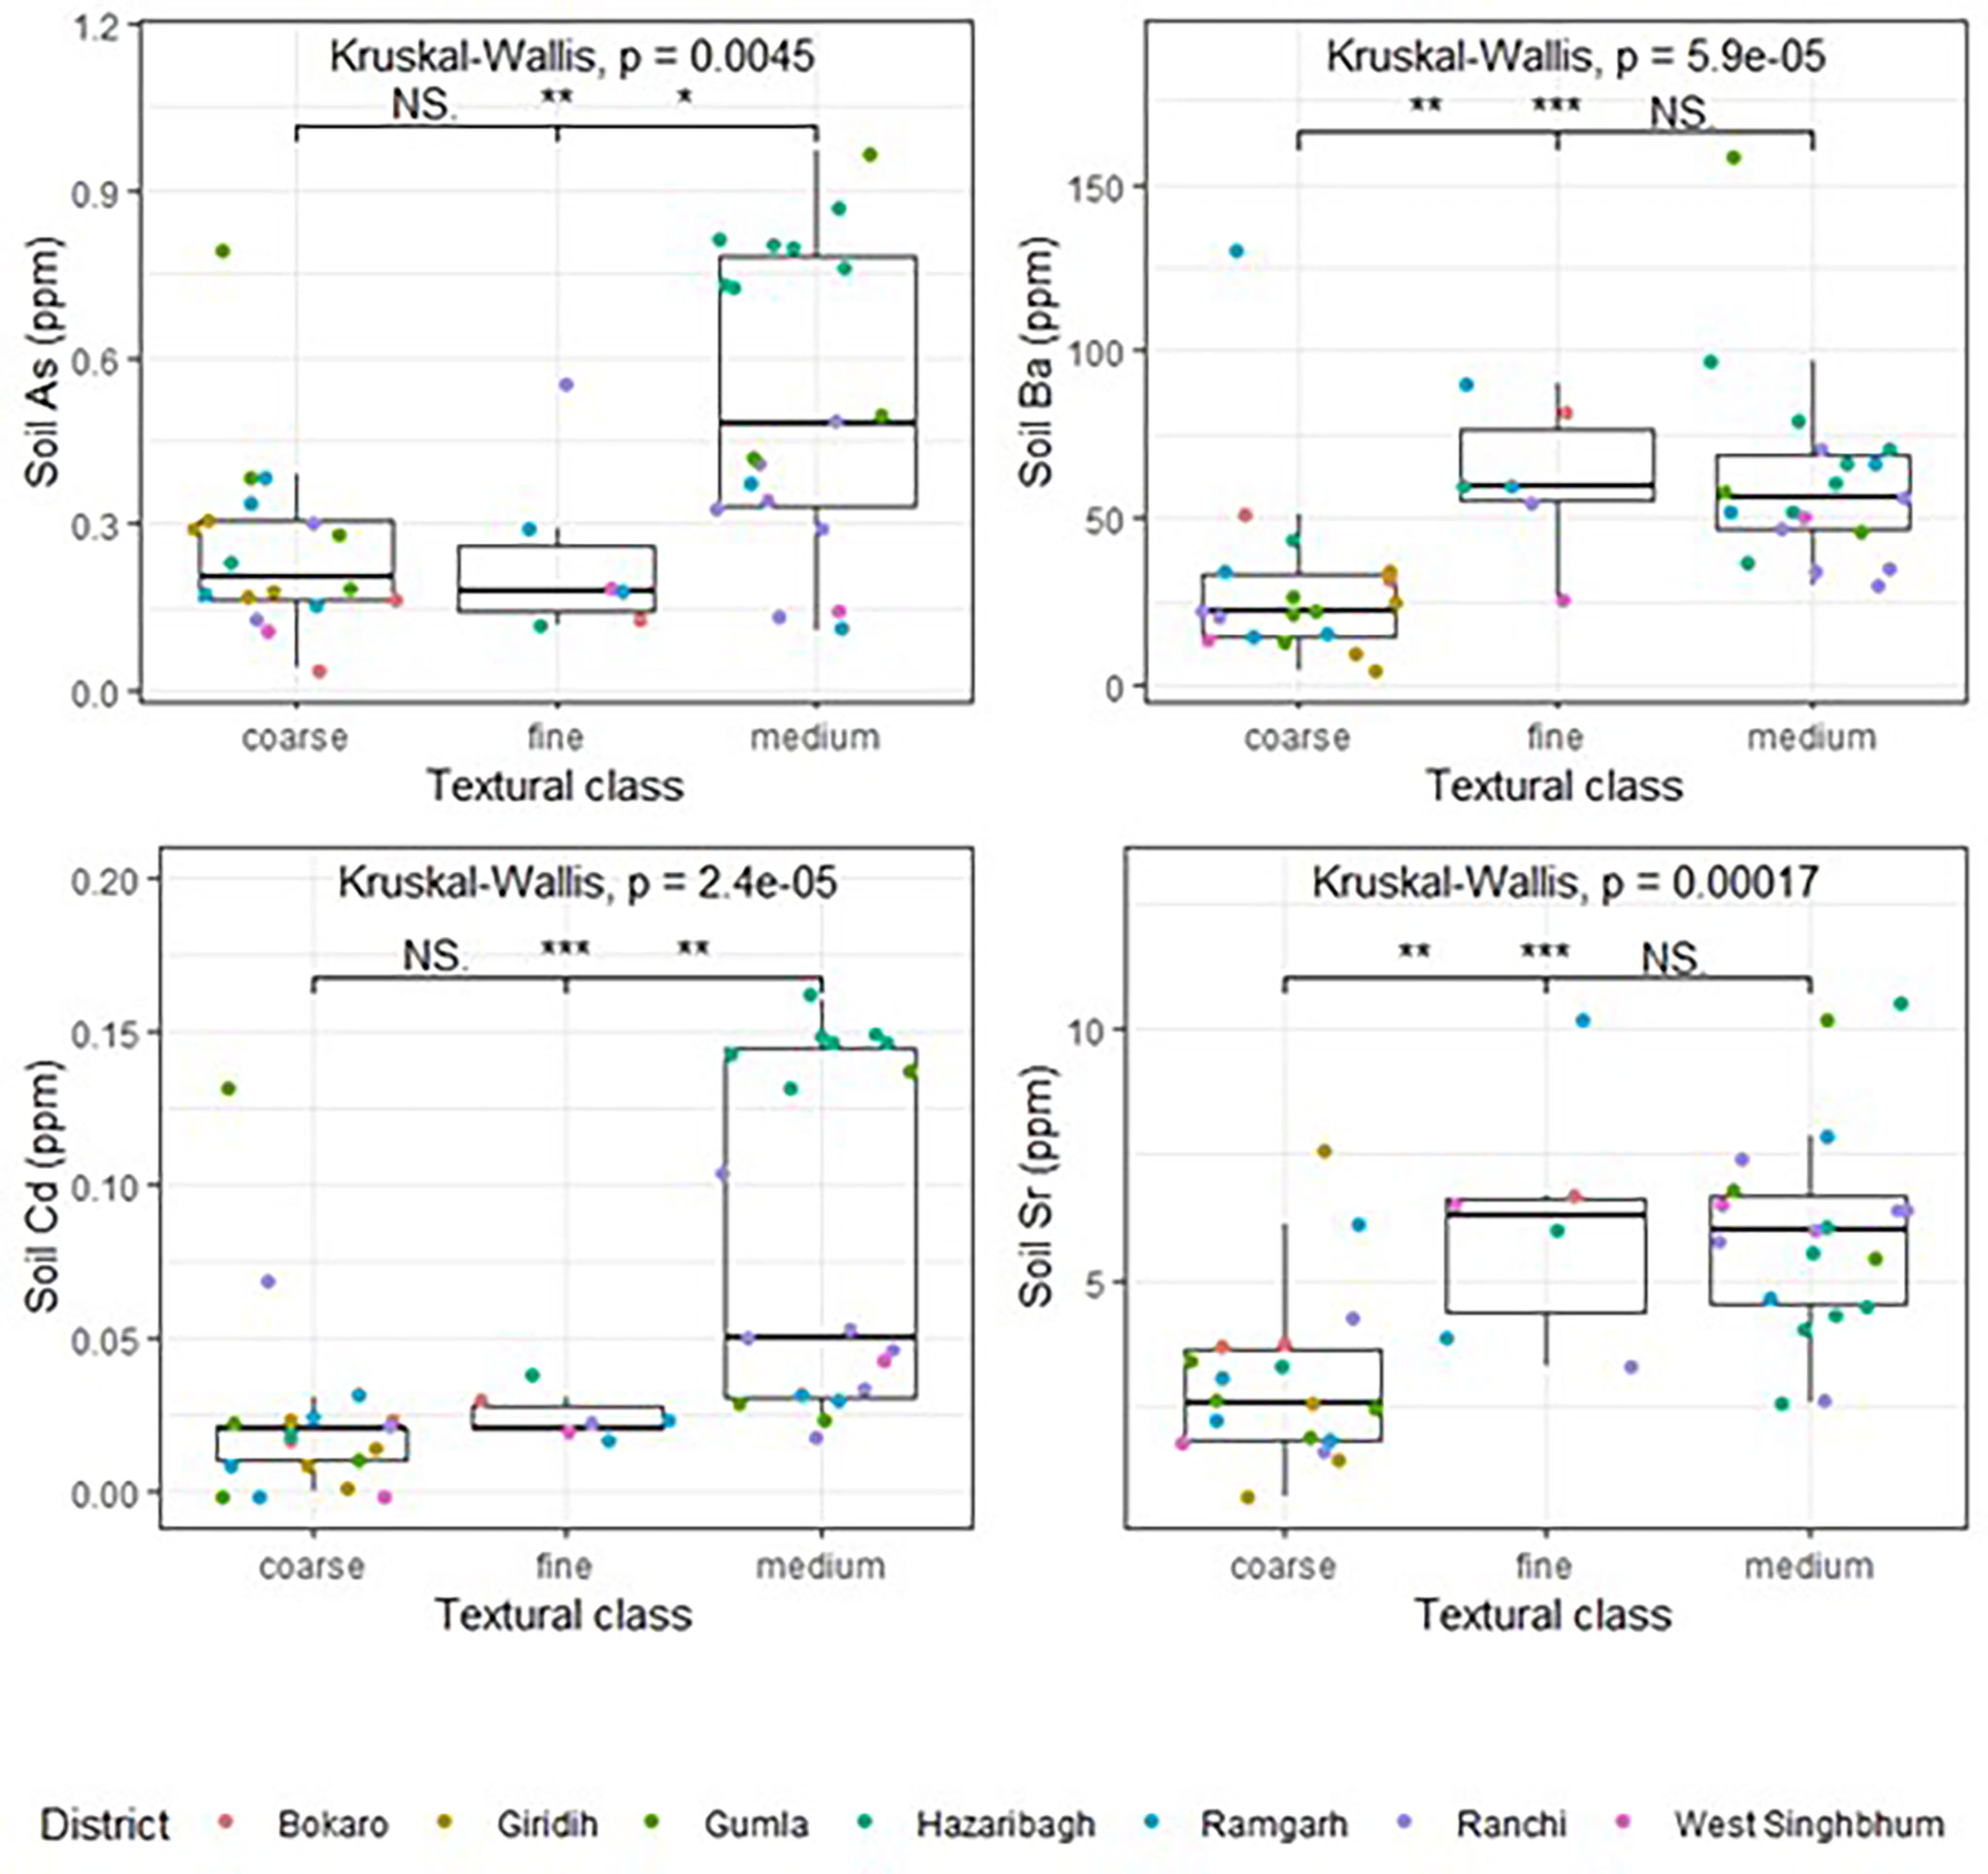
Figure 5 Soil toxin distribution among textural group. NS: not significant; * significant at the 0.05 significance level; ** significant at the 0.01 significance level; *** significant at the 0.001 significance level.
Rice
The Kruskal-Wallis one-way ANOVA test of rice mineral concentrations as a function of the surveyed geographic, demographic, agronomic and processing categorical variables showed that rice Fe concentrations were significantly different among rice variety types (p = 0.03; Figure 6), with the highest concentrations in traditional varieties followed by hybrids and then improved/modern varieties, which did not significantly vary across districts. This underscores the extent to which current food systems with their high-yielding varieties of staple crops may inadvertently disfavor nutrient contents, which would arguably exacerbate malnutrition (49).
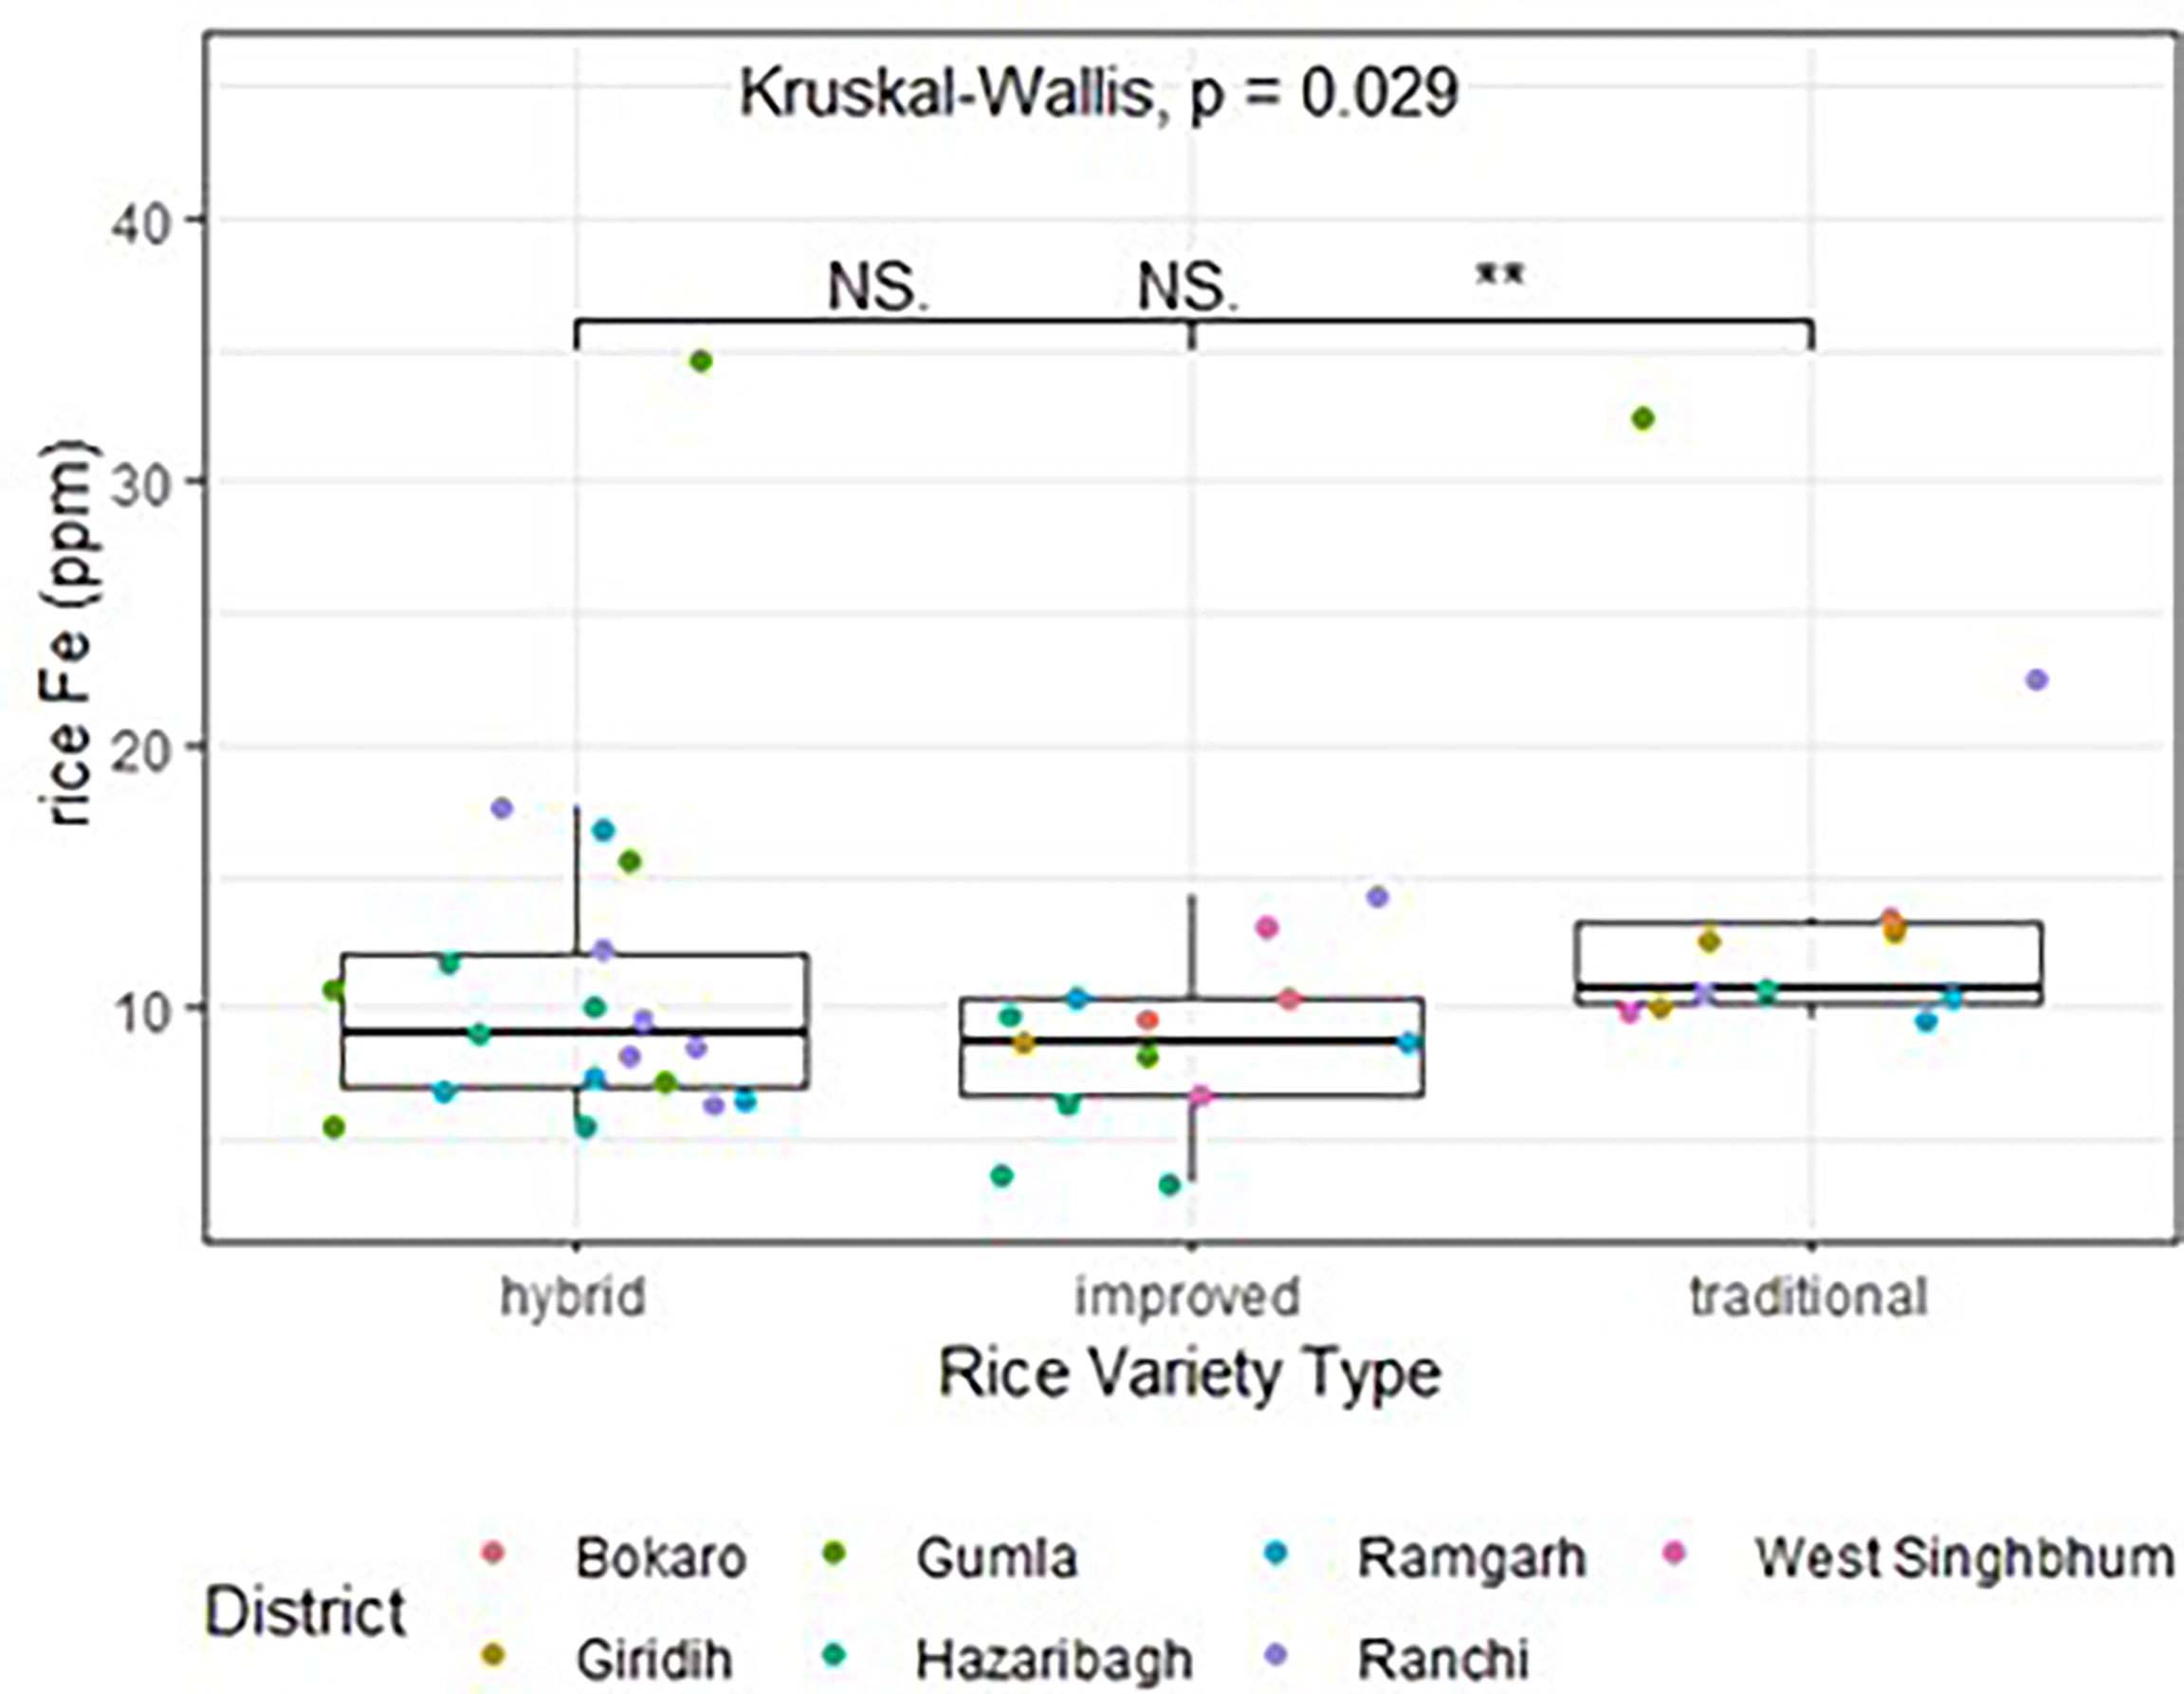
Figure 6 Rice Fe concentrations in hybrid, improved and traditional rice varieties. NS: not significant; * significant at the 0.05 significance level; ** significant at the 0.01 significance level; *** significant at the 0.001 significance level.
Between landscape positions, rice Cu concentrations in the middle position were significantly higher than in the lowland (p= 0.03; Figure 7). Cu concentrations and availability are known to decrease in flooded rice soils (50). As such, this finding may be a result of soil redox (Eh) effects driven by differences in local soil hydrology, where concentration and mobilization of Cu is low under reducing conditions while aerobic soils favor the release of Cu (51, 52). However, it is unclear why this same trend was not observed at the soil level. It may be due to the standardized laboratory procedure of processing and drying the soil samples to a specific temperature, which may not reflect field conditions in relation to mineral dynamics driven by redox.
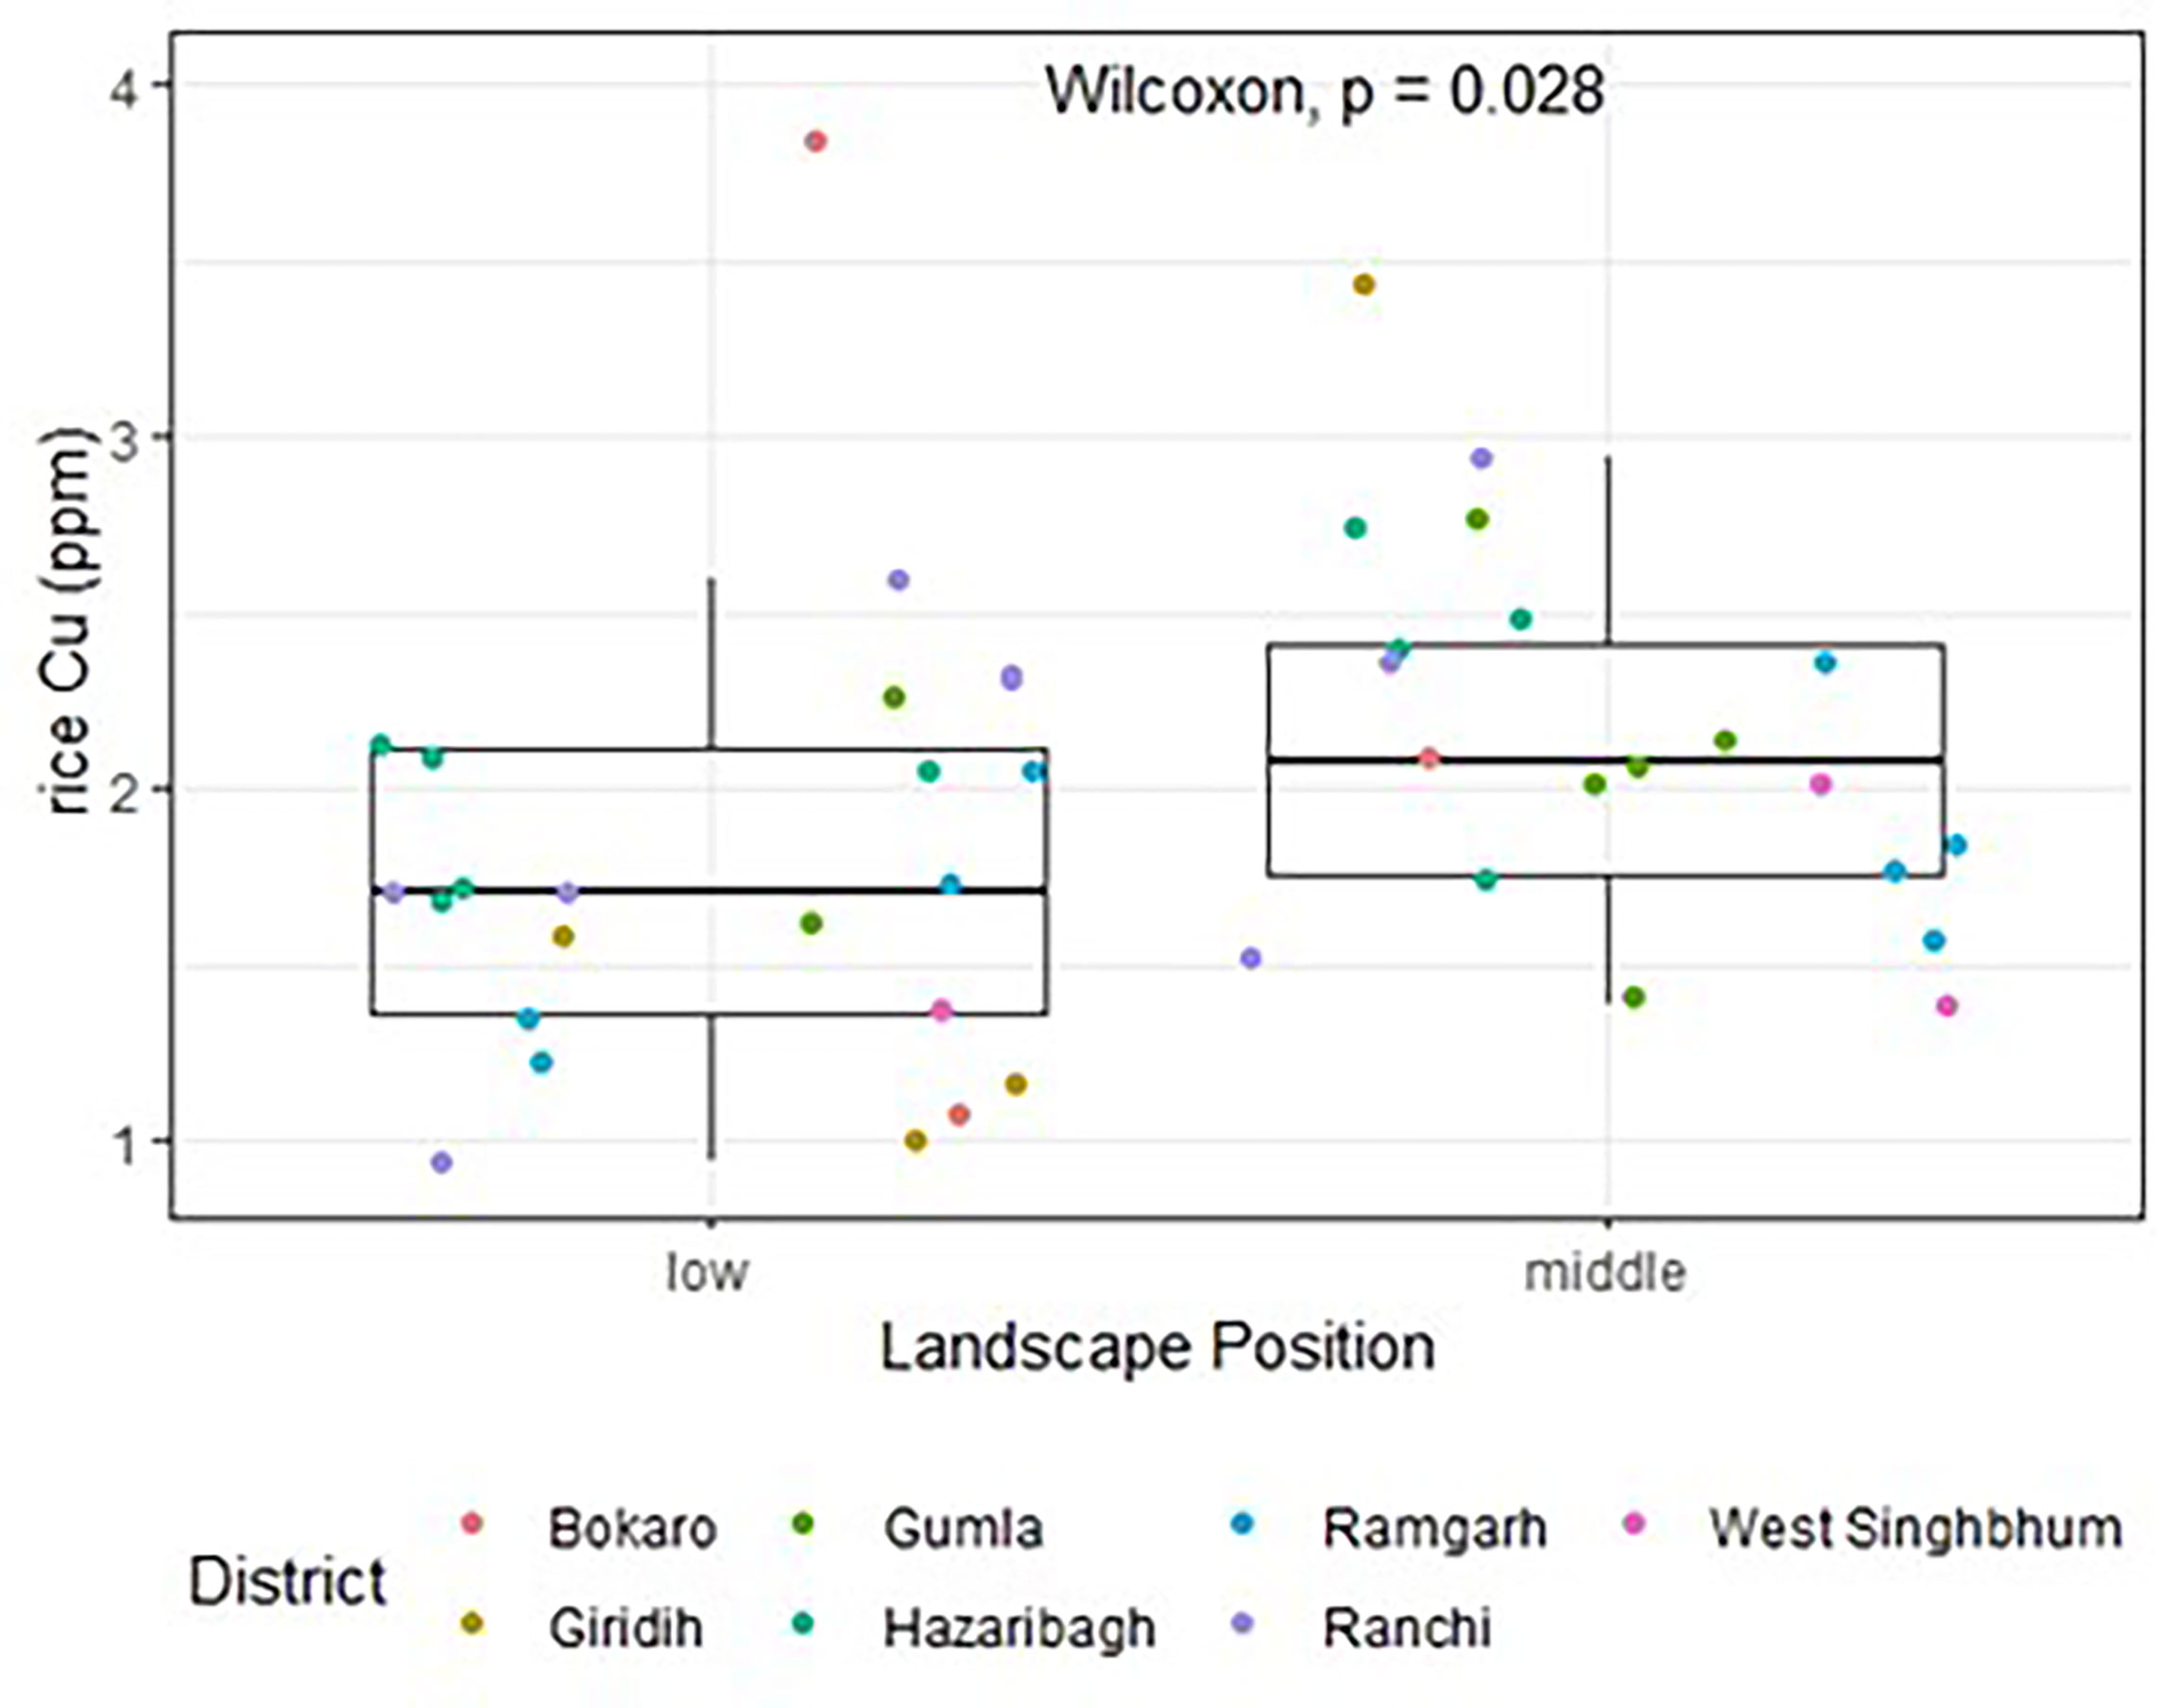
Figure 7 Rice Cu concentrations by landscape position.
Among textural classes, rice minerals Ba, Pb and Mn were statistically different (p= 0.00; p= 0.04 and p= 0.02, respectively; Figure 8). The medium-textured soils have the highest median Mn and Ba concentrations, while the coarse and fine have the highest median Pb concentrations. Given that this is in disagreement with soil mineral differences across textural classes (Figure S1), the relationships between rice mineral concentrations and soil texture are not analogous to those between soil mineral concentrations and soil texture. Conversely, high Cr and Ba concentrations in rice in Hazaribagh (p= 0.04 and p= 0.02, respectively; Figure 9) correspond with high Cr and Ba concentrations in soil (Figure 3). Rice Pb was significantly different among districts with the lowest median concentrations found in Hazaribagh and the highest in Giridih (p<0.01; ).
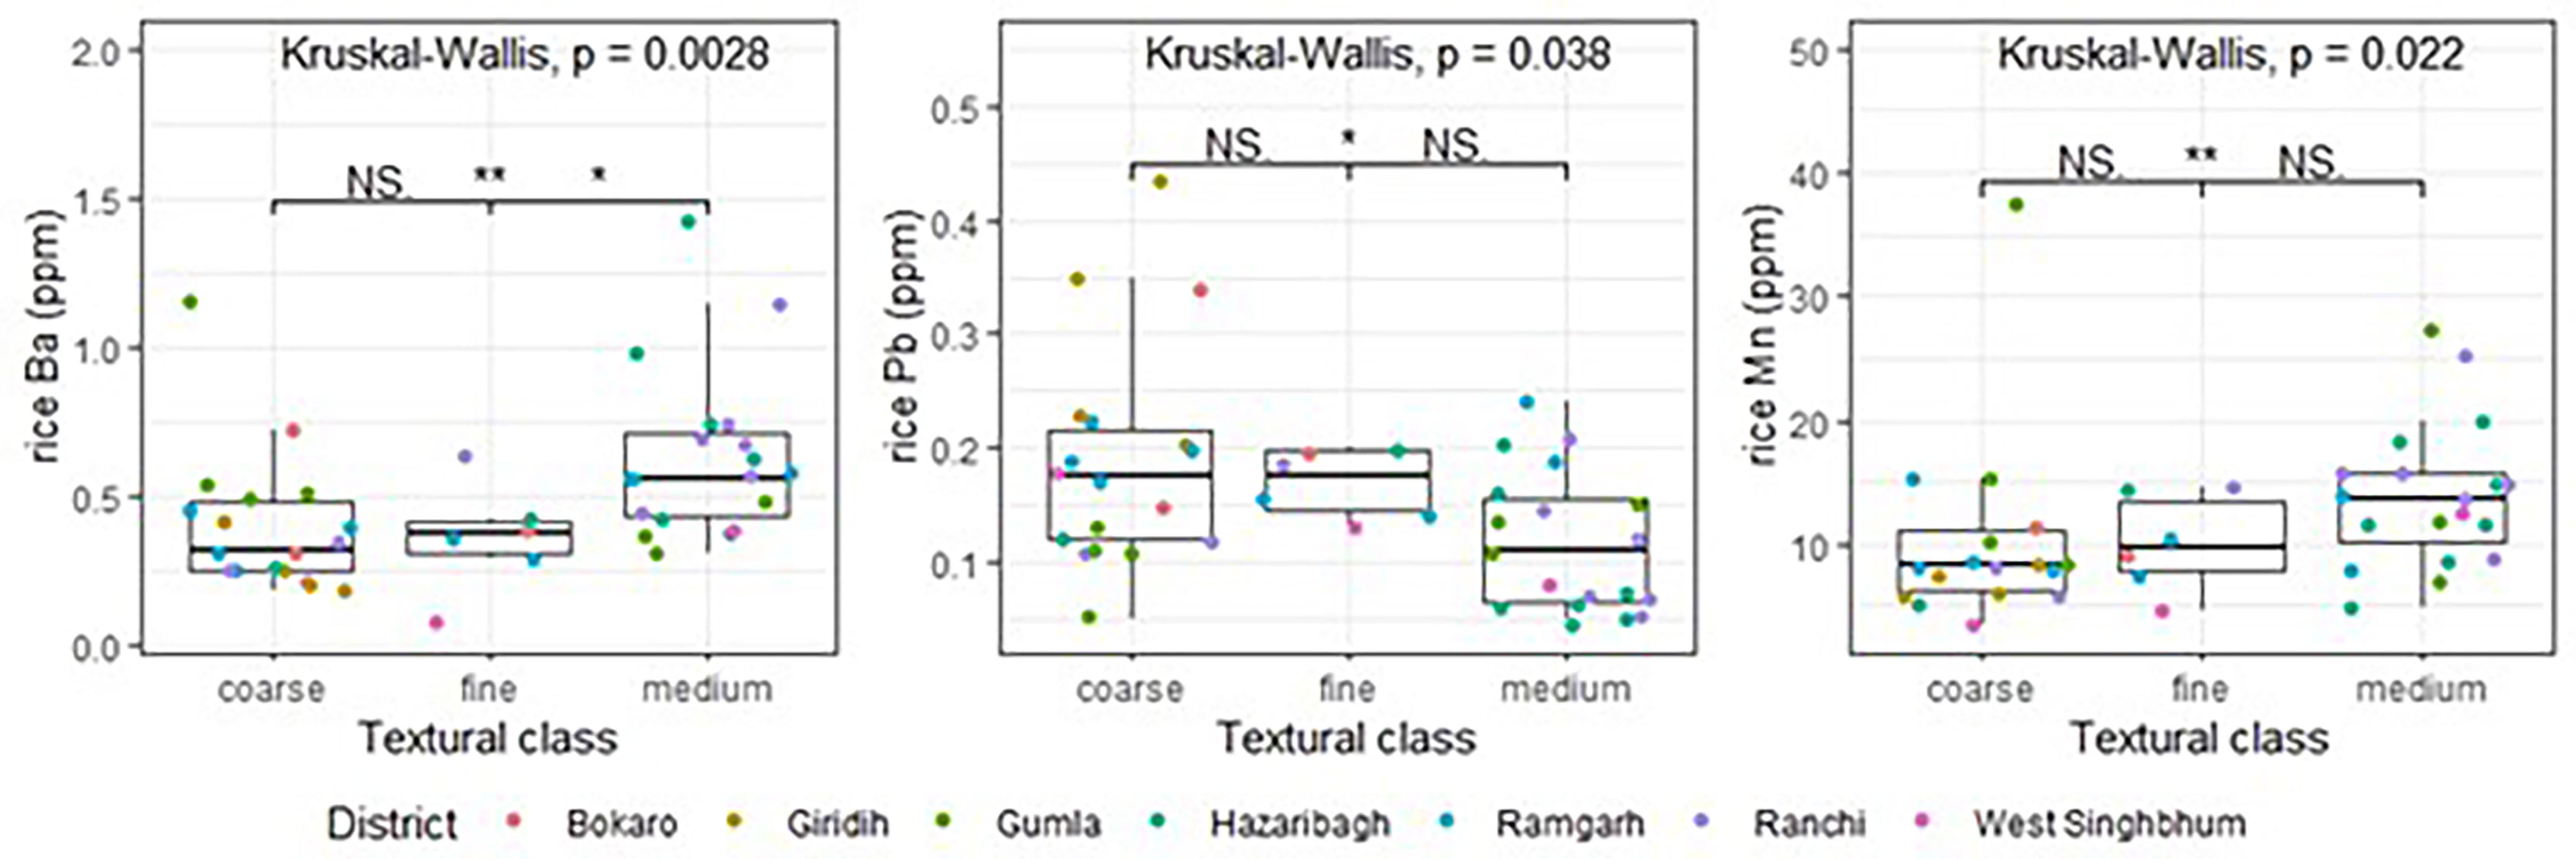
Figure 8 Rice Ba, Pb and Mn concentrations by textural class. NS, not significant; * significant at the 0.05 significance level; ** significant at the 0.01 significance level.
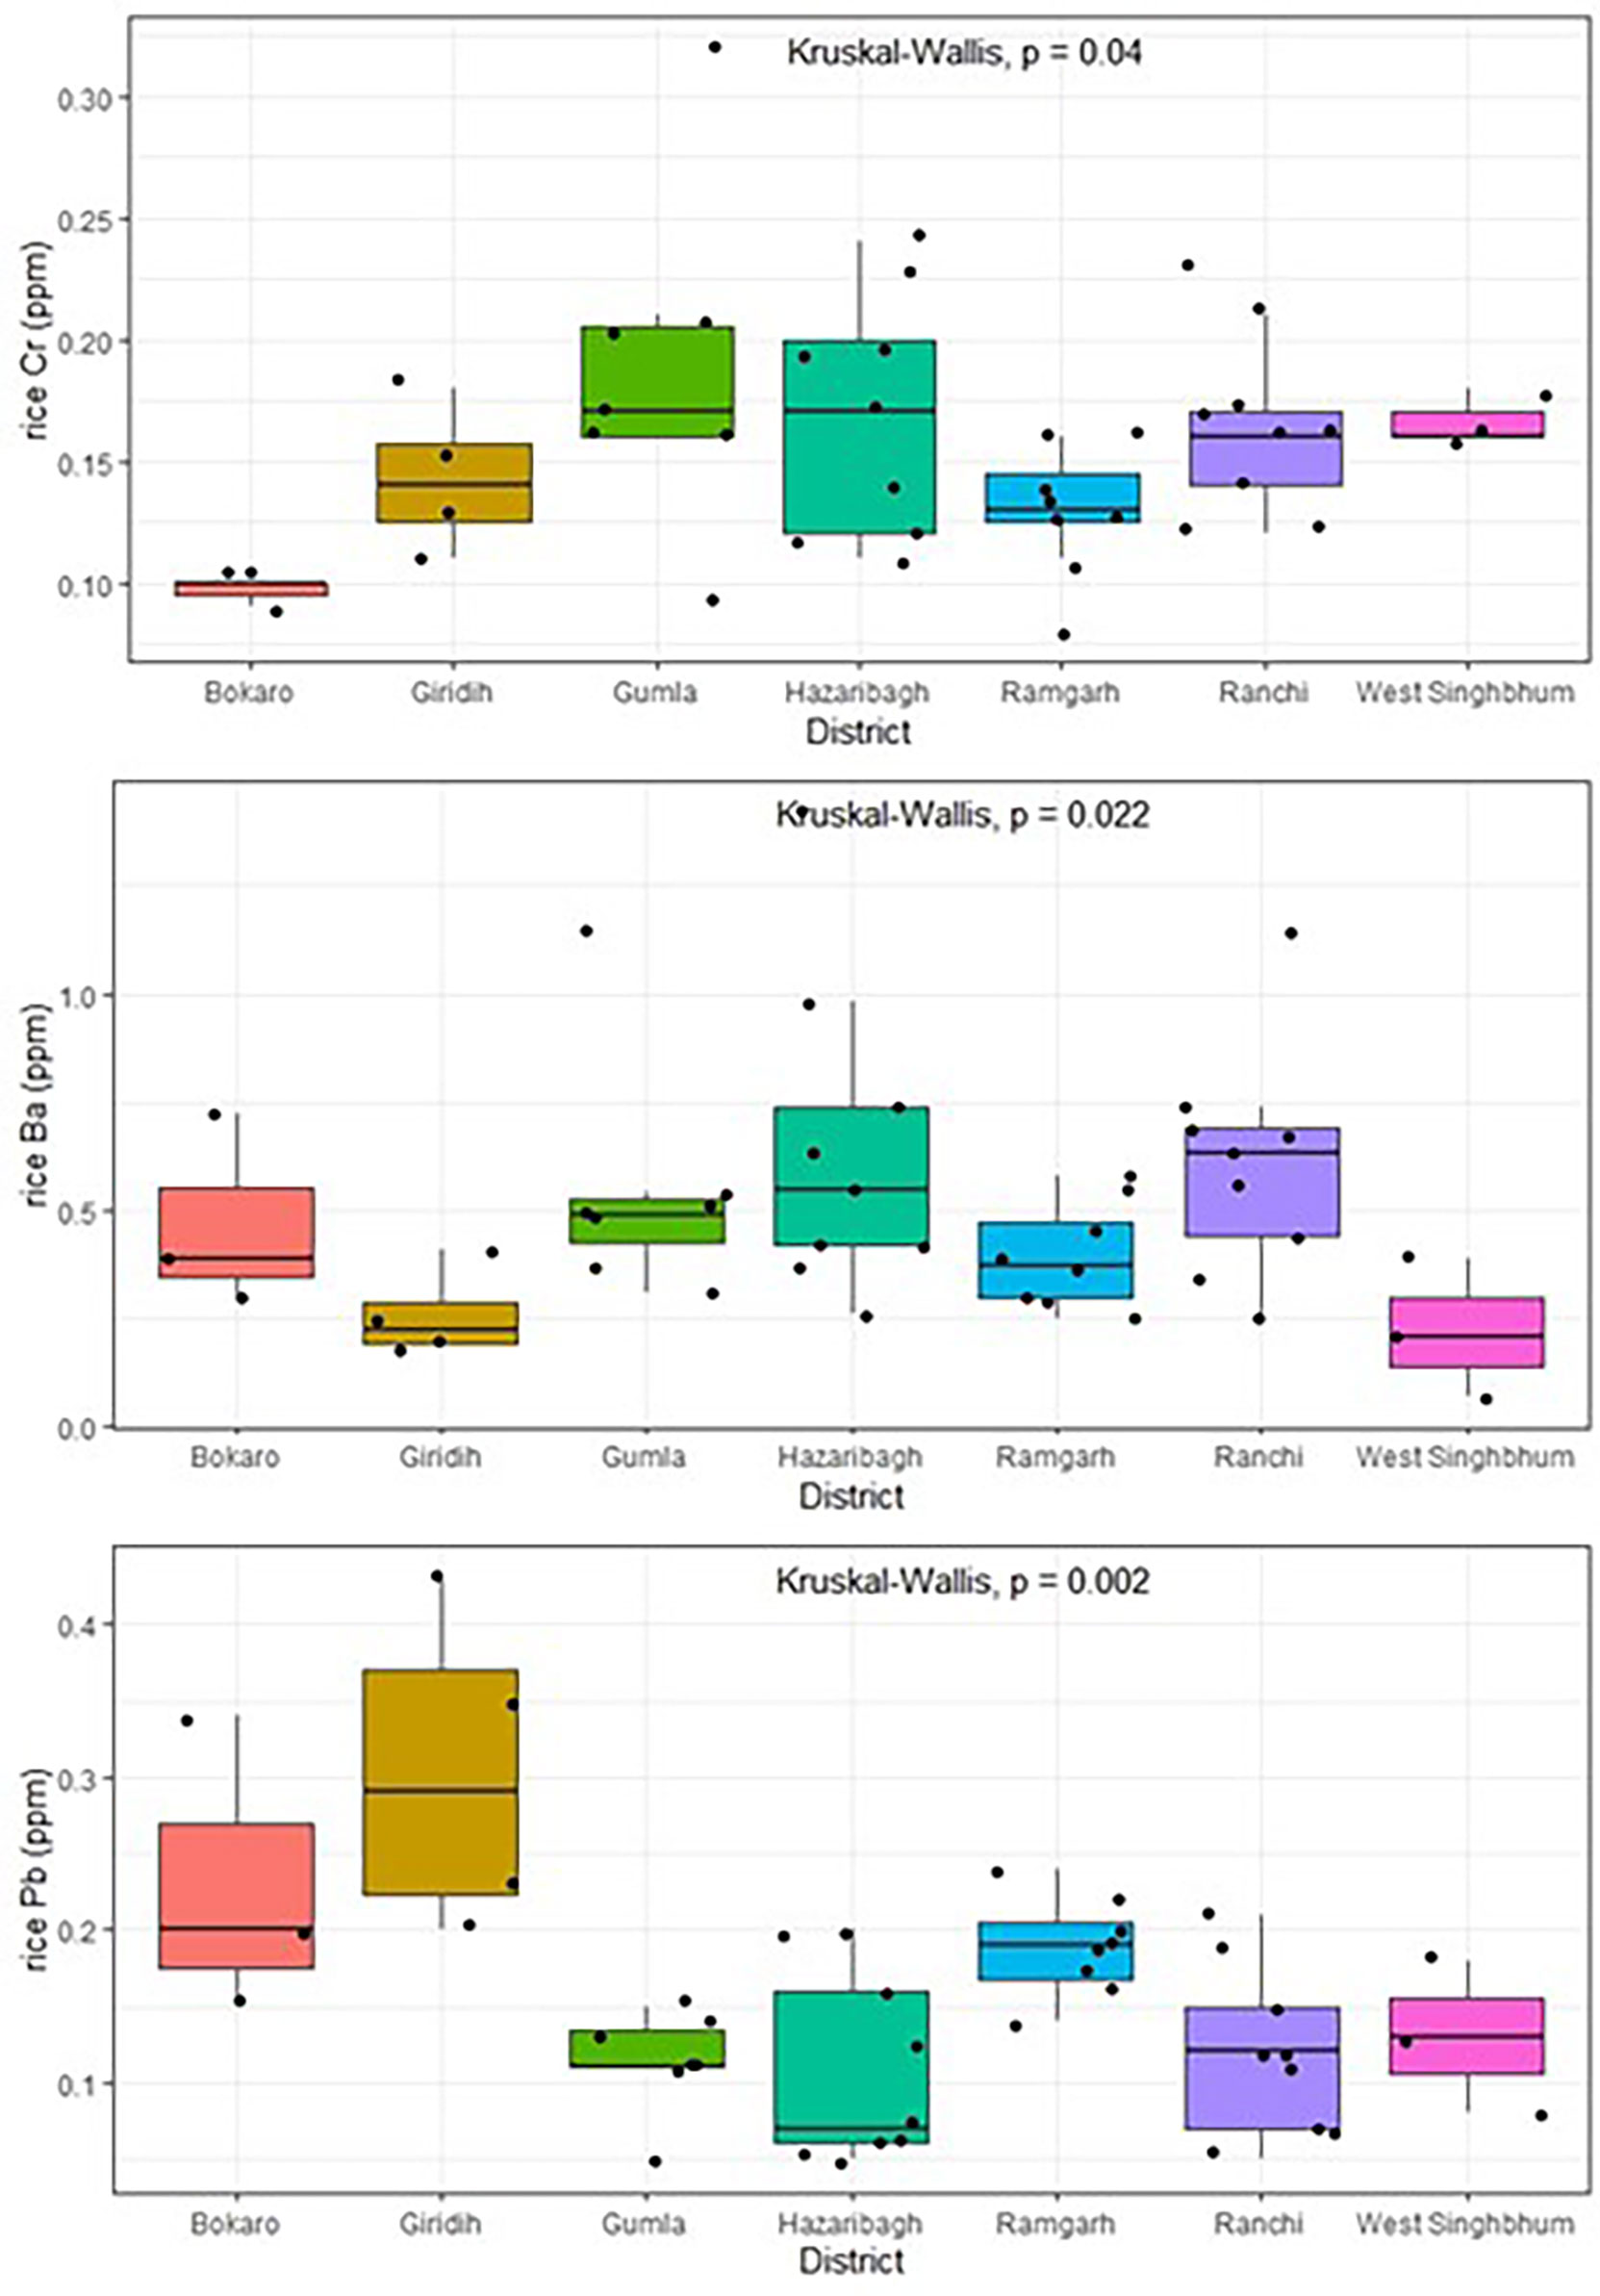
Figure 9 Rice mineral distribution across the seven districts in Jharkhand.
Rice Cr, Fe, Mn, Mo and phytate concentrations were linearly related to household distance to industrial facilities, specifically concentrations of Cr, Fe, Mn and phytate increased while Mo decreased with increasing distance (p<0.05; data not shown), which mostly argues against industrial contamination of rice. Finally, we could not detect any significant differences in minerals among the agronomic and processing methods, including crops grown, sources of irrigation, parboiling method, rice milling and storage (data not shown).
Hair
The Kruskal-Wallis one-way ANOVA test of hair mineral concentrations as a function of the surveyed geographic, demographic, agronomic and processing categorical variables showed that hair Cu and Zn were significantly different among rice variety groups with the highest median concentration being in the “improved” group, but this was driven by one outlier sample at [Zn] =1941.03 and [Cu] = 209.65 ppm (Figure S2). Hair toxic elements were also not significantly different among the groups (data not shown). Higher levels of Cd in hair were associated with cooking water from wells compared to other sources, which on the average was significant (p<0.01; Figure S3). There were no significant differences in these patterns among districts, but the presence of other confounding factors is possible.
In terms of rice cooking method, hair Mn was found to be significantly higher for the absorption group than the boil-and-drain group (p= 0.02; Figure S4), with no significant differences in this cooking practice among districts (data not shown). This is likely because the absorption cooking method retains more water-soluble vitamins, minerals, and starches in the rice compared to the boil-and-drain method (53).
Between the dyed versus non-dyed hair groups, Fe and Cr median concentrations are significantly higher in the non-dyed groups (p= 0.05 and p= 0.02, respectively; Figure S5), whereas Ba concentrations were higher in the dyed group. (This practice does not appear to vary across districts). Other studies have suggested differences in hair mineral concentrations between dyed versus non-dyed samples (54, 55), and as such these variables must be accounted for when assessing human health. Finally, we found no significant differences in hair minerals associated with districts, pregnancy/lactation, PDS vs. private fortified salt, between landscape positions or among textural classes (data not shown).
Using a linear regression model, factors like age, household size, years farming, fertilization duration, cut length and distance to industrial facilities did not significantly affect hair micronutrients Fe, Zn, Mn, Cu, V, nor toxins Cd, Pb, Ba and Sr. However, for hair Ni and Cr, fertilization duration (signifying land wealth) and number of years farming positively affect their concentrations (0.06 and 0.03 ppm increase in concentration, respectively, for every unit increase in the predictor variable (p= 0.02 for both; and 0.32, respectively). Hair cutting length additionally affected hair Cr concentration with a 0.01 estimate (p<0.01). These results suggest that a woman’s socioeconomic status, her level of farming experience and the hair sample length are significant factors in the concentration of some minerals in human hair.
Regularized Regressions
Comparing the two regularized models (ridge vs. lasso) of the soil predictors on the human health outcome variables revealed that ridge regression yielded the best model for human Zn, Fe, Cd and Pb, while lasso regression yielded the best model for human Ca (Table 2). To interpret the results, one must be cognizant that the magnitude of the effects generated by these regressions are diminished due to the bias-variance tradeoff discussed earlier. In an effort to explore the nature of these relationships, it may be more meaningful to interpret the signs of the relationships rather than their strength. In this regard, it was revealed that human Zn is most positively influenced by soil Fe; negatively influenced by soil Na, soil subsurface hardness (PR>45), and K; and positively influenced by Cd, in descending order of magnitude (Table 2). From a soil health perspective, this suggests that increasing soil subsurface compaction reduces human Zn level, possibly due to limited root growth, impeding the adequate uptake of Zn by plants, which translates to diminished supply to human consumers. Conversely, results from hair Fe regression reveal that human Fe is positively influenced by PR<15 and negatively influenced by soil K, Al, OM and Clay, in descending order of magnitude. The negative effect of both OM and clay appears counterintuitive considering that higher organic matter and clay contents is associated with higher Fe availability to plants (56, 57), so this negative relation could stem from the plant─human level. The relationship with surface compaction may be associated with soil puddling for flooding, which creates anaerobic conditions that mobilize Fe in the soil as it is reduced from Fe3 + to Fe2 + (58–60). For hair Ca, WAS was the strongest positive driver followed by protein, suggesting that better soil structure is an important determinant of human Ca concentrations, and that protein content in the soil – a measure of organic N – positively contributes to human Ca nutrition. Other mineral-mineral effects, including those of P, Cr and Sr, which are negative, could result from mineral interactions along the food chain beyond the scope of this study (61). Moreover, PR<15 was the strongest positive driver of hair Pb directly followed by OM ─ the strongest negative driver of hair Pb (Table 2). These results suggest that higher soil surface compaction increases human Pb toxicity possibly because it limits rooting to soil closer to the surface where it may be more concentrated. Higher soil OM is associated with lower human Pb concentrations, possibly through surface binding forces that renders Pb less available for uptake. Yet human Cd was shown to be positively influenced by AC ─ the labile portion of soil OM that is dynamic and important for mineral exchanges. It is difficult to explain this phenomenon, especially since such a relation has not been reported previously in the literature.
Rice P and Pb appear to be strong predictors of human hair mineral content. Rice P is the strongest and second strongest (negative) predictor of hair Zn and Fe, respectively, suggesting that higher macro-mineral contents in rice lead to lower micro-mineral concentration in humans. This antagonistic relationship is likely at the plant level due to the tradeoff between macro and micro minerals. Rice Pb on the other hand appeared to be the strongest (positive) predictor of hair Fe, Cd and Pb. These results suggest that human toxins Cd and Pb are highly associated with one another and that toxins at the plant level translate to the same and related toxins at the human level, including Fe.
Among the factorial predictors, hair grooming variables as well as agronomic ones consistently show up as important predictors of all studied hair mineral contents (Table 2). Specifically, shampoo hair detergent appears to be the strongest (positive), third strongest (positive) and third strongest (negative) factor affecting hair Zn, Ca and Pb, respectively, whereas shampoo+soap hair detergent is the second strongest (positive) predictor of hair Pb. Artificial hair dye additionally is an important factor with human hair mineral concentrations, and specifically the strongest (negative) and second strongest (negative) of hair Fe and Cd, respectively. These results corroborate that these practices exogenously alter the composition of hair and are therefore confounding factors in studies of human nutrition and toxic exposure via hair analysis.
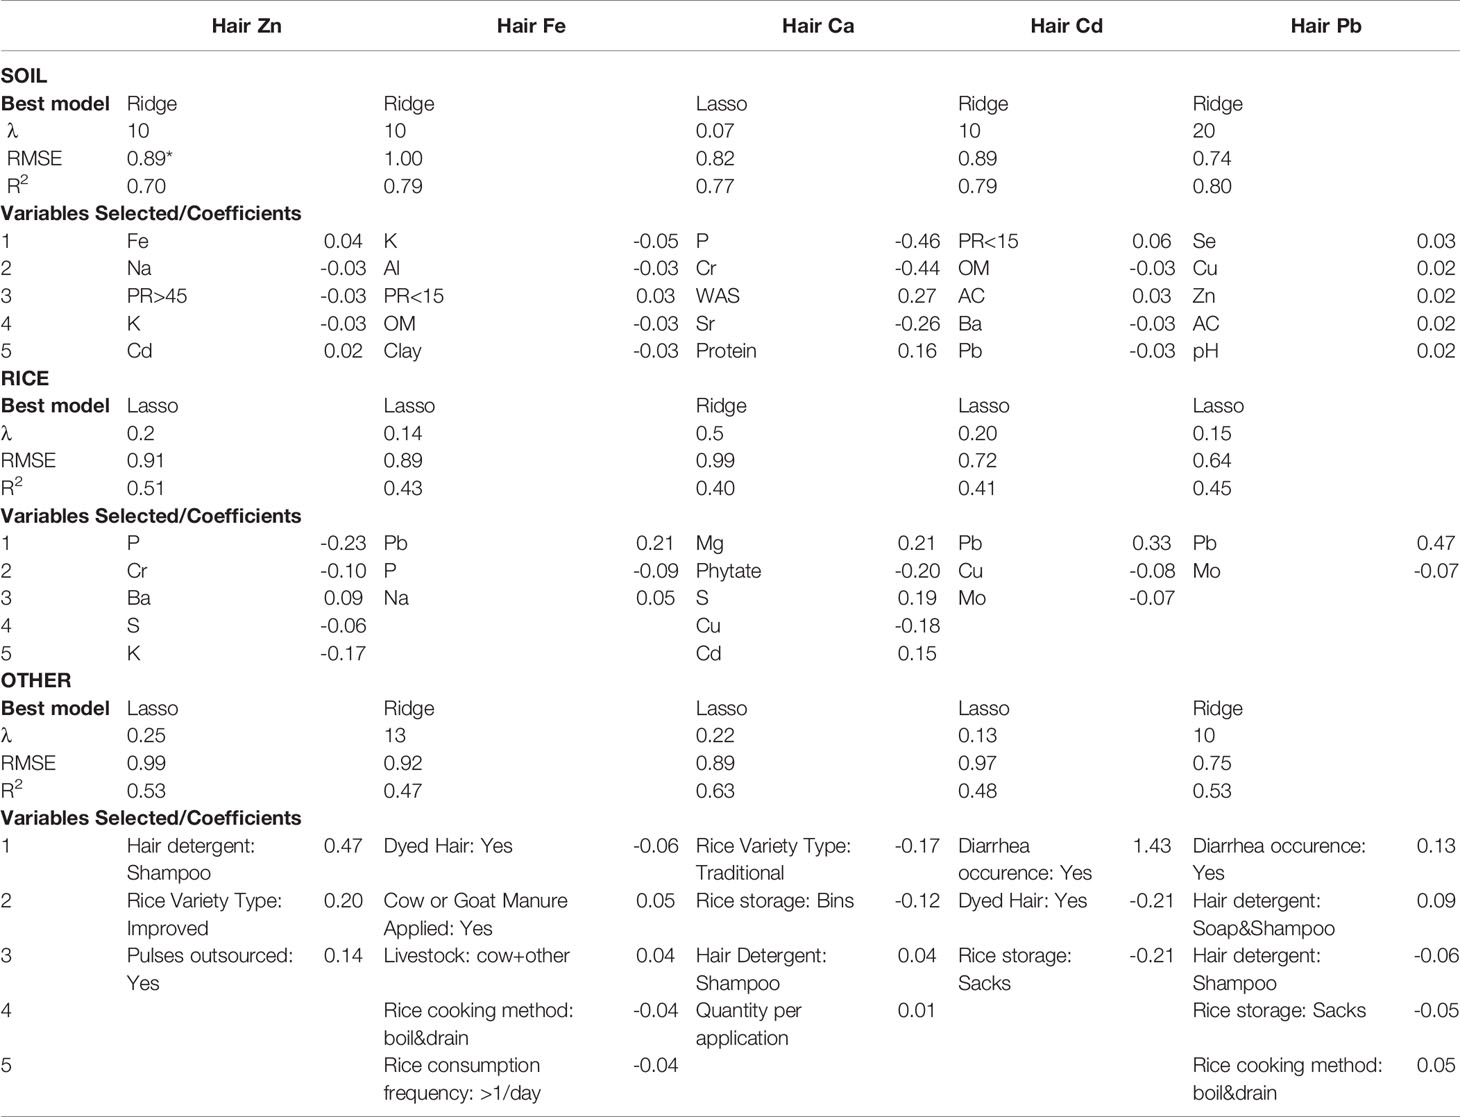
Table 2 The top five predictors in descending order of magnitude (1─5) of human hair Zn, Fe, Ca, Pb and Cd based on the best model comparison between the ridge and lasso regularized regression methods (data without outliers); λ signifies the penalty term where higher values indicate more underestimated coefficients.
In terms of agronomic and other practices, rice variety type appears to be an important predictor of human hair mineral content. Namely, improved rice varieties is the second strongest (positive) predictor of hair Zn while traditional varieties is the strongest (negative) predictor of hair Ca. Further, the boil and drain rice cooking method appears to be a strong negative factor with hair essential mineral Fe and a strong positive predictor of hair Cd, and rice storage, irrespective of container material, appears to be the second, third and fourth negative predictor of hair Ca, Cd and Pb, respectively. Lastly, diarrhea incidence – an event marked by severe nutrient losses coupled with susceptibility to toxicity – is the strongest (positive) driver of human Cd and Pb toxicity.
In general, however, the predictors form limited consistent patterns across the five different hair minerals and theoretical interpretations were not well confirmed.
Conclusions
This is a cross-sectional observational study on the effects of the geographic, environmental and socio-demographic factors as well as rice agronomic, processing, and cooking practices on the micro-mineral nutritional and toxicological status of women in the rural tribal villages of Jharkhand. We chose these subsistence farming communities because diets are primarily based on locally produced food stuffs with less potential for confounding effects from admixed foods from outside the study area. We found that minerals at all three levels ─soil, rice and hair─ differed significantly among categorical variables and are the result of a combination of natural and anthropogenic effects. These include geographical (differences in parent material, textural classes, etc.) and agronomic effects (livestock management) for soil-related variables; geographical, environmental (distance to industrial facilities) and agronomic (rice variety grown) effects for rice variables; and food preparation (rice cooking method, water sourced for cooking) and personal (farming experience, land wealth, grooming practices) effects for human hair. The regularized regression methods showed that many interlinkages exist between soil and humans through the rice crop intermediate, as well as between socio-demographics and human health, albeit complex and indirect. But in fact, it was difficult to establish consistent connections between soil health, food quality, and human health, even in a subsistence farming environment where most food is sourced locally. Significant effects of variables could in a few cases be causationally explained, but in other cases may have been the result of the multiple comparison problem because a multitude of variables were analyzed simultaneously. It may very well be that the underlying significant differences among groups are a fact of these attributes, and our results are therefore in line with other studies that were challenged to identify soil and human health connections. For the sake of future research, the current study’s shortcomings included a somewhat limited sample size (n=43), rice not sampled directly from the plots at harvest time to avoid admixing, and rice not being assessed from a bioavailability standpoint.
Data Availability Statement
The data supporting the conclusions of this article will be made available by the authors upon reasonable request to the corresponding author/s. Data that excludes personal information of respondents will be made available without undue reservation.
Ethics Statement
The study involving human participants was reviewed and approved by Cornell University IRB (Ithaca, NY, USA) and Ekjut IRB (Jharkhand, India). The participants provided their written informed consent to participate in this study.
Author Contributions
The research design and implementation as well as the survey writing and undertaking were done primarily by the lead author with the support and guidance of the co-author. The writing of the first draft was prepared by the lead author and revisions and restructuring of the final draft by the co-author. All authors contributed to the article and approved the submitted version.
Funding
This work was supported by the National Science Foundation Graduate Research Fellowship Program [Grant No. DGE-1650441]; and the Tata-Cornell Institute – for Agriculture and Nutrition.
Conflict of Interest
The authors declare that the research was conducted in the absence of any commercial or financial relationships that could be construed as a potential conflict of interest.
Publisher’s Note
All claims expressed in this article are solely those of the authors and do not necessarily represent those of their affiliated organizations, or those of the publisher, the editors and the reviewers. Any product that may be evaluated in this article, or claim that may be made by its manufacturer, is not guaranteed or endorsed by the publisher.
Acknowledgments
We are grateful for the internal reviewing of this paper provided by Dr. Prabhu Pingali and Dr. Peter Hobbs.
Supplementary Material
The Supplementary Material for this article can be found online at: https://www.frontiersin.org/articles/10.3389/fsoil.2022.901843/full#supplementary-material
References
1. Moebius-Clune BN, Moebius-Clune DJ, Gugino BK, Idowu OJ, Schindelbeck RR, Ristow AJ, et al. The Comprehensive Assessment of Soil Health. (2016). www.css.cornell.edu/extension/soil-health/manual.pdf
2. Daniels N. Variations in Coffee Processing and Their Impact on Quality and Consistency. Michigan Technological University. (2009) Available at: http://citeseerx.ist.psu.edu/viewdoc/download?doi=10.1.1.608.6348&rep=rep1&type=pdf.
3. Bevis LEM. Soil-To-Human Mineral Transmission With an Emphasis on Zinc, Selenium, and Iodine. Springer Sci Rev (2015) 3(1):77–96. doi: 10.1007/s40362-014-0026-y
4. Oliver MA, Gregory PJ. Soil, Food Security and Human Health: A Review. Eur J Soil Sci (2015) 66:257–276. doi: 10.1111/ejss.12216
5. Johnson CC, Ge X, Green KA, Liu X. Studies of Selenium Distribution in Soil , Grain , Drinking Water and Human Hair Samples From the Keshan Disease Belt of Zhangjiakou District , Hebei Province , China. (1996)
6. Shukla AK, Behera SK, Pakhre A, Chaudhari SK. Micronutrients in Soils, Plants, Animals and Humans. Indian J Fertil (2018) 14:30–54.
7. Kim K, Bevis L. Soils and South Asian Stunting: Low Soil Zinc Availability Drives Child Stunting in Nepal. (2019).
8. Mayer AMB, Latham MC, Duxbury JM, Hassan N, Frongillo EA. A Food-Based Approach to Improving Zinc Nutrition Through Increasing the Zinc Content of Rice in Bangladesh. J Hunger Environ Nutr (2007) 2:19–39. doi: 10.1080/19320240802077797
9. Nouri M, Chalian H, Bahman A, Mollahajian H, Ahmadi-Faghih Msc M, Fakheri H, et al. Nail Molybdenum and Zinc Contents in Populations With Low and Moderate Incidence of Esophageal Cancer. Arch Iran Med (2008) 11:392–6.
10. Ray SS, Das D, Ghosh T, Ghosh AK. The Levels of Zinc and Molybdenum in Hair and Food Grain in Areas of High and Low Incidence of Esophageal Cancer: A Comparative Study. Glob J Health Sci (2012) 4. doi: 10.5539/gjhs.v4n4p168
11. Lv J, Wang W, Krafft T, Li Y, Zhang F, Yuan F. Effects of Several Environmental Factors on Longevity and Health of the Human Population of Zhongxiang, Hubei, China. Biol Trace Elem Res (2011) 143(2):702–16. doi: 10.1007/s12011-010-8914-8
12. Zhao K, Zhang W, Zhou L, Liu X, Xu J, Huang P. Modeling Transfer of Heavy Metals in Soil-Rice System and Their Risk Assessment in Paddy Fields. Environ. Earth Sci (2009). doi: 10.1007/s12665-009-0049-x
13. SHI. Exploring the Relationship Between Soil Health and Food Nutritional Quality: A Summary of Research Literature(2022). Available at: https://soilhealthinstitute.org/wp-content/uploads/2021/06/SHI-Food-Nutritional-Study-2022-1.pdf?mc_cid=b5e4d8804a&mc_eid=22f6c1edb9.
15. Government of Jharkhand. District Survey Report of Minor Minerals Hazaribag District. (2016). Available at: https://hazaribag.nic.in/notice/district-survey-report-of-minor-minerals-hazaribag-district/
16. Rekik F, van Es HM. The Soil Health–Human Health Nexus: Mineral Thresholds, Interlinkages and Rice Systems in Jharkhand, India. In: Sparks DS, editor. Advances in Agronomy. Amsterdam, Netherlands: Elsevier (2021). p. 68–118.
17. Singh M. Micronutrient Nutritional Problems in Soils of India and Improvement for Human and Animal Health. Indian Journal of Fertilisers, (2009) 5(4), 11–56.
18. Ministry of Home Affairs. Annual Health Survey Report: A Report on Clinical, Anthropometric and Bio-Chemical Survey. (2014).
19. Nathan D, Dayal H. Resource Curse and Jharkhand. Econ Polit. Wkly (2009) 44(51):16–7. doi: 10.2307/25663908
20. Welch RM, Graham RD. A New Paradigm for World Agriculture: Meeting Human Needs: Productive, Sustainable, Nutritious. Field Crops Res (1999) 60:1–10. doi: 10.1016/S0378-4290(98)00129-41999
21. Welch RM. Harvesting Health: Agricultural Linkages for Improving Human Nutrition. Micronutr. South South East Asia Proc (2005), 9–10. Kathmandu: International Centre for Integrated Mountain Development.
22. Rocha–Villarreal V., Serna–Saldivar S. O., arcı́a–Lara S. Effects of Parboiling and Other Hydrothermal Treatments on the Physical, Functional, and Nutritional Properties of Rice and Other Cereals. Cereal Chem (2018) 95(1):79–91.
23. Rivero-Huguet M, Darre E. Determination of Total Strontium in Uruguayan Rice by Inductively Coupled Plasma Optical Emission Spectrometry (ICP-OES). ATOMIC SPECTROSCOPY-NORWALK CONNECTICUT- (2006) 27(3):80.
24. Ravindran V, Ravindran G, Sivalogan S. Total and Phytate Phosphorus Contents of Various Foods and Feedstuffs of Plant Origin. Food Chem (1994) 50(2):133–6. doi: 10.1016/0308-8146(94)90109-0
25. Rocha‐Villarreal V, Serna‐Saldivar SO, García‐Lara S. Effects of Parboiling and Other Hydrothermal Treatments on the Physical, Functional, and Nutritional Properties of Rice and Other Cereals. Cereal Chem (2018) 95(1):79–91. doi: 10.1002/cche.10010
26. Albarracín M, González RJ, Drago SR. Effect of Soaking Process on Nutrient Bio-Accessibility and Phytic Acid Content of Brown Rice Cultivar. LWT. - Food Sci Technol (2013) 53(1):76–80. doi: 10.1016/j.lwt.2013.01.029
27. Ferguson EL, Gibson RS, Opare-Obisaw C, Osei-Opare F, Stephen A, Lehrfeld J, et al. The Phytate, Nonstarch Polysaccharide, Zinc, Calcium, Copper, and Manganese Contents of 78 Locally Grown and Prepared African Foods. J Food Comp Anal (1993) 6:87–99. doi: 10.1006/jfca.1993.1010
28. Dharmaraj U., Malleshi NG. Changes in Carbohydrates, Proteins and Lipids of Finger Millet After Hydrothermal Processing. LWT-Food Science and Technology (2011) 44(7):1636–42.
29. Özkaya B, Turksoy S, Özkaya H, Duman B. Dephytinization of Wheat and Rice Brans by Hydrothermal Autoclaving Process and the Evaluation of Consequences for Dietary Fiber Content, Antioxidant Activity and Phenolics. Innovative Food Science & Emerging Technologies (2017) 39:209–15.
31. Teitzel JK, Bruce RC. Fertility Studies of Pasture Soils in the Wet Tropical Coast of Queensland 2.Granitic Soils. Aust J Exp Agric (1971) 11(48), 77–84. doi: 10.1071/EA9710077
32. Porder S, Ramachandran S. The Phosphorus Concentration of Common Rocks-a Potential Driver of Ecosystem P Status. Plant Soil (2013) 367(1–2):41–55. doi: 10.1007/s11104-012-1490-2
33. da Silva YJAB, do Nascimento CWA, van Straaten P, Biondi CM, de Souza Júnior VS, da Silva YJAB. Effect of I- and S-Type Granite Parent Material Mineralogy and Geochemistry on Soil Fertility: A Multivariate Statistical and Gis-Based Approach. Catena (2017) 149):64–72. doi: 10.1016/j.catena.2016.09.001
34. Ward D, Muller K, Shrader AM. Soil Fertility on Granite and Sedimentary Soils is Associated With Seasonal Differences in Foraging by Elephants. Plant Soil (2017) 413(1–2):73–81. doi: 10.1007/s11104-016-3067-y
35. Sahoo PR, Prasad J, Prakasam M, Singh S, Venkatesh AS. Orogenic Gold Mineralization in and Around Kundarkocha, East Singhbhum, Jharkhand. J Indian Acad Geosci (2010) 52:11–8.
36. Hengl T, De Jesus JM, Heuvelink GBM, Gonzalez MR, Kilibarda M, Blagotić A, et al. SoilGrids250m: Global Gridded Soil Information Based on Machine Learning. PloS One (2017). doi: 10.1371/journal.pone.0169748
37. Haldar AK, Srivastava R, Thampi CJ, Sarkar D, Singh DS, Sehgal J, et al. Soils of Bihar for Optimizing Land Use. NBSS. Publ. 50b. (Soils. India. Series). (1996) 1996):70.
38. Frost PSD, van Es HM, Rossiter DG, Hobbs PR, Pingali PL. Soil Health Characterization in Smallholder Agricultural Catchments in India. Appl Soil Ecol (2019) 138:171–80. doi: 10.1016/j.apsoil.2019.02.003
39. The Economic Times. Satellite-Based Monitoring in Place to Check Illegal Mining: Coal and Mines Minister. Energy (2019).
40. Dormann CF, Elith J, Bacher S, Buchmann C, Carl G, Carré G, et al. Collinearity: A Review of Methods to Deal With it and a Simulation Study Evaluating Their Performance. Ecography (2013) 36(1):27–46. doi: 10.1111/j.1600-0587.2012.07348.x
41. Hossain M, Jaim WMH, Paris TR, Hardy B. Adoption and Diffusion of Modern Rice Varieties in Bangladesh and Eastern India. Manila: International Rice Research Institute (2012).
42. MSU. MOLYBDENUM: An Essential Plant Micronutrient. (1981). Available at: www.css.cornell.edu/extension/soil-health/manual.pdf
43. Nicholson FA, Chambers BJ, Williams JR, Unwin RJ. Heavy Metal Contents of Livestock Feeds and Animal Manures in England and Wales. Biores. Technol (1999) 70(1):23–31. doi: 10.1016/S0960-8524(99)00017-6
44. Qian J, Shan XQ, Wang ZJ, Tu Q. Distribution and Plant Availability of Heavy Metals in Different Particle-Size Fractions of Soil. Sci Tot Environ (1996) 187(2). doi: 10.1016/0048-9697(96)05134-0
45. Berhe AA, Arnold C, Stacy E, Lever R, McCorkle E, Araya SN. Soil Erosion Controls on Biogeochemical Cycling of Carbon and Nitrogen. Nat Educ Knowledge. (2014) 5(8):2.
46. Bashagaluke JB, Logah V, Opoku A, Sarkodie-Addo J, Quansah C. Soil Nutrient Loss Through Erosion: Impact of Different Cropping Systems and Soil Amendments in Ghana. PloS One (2018) 13(12). doi: 10.1371/journal.pone.0208250
47. Lau OW, Luk SF. A Survey on the Composition of Mineral Water and Identification of Natural Mineral Water. Inter J Food Sci Tecnol, (2002) 37(3):309–17. doi: 10.1046/j.1365-2621.2002.00571.x
48. Asami T. Soil Pollution by Metals From Mining and Smelting Activities. In: Chemistry and Biology of Solid Waste Springer, Berlin, Heidelberg. (1988). 143–169.
49. Pingali P, Mittra B, Rahman A. The Bumpy Road From Food to Nutrition Security – Slow Evolution of India’s Food Policy. Global Food Secur (2017) 15:77–84. doi: 10.1016/j.gfs.2017.05.002
50. Fageria, N. K., Carvalho, G. D., Santos, A. B., Ferreira, E. P. B., Knupp, A. M. (2011). Chemistry of lowland rice soils and nutrient availability. Communications in Soil Science and Plant Analysis, 42(16), 1913-1933. Fageria NK, Carvalho GD, Santos AB, Ferreira EPB, Knupp AM. Chemistry of Lowland Rice Soils and Nutrient Availability. Communications in Soil Science and Plant Analysis, (2011) 42(16):1913–33. doi: 10.1080/00103624.2011.591467
51. Frohne T, Rinklebe J, Diaz-Bone RA, Du Laing G. Controlled Variation of Redox Conditions in a Floodplain Soil: Impact on Metal Mobilization and Biomethylation of Arsenic and Antimony. Geoderma (2011) 160(3–4):414–24. doi: 10.1016/j.geoderma.2010.10.012
52. Shaheen SM, Frohne T, White JR, DeLaune RD, Rinklebe J. Redox-Induced Mobilization of Copper, Selenium, and Zinc in Deltaic Soils Originating From Mississippi (U.S.A.) and Nile (Egypt) River Deltas: A Better Understanding of Biogeochemical Processes for Safe Environmental Management. J Environ Manage (2017) 186(Pt 2):131–40.
53. FAO. Chapter 5: Rice Post-Harvest Processing, Parboiling and Home Preparation. In: Rice in Human Nutrition. Rome: FAO (1993).
54. McKenzie JM. Alteration of the Zinc and Copper Concentration of Hair. Am J Clin Nutr (1978) 31(3):470–6. doi: 10.1093/ajcn/31.3.470
55. Chojnacka K, Michalak I, Zielińska A, Górecki H. Assessment of the Exposure to Elements From Silver Jewelry by Hair Mineral Analysis. Arch Environ Contaminat. Toxicol (2011) 61(3):512–20. doi: 10.1007/s00244-011-9647-1
56. Schulte EE. Understanding Plant Nutrients Soil and Applied Iron (2004). Available at: http://corn.agronomy.wisc.edu/Management/pdfs/a3554.pdf.
57. Mielki GF, Novais RF, Ker JC, Vergütz L, de Castro GF. Iron Availability in Tropical Soils and Iron Uptake by Plants. Rev Bras Ciec Do Solo (2016) 40. doi: 10.1590/18069657rbcs20150174
58. De Mello JWV, Barrón V, Torrent J. Phosphorus and Iron Mobilization in Flooded Soils From Brazil. Soil Sci (1998) 163(2):122–32. doi: 10.1097/00010694-199802000-00006
59. Szilas CP, Borggaard OK, Hansen HCB, Rauer J. Potential Iron and Phosphate Mobilization During Flooding of Soil Material. Wat Air Soil Pollut 1998 (1998) 106(1):97–109. doi: 10.1023/A:1004965631574
60. Maranguit D, Guillaume T, Kuzyakov Y. Effects of Flooding on Phosphorus and Iron Mobilization in Highly Weathered Soils Under Different Land-Use Types: Short-Term Effects and Mechanisms. CATENA (2017) 158:161–70. doi: 10.1016/j.catena.2017.06.023
Keywords: soil health─human health nexus, mineral interlinkages, micronutrients, nutrient transmission, subsistence diets, bioavailability, multivariate analysis
Citation: Rekik F and van Es HM (2022) Soils and Human Health: Connections Between Geo-Environmental, Socio-Demographic, and Lifestyle factors and Nutrition of Tribal Women of Jharkhand, India. Front. Soil Sci. 2:901843. doi: 10.3389/fsoil.2022.901843
Received: 22 March 2022; Accepted: 13 June 2022;
Published: 07 July 2022.
Edited by:
Linda S Lee, Purdue University, United StatesReviewed by:
Dinesh Panday, The University of Tennessee, United StatesFathy Elbehiry, Kafrelsheikh University, Egypt
Copyright © 2022 Rekik and van Es. This is an open-access article distributed under the terms of the Creative Commons Attribution License (CC BY). The use, distribution or reproduction in other forums is permitted, provided the original author(s) and the copyright owner(s) are credited and that the original publication in this journal is cited, in accordance with accepted academic practice. No use, distribution or reproduction is permitted which does not comply with these terms.
*Correspondence: Fatma Rekik, ZnIyMzVAY29ybmVsbC5lZHU=