 Stephen K. Formel1
 Allyson M. Martin1
 John H. Pardue2
 Vijaikrishnah Elango2
 Kristina Johnson2
 Claudia K. Gunsch3
 Emilie Lefèvre3
 Paige M. Varner3Yeon Ji Kim3Brittany M. Bernik1
 Sunshine A. Van Bael1*
- 1Ecology and Evolutionary Biology, Tulane University, New Orleans, LA, United States
- 2Civil and Environmental Engineering, Louisiana State University, Baton Rouge, LA, United States
- 3Department of Civil and Environmental Engineering, Duke University, Durham, NC, United States
Recent work has suggested that the phytoremediation potential of S. alterniflora may be linked to a selection by the plant for oil-degrading microbial communities in the soil, in combination with enhanced delivery of oxygen and plant enzymes to the soil. In salt marshes, where the soil is saline and hypoxic, this relationship may be enhanced as plants in extreme environments have been found to be especially dependent on their microbiome for resilience to stress and to respond to toxins in the soil. Optimizing methods for restoration of oiled salt marshes would be especially meaningful in the Gulf of Mexico, where there is a persistently high threat of petroleum contamination. One favorable strategy for restoration of oiled sites might include planting S. alterniflora with a microbiome that has been pre-selected for an oiled environment. We examined this strategy with a two-year greenhouse experiment and found that planting S. alterniflora in an oiled environment enhances decomposition of oil residues without a clear negative impact on plant growth. Manipulation of the S. alterniflora microbiome through soil inoculation and through exposure to oil residues, elicited a detectable response of soil prokaryote communities to the presence of oil, while only demonstrating an analogous response in fungal communities in the plant roots and leaves. Yet, manipulation of the plant microbiome did not change plant morphology or relative decomposition of polycyclic aromatic hydrocarbons (PAHs) in the soil. Therefore, despite evident relationships between the plant, microbes, and oil, manipulation of the microbiome may not be a worthwhile addition to S. alterniflora phytoremediation strategies. Nevertheless, our work adds support for replanting S. alterniflora in oiled salt marshes as an effective strategy for reducing oil residues in salt marshes, in addition to the re-vegetation and erosion reduction benefits demonstrated by others.
1 Introduction
The importance of Spartina alterniflora in Gulf Coast salt marsh function and maintenance is well-established, making S. alterniflora a natural focal point for understanding salt marsh resilience to the Deepwater Horizon (DWH) oil spill. This foundational grass showed remarkable resilience to deposition of oil residues, recovering almost to reference levels in less than four years (1). Moreover, planting S. alterniflora in oiled conditions has been shown to hasten revegetation, reduce shoreline erosion, and reduce oil residues in the soil (2, 3). Recent work has suggested that the phytoremediation potential of S. alterniflora may be linked to a soil microbiome that is selected for oil-degrading microbes, in combination with enhanced delivery of oxygen and plant enzymes to the soil (4–6). However, very little is known about how manipulation of symbiotic plant microbes may affect the resilience or phytoremediation capacity of S. alterniflora. In extreme environments, like a salt marsh, where the soil is saline and hypoxic, plants may be especially dependent on their microbiome for resilience to stress and for response to toxins in the soil. Preliminary research after the DWH oil spill suggested that S. alterniflora growing in areas contaminated with oil depended on its microbiome, as evidenced by a corresponding shift in the microbiome to include more taxa with biodegradation potential (7). Manipulation of the plant microbiome may be a viable mechanism for enhancing restoration of salt marshes after an oil spill.
Optimizing methods for restoration of oiled salt marshes would be especially meaningful in the Gulf of Mexico, where there is a persistently high threat of petroleum contamination. Research has shown that it is possible to inoculate grasses with microbial symbionts to enhance plant growth and function in extreme and toxic environments (8–11). Studies of restoration techniques tested after the DWH oil spill supported re-planting of heavily-damaged coastlines as a means to improve restoration outcomes (12). Therefore, a favorable strategy for restoration of oiled sites might include planting S. alterniflora with a microbiome that has been pre-selected for growth in an oiled environment.
We examined this strategy with a two-year greenhouse experiment testing three specific hypotheses: (1) The presence of S. alterniflora in an oiled environment enhances the degradation of oil residues; (2) the plant microbiome can be manipulated by application of soil inocula to the nascent plant; and (3) in an oiled environment, a soil inoculum that is pre-exposed to oil residues enhances the growth of the plant and degradation of oil relative to an inoculum that is naïve to oil. We ran the experiment for two years, sampling soil, roots and leaves every six months. Every two months we applied soil inocula from either (1) a salt marsh that had been oiled in the DWH oil spill, or (2) one that was comparatively un-oiled.
We expected the presence of the plant to reduce polycyclic aromatic hydrocarbons (PAHs) in the soil and to maintain soil microbial communities that were compositionally different than when no plant was present. Furthermore, we predicted that we could manipulate the plant microbiome by applying soil inocula to our mesocosms with the expectation that the microbiome of the soil, roots, and leaves would have distinct signatures corresponding to the soil inocula and the presence of oil. Finally, we thought plant growth would be reduced in an oiled environment, but the negative effect would be reduced by inoculating the plant with a microbiome that had previously existed with oil residues in the environment.
2 Materials and methods
2.1 Experimental design
Three groups of response variables: plant morphology, PAHs, and microbial communities, were measured in response to three combinations of treatments. The experiment was a full factorial design in which each of the three treatments consisted of two levels: (1) the presence or absence of the plant; (2) inoculation of the mesocosms with soil from a marsh that had either been heavily oiled in the DWH oil spill or a marsh that was relatively unoiled by the DWH oil spill; and (3) the addition of 1.6 L of weathered oil to the soil or not. This resulted in 8 treatment combinations, with 10 replicates for each treatment combination (n=80 mesocosms). However, because of financial constraints, only 3 replicates were sequenced for microbial communities and for PAH content. PAH measurements were then augmented with an additional 75 samples from the first and last sampling periods to add clarity to the results. Throughout the experiment, care was taken to avoid cross-contamination as is described below.
2.2 Mesocosm setup
Seeds from S. alterniflora were collected in November 2015 in southern Louisiana and placed at 4°C to stratify. In February 2016 the microbial community on the surface of the seeds was reduced by subjecting them to a 95% EtOH bath for 3 min, then 30 min in 0.825% bleach and rinsed in sterile deionized (DI) water for 10 sec. The seeds were then germinated in DI water and transplanted to trays in a Conviron Model GR48 Plant Grow Room (Controlled Environments Ltd., Winnipeg, Canada). The growing substrate was a 1:1 mixture of organic humus and vermiculite that was autoclaved three times at 121°C for 60 min to reduce the microbial community in the substrate. Seedlings were grown under conditions meant to mimic conditions in southern Louisiana, after the methods of Krauss et al. (13). Seedlings were watered with DI water and each tray was given 1 tablespoon of Osmocote fertilizer (14:14:14 NPK). In April 2016, the plantlets were transferred to the greenhouse and allowed to acclimate for about three weeks. The plantlets were then transferred to pots filled with inoculum soil.
Approximately 3 months later, the plantlets were transferred to pots filled with inoculum soil. The inoculum soil was collected from Bay Jimmy, LA at sites (Supplementary Figure S1) that had been heavily oiled (29.44464°, -89.88959°) or relatively unoiled (29.44006°, -89.88583°) in the DWH oil spill (12). Within 60 h of collection the soil was sieved through a 1 cm screen, placed in 3.8 L (1 gallon) trade pots and either planted or left unplanted. The pots were randomized in five blocks on an approximate East-West axis across four tables that were oriented approximately North-South. The plants grew in the inoculum for one month and then the entire plant-soil plug was used to construct the mesocosm.
Each mesocosm consisted of a 11.3 L (3 gallon) trade pot nested in a water-filled 18.9 L (5 gallon) bucket (Supplementary Figure S2). The soil/plant plug was placed inside the 11.3 L (3 gallon) trade pot containing 9.5 L (2.5 gallon) of a 2:3 organic humus to sand mixture. Half of the mesocosms also had 1.6 L of naturally weathered oil mixed into the soil. The oil was skimmed off the surface of the ocean during the DWH oil spill (reference code OFS) and provided from BP plc (formerly the British Petroleum Company plc) via the Gulf of Mexico Research Initiative (GOMRI). To reduce spore fall germination, 1.9 L (0.5 gallons) of clean sand were placed in an even layer on the surface of the soil. Three weeks after mesocosm construction, 8 g of Scott’s Osmocote Plus (Marysville, Ohio) was added to the surface and covered with an additional 0.95 L (0.25 gallon) sand layer. This fertilizer is a patterned-release complete nutrient fertilizer containing 15% N, 9% P, and 12% K (releasing at maximum rate of 1.00 g·m-2 nitrate month-1). Drip irrigation supplied water to the surface of each pot, and pots were inserted into buckets in order to maintain a high water table. Drainage tubes were installed near the top of each bucket, allowing some flow through. To prevent reactivity to oil, the 11.3 L (3 gallon) trade pots were lined with Teflon bags (P-00113, Welch Fluorocarbon, Inc, Dover, NH, USA). The bottom of each bag was punctured to permit drainage.
2.3 Mesocosm maintenance
Over the course of the experiment, plants received water from a timer-based drip irrigation, so that some portion of the water would turn over every day. If necessary, during hot summer months the watering was augmented by hand to maintain the height of the water table. Once a month, the mesocosms received 1 L of 5 ppt solution of Instant Ocean salt (Instant Ocean Spectrum Brands, Blacksburg, VA). Every two months mesocosms were augmented with an additional 4 g of fertilizer and 1 L of inoculum, a soil slurry from the same marsh sites used in the original inoculation. Whenever salt built up on the plant leaves, plants were misted to wash salt off the leaves. Unplanted pots were misted for an equal length of time to control for the extra water delivered.
2.4 Sample collection overview
Mesocosms were sampled every 6 months for two years, with a complete harvest of the mesocosms in June 2018. Every sampling period began with measuring plant morphology followed by harvesting leaves for microbial analysis. Next the mesocosm was sampled immediately for roots and soil. To avoid resampling the same area, the bucket was divided into quarters and soil and roots were sampled from approximately 2.5 cm - 20 cm deep. Fresh gloves were used between every plant, and work done on glass table that was cleaned with 10% bleach and 95% ethanol between samples. All tools were also cleaned with bleach and ethanol and, if contaminated with oil, mineral spirits.
The dense sod made it necessary to use a keyhole saw to cut through the roots. Once the sod was cut, it was removed from the bucket, and placed on the clean glass surface, where roots were picked. Soil was placed into a clean beaker.
After sampling, the area was refilled with sand and 1 L of water was added. Sampling area was not resampled for soil or roots in subsequent sampling periods. However, stems that grew into the sand of previously sampled areas were included in subsequent samplings.
2.5 Plant morphology measurements
Four morphological traits were measured for 20 haphazardly selected stems that the collector thought to be representative of the plant in each mesocosm. Care was taken to sample stems across the entire mesocosm. Stem height was recorded by measuring the height, from soil surface to tip of unfurled leaf to the nearest 0.5 cm. Stem diameter was recorded by measuring the diameter of stems ~10 cm above the soil using analog calipers to the nearest 0.1 mm. The number of nodes per stem were also counted for every stem measured. The number of live stems, regardless of size, were counted with a hand-clicker. Stems were counted only once for the initial sampling period because the number of stems per plant was low enough (< 61) that they could be counted confidently. For the subsequent three sampling periods, live stems were counted three times and these values were averaged to obtain the number of live stems.
2.6 Microbial sample collection and processing
Samples were collected using clean gloves. Tools and surfaces were cleaned with 10% bleach and 95% ethanol between every sample.
2.6.1 Soil
Approximately 1 L of soil was collected, homogenized in a clean beaker, and distributed to 1.5 ml tubes for microbial analysis, and 15 ml tubes for PAH analysis. Soil samples for chemical analysis were stored at 4°C until processed. Soil samples for microbial analysis were transported on dry ice and stored at -20°C until processed.
2.6.2 Leaves
Approximately 5 g of whole, healthy leaves were collected, placed into a clean Ziploc bag and stored at 4°C until analysis. To control for leaf age, the third leaf from the bottom was collected from a given stem. If the third leaf was blemished, then the fourth leaf was collected instead. All subsequent processing occurred within 12 hours of collection. Edges were removed from leaves and leaves were chopped into 2x2 mm pieces to prepare them for microbial analysis. Leaves were treated with bleach and ethanol to reduce the presence of microbes on the outside of the tissue. Following the methods of Kandalepas et al. (7), leaf pieces were submerged for 10 seconds in 95% ethanol, then 2 minutes in 0.525% sodium hypochlorite (10% bleach) followed by 2 minutes in 70% ethanol. Samples were frozen at -20°C until DNA extraction.
2.6.3 Roots
Roots were processed using similar methods to leaf processing. A small handful of healthy, but unwashed, roots were collected and stored at 4°C until processing. A portion of the roots were washed in DI water until 4 g of material was obtained. The 4 g of clean roots were chopped into smaller pieces and 2 g set aside for microbial analysis. The 2 g intended for microbial analysis were cut into 5 mm lengths and treated to reduce the external microbes as follows: root pieces were first submerged for 10 seconds in 70% ethanol, then 2 minutes in 2.625% sodium hypochlorite (50% bleach), followed by 3 rinses in sterile DI water. Samples were frozen at -20°C until DNA extraction.
2.7 DNA extraction
2.7.1 Leaves and roots
Using sterile technique, 0.15 g of frozen wet leaf tissue and 0.2 g of frozen wet root tissue were extracted for each sample. We first ground tissue in a mortar and pestle using liquid nitrogen to aid lysis. Mortars and pestles were soaked in 10% bleach and autoclaved beforehand to remove relic DNA. We extracted genomic DNA root and leaf samples using MoBio Powerplant Pro DNA isolation kit, which was rebranded as Qiagen DNeasy Plant Mini kit. We followed the standard protocol, using the slight modifications suggested in the protocol, to maximize yield. If a sample did not yield a concentration of at least 10 ng/uL then it was re-extracted.
2.7.2 Soil
Using sterile technique, 0.4 g of soil was extracted for each sample using the MoBio Powersoil DNA isolation kit (now Qiagen DNeasy Powersoil kit) following the standard protocol with slight modifications as suggested by the manufacturer to maximize yield. If a sample did not yield a concentration of at least 10 ng/uL then it was re-extracted.
2.8 ITS library preparation and sequencing
We followed the methods of Lumibao et al. (14) to create a metagenome of the fungal ITS1 region. Briefly, the method is a 2-step library preparation using primers ITS1F (CACTCTTTCCCTACACGACGCTCTTCCGATCTCTTGGTCATTTAGAGGAAGTAA) and ITS2 (CACTCTTTCCCTACACGACGCTCTTCCGATCTCTTGGTCATTTAGAGGAAGTAA). After high quality genomic DNA was extracted from tissue, the ITS1 region was amplified in triplicate via PCR. The product of this first PCR was pooled and then indexed with Illumina barcodes using another round of PCR. The PCR products were then pooled in equimolar amounts and sequenced on an Illumina MiSeq platform (Illumina Inc. San Diego, USA) using 300 bp paired-end (PE) sequencing. Sequencing was carried out by the Duke University Genome Sequencing and Analysis Core Facility (Durham, USA).
2.8.1 Processing and clustering
Sequences were processed following the DADA2 ITS Pipeline Workflow, version 1.8 (15) in R version 3.6.1 (16). The pipeline also depends on the R packages ShortRead (17), BioStrings (18), and ggplot2 (19). Briefly, samples were trimmed and filtered with cutadapt (20) based on detection of primer sequences from the first PCR in library prep. Then sequences were trimmed and filtered again after examining quality profiles of the reads. The main DADA2 algorithm with default parameters was then employed to learn the error rates of the sequences and dereplicate them, then infer the correct sequence for each read. Paired-end reads were then merged, chimeras were removed and taxonomy was assigned against the UNITE database (21). The results from one soil sample were discarded due to low sequences after quality filtering.
2.9 16S Library prep and sequencing
Separate leaf, root, and soil tissue was sent to Duke University for 16S rRNA library preparation and sequencing. Tissue collected for 16S analysis was processed the same as tissues collected for ITS analysis except after surface sterilization, leaves and roots were frozen in a CTAB buffer (2% CTAB, 0.02M EDTA, 0.1M Tris, 1.4M NaCl). Library preparation and sequencing followed methods described in Lefèvre et al. (22) using primers 819F (GTCCACVCCSTAAACGWTG) and 1115Rmod (AGGGTTGCGCTCGTTRC).
2.9.1 Processing and clustering
Sequences were processed following the DADA2 16S Pipeline Workflow, version 1.12 (15) in R version 3.6.1 (16). Briefly, samples were trimmed and filtered after examining quality profiles of the reads. The main DADA2 algorithm with default parameters was then employed to learn the error rates of the sequences and dereplicate them, then infer the correct sequence for each read. Paired-end reads were then merged, chimeras removed, and taxonomy assigned against the SILVA 132 database (23). As a final step, ASVs that were assigned chloroplast or mitochondrial taxonomy were filtered out. Unfortunately, many leaf and root samples were saturated with chloroplast and mitochondrial sequences (19 of 48 leaf samples; 22 of 48 root samples) and therefore discarded. The remaining samples were not enough to pursue parallel analyses to the ITS sequencing. However, only two soil samples were discarded for low sequence count, allowing soil to be analyzed as planned.
2.10 Oil residue collection and processing
Soil and roots for oil analysis were collected as described above. PAH content was analyzed using gas chromatography/mass spectrometry following the methods described in Lumibao et al. (14, 24)
2.11 Biomass collection
In June 2018, the mesocosms were fully harvested. After leaves were sampled, all stems were clipped and soil and roots were collected. Plant tissue was dried in an oven at 60°C until mass was consistent two days in a row.
2.12 Statistical analysis
Unless otherwise mentioned we conducted all statistical analyses in R version 4.0.2 (25). Analyses and figures depended heavily on the tidyverse (26), cowplot (27), compositions (28), phyloseq (29) and vegan (30) packages. Linear and generalized linear models (GLM) were implemented via the base R package, stats or the package car (31). PERMANOVA models were implemented via the “adonis” function in vegan. The packages supporting the Bayesian mixed-effects models used to analyze plant traits are described below.
2.12.1 PAHs
We modeled the difference in total PAH abundance between the beginning and end of the experiment with an ANOVA, using square root-transformed total PAHs to meet assumptions of normality. Differences in PAH composition were tested with a PERMANOVA, using the adonis function in the vegan package, and 9999 permutations. Models were based on Aitchison distance (Euclidean distance of center-log ratio (CLR) transformed values) and controlled for between-sampling period variation through the permutations argument.
2.12.2 Plant traits
Differences in plant biomass were modeled using ANOVAs on square-root transformed biomass to meet assumptions of normality. Plant traits were analyzed with Bayesian mixed-effects models from the brms R package (32, 33) to account for the repeated measures aspect of the experiment and generally followed the structure:
Models were fit to different conditional distributions depending on the model fit after initial exploration of the data. Number of nodes and number of live stems were fit to negative binomial distributions, and stem height and diameter to skew normal distributions. Estimates were made using MCMC sampling with 4 chains of 5000 iterations and a warmup of 2500. Default priors were used for all models. Results from the model for the stem count and visual inspection of the data led us to test specifically for differences at the final sampling period with a Generalized Linear model (GLM), based on a quasi-Poisson distribution.
2.12.3 Microbial communities
Alpha diversity of microbial communities was estimated with Shannon’s diversity index and tested for statistical differences using GLMs assuming gamma distributions to account for the inability of diversity to be negative. For fungal communities, we constructed four models: one testing for treatment effects between soil, roots, and leaves, and a model for treatment effects for each of the individual compartments (soil, root, and leaf). We had to disqualify the sequencing results for prokaryote communities in the leaves and roots, as described above, and therefore only modeled treatment effects within the soil for prokaryote communities. Prokaryote samples were rarefied to 1039 sequences prior to diversity analyses. Likewise, fungal samples were rarefied to 3914 sequences priori to diversity analyses. These thresholds were selected after examining the slope of rarefaction curves at various sampling points and the downstream effects on statistical results when rarefying at higher thresholds. The statistical and scientific conclusions were the same when the prokaryotes were rarefied to 10,441 sequences, although 5 additional samples would need to be discarded, compared with rarefying to 1039 sequences. Fungal communities rarefied to 12,158 sequences also yielded comparable conclusions to those rarefied to 3914 samples, but with two fewer samples. Therefore, in both cases we elected to preserve the experimental replicates over the negligible influence of a higher rarefaction threshold.
We estimated beta diversity via a principal components analysis (PCA) to visualize variation and tested for differences in PAH composition by conducting a PERMANOVA (adonis function in vegan) of Aitchison distances. Results were compared with NMDS ordinations and additional PERMANOVAs built on Bray-Curtis and Jaccard Index to probe for sensitivities based on metric and ordination choice. We did not have the replicates necessary for a legitimate statistical comparison of the relative abundance of individual taxa. However, we explored patterns in the relative abundance of taxa by examining plots centered-log ratios of ASVs by compartment and experimental treatment.
3 Results
3.1 Effect of plant presence and inoculum on PAH composition
Plant presence corresponded to enhanced decomposition of PAHs over the course of the experiment (Figure 1), while inoculum treatments did not. Six months into the experiment no differences in PAH composition could be detected among treatments. However, at the end of the experiment, the total abundance of PAHs was reduced by an order of magnitude (With Plant = 6.03 ug/g ± 2.68 SE; Without Plant = 61.40 ± 9.06 SE) when a plant was present (ANOVA F1,28 = 41.06, p < 0.001), and the composition of PAHs was significantly different (PERMANOVA F = 1,71 = 10.52, p = 0.0001), primarily due to a relative reduction in lighter PAHs (3-ring PAHs) compared to chrysenes (4-ring PAHs) (Figure 1).
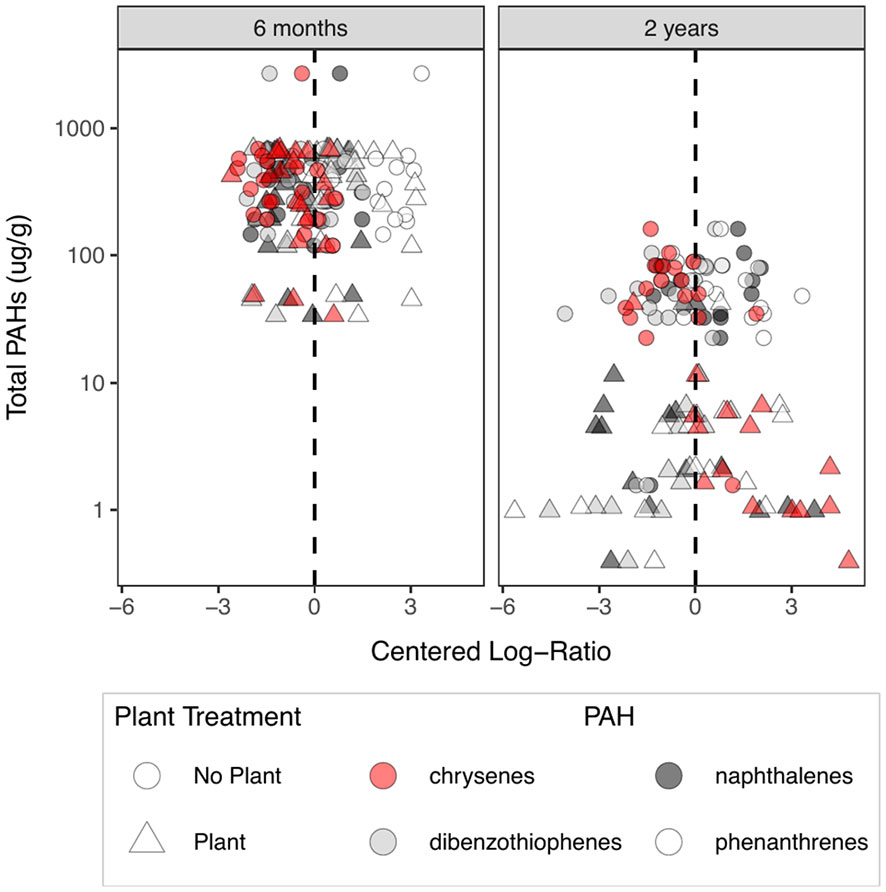
Figure 1 Relative abundances of PAHs 6 months into the experiment (left panel) and at the end of the experiment (right panel). The y-axis represents the total target PAHs measured for a sample. The x-axis represents the centered log-ratio of the PAHs, where the dashed line represents the geometric mean of the sample. Points to the left of the dashed line represent PAHs that were relatively less abundant than average in a sample and points to the right of the dashed line represent PAHs that were relatively more abundant than average. Target PAHs included one 2-ring PAH, two sets of congeners of 3-ring PAHs (colored in white and gray) and one type of 4-ring PAH (colored red). Triangles represent soil samples from mesocosms in which a plant was growing, circles represent soil from mesocosms with no plant.
3.2 Effect of PAHs and inoculum on plant growth and morphology
We measured the response of several plant traits and biomass to the oil addition and the inoculum treatments but found few differences. There was no statistical difference in aboveground or belowground biomass at the end of the experiment for any treatment, nor any difference in the ratio of aboveground to belowground biomass, or the total biomass (Figure 2; Supplementary Table S1). Furthermore, the plants did not differ in stem height (Supplementary Table S2) or stem diameter (Supplementary Table S3). The number of nodes per stem were suggested to be different for the third and fourth sampling points. However, a visual inspection of these results casted doubt on whether or not nodes were counted consistently across the entire experiment (Supplementary Figure S3, Supplementary Table S4). Oil addition did reduce the number of live stems (With Oil = 81.1 stems ± 5.64 SE; No Oil = 104.7 stems ± 3.68 SE) in the mesocosm (Figure 3; Supplementary Table S5, although this only manifested for the final sampling period (F1,37 = 10.97, p = 0.002).
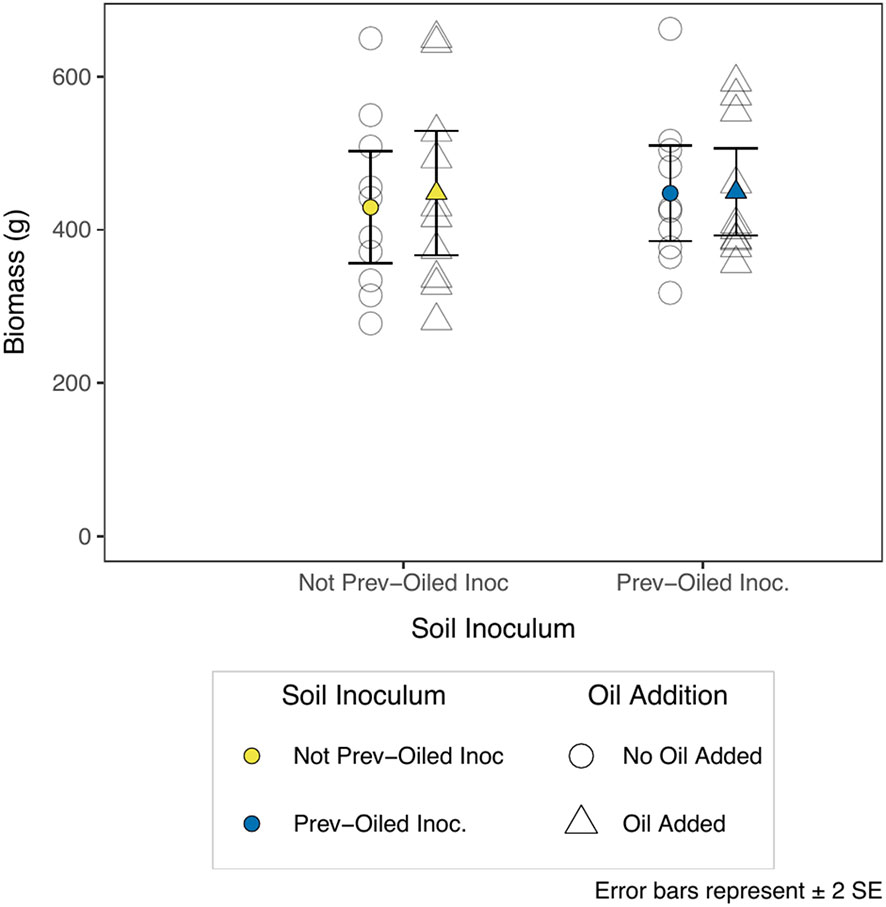
Figure 2 Total (aboveground + belowground) plant biomass at the end of the experiment (n = 10). Colored points represent the mean biomass for a combination of treatments. Individual replicates are not filled in. Triangles represent plants growing in mesocosms to which oil was added, circles are plants to which oil was not added. Soil inocula are represented by color, and a separated on the x-axis for visual clarity.
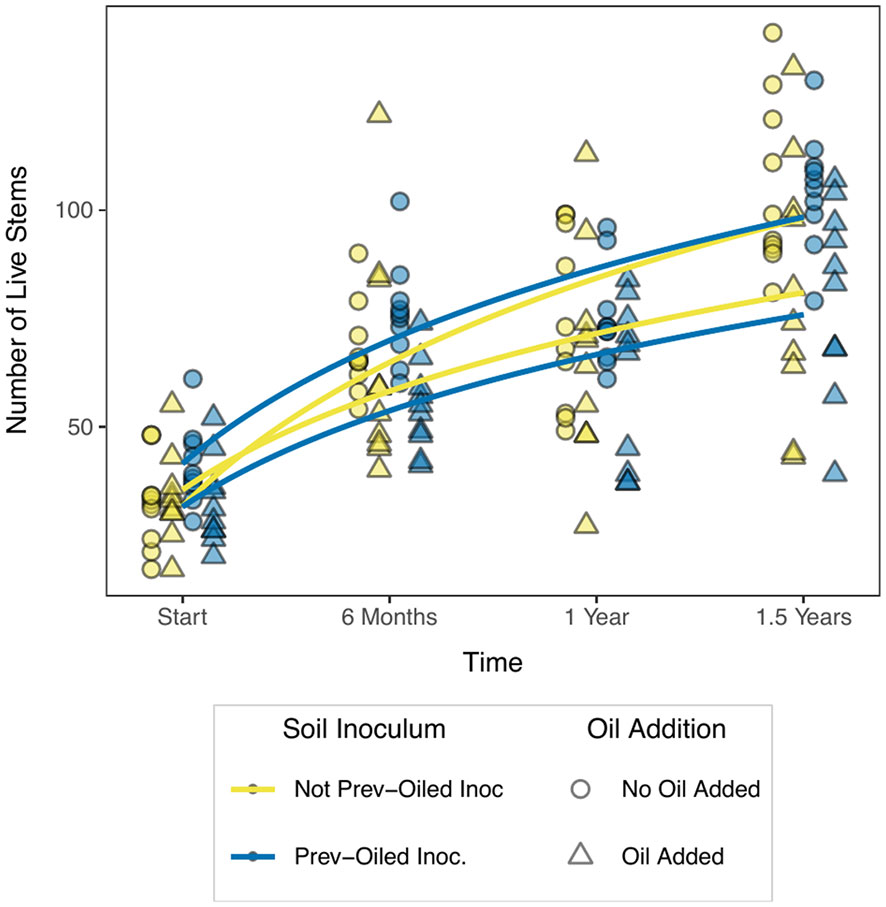
Figure 3 Live stem count over the course of the experiment. Triangles represent plants growing in mesocosms to which oil was added, circles are plants to which oil was not added. Soil inocula are represented by color. Curves are logarithmic curves (y ~ log(x)) fitted with the “glm” method in the geom_smooth function from ggplot. By the end of the experiment, stem count had separated into two groups: those in which no oil was added (top two lines) and those in which oil was added (bottom two lines).
3.3 Microbial community composition with respect to plant compartment and oil addition
3.3.1 Prokaryote soil communities
Sequencing yielded 27,935,842 PE reads after quality filtering. Samples had 145,499.2 PE reads on average (SD = 133,843). Despite this large variation in sequencing depth, sequences were of good quality. However, as described in the methods, approximately half of the leaf and root samples were saturated with chloroplast and mitochondrial sequences and disqualified from analysis. Only two samples were discarded from the soil replicates, allowing analysis to proceed as planned.
Soil samples yielded 19539 ASVs, however, alpha diversity (Shannon’s diversity index) in prokaryote soil communities did not differ by any treatment or sampling period (Supplementary Figure 4, Supplementary Table S6). Prokaryote community composition in soil samples (Figure 4) were statistically different when a plant was present, when oil was added, between the inocula, the interaction of the plant treatment with the oil addition, and the inoculum treatment with the oil addition (Supplementary Table S7). Despite these differences, no clear patterns were evident when visually examining the relative abundance of taxa by treatments (Supplementary Figures S5A, B).
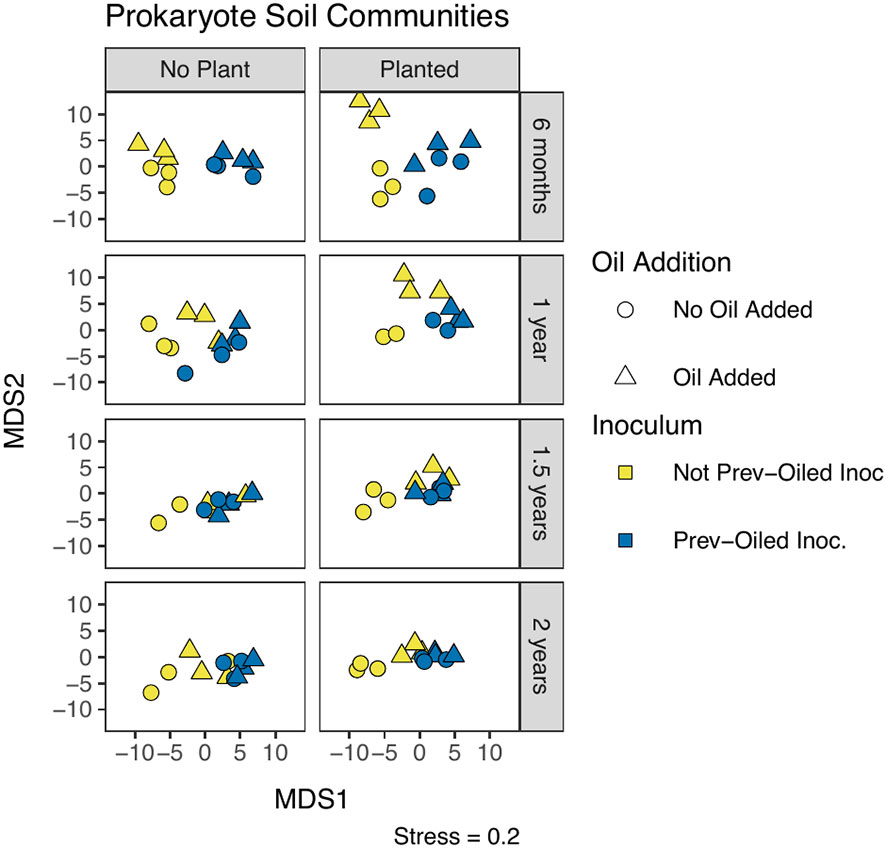
Figure 4 NMDS of prokaryote community composition in soil, measured by Aitchison distance. Each point represents a single replicate at a time point. Sampling points correspond to individual panels, chronologically from top to bottom. The two columns of panels represent whether or not a plant was in the mesocosm. The oil addition treatment is represented by shape and the inoculum treatment by color.
3.3.2 Fungal communities
Sequencing yielded 15,732,033 PE reads after quality filtering. On average, samples had 66,100 PE reads (SD = 21,494). Clustering yielded 3583 ASVs in total, with 3179 ASVs in the soil, 699 in the roots and 241 in the leaves. Alpha diversity (Shannon’s diversity index) in fungal communities was significantly higher in soil samples compared with roots, and higher in root samples than leaves (ANOVA F2,188 = 369.86, p < 0.00001, Supplementary Figure S6). There were no differences in soil, root, or leaf diversity by any treatment or sampling period except for the interaction of the oil addition and the inoculation treatment for soil communities (ANOVA F1,63 = 4.017, p = 0.049).
Fungal community composition was statistically different between plant compartments (PERMANOVA F2,191 = 12.98, p = 0.0001). Communities in soil samples were statistically different when a plant was present, between the inocula, and the interaction of the plant and inocula (Figure 5, Supplementary Table S8). The interaction appeared to be driven by differences within the not-previously oiled inoculum group and the presence of the plant. No effect was detected from the oil addition on the soil community composition. Root community composition was significantly different for oil addition, inocula treatments, and the interaction of the two (Figure 6; Supplementary Table S9). Fungal communities in leaves showed difference in community composition corresponding to the inocula and the interaction of inocula with oil addition (Figure 7; Supplementary Table S10). No clear patterns were evident when visually examining the relative abundance of taxa by treatments (Supplementary Figures S7-S9).
Figure 5 NMDS of fungal community composition in soil, measured by Aitchison distance. Each point represents a single replicate at a time point. Sampling points correspond to individual panels, chronologically from top to bottom. The two columns of panels represent whether or not a plant was in the mesocosm. The oil addition treatment is represented by shape and the inoculum treatment by color.
Figure 6 NMDS of fungal community composition in roots, measured by Aitchison distance. Each point represents a single replicate at a time point. Sampling points correspond to individual panels, chronologically from top to bottom. The oil addition treatment is represented by shape and the inoculum treatment by color.
Figure 7 NMDS of fungal community composition in leaves, measured by Aitchison distance. Each point represents a single replicate at a time point. Sampling points correspond to individual panels, chronologically from top to bottom. The oil addition treatment is represented by shape and the inoculum treatment by color.
4 Discussion
An optimal strategy for restoring an oiled salt marsh should maximize foundational plant productivity while simultaneously removing the contaminant – oil residues – from the environment. We highlight three key results that may help inform such a strategy. First, our study supports the conclusions of Mendelssohn and Lin (2) and Zengel et al. (3) that planting S. alterniflora in an oiled environment would likely hasten the decomposition of oil residues. Second, the morphology and productivity of the plant does not appear to react negatively to introduction into an oiled environment. Lastly, manipulation of the plant’s microbiome via exposure to oiled microbial communities is not associated with changes in plant morphology or oil decomposition.
4.1 Effect of plant presence and inoculum on PAH composition
Plant presence clearly enhanced the decomposition of PAHs over the course of two years. The relative decrease in two- and three-ring PAHs to four-ring PAHs (chrysenes) suggest biodegradation of PAHs (34). Biodegradation of recalcitrant oil residues in coastal marshes is likely driven by a complex concert of oxygen availability and chemical cues driving changes in microbial communities (35–37). The plant may hasten biodegradation of PAHs by enhancing oxygen in the soil (2, 38, 39) and/or by delivering enzymes into the soil, which select for soil microbes that degrade oil (40, 41).
It is noteworthy that these differences did not manifest for more than six months after the plants were introduced into the soil. This result is at odds with other experiments which have demonstrated hydrocarbon decomposition in shorter periods (2, 4, 42). However, our experiment differed in one key point from many other experiments. Our plants were started from seed to facilitate the manipulation of the microbiome. This difference also meant that our plants were immature and potentially less productive than if they had been started from rhizomes. The immaturity of the plant may be the explanation for the latency in PAH decomposition.
We had expected the inoculum from the previously oiled marsh to stimulate PAH decomposition by virtue of the microbial community being pre-selected to include taxa that could metabolize PAHs in the environment. There was no difference, however, in PAH decomposition according to the different soil inocula. This null result was consistent with at least two other studies examining the effects of microbial inocula on hydrocarbon degradation (2, 41). The soil microbial communities showed compositional differences corresponding to the inocula (Figure 4), so the lack of effect was not due to the inefficacy of the treatment. Given the high diversity of the soil microbial communities, there may be significant overlap in the functionality of the communities despite measurable differences in their relative compositions, resulting in no difference in the relative rates of PAH decomposition. Alternatively, the rate of PAH decomposition may be controlled by other factors such as oxygen or nutrient availability. However, these speculations would require additional analyses to be substantiated.
4.2 Effect of PAHs and inoculum on plant growth and morphology
S. alterniflora showed little response to growing in oiled soil, or from the manipulation of its microbiome. There was no difference in all measured plant traits except for the number of live stems at the end of the experiment. While a reduction in live stem count corresponding to oil exposure is consistent with the work of Hughes et al. (43), this finding must be qualified by considering the otherwise indifference of the plant to the presence of the oil and the different inocula. The Bayesian models of stem height, stem diameter, and nodes per stem did not suggest any differences in these morphological traits, with the exception of the number of nodes in the final two sampling periods. However, a visual examination of these results convinced us there was something fundamentally inconsistent with how we counted nodes in the third period, casting doubt on whether the differences in either period are meaningful.
These results are consistent with the work of DeLaune et al. (44) although the Pezeshki et al. (45) detail the complex factors that may influence the outcome of oil on a marsh. Two years is a substantial amount of time for a highly productive plant, such as S. alterniflora, to grow in such a limited space. Many plants were root-bound by the end of the experiment, which may especially explain the lack of difference in biomass. If the plants had maximized their potential in the growing space prior to the two-year harvest, any effects from the treatments would have attenuated by the final harvest. Moreover, our methods were similar to the work of Mendelssohn and Lin (2), in which plants were placed into oiled soil, rather than oil being applied to already growing plants. This difference in methodology may be critical to understanding our results; the morphology and biomass of S. alterniflora seem to be negatively affected when oil comes into contact with above ground tissues (43, 46–48), but not when a healthy plant is placed into an oiled environment (2).
Prior to this study, it was not clear whether shifts in microbial symbionts could be detected in the plant morphological response. Previous work has shown differences in plant morphology (43, 48) or endophyte community composition (7) corresponding to oiling, but never the two at the same time. Based on our results, it appears that the microbiome of S. alterniflora can detectably shift in composition without significantly influencing the plant morphology. S. alterniflora evolved to thrive in a dynamic and extreme environment. It seems possible that the plant may have evolved to optimize morphological stability in response to changes in its microbiome, rather than harnessing the microbiome to mitigate the extreme environment, as has been previously hypothesized about plants living in extreme environments (49).
4.3 Microbial community composition with respect to plant compartment and oil addition
Microbial communities were successfully manipulated through the application of soil inocula, but evidence also suggested responses to the addition of oil and S. alterniflora to the environment. Our previous work indicated that endophyte communities in S. alterniflora shift in response to oiling in the field (7), a result that is supported in this greenhouse study. However, it is worth noting that soil fungal community composition did not show an effect of the oil addition treatment, while roots and leaves did. It is known that PAHs can accumulate in leaf tissues of smooth cordgrass in oiled salt marshes (50–52). Therefore, it is possible that fungal communities living inside the plant are sensitive to oil residues because of additional constraints created by the chemical environment of the plant tissues.
The fungal communities in the soil did change in composition when a plant was present and upon the interaction of the plant with the inoculum, despite not exhibiting a response to the oil addition. The ability of plants to interact with and manipulate the soil microbiome is well-established (53). Thus, it is not surprising that the plant would have an influence on the soil microbiome that also reflects an influence of microbial inputs to the soil, like the inoculum treatment.
In contrast, soil prokaryote communities shifted in the soil in response to oil addition, lending support to a relationship that has been demonstrated in field and mesocosm work (5, 6, 34, 54). Composition was differentiated further by the interaction of the oil with different inocula, suggesting that the response of a soil community to the addition of oil will be somewhat unique and depend on characteristics of the soil, like its oiling history. Likewise, the presence of a plant also detectably changed prokaryote community composition in the soil and had detectable interactions with the addition of oil to the soil. It is likely that this is due in part to oxygenation of the soil by the plant roots (2), which would elicit changes in the local chemistry of the soil, cascading to both the degradation of oil in the environment and the microbial community composition.
There are two shortcomings to our experiment that we wish to address. First, we did not have the experimental replicates to make legitimate statistical comparisons of relative abundance of individual taxa. This was due to the experiment being designed in a time when sequencing costs drove decisions to work with minimal replicates (55). In the time since, it has become clear that many more replicates should be used to account for potential poor sequencing results and for making in depth comparisons of microbial community composition (56–58). Unfortunately, this decision limited our ability to investigate community dynamics in more detail. The second shortcoming was our unsuccessful attempt to consistently enrich prokaryote endophyte sequences from plant tissues. This issue kept us from analyzing prokaryotes in plant roots and leaves and prevented the intended side-by-side comparison of prokaryote and fungal community dynamics. The work of Lefèvre et al. (22) demonstrated that a PCR blocking primer assay can successfully enrich S. alterniflora prokaryote communities. But they also noted that some samples still comprised a substantial proportion of plant reads. Even though our results suggest that more fine-tuning of our protocol is needed, it is worth noting that segregating plant and prokaryote 16S sequence amplification remains a significant hurdle for studies of endophytes (22) and should continue to be explored.
5 Conclusion
We have demonstrated that planting S. alterniflora in an oiled environment enhances decomposition of PAHs without a clear negative impact on plant growth. We manipulated the microbiome of S. alterniflora through soil inoculation, showing a detectable response of prokaryote communities to the presence of oil, with analogous responses in fungal communities of the roots and leaves only. Importantly, manipulation of the plant microbiome by exposure to oiled microbial communities did not change plant morphology or relative decomposition of PAHs in the soil. Therefore, despite evident relationships between the plant, microbes, and oil, manipulation of the microbiome may not be a worthwhile addition to restoration strategies if phytoremediation is the main goal. Nevertheless, our work adds support for replanting S. alterniflora in oiled salt marshes as an effective strategy for reducing oil residues in salt marshes.
Data availability statement
The datasets presented in this study can be found in online repositories. The names of the repository/repositories and accession number(s) can be found below: https://data.gulfresearchinitiative.org/data/R5.x286.000:0002, doi: 10.7266/n7-rzxc-4x96. Code for processing sequences and reproducing figures and analyses is available at github.com/sformel/S5.
Author contributions
Study design, funding, and project organization were managed by SB, CG, EL and JP. Greenhouse maintenance and sample collection were performed by SF and BB. Biological samples were processed by SF, AM, SB, PV, YK and EL. Oil samples were processed and analysed by JP, VE, and KS. Bioinformatic and statistical analyses were conducted by SF. Assembly and writing of manuscript were led by SF with contributions from all other authors.
Funding
Funding for the study was provided by Gulf of Mexico Research Initiative (R5.x286.000:0002), SF and PV were funded in part by a National Science Foundation (NSF) Graduate Research Program Fellowship and SF by a Louisiana Board of Regents Fellowship.
Acknowledgments
We thank Shelley Meaux, Michael Blum and the Bywater Institute for use of their boat. This research was also supported in part using high performance computing (HPC) resources and services provided by Technology Services at Tulane University. Executing this experiment and processing the samples in a timely manner required a small army. We express our heartfelt thanks to: Alex Freeman, Alison Harrington, Amelia Lormond, Bek Markel, Brittany Maldonado, Callie Oliver, Candice Lumibao, Caroline Faircloth, Carolyn Babendreier, Clare Lister, Courtney Pellegrini, Emma Darr, Emma Weisner, Erin Chapman, George Richards, Ian Sestak, Jacklyn Drewry, Jeanell Sullivan, Jennifer Janowsky, Katie Adler, Kaylee Arnold, Kim Mighell, Lina Tran, Liz Kimbrough, Maggie Conrad, Mareli Sanchez Juliá, Max Berdik, Meg Maurer, Miranda Hendrix, Peter Tellez, Rachel Froehlich, Rebecca Wang, Steven Medina, Tarik Anwar, Trey Hendrix, Yaseen Khan, Harish Ratnayaka, Shelley Meaux, Lorena Torres Martínez, and Martha Allen.
Conflict of interest
The authors declare that the research was conducted in the absence of any commercial or financial relationships that could be construed as a potential conflict of interest.
Publisher’s note
All claims expressed in this article are solely those of the authors and do not necessarily represent those of their affiliated organizations, or those of the publisher, the editors and the reviewers. Any product that may be evaluated in this article, or claim that may be made by its manufacturer, is not guaranteed or endorsed by the publisher.
Supplementary material
The Supplementary Material for this article can be found online at: https://www.frontiersin.org/articles/10.3389/fsoil.2022.949439/full#supplementary-material
References
1. Lin Q, Mendelssohn IA, Graham SA, Hou A, Fleeger JW, Deis DR. Response of salt marshes to oiling from the deepwater horizon spill: Implications for plant growth, soil surface-erosion, and shoreline stability. Sci Total Environ (2016) 557-558:369–77. doi: 10.1016/j.scitotenv.2016.03.049
2. Mendelssohn I, Lin Q. Development of bioremediation for oil spill cleanup in coastal wetlands, US department of interior. MMS (2002) 48:2002.
3. Zengel S, Rutherford N, Bernik BM, Weaver J, Zhang M, Nixon Z, et al. Planting after shoreline cleanup treatment improves salt marsh vegetation recovery following the deepwater horizon oil spill. Ecol Eng (2021) 169:106288. doi: 10.1016/j.ecoleng.2021.106288
4. Hong Y, Liao D, Chen J, Khan S, Su J, Li H. A comprehensive study of the impact of polycyclic aromatic hydrocarbons (PAHs) contamination on salt marsh plants Spartina alterniflora: implication for plant-microbe interactions in phytoremediation. Environ Sci pollut Res (2015) 22(9):7071–81. doi: 10.1007/s11356-014-3912-6
5. Su J, Ouyang W, Hong Y, Liao D, Khan S, Li H. Responses of endophytic and rhizospheric bacterial communities of salt marsh plant (Spartina alterniflora) to polycyclic aromatic hydrocarbons contamination. J Soils Sediments (2016) 16(2):707–15. doi: 10.1007/s11368-015-1217-0
6. Cavé-Radet A, Correa-Garcia S, Monard C, Amrani AEL, Salmon A, Ainouche M, et al. Phenanthrene contamination and ploidy level affect the rhizosphere bacterial communities of spartina spp. FEMS Microbiol Ecol (2020) 96. doi: 10.1093/femsec/fiaa156
7. Kandalepas D, Blum MJ, Van Bael SA. Shifts in symbiotic endophyte communities of a foundational salt marsh grass following oil exposure from the deepwater horizon oil spill. PloS One (2015) 10(4):e0122378. doi: 10.1371/journal.pone.0122378
8. Márquez LM, Redman RS, Rodriguez RJ, Roossinck MJ. A virus in a fungus in a plant: Three-way symbiosis required for thermal tolerance. Science (2007) 315(5811):513–5. doi: 10.1126/science.1136237
9. Redman RS, Kim YO, Woodward CJ, Greer C, Espino L, Doty SL, et al. Increased fitness of rice plants to abiotic stress via habitat adapted symbiosis: a strategy for mitigating impacts of climate change. PloS One (2011) 6(7):e14823. doi: 10.1371/journal.pone.0014823
10. Li X, Zhang L. Endophytic infection alleviates Pb(2+) stress effects on photosystem II functioning of Oryza sativa leaves. J Hazard Mater (2015) 295:79–85. doi: 10.1016/j.jhazmat.2015.04.015
11. Yuan Z, Druzhinina IS, Labbé J, Redman R, Qin Y, Rodriguez R, et al. Specialized microbiome of a halophyte and its role in helping non-host plants to withstand salinity. Sci Rep (2016) 6:32467. doi: 10.1038/srep32467
12. Zengel S, Bernik BM, Rutherford N, Nixon Z, Michel J. Heavily oiled salt marsh following the deepwater horizon oil spill, ecological comparisons of shoreline cleanup treatments and recovery. PloS One (2015) 10(7):e0132324. doi: 10.1371/journal.pone.0132324
13. Krauss KW, Chambers JL, Allen JA. Salinity effects and differential germination of several half-sib families of baldcypress from different seed sources. New Forests (1998) 15:53–68. doi: 10.1023/A:1006572609171
14. Lumibao CY, Formel S, Elango V, Pardue JH, Blum M, Van Bael SA. Persisting responses of salt marsh fungal communities to the deepwater horizon oil spill. Sci Total Environ (2018) 642:904–13. doi: 10.1016/j.scitotenv.2018.06.077
15. Callahan BJ, McMurdie PJ, Rosen MJ, Han AW, Johnson AJA, Holmes SP. DADA2: High-resolution sample inference from illumina amplicon data. Nat Meth (2016) 13(7):581–3. doi: 10.1038/nmeth.3869
16. R Development Core Team. R: A language and environment for statistical computing. (2019) (Vienna, Austria: R Foundation for Statistical Computing).
17. Morgan M, Anders S, Lawrence M, Aboyoun P, Pagès H, Gentleman R. ShortRead: a bioconductor package for input, quality assessment and exploration of high-throughput sequence data. Bioinformatics (2009) 25(19):2607–8. doi: 10.1093/bioinformatics/btp450
18. Pagès H, Aboyoun P, Gentleman R, DebRoy S. Biostrings: Efficient manipulation of biological strings. (2019). doi: 10.18129/B9.bioc.Biostrings.
19. Kahle D, Wickham H. ggmap: Spatial Visualization with ggplot2. R J (2013) 5(1):144–61. doi: 10.32614/RJ-2013-014
20. Martin M. Cutadapt removes adapter sequences from high-throughput sequencing reads. EMBnet.journal (2011) 17(1):3. doi: 10.14806/ej.17.1.200
22. Lefèvre E, Gardner CM, Gunsch CK. A novel PCR clamping assay reducing plant host DNA amplification significantly improves prokaryotic endo-microbiome community characterization. FEMS Microbiol Ecol (2020) 96. doi: 10.1093/femsec/fiaa110
23. Yilmaz P, Parfrey LW, Yarza P, Gerken J, Pruesse E, Quast C, et al. The SILVA and “All-species living tree project (LTP)” taxonomic frameworks. Nucleic Acids Res (2014) 42(Database issue):D643–8. doi: 10.1093/nar/gkt1209
24. Curtis D, Elango V, Collins AW, Rodrigue M, Pardue JH. Transport of crude oil and associated microbial populations by washover events on coastal headland beaches. Mar pollut Bull (2018) 130:229–39. doi: 10.1016/j.marpolbul.2018.03.008
25. R Core Team. R: A language and environment for statistical computing (2020). Available at: https://www.R-project.org/.
26. Wickham H, Averick M, Bryan J, Chang W, McGowan LDA, François R, et al. Welcome to the tidyverse. J Open Source Software (2019) 4(43):1686. doi: 10.21105/joss.01686
27. Wilke CO. Cowplot: Streamlined plot theme and plot annotations for 'ggplot2 (2020). Available at: https://CRAN.R-project.org/package=cowplot.
28. van den Boogaart KG, Tolosana-Delgado R, Bren M. Compositions: Compositional data analysis (2020). Available at: https://CRAN.R-project.org/package=compositions.
29. McMurdie PJ, Holmes S. Phyloseq: An r package for reproducible interactive analysis and graphics of microbiome census data. PloS One (2013) 8(4):e61217. doi: 10.1371/journal.pone.0061217
30. Oksanen J, Blanchet FG, Friendly M, Kindt R, Legendre P, McGlinn D, et al. Vegan: Community ecology package (2016). Available at: https://CRAN.R-project.org/package=vegan.
32. Bürkner P-C. Brms: An r package for Bayesian multilevel models using Stan. J Stat Software (2017) 80(1):28. doi: 10.18637/jss.v080.i01
33. Carpenter B, Gelman A, Hoffman MD, Lee D, Goodrich B, Betancourt M, et al. Stan: A probabilistic programming language. J Stat Software (2017) 76(1):32. doi: 10.18637/jss.v076.i01
34. Rodrigue M, Elango V, Curtis D, Collins AW, Pardue JH. Biodegradation of MC252 polycyclic aromatic hydrocarbons and alkanes in two coastal wetlands. Mar pollut Bull (2020) 157:111319. doi: 10.1016/j.marpolbul.2020.111319
35. Head IM, Jones DM, Röling WFM. Marine microorganisms make a meal of oil. Nat Rev Microbiol (2006) 4(3):173–82. doi: 10.1038/nrmicro1348
36. Tarr M, Zito P, Overton B. E, Olson M. G, Adhikari L. P, Reddy M. Weathering of oil spilled in the marine environment. Oceanography (2016) 29(3):126–35. doi: 10.5670/oceanog.2016.77
37. Collins AW, Elango V, Curtis D, Rodrigue M, Pardue J. Biogeochemical controls on biodegradation of buried oil along a coastal headland beach. Mar pollut Bull (2020) 154:111051. doi: 10.1016/j.marpolbul.2020.111051
38. Mendelssohn IA, McKee KL, Patrick WH Jr. Oxygen deficiency in Spartina alterniflora roots: Metabolic adaptation to anoxia. Science (1981) 214(4519):439–41. doi: 10.1126/science.214.4519.439
39. Koop-Jakobsen K, Mueller P, Meier RJ, Liebsch G, Jensen K. Plant-sediment interactions in salt marshes - an optode imaging study of O2, pH, and CO 2 gradients in the rhizosphere. Front Plant Sci (2018) 9:541. doi: 10.3389/fpls.2018.00541
40. Haritash AK, Kaushik CP. Biodegradation aspects of polycyclic aromatic hydrocarbons (PAHs): A review. J Hazardous Materials (2009) 169(1):1–15. doi: 10.1016/j.jhazmat.2009.03.137
41. Mesa-Marin J, Barcia-Piedras JM, Mateos-Naranjo E, Cox L, Real M, Perez-Romero JA, et al. Soil phenanthrene phytoremediation capacity in bacteria-assisted Spartina densiflora. Ecotoxicol Environ Saf (2019) 182:109382. doi: 10.1016/j.ecoenv.2019.109382
42. Watts AW, Ballestero TP, Gardner KH. Uptake of polycyclic aromatic hydrocarbons (PAHs) in salt marsh plants Spartina alterniflora grown in contaminated sediments. Chemosphere (2006) 62(8):1253–60. doi: 10.1016/j.chemosphere.2005.07.006
43. Hughes AR, Cebrian J, Heck K, Goff J, Hanley TC, Scheffel W, et al. Effects of oil exposure, plant species composition, and plant genotypic diversity on salt marsh and mangrove assemblages. Ecosphere (2018) 9(4):e02207. doi: 10.1002/ecs2.2207
44. DeLaune RD, Patrick WH, Buresh RJ. Effect of crude oil on a Louisiana Spartina alterniflora salt marsh. Environ pollut (1979) 20(1):21–31. doi: 10.1016/0013-9327(79)90050-8
45. Pezeshki SR, Hester MW, Lin Q, Nyman JA. The effects of oil spill and clean-up on dominant US gulf coast marsh macrophytes: a review. Environ pollut (2000) 108(2):129–39. doi: 10.1016/S0269-7491(99)00244-4
46. Lin Q, Mendelssohn IA. A comparative investigation of the effects of south Louisiana crude oil on the vegetation of fresh, brackish and salt marshes. Mar pollut Bull (1996) 32(2):202–9. doi: 10.1016/0025-326X(95)00118-7
47. Lin Q, Mendelssohn IA. Potential of restoration and phytoremediation with Juncus roemerianus for diesel-contaminated coastal wetlands. Ecol Eng (2009) 35(1):85–91. doi: 10.1016/j.ecoleng.2008.09.010
48. Lin Q, Mendelssohn IA. Impacts and recovery of the deepwater horizon oil spill on vegetation structure and function of coastal salt marshes in the northern gulf of Mexico. Environ Sci Technol (2012) 46(7):3737–43. doi: 10.1021/es203552p
49. Rodriguez RJ, Henson J, Van Volkenburgh E, Hoy M, Wright L, Beckwith F, et al. Stress tolerance in plants via habitat-adapted symbiosis. ISME J (2008) 2(4):404–16. doi: 10.1038/ismej.2007.106
50. Mohammad Y. Uptake and deposition of pyrogenic and petrogenic PAHs on spartina alterniflora. (Baton Rouge, LA USA: Louisiana State University) (2014).
51. Kassenga JG. Cuticle accumulation of petrogenic PAHs on spartina alterniflora: A novel exposure pathway for marsh biota. (Baton Rouge, LA USA: LSU) (2017).
52. Sebastian KJ. Visualizing the fate and distribution of PAHs in spartina and avicennia tissues from barataria basin, LA. (Baton Rouge, LA USA: Louisiana State University) (2019).
53. Compant S, Samad A, Faist H, Sessitsch A. A review on the plant microbiome: Ecology, functions, and emerging trends in microbial application. J Adv Res (2019) 19:29–37. doi: 10.1016/j.jare.2019.03.004
54. Mendelssohn IA, Andersen GL, Baltz DM, Caffey RH, Carman KR, Fleeger JW, et al. Oil impacts on coastal wetlands: Implications for the Mississippi river delta ecosystem after the deepwater horizon oil spill. BioScience (2012) 62(6):562–74. doi: 10.1525/bio.2012.62.6.7
55. Fernandes AD, Reid JN, Macklaim JM, McMurrough TA, Edgell DR, Gloor GB. Unifying the analysis of high-throughput sequencing datasets: characterizing RNA-seq, 16S rRNA gene sequencing and selective growth experiments by compositional data analysis. Microbiome (2014) 2:15. doi: 10.1186/2049-2618-2-15
56. Fernandes AD, Macklaim JM, Linn TG, Reid G, Gloor GB. ANOVA-like differential expression (ALDEx) analysis for mixed population RNA-seq. PloS One (2013) 8(7):e67019. doi: 10.1371/journal.pone.0067019
57. Liu Y, Zhou J, White KP. RNA-Seq differential expression studies: more sequence or more replication? Bioinformatics (2014) 30(3):301–4. doi: 10.1093/bioinformatics/btt688
Keywords: Spartina alterniflora, deepwater horizon, salt marsh, microbiome, polycyclic aromatic hydrocarbons, endophytes
Citation: Formel SK, Martin AM, Pardue JH, Elango V, Johnson K, Gunsch CK, Lefèvre E, Varner PM, Kim YJ, Bernik BM and Van Bael SA (2022) Decay of oil residues in the soil is enhanced by the presence of Spartina alterniflora, with no additional effect from microbiome manipulation. Front. Soil Sci. 2:949439. doi: 10.3389/fsoil.2022.949439
Received: 23 May 2022; Accepted: 29 November 2022;
Published: 19 December 2022.
Edited by:
Naser A. Anjum, Aligarh Muslim University, IndiaReviewed by:
Xiu Jia, University of Groningen, NetherlandsLuis Gabriel Cueva-Yesquén, State University of Campinas, Brazil
Copyright © 2022 Formel, Martin, Pardue, Elango, Johnson, Gunsch, Lefèvre, Varner, Kim, Bernik and Van Bael. This is an open-access article distributed under the terms of the Creative Commons Attribution License (CC BY). The use, distribution or reproduction in other forums is permitted, provided the original author(s) and the copyright owner(s) are credited and that the original publication in this journal is cited, in accordance with accepted academic practice. No use, distribution or reproduction is permitted which does not comply with these terms.
*Correspondence: Sunshine A. Van Bael, c3ZhbmJhZWxAdHVsYW5lLmVkdQ==