 Maximilian Rötzer
 Alexander Prechtel
 Nadja Ray
- 1Mathematics Department, Friedrich-Alexander-Universität Erlangen-Nürnberg (FAU), Erlangen, Bavaria, Germany
- 2Mathematical Institute for Machine Learning and Data Science, Catholic University of Eichstätt-Ingolstadt, Ingolstadt, Bavaria, Germany
Investigating plant/root-soil interactions at different scales is crucial to advance the understanding of soil structure formation in the rhizosphere. To better comprehend the underlying interwoven processes an explicit, fully dynamic spatial and image-based modeling at the pore scale is a promising tool especially taking into account experimental limitations. We develop a modeling tool to investigate how soil aggregation, root growth and root exudates mutually interact with each other at the micro-scale. This allows the simultaneous simulation of the dynamic rearrangement of soil particles, the input and turnover of particulate organic matter, root growth and decay as well as the deposition, redistribution and decomposition of mucilage in the rhizosphere. The interactions are realized within a cellular automaton framework. The most stable configuration is determined by the amount and attractiveness of surface contacts between the particles, where organo-mineral associations preferably lead to the formation of soil aggregates. Their break-up can be induced by root growth or the degradation of gluing agents previously created after the decomposition of particulate organic matter and mucilage. We illustrate the capability of our model by simulating a full life cycle of a fine root in a two-dimensional, horizontal cross section through the soil. We evaluate various scenarios to identify the role of different drivers such as soil texture and mucilage. We quantify the displacement intensity of individual particles and the variations in local porosity due to the change in available pore space as influenced by the root growth and observe compaction, gap formation and a biopore evolution. The simulation results support that the deposition of mucilage is an important driver for structure formation in the rhizosphere. Although mucilage is degraded within a few days after exudation, it leads to a persistent stabilization of the aggregated structures for both textures in the vicinity of the root within a time frame of 1000 days. Local porosity changes are quantified for exudation periods of 1, 10 and 100 days and are already pronounced for short-term exudation of mucilage. This stabilization is significantly different from the structures encountered when only POM could trigger the evolution of gluing spots, and is still present after complete degradation of the root.
1 Introduction
Root-soil interactions are crucial for many ecosystem functions, e.g. water and carbon fluxes, the microbial habitat, plant productivity, or soil structure formation. The advancement of experimental technologies delivers new information and insight down to the nm scale of the rhizosphere (1, 2). Despite this progress, experimental methods are still limited, e.g., when it comes to dynamic imaging. A first attempt to overcome this drawback is presented in (3), where the micro-scale interaction between a growing plant root and soil was imaged for different time lapses. Moreover, high resolution scans are restricted to small sample sizes, and still not all components (e.g. soil water and root exudates as mucilage), can be distinguished from each other (e.g. in X-ray computed tomography (CT) images), because their density is similar (4). Consequently, the experimental methods need to be accompanied by novel, mechanistic models to understand the fully dynamic evolution of the soil structure and rhizosphere processes, which are intimately intervowen (2, 5, 6). Schnepf et al. (6) presented several case studies at the field, single root and pore scale to demonstrate how the current advances in modelling and experimental methods can help to unravel the importance and interconnectedness of rhizosphere processes, among them soil carbon storage and transformation by microorganisms, nutrient or water uptake.
To improve the understanding of soil structure dynamics, it is essential to investigate the drivers and related processes at the micrometer scale in a temporally and spatially explicit way (7–9). Six et al. (10) identified that soil fauna, microorganisms, roots, inorganics, and physical processes influence the dynamics, stability, and structure of soil microaggregates, which are considered the main building blocks of almost all soils (11). Totsche et al. (11) stated that the microbial turnover of organic matter (OM), the subsequent formation of gluing agents and the build-up of organo-mineral associations are the major aspect in soil structure formation.
The variability in soil structure as a consequence of the self-organization of soil aggregates was first modeled by (12) and pursued further, e.g. in (13). The authors simulated aggregate formation as a function of binding agents (chemical bonding, and binding by microbial products and fungi) with the help of Monte-Carlo techniques. Ray et al. (14) and Rupp et al. (15) developed a comprehensive toolbox to model and simulate aggregate formation in a spatially and temporally explicit way. They use a cellular automaton method (CAM) which is a powerful approach to model phenomena (such as redistribution or spreading of entities) that are very difficult to include in e.g., a differential equation setting. Its richness and interest comes from the transition rules which, in general, have a physical or intuitive interpretation directly at the level of entities termed cells (16). Phenomena as phase transitions, fluid flow, population dynamics or wild fire have been successfully modelled with the help of CAM, and Lattice-Boltzmann methods can be seen as extension of them (16). In the context of soil science the interaction of particles due to electric forces or organo-mineral associations can be an object of study. In such a CAM setting, Rupp et al. (17) investigated the aggregation of prototypes of goethite, illite, and quartz with diameters of 3-41 μm. It was shown that the size of the interacting oppositely charged constituents controls the size, shape, and amount of aggregates formed and that the aggregation rate increases with particle concentration. The impact of size, aspect ratio, differences in surface charge, and mixing ratio on the homo- and hetero-aggregation of illite and goethite as well as the resulting structure and stability was investigated in (18).
In the past, the impact of OM turnover on aggregation was widely investigated by pool models including lumped parameters. Such models are not capable to include the micro-scale, at which biological decomposition processes occur. Consequently, it was pointed out in recent reviews (8, 19, 20) that explicit spatial and image-based modeling at the pore scale is fundamental to examine the interaction between architecture, soil microbial activity and OM turnover. Portell et al. (21), e.g., considered an individual-based pore scale model. In this research, the authors used CT scans of natural soils to study the effects of heterogeneously distributed organic matter on three different strains of bacteria at the mm scale. In (22, 23), biofilm growth at the pore scale was investigated in a cellular automaton framework. Building upon the previous studies, Zech et al. (18) investigated the role of connectivity for the local and global CO2 output due to the hydrolysis of particulate organic matter (POM) and bacteria dynamics in unsaturated, heterogeneous micro-aggregates. Finally, combining the previous attempts enabled quantifying the simultaneous structure formation/disaggregation and OM turnover. In (24), the drivers texture, decomposition rate, and OM input were evaluated. It was revealed that the addition of fresh organic matter to soil may induce a short-term primed decomposition of native OM due to the creation of new gluing joints leading to the simultaneous break-up of old gluing joints and the subsequent decomposition of older POM.
Specifically in the rhizosphere or the rooted subsoil mucilage represents another important and easily accessible carbon source (25). Although the impact of mucilage on soil aggregation was recognized decades ago (25–29), its quantification in natural soils remains difficult (30). The deposition of mucilage via the root surface can be experimentally determined by separating the substances by mechanical (31) and/or thermal processes (32). Many experiments artificially inject water/mucilage mixtures in soils (4, 33, 34) creating a homogeneous distribution compared to the spatial patterns that stem from the heterogeneous exudation at root tips. Others used simplified laboratory settings to investigate physical properties, e.g. Williams et al. (35) studied liquid bridge formation between plates on the pore scale in different water-mucilage mixtures. Recently Landl et al. (36) analyzed rhizodeposition patterns with the help of simulations at the plant scale, but not dealing with the pore scale explicitly. Amelung et al. (37) reported an initial aggregate stabilization by extracellular polymeric substances, but also a quick loss of organic gluing agents in a pot experiment with multiple stable isotope tracers of organic and mineral binding agents. Another study combining rare earth oxide tracers with 13C-CO2 labeling differentiated soil-derived from root-derived OC and concluded that roots can be a key factor accelerating aggregate turnover and OC decomposition (38). Traoré et al. (29) emphasized the importance of the exudates which are easily available to microorganisms, and also the microbial products originating from the materials released by roots to stabilize soil aggregates. Also Vidal et al. (39) provided evidence of the transfer of carbon from plants to exudates, microbes and stabilizing agents with the help of stable isotope labelling and high-resolution imaging. This indicates that the strong impact of plant roots and their exudates on aggregate build-up deserves further investigations, also with the help of spatially explicit modeling approaches at the micro-scale.
Finally, the role of the root itself for aggregation and vice versa is vital. The impact of the extension and degradation of roots on the local porosity has been investigated in several studies, e.g. (40, 41). The interplay of compaction and increased porosity was observed in the vicinity of roots, whose effects remained difficult to quantify (41–45). Koebernick et al. (46) analyzed pore size frequencies on the basis of high-resolution images of a sandy loam and observed increased frequencies of smaller pores close to the root surface, which have also been reported by (47) for fine root systems. Koebernick et al. (44, 46) also observed higher porosities in the annulus closest to the root, explained by a surface/wall effect. Equally, Phalempin et al. (48) showed imperfect root/soil contacts. The impact of such porosity changes on root water uptake and the hydraulic properties in the rhizosphere was focused on in (43, 49, 50) exploring X-ray CT analyses and including numerical models. Finally, sophisticated modeling approaches taking explicitly into account the deformation of soil particles based on detailed considerations of mechanics and elasticity were presented in (51, 52). Ruiz et al. (51) estimated the energy needed for soil penetration by earthworms or growing roots considering the soil as an elasto-plastic medium. A first attempt to transfer results to a larger scale is found in (52), where poro-elastic equations were scaled up to investigate compaction. However, in general, the development of functional root-architecture models concentrates mainly on the plant scale, and interactions with the soil are limited to resource supply [cf. the reviews (20, 53)]. The inclusion of structural properties of soils are - if any - often restricted to impedance factors that affect root growth rates and/or directions (53–55) because the scales these processes occur are too small. To our knowledge none of the state-of-the-art functional root-soil models do consider aggregation or contain explicit, dynamic pore geometries (6, 20, 53).
In this research, we open the way to simultaneously investigate structural dynamics and OM/mucilage turnover during a root’s life cycle. We address the interaction of carbon input in particular by POM and mucilage and their degradation with soil re-structuring in the rhizosphere. Moreover, we incorporate the root growth and shrinking explicitly into the model. Thereby the focus lies less on developing a functional root model, but on presenting a tool to investigate the impact of compaction on soil structure evolution at the level of soil aggregates.
In Section 2, we introduce the underlying mathematical/computational model and assumptions, as well as its parametrization. In particular we present the novel root growth and mucilage dynamics. Moreover, we define measures to quantitatively evaluate the outcome of the various simulation scenarios, which are specified in Section 2.3. We consider two textures with 18% and 33% clay content, respectively, and compare structure formation in- or excluding root exudation during a time span of 1000 days (Section 3). In Section 4, we discuss the results obtained and outline directions of further research.
2 Materials and methods
2.1 Conceptual and mathematical model
We build upon the model presented in (24), who introduced a process-based, spatially and temporally explicit micro-scale model that describes the interaction between the dynamic re-arrangement of soil aggregates, the turnover of particulate organic matter (POM) and simultaneous alteration of the surface properties of particles. It takes reactive surface sites into account, the production of gluing agents by microbial degradation of OM, and the influence of the spatial accessibility of OM on its degradation rates. It is realized in the framework of a cellular automaton method (CAM) which extends the work of (14, 17).
Within the CAM, the computational domain is discretized into pixels to which different states are assigned such as solid, POM, pore, root, or mucilage, see Figure 1. Likewise edges of different type can be defined. The solid phase consists of water-stable, inseparable primary soil particles and aggregates (see Section 2.1.1). As a first estimate, the pore space is assumed to be locally saturated or occupied by mucilage. Thus we do not consider swelling or shrinkage of clay over time due to wetting or drying. With increasing size, a decreasing fraction of the solid building units’ surfaces is marked as reactive. At these reactive surfaces, POM particles may attach preferably undergoing microbial degradation (56). The concept of reactive edges thus includes gluing spots originating from microbial remnants and occurring on temporary OM covered mineral surfaces which enhance the formation of aggregates (57). As this surface conditioning of mineral surfaces by organic compounds may be locally retained even after degradation of the OM coating (58), the term memory edges for mineral surface edges after degradation of OM has been introduced in (24). For more details on the conceptual model we refer to the Supplementary Material (24, 59).
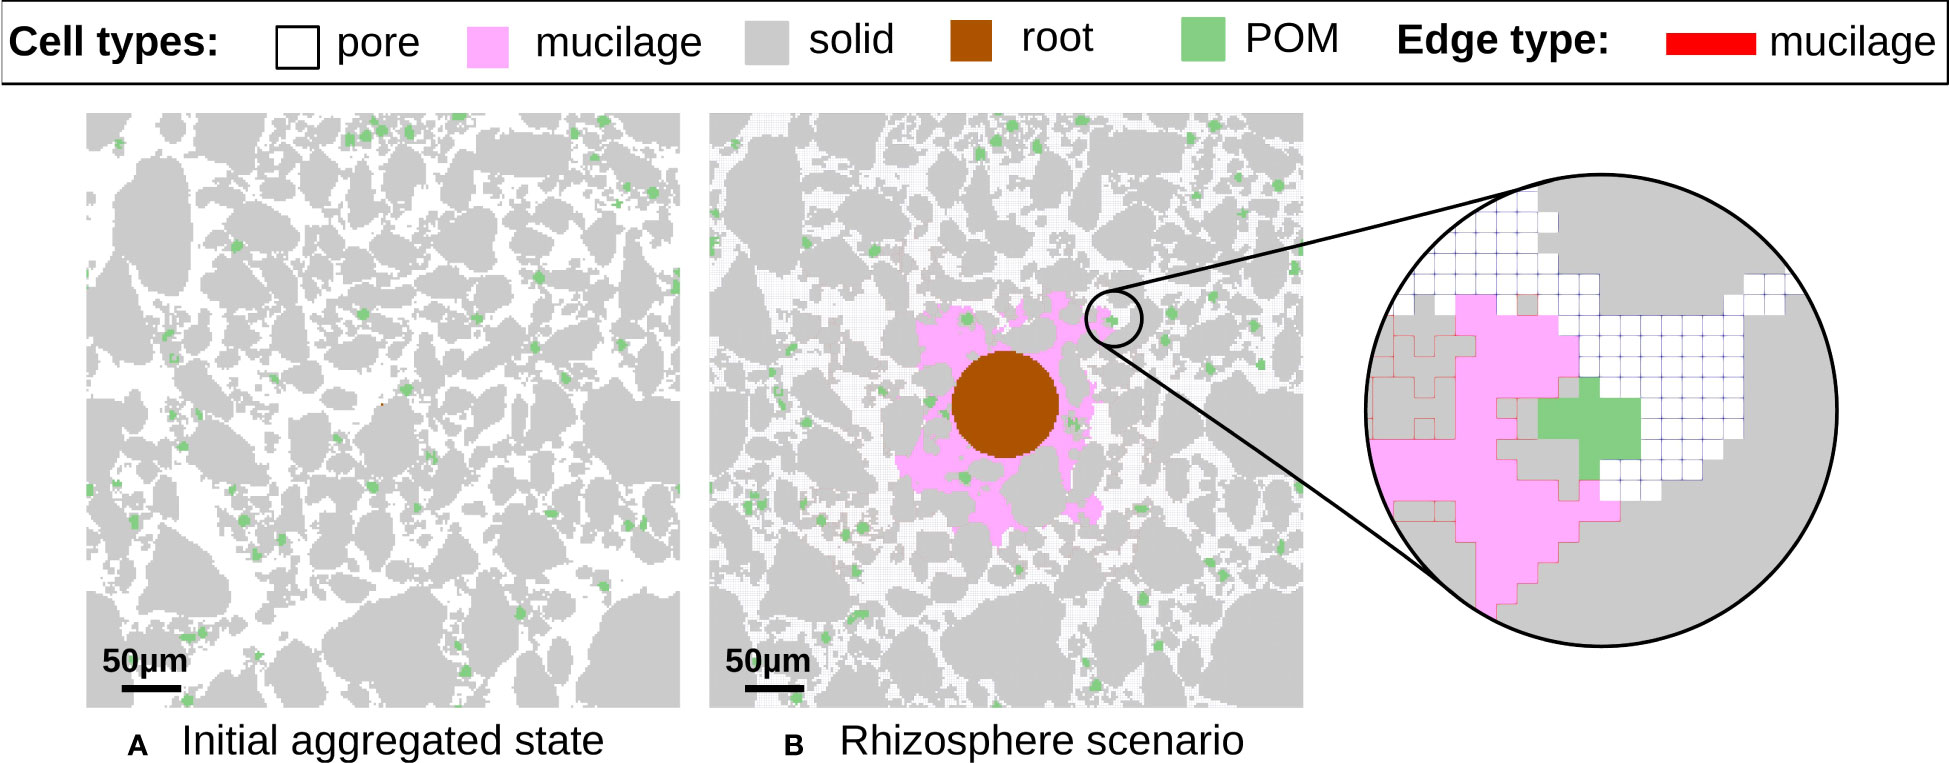
Figure 1 Concept of the 2D discretized computational domain containing 250x250 pixels with a resolution of 2 μm for investigating the interwoven processes between different cell types such as solid (gray), POM (green), pore (white), root (brown) or mucilage (pink). (A) Initial aggregated state. (B) Rhizosphere scenario. The reactive and memory edges originating from microbial degradation of mucilage and subsequent formation of gluing agents are colored red. Mineral specific and POM induced reactive edges are not color coded in the image to focus on the additional influence of mucilage.
In this research, we extend the previous model to incorporate the effects of root exudates and the interaction between soil and a growing/shrinking root. The developed model allows for the reorganisation of solid building units depending on the available pore space as influenced by root growth and the altering attractive surface properties which are influenced by input of fresh organic matter by means of POM and mucilage in the system. The workflow is outlined in Figure 2 and the detailed mechanisms outlined therein are further discussed in Section 2.1.1–2.1.5 below. After the creation of an initial, aggregated state built up from water-stable building units (see Section 2.1.1), we simulate for up to 1000 days the interaction of soil constituents with a root, which is growing for 100 days and shrinking thereafter (Section 2.1.2). In particular the turnover of POM, the formation and break-up of micro-aggregates, and the exudation, distribution and degradation of mucilage (Section 2.1.3) is taken into account.
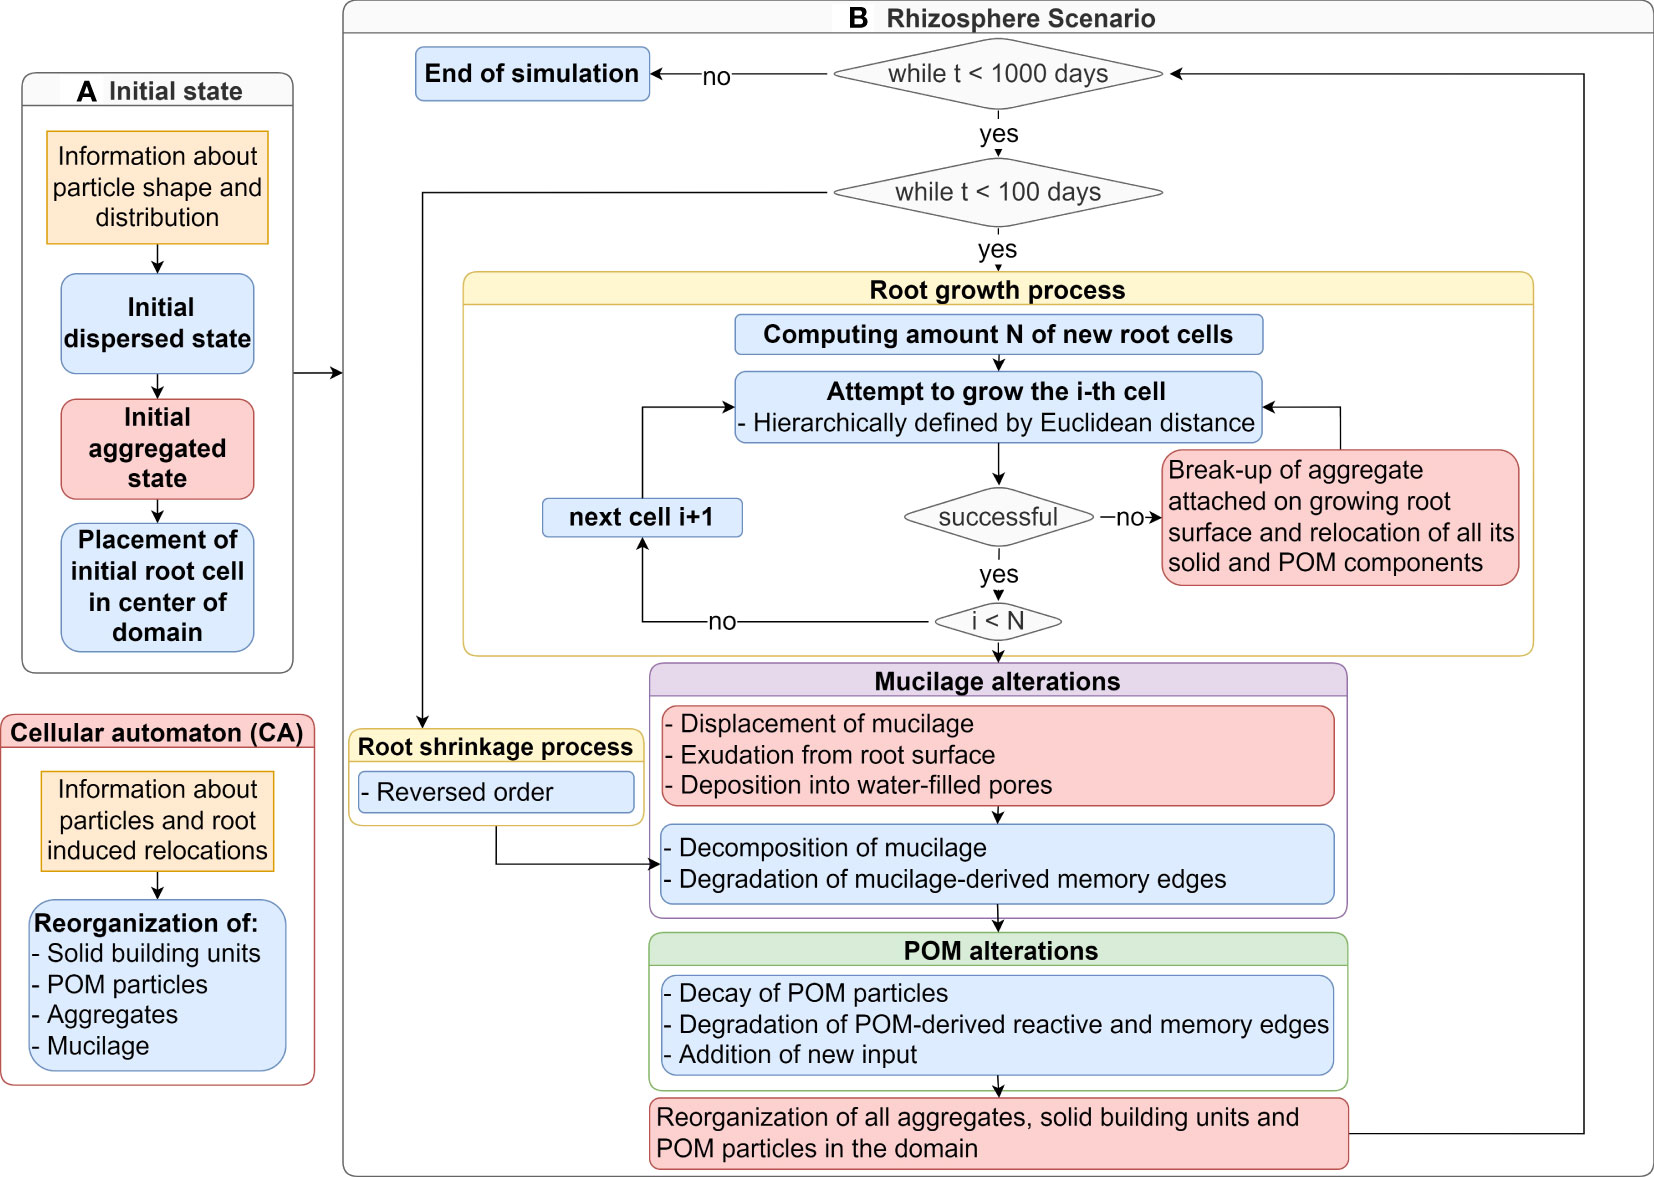
Figure 2 Flowchart of the computational model simulating an initial aggregated state (A) and a subsequent rhizosphere scenario (B) for a time span of 1000 days: The cellular automaton (red) realizes in every time step the relocation of particles in soil including root dynamics and mucilage. The root growth step (yellow) is followed by mucilage alterations (purple) and POM distribution (green). The detailed mechanisms are explained in Section 2.
2.1.1 Set-up of initial aggregated soil with POM
For our investigations, we considered a horizontal cross section through the soil and choose the two-dimensional computational domain to have a size of 500 × 500 μm2 (250 × 250 pixels with a resolution of 2 μm). The initial dispersed state was created by distributing solid building units < 250 μm and POM particles randomly within the computational domain according to a given particle size distribution, for a solid phase fraction of 35% and POM amounting to 2% of the solid area. A collection of particle shapes and size distributions were obtained from dynamic image analysis of wet-sieved soil fractions of an arable Cambiosol with a range of clay contents (60). The proposed classification of soil particles by their Feret diameter enables investigating soil textures of 18% and 33% clay content as described in (24). Low-clay soils contain more sand-sized particles, while in high-clay soils the fraction of small particles is higher. The importance of clay particles for aggregation is modeled by assigning 100% of the surface of fine silt and clay-sized particles (< 6.3 μm) as reactive edges. For sand-sized particles (> 63 μm) 10% of the surface is set as reactive, while for coarse silt-sized (> 20 μm, < 63 μm) 25% and for medium silt-sized (> 6.3 μm,< 20 μm) a share of 50% is chosen. Further properties of the particles such as elastic properties are disregarded since this is beyond the current scope of the study. Finally, POM particles of size 6-10 μm in diameter were added at random free pore spots to the system. Solid building units and POM particles can then relocate due to their mutual attraction to obtain an initial aggregated state (see Figure 1A for the soil with high clay content). This was realized by a Cellular Automaton method (CAM) following (17, 24), which is briefly recaptured after the explanation of the novel model components in Section 2.1.5. There we describe the rules for relocating particles within the computational domain.
2.1.2 Root growth and shrinkage
Starting from this initial aggregated state, a fine primary root starts to grow perpendicular into the 2D domain reshaping the soil structure in the rhizosphere. Due to this setting the root’s cross-section with the radius R is visible in our simulations, see e.g. Section 3.2. At initial time t0 = 0 d, the root has radius R0 = 1 μm and is represented by a single pixel in the center of the computational domain. In general, plants first invest in root elongation, and later in root thickening, but the dynamics of cambial, secondary root growth is still poorly understood and a function of complex interactions of biotic and abiotic factors (61) which are beyond the scope of this research. Thamm et al. (62) present a model accounting for an exponential growth process for Arabidopsis. While the implementation of alternative rates is straightforward, we model root growth by a first-order rate that matches a growth period of 100 days leading to an exponential root growth:
with rate coefficient . This results in a fully grown fine root with a maximum radius of μm.
After 100 days the root radius again shrinks exponentially according to a first-order kinetics. As functional root models focus on the development of the architecture, model data on root degradation are scarce and focus on shorter time scales or are subject to parameter fitting, see, e.g. (63, 64). We assume the rate coefficient to be , i.e. the root shrinks for 388 days until it has again reached its initial radius R0 (see Table 1 for an overview of the parameters).
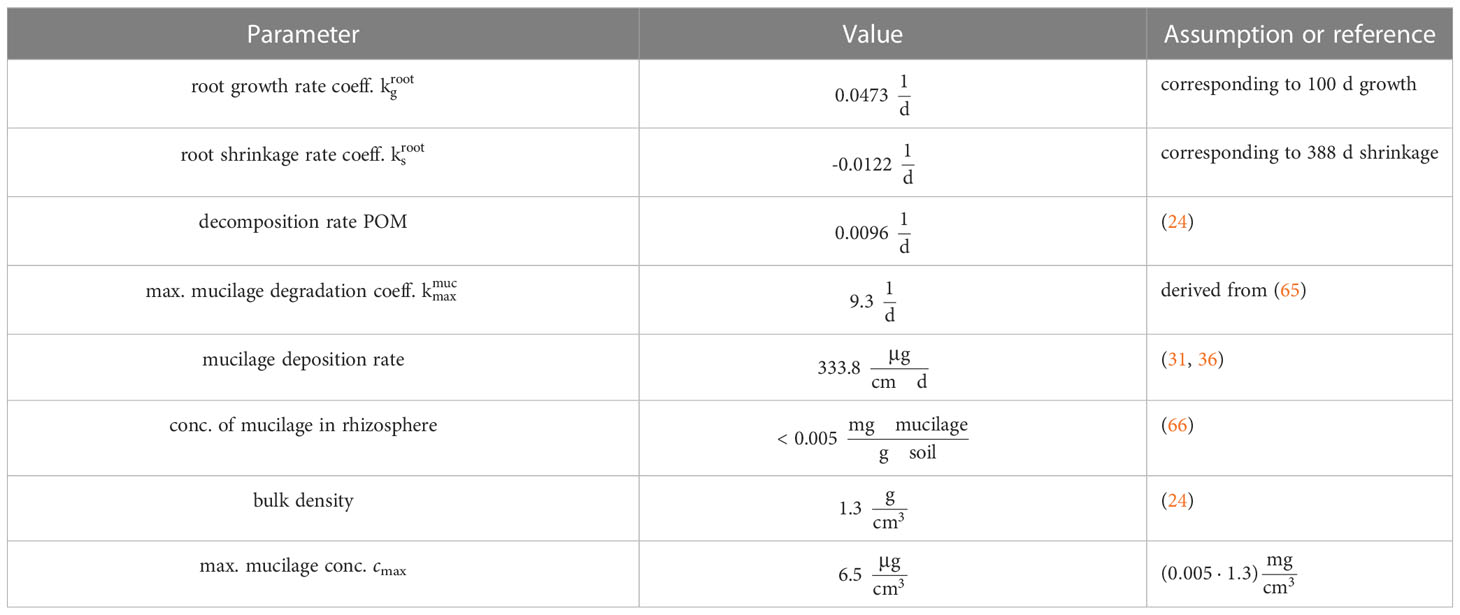
Table 1 Parametrization of the model.
This root growth/shrinkage is computationally realized as follows: We assume that the root center is static, i.e. the initial root pixel is considered as the central reference point. During the growth period, a certain amount of pixels neighboring the current root surface is successively assigned as new root cells according to the growth rate (1). Those candidates, where the root could expand, are then hierarchically evaluated. The order is defined by the Euclidean distance of the candidates to the reference central point. Starting with the pixel closest to the root center, the potential root growth is investigated. Growing into the pore space i.e. changing the pixel from pore to root type can be done without any conflict and the next candidate is investigated. The same applies to the growth into the mucilage phase, which, however, implies an additional transfer of mucilage to adjacent pore/mucilage cells, as described in Section 2.1.3. However, if the assigned new root pixel belongs to either solid or POM, the growth cannot be realized directly, since first a directed relocation of the related particle is necessary, see Section 2.1.5. Likewise, the shrinkage of the root is realized and the latest pixel which altered from pore to root type, will be the first one to alter from root to pore type.
Note that, during root growth and shrinkage, the amount of solid particles is not changed. However, particles dynamically relocate within the rhizosphere.
2.1.3 Mucilage dynamics
Due to the simultaneous exudation of mucilage from the root surface and its distribution into the soil, the dynamical re-structuring of the soil structure including surface alterations of soil particles is facilitated. For a conceptual illustration of the modeling of the mucilage phase, we refer to the Supplementary Material (59). We treat the gel-like mucilage/water mixture as a separate phase, which we term mucilage for the ease of presentation.
In (36) the deposition rate of mucilage was determined following (31) per day and root tip as . Since the apical area, which contributes to the deposition process, is in the range of millimeters (67), we assume the root tip to have a size of 1 mm in the longitudinal direction. This results in a constant mucilage deposition rate of . More precisely, the younger and therefore smaller the root cross-section is, the more mucilage is exuded per surface area. Landl et al. (36) assume a constant rhizodeposition rate as long as the root grows, which is a time span of 100 days in our simulations. For comparison we include scenarios with exudation for t = 1 d and t = 10 d to study the influence of mucilage deposition and degradation on aggregate stability.
Next, we describe how the deposited mucilage is distributed into the rhizosphere. We remark that within the distinct mucilage phase variable mucilage concentrations may be represented. However, modelling this distribution by solving a transport equation is not necessary due to its fast decomposition and the high viscosity and gel-like nature of the phase. Its potential changes are not taken into account explicitly. Instead, the distribution is realized by obeying mass balance as outlined below. Moreover, we do not consider shrinking or swelling of mucilage due to drying or re-wetting of the soil at this point. Holz et al. (66) derived a maximum mucilage concentration of 0.005 mg dry mucilage per g dry soil in the rhizosphere. With a bulk density of 1.3 , we consequently assume a maximum mucilage concentration of . Due to root growth and (potentially induced) particle movement, mucilage might have to be displaced according to mass conservation. Then, the amount of displaced mucilage is transferred into the closest pixel of type mucilage or pore and potentially further redistributed thereafter. If due to either of the previously described processes or the mucilage deposition from the root surface, the mucilage concentration in a pixel exceeds the maximum concentration , mucilage will be distributed further to the closest neighboring pore or mucilage cell, in which the threshold is not yet reached. Thereby, the closest pixel is determined by searching the shortest path through the mucilage phase. Simultaneously, mucilage is decomposed with a first-order rate , if it has at least one edge adjacent to the pore space which we assume to be water saturated. More precisely, the more occluded mucilage is, the slower it is degraded. This takes into account that the contact to oxygen, which is dissolved in water in the pore space and diffuses only very slowly within mucilage, is necessary for the decomposing microbial community. The maximum rate coefficient is therefore reduced by a relative occlusion factor a as follows
with depending on the number of edges shared with the pore space, i.e. the relative decomposition decreases by 25% for each neighboring pixel, which is not of pore type. If a mucilage pixel is, for instance, fully surrounded (by four direct neighbors of type root, POM or solid) the local decomposition rate is zero. With complete accessibility to the pore space, the mucilage decomposes at maximum rate .
Literature on degradation rates of mucilage in soils is scarce, also due to the aforementioned difficulties of visualization and quantification of mucilage in natural porous media. Van Velen et al. (4) analyzed the decomposition of Chia seed mucilage in artificial, packed media with correlative imaging techniques and reported degradation rates of 0.48 and 0.312 . Landl et al. (36) used in their simulations of decomposition, based on maize root mucilage experiments of (65). Therein a first-order decomposition rate was experimentally estimated within a real soil. In summary, a quite high decomposition rate is observed leading to a fast mucilage decay with half-life time of around three days. For our simulation scenarios, we consequently choose the maximum rate coefficient such that the maximum possible amount of mucilage which is accessible from the pore space is decomposed in each time step. Therefore, the concentration of a mucilage cell decomposing with at least an occlusion factor of should decrease from the maximum threshold to a value below 10% of within one day. Below this minimum threshold the type of the cell will turn into pore space, while the corresponding mucilage concentration is set to zero. With these assumptions the value is deduced.
The exudation of mucilage supplies additional carbon in the system, which is rapidly degraded by microbes and enhances the production of gluing agents distributed onto the solid phase. So the respective edges between solid and mucilage phase are turned into reactive edges and therefore increase the share of reactive edges which further facilitates the creation of stable structural units. After the mucilage is degraded, the reactive edges turn into so-called memory edges. These still have the potential to glue particles together, but they underlie an aging process. At the earliest after 50 days and with a probability of 0.2 % the memory edges are randomly removed following (24). Although the model does not treat gluing joints (reactive or memory edges) originating from mucilage degradation different from those originating from POM degradation (see Section 2.1.4) we highlight the mucilage derived edges in red to track them specifically in the presented figures.
2.1.4 POM addition and turnover
Finally, POM particles with a Feret diameter of 6 -10 μm are added to the system at random pore spots in every 10th timestep (day). POM can relocate by the CAM as outlined below in Section 2.1.5 and is simultaneously decomposed after it has been attached to the solid phase with a first-order rate with rate coefficient 0.0096 , cf (57), i.e. 100 times slower than mucilage. Similarly to the decomposition of mucilage, the POM decomposition rate depends on the surface that POM particles share with the pore space, i.e. the more occluded a POM particle is, the slower it is degraded, cf. the reduction factor a in (2). During degradation a gluing agent is produced which could spread along the solid surface as described in (24) and thereby alter the surface properties, i.e. turn edges into reactive edges. However, also the gluing agent is decaying until the respective edges turn into memory edges. The POM-induced memory edges underlie the same aging process as the memory edges induced by mucilage (see Section 2.1.3), which finally leads to the loss of attractive surface properties. Details on the POM turnover and an illustration of the conceptual modeling can be found in (24) and relevant parts are likewise added to the Supplementary Material of this paper (59).
2.1.5 Cellular automaton method
The basic principle of a CAM is the application of rules for the transformation or relocation of cells in every time step. In our study this includes growth and shrinkage of the root, the addition and turnover of POM and the exudation, distribution, and decomposition of mucilage as well as altering surface properties eventually leading to dynamically changing soil structures, recall Figure 1. We adapted the CAM from (24) to evaluate this dynamic restructuring. In every time step, aggregates of solid building units and POM particles, separate solid building units, and POM particles relocate to achieve the most attractive and stable configuration in the changing pore space. The range of potential movement is increased with decreasing size as small particles are more mobile than large particles/aggregates. It is defined as follows:
where denotes the ceiling function (smallest integer larger or equal than the argument). Following the Stokes-Einstein relation for diffusion of spherical particles in a liquid and the reasoning of (17), the stencil represents the range of Brownian motion, and hence, the mean displacement being equivalent to the expected mean path length is proportional to the effective radius ( with area being the area of the particle) of the building unit or aggregate. This resulted in stencil sizes between 10, i.e. 5 pixels, for entities smaller than 100 μm2 to 2 μm, i.e.1 pixel, for entities with an area between 1,600 μm2 and 80,000 μm2. For larger aggregates, the stencil is set to 0. The attractiveness of a position is determined based on the amount of surface contacts with reactive and memory edges, with the following hierarchy: solid-solid contacts via reactive surface edges or memory edges were considered the least attractive, contacts of POM to reactive solid edges were considered more attractive, and contacts of POM to solid via memory edges the most attractive. This hierarchy represented a strong gluing capacity of microbially produced agents. However, the most attractive configuration varies over time due to the various decay mechanisms for POM, mucilage and surface properties, possibly leading to a break-up of previously stable structures. As in (24), we additionally include the random break-up of structures due to external forces for instance resulting from earthworms which are not modeled explicitly. The probability for break-up ranges from 5% to 25% in every time step and depends on the types of surface contacts and stability of the contact.
As outlined in Section 2.1.2, the growth of the root additionally enforces the spatial rearrangement of the surrounding soil/POM particles and aggregates. If such a relocation is not possible, the growing root may even induce the break-up of aggregates located at the positions, to which the root might grow and the relocation of the separated constituents in direction of growth. More precisely, the model outlined in Zech et al. (24) was extended as follows:
Motivated by the relation between force and pressure , the assumption of a constant force and (68), who estimates the stress at distance z exerted by a point load to be equal to , we reduce the attractiveness of pixel i by a factor with f increasing quadratically from 0 to 1 with distance from the root surface for a growing root:
In summary, it is likely that a solid building unit, POM particle or aggregate finds a more attractive position in further distance of the root surface due to the local stress field and a deterministic break-up of structures close to the growing root is induced while simultaneously the build-up of aggregates is impeded at the root surface. This facilitates the relocation of POM or solid particles close to the root surface and the deallocation of occupied space. Moreover, the relocation of particles due to root growth is facilitated as follows: Additionally to the intrinsic movement as determined by the particles’ sizes, particles close to the root surface may additionally undergo a directed movement such that even large, intrinsically immobile particles can be relocated. This finally allows the root to grow into the altered pore space.
2.2 Quantification of local porosity changes
Our numerical toolbox as introduced above allows quantitatively evaluating the temporally and spatially resolved results. To this end, we use the method described in (69), adapted from (40), to calculate the temporal dynamics of the local porosity. Seven concentric, circular rings are defined according to their Euclidean distance to the root surface. We consider distances of 20, 40, 60, 80, 100, 120 and 140 μm (equivalent to 10, 20, 30, 40, 50, 60 and 70 pixels). This subdivision results in rings with a width of 20 μm (0-20 μm, 20-40 μm… 120-140 μm). The local porosity for each ring, i.e. the fraction of pore pixels to all pixels in the discrete approximation of the ring is calculated for each time step. The results are illustrated in Section 3.3. Note that the root itself is also growing and shrinking, depending on the time step.
Furthermore, we track the displacement of every building unit during the growth of the root from t = 0 d to t = 100 d. It is calculated as the Euclidean distance of the vector between the locations of the center point of a particle at these two different time steps. Following (3) who presented a similar concept for a 3D experimental setting, we calculate the displacement intensity D by dividing this distance by the maximum radius the root is reaching within this time span Rmax:
Thus a particle that moves about the same distance as the root surface extends, has a normalized displacement intensity of 100 %. The results are illustrated in Section 3.3.
2.3 Simulation scenarios
To evaluate the capability of our model and to investigate the influence of the drivers texture and mucilage on structure formation, we consider the following scenarios. They are extensions of the aforementioned study (24) and use the settings and new features described above. This means that in all settings, we consider the growth and degradation of a fine primary root in the pore system and trace the structure formation and OM turnover for 1000 days.
Driver 1 (Texture) We consider two distinct soils with different particle size distributions/shapes and textures, namely with 18% and 33% clay content. We investigate the mutual interplay of root and soil during the life cycle of the root (growing and shrinking) with respect to root shape and soil restructuring. We rate the impact of the distinct growth conditions in the rhizosphere. In doing so, we compare the displacement of particles within the soil structure due to root growth and the shaping of the root according to the presence of a larger/smaller amount of large/small soil particles. We quantify and compare the (persistent) heterogeneity in the dynamically evolving porosity field around the root and conclude on the potential restructuring after the root decayed again and a biopore has formed.
Driver 2 (Mucilage) We compare – for both textures – a setting with root growth and decay including the exudation of mucilage for either 1 d, 10 d or during the whole growth period of 100 d to a setting where the root is present, but no mucilage is produced. This allows us to quantify the impact of the additional fresh carbon source on aggregate formation, and to follow the decay and disintegration of the structures as well. We rate the impact of mucilage as gluing agent on aggregation in the rhizosphere for both textures and compare the stability of the resulting structures.
3 Results
In this section, we describe and discuss the outcome of the simulation scenarios as outlined in Section 2.3. The temporal dynamics of the root growth is depicted in Figure 3. The distribution of mucilage into the soil structure and the simultaneous solid restructuring is illustrated for both textures (18% and 33% clay) in Figure 4, while its decay is shown in Figure 5. A comparison of the situation with and without mucilage exudation is shown in Figure 6 for both textures. The variations in the local porosity are depicted in Figure 7 and the displacement intensity is shown in Figure 8 for all scenarios.
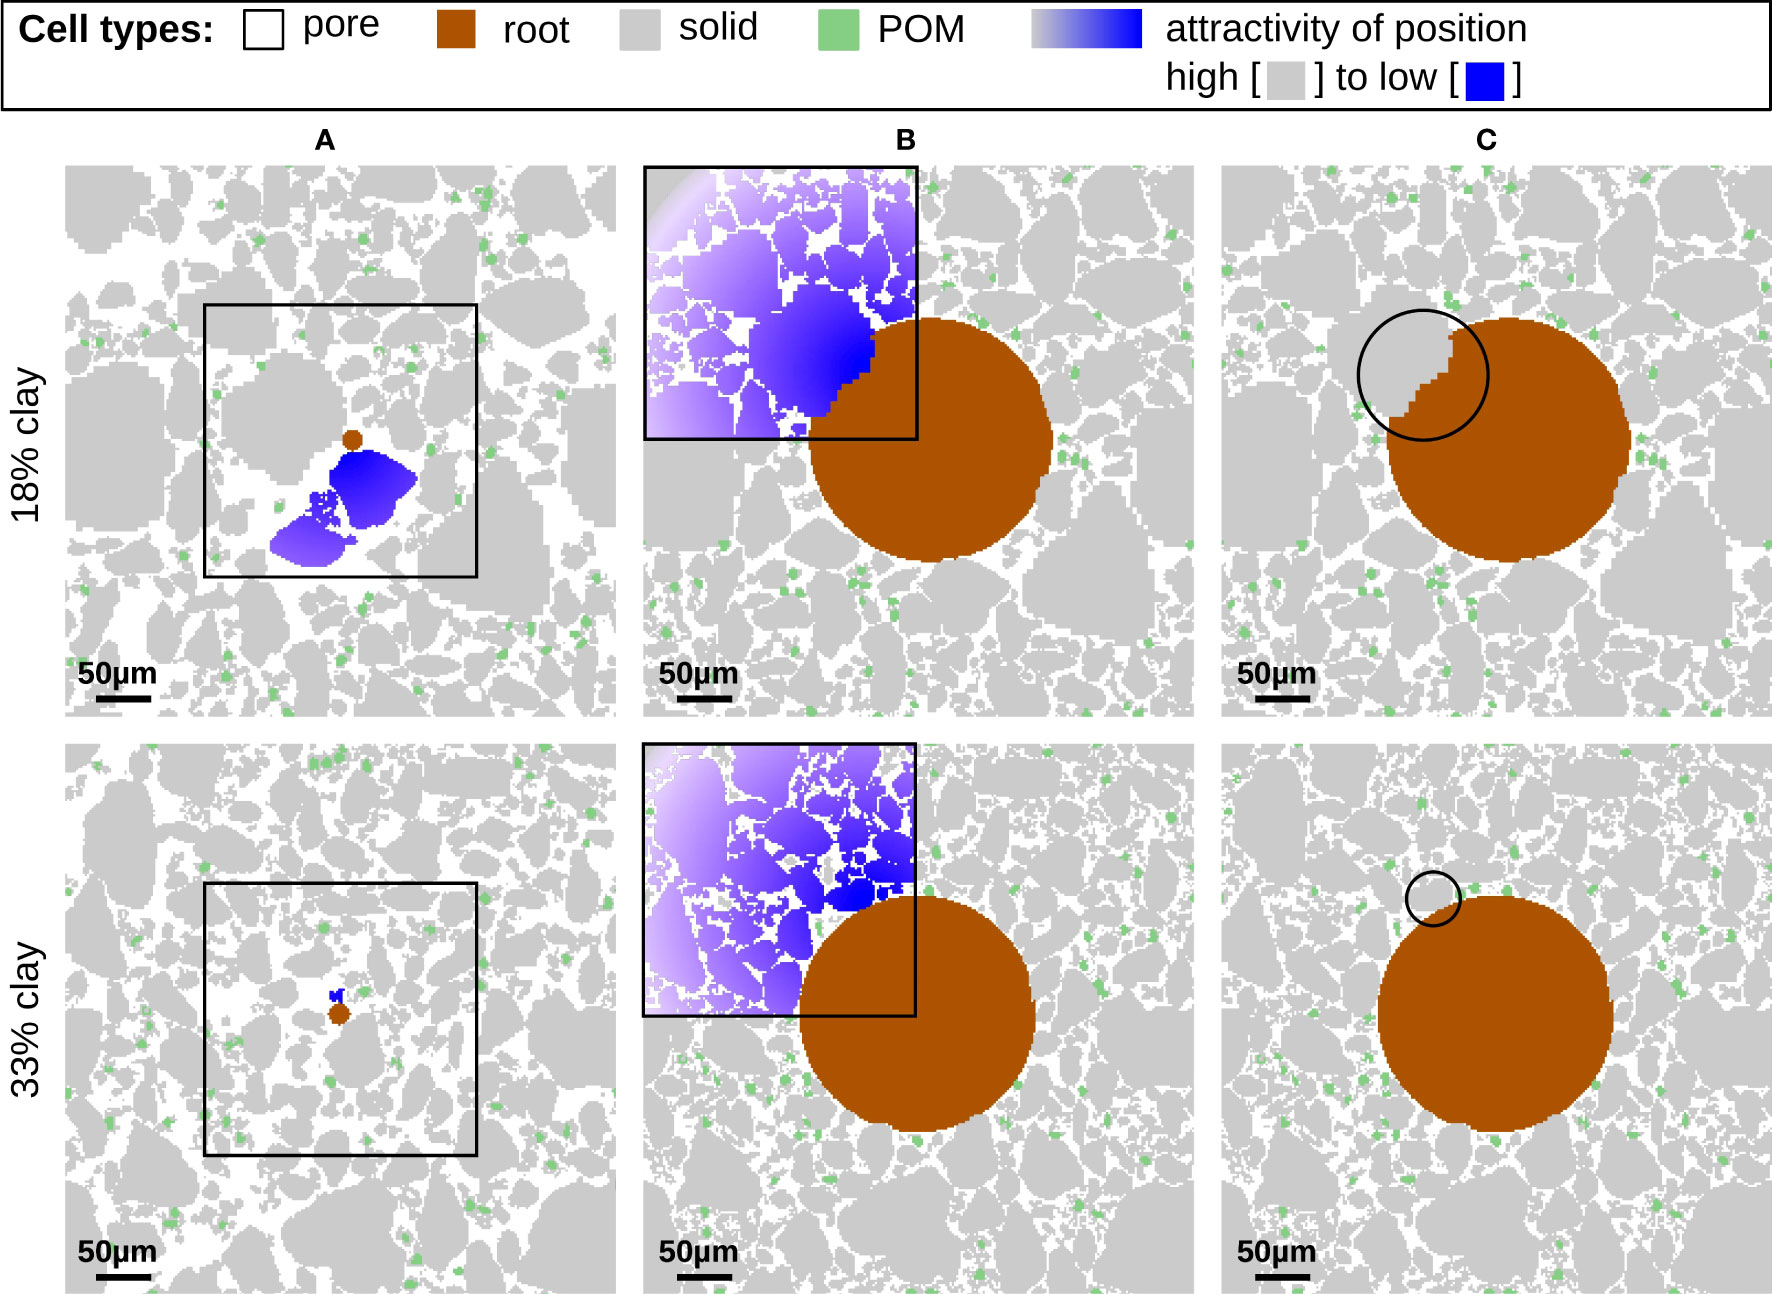
Figure 3 Mutual interaction of growing root and soil structure for the low clay soil (top line) and high clay soil (bottom line) at time step 47 in (A) and 99 in (B, C). The colored particles in the frames are part of the aggregate directly attached to the root surface cell which is about to grow. The color gradient symbolizes the influence of the growth process on the attractiveness of positions for particles to relocate. The highlighted areas in (C) show examples where soil particles force the growing root to circumvent the soil structure (top) or can be relocated (bottom), respectively.

Figure 4 Temporal evolution of root, mucilage and soil structures in 18% clay soil (top row) and 33% clay soil (bottom). Comparison of t = 0 d (initial state) (A), t = 80 d (during root growth) (B), t = 100 d (maximum root growth) (C) and t = 150 d (partly degraded root) (D).
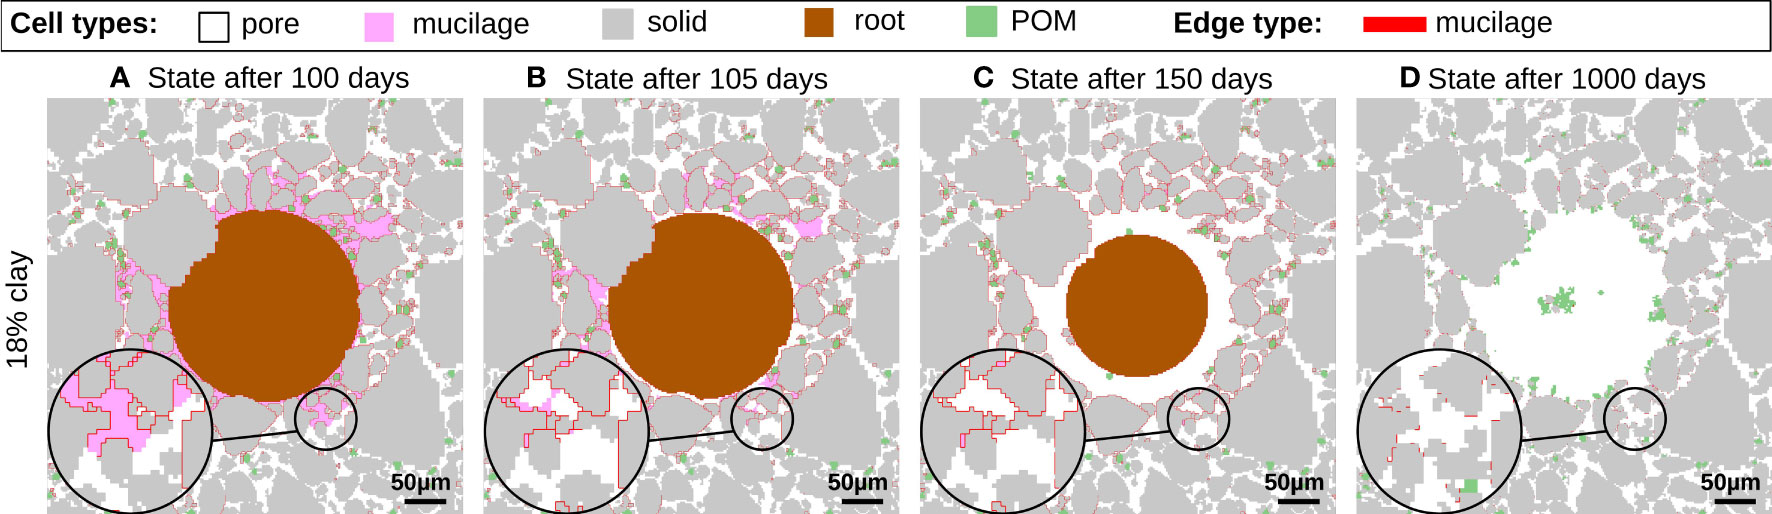
Figure 5 Locally heterogeneous mucilage decomposition and evolution of mucilage derived memory edges at 100 (A), 105 (B), 150 (C) and 1000 days (D) for soil with 18% clay. Focus on the decomposition of mucilage depending on the occlusion factor and the reorganization of particles after the degradation of memory edges.
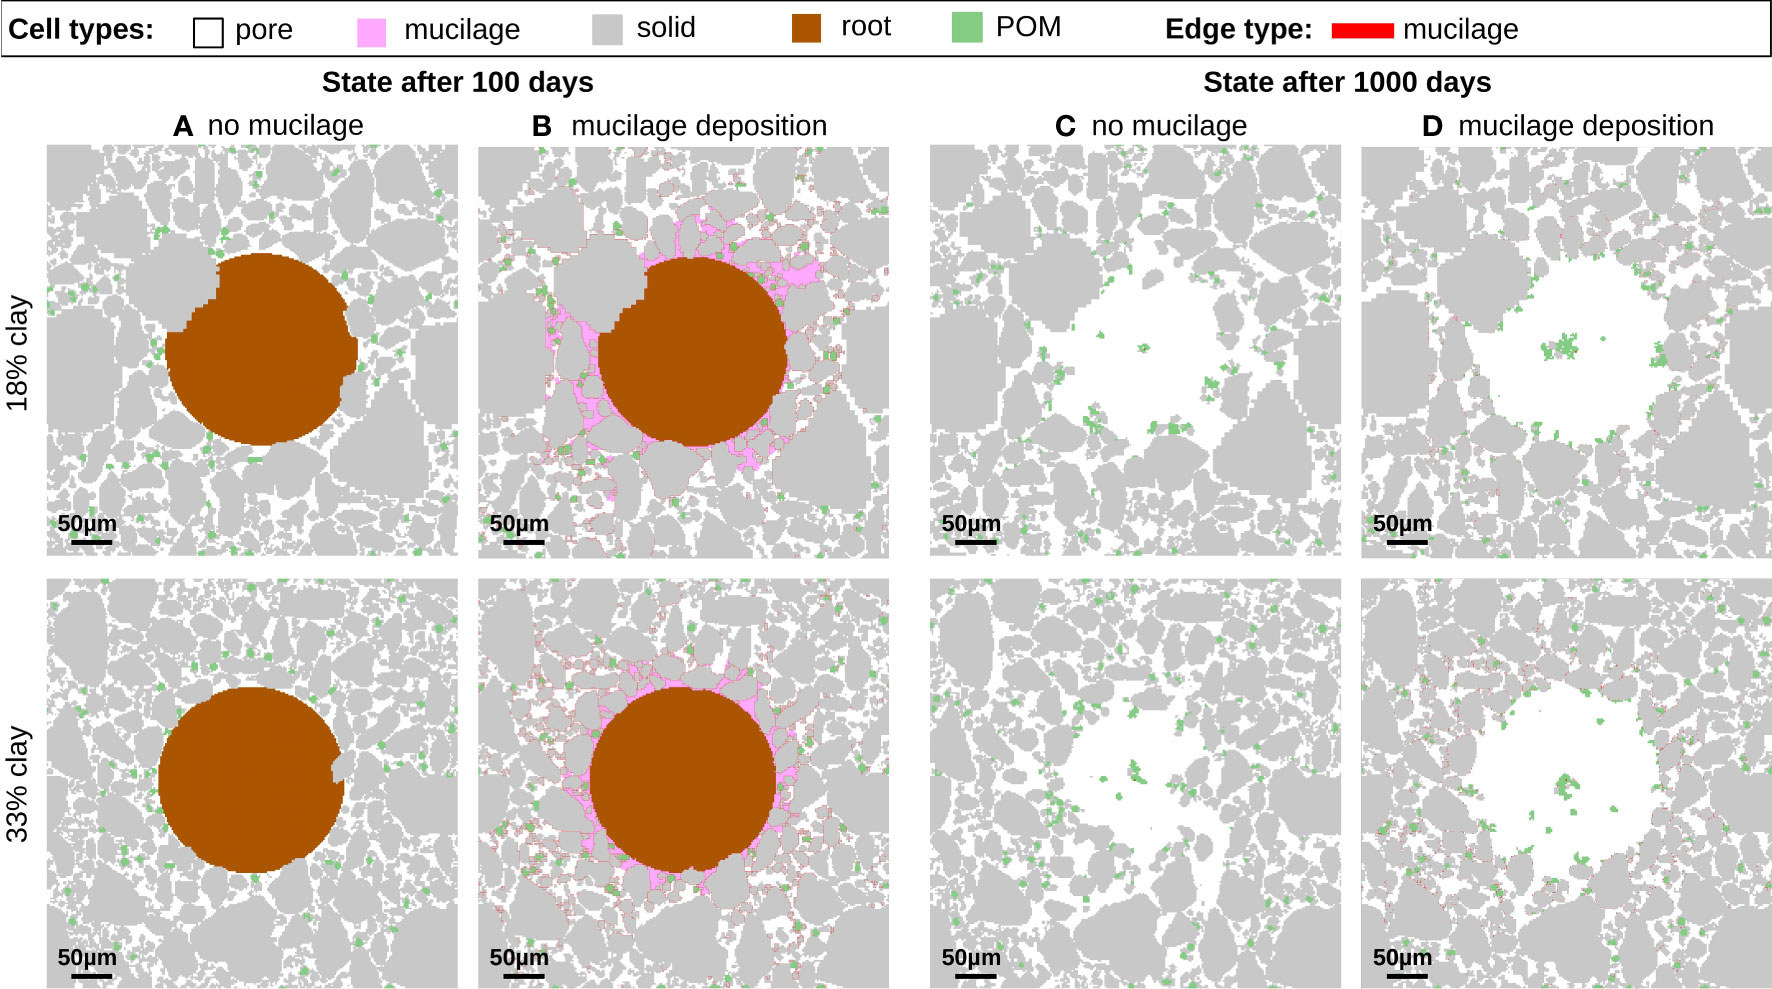
Figure 6 Soil structures for 18% clay (top row) and 33% clay (bottom row) after 100 days in (A, B), and 1000 days in (C, D). Comparison of root growth without exudates (A, C) to root growth with continuous mucilage deposition during root growth (B, D).
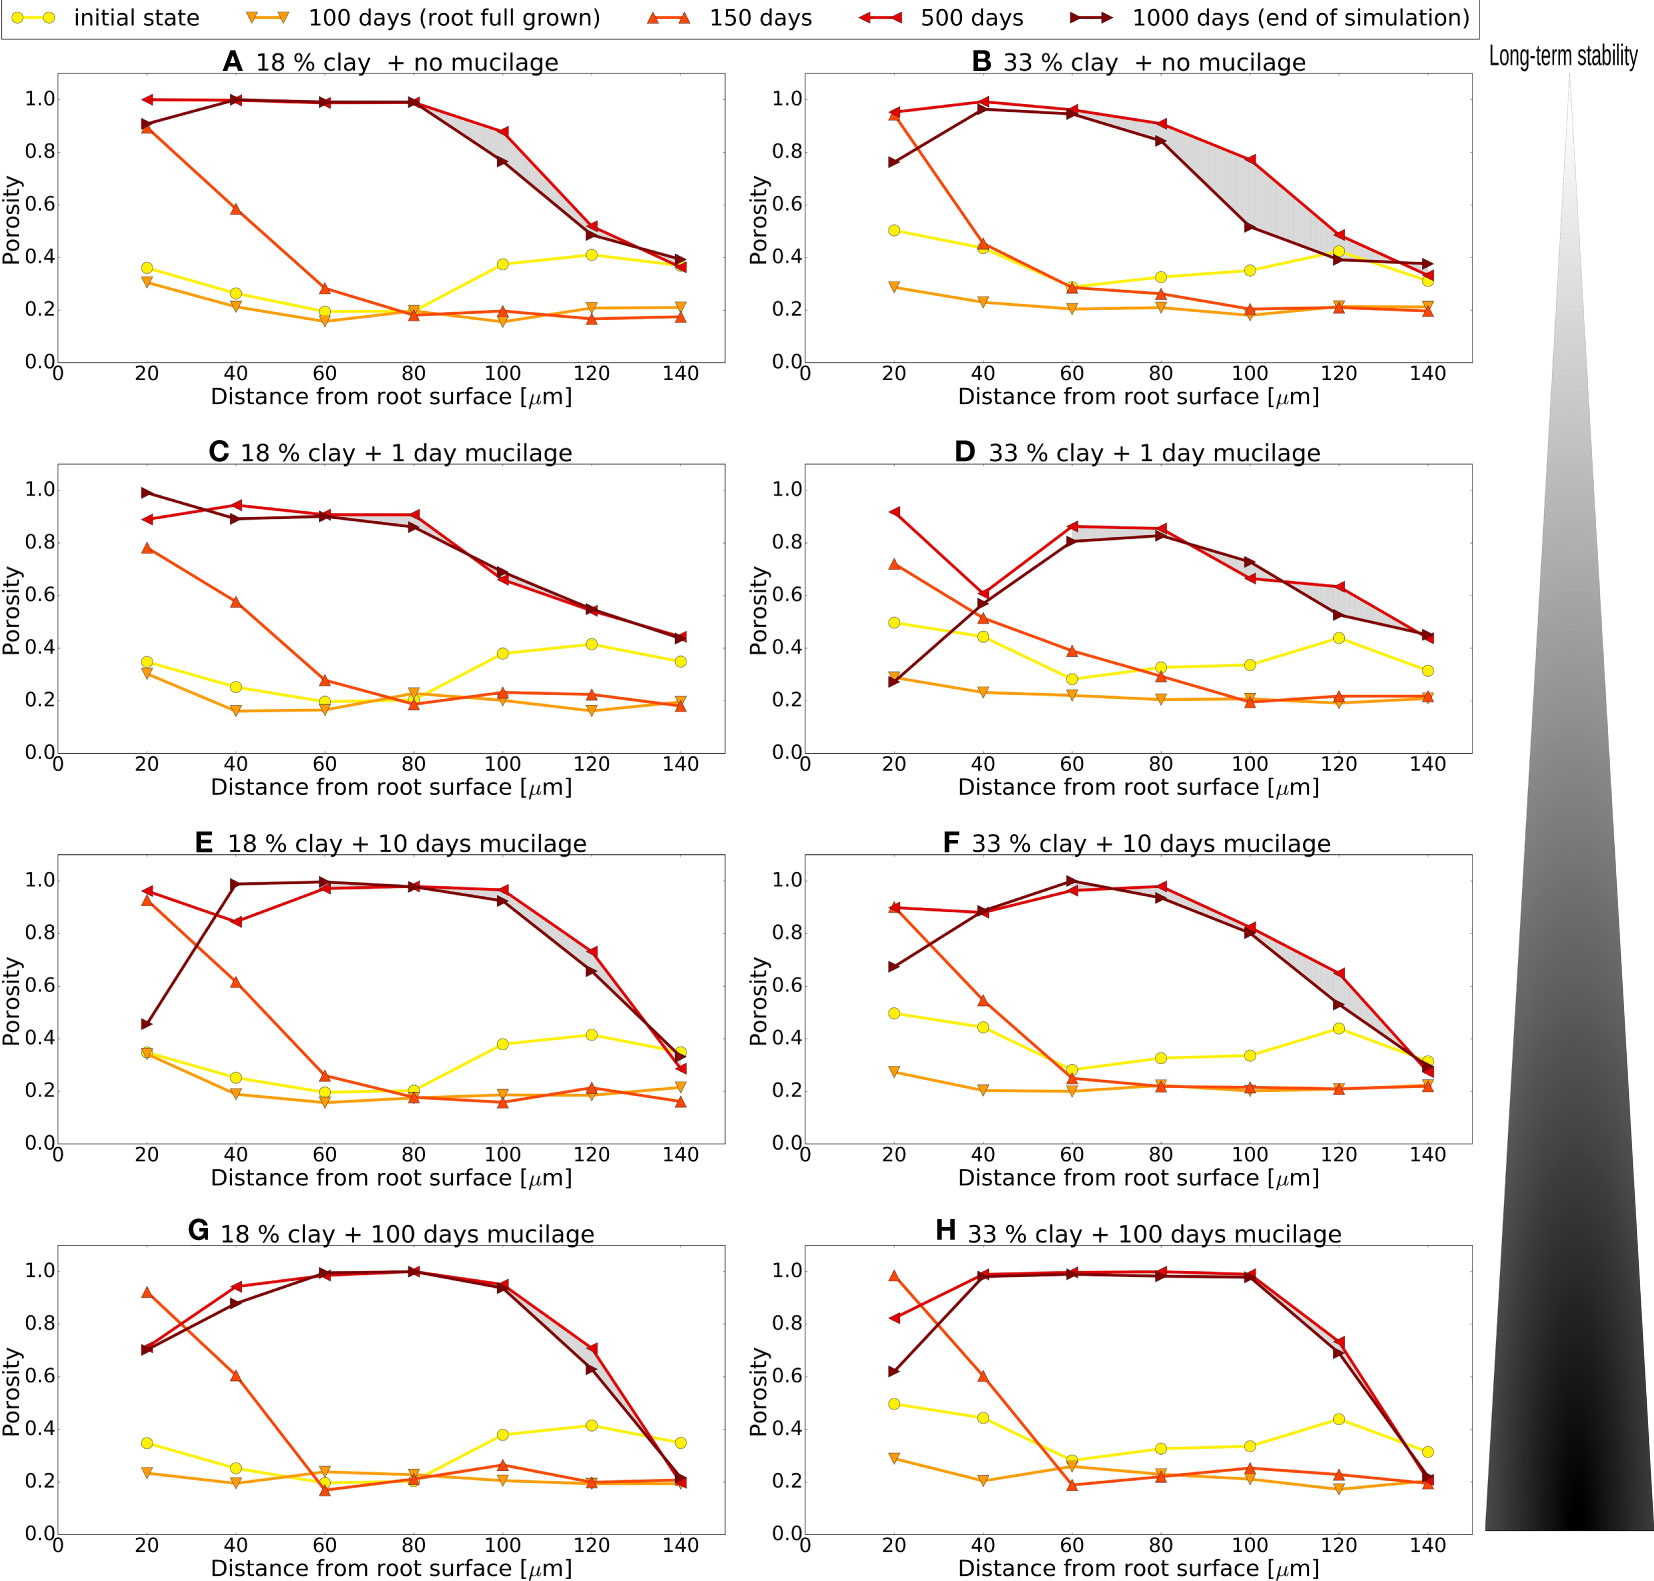
Figure 7 Local porosity in rings of different distances from (growing/shrinking) root surface for different time steps. Data values at 20 μm, e.g., refer to the ring from 0-20 μm etc. Comparison of textures 18% clay (left) and33% clay (right), and simulations without root exudation (A, B) and with mucilage exudation for one (C, D), ten (E, F), and 100 days (G, H). Region of interest changes for every time step due to the varying root size (except for initial state, 500 and 1000 days).
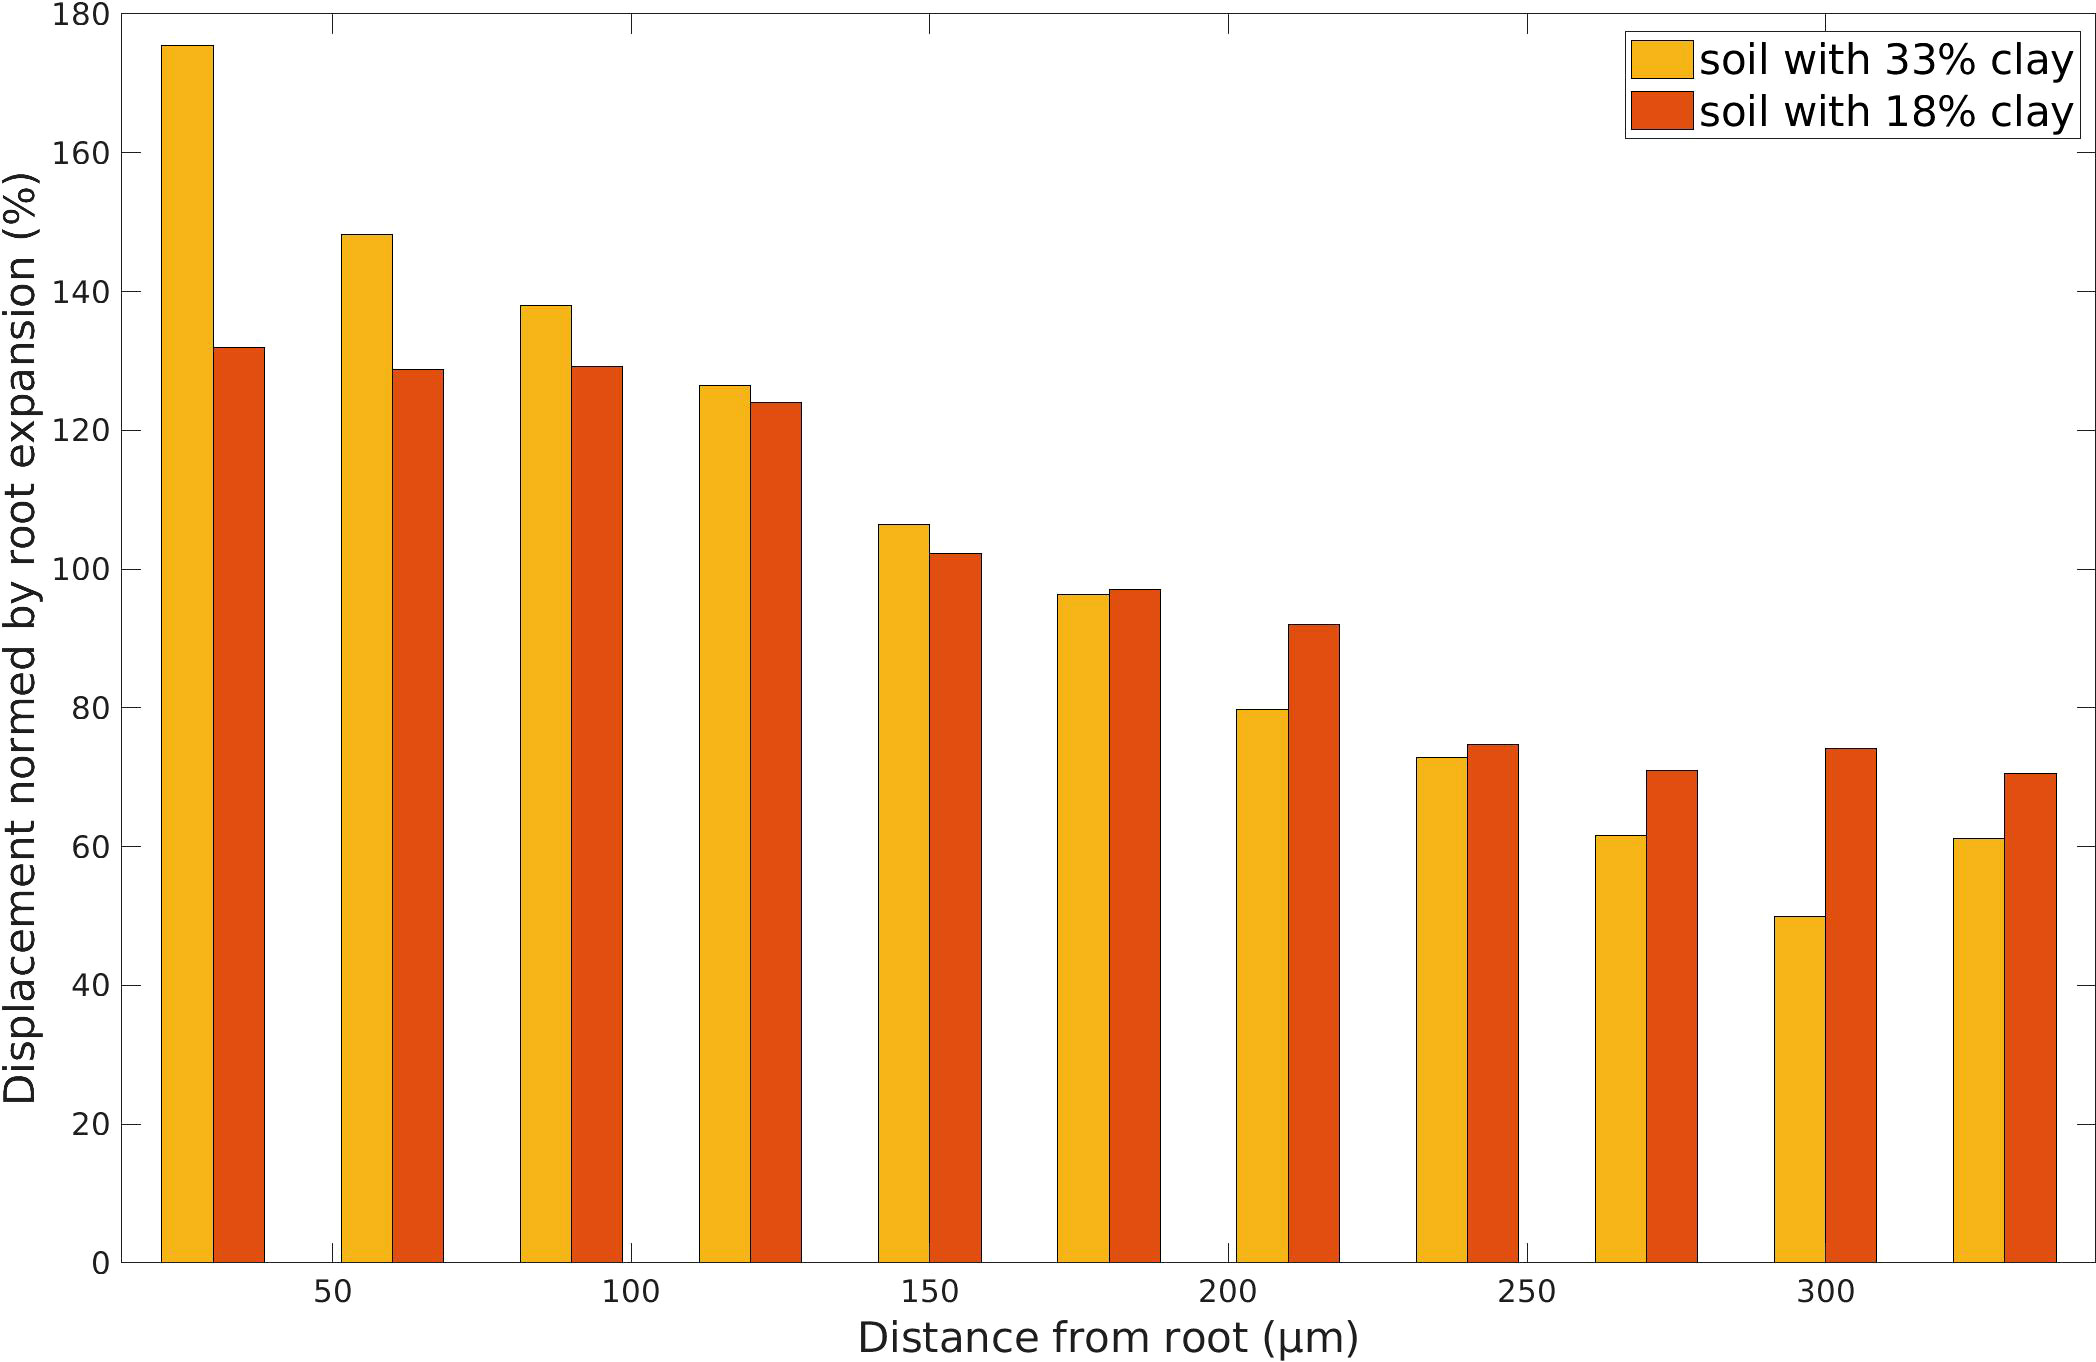
Figure 8 Displacement intensity D according to (3) of each particle with respect to the distance from the root surface, comparing time step t = 0 d to t = 100 d (maximum growth) for the high clay soil texture (yellow) and the low clay soil texture (red). The displacement (Euclidean distance between the locations of the center point of a particle in two different time steps) is normed by the maximum root radius extent within this time span. The results are plotted versus the distance from the root, averaging over 30 μm steps to a maximum of 350 μm (last step 330 μm), which represented the furthest possible distance in the computational domain to the root.
3.1 Mechanical interplay of root and structure
In Figure 3 the impact of the growing root onto the structure and vice versa is illustrated. As outlined in Section 2.1.5 the expanding root can cause the relocation of particles or aggregates if there is adjacent pore space available. As is apparent in particular in Figure 3A, the small fine root only has few contacts to surrounding particles at day 47. The aggregates in direct contact to the root surface are highlighted in in the frames in Figures 3A, B. In terms of the CAM rules, the color gradient represents a visualization of the decreasing attractiveness of the current position caused by a growing root (see Section 2.1.5) eventually leading to a relocation of the respective particles.
In the early growing stage, the presence of the root may affect solid building units or aggregates, see Figure 3A, which must be relocated. As the root growth evolves further, pore space is reduced, and the soil is more compact for both textures, see Figure 3B and the growth of the root has more widespread influence even on the particles that are far away. Thus, the effort required to grow the root by moving (several) particles is higher in the compact state. In this state, especially coarse particles are not able to find new spots during the relocation process, while finer particles could still fit into small pore spaces. This forces the root to grow around the large particles, as it is highlighted by the circles in Figure 3C, and leads to a distortion of the circular shape. This has been also reported experimentally, see e.g. the CT cross-sections Figure S3 in (3). Comparing the textures, we observe that this effect is more pronounced for lower clay content exhibiting coarser particles (top). When the root decays a soil-free gap is formed around the root which finally results in a biopore in the long term behavior see Figure 6. This long term behavior will be analyzed in detail together with the effect of mucilage in Section 3.2 and quantified in terms of the local porosity in Section 3.3.
3.2 Impact of mucilage
We now investigate the effect of mucilage on structure formation in more detail. Figure 4 shows the simultaneous evolution of the soil structure, the root and the mucilage along with POM turnover during the first 150 days for the case of continuous exudation during root growth. Starting from the initial aggregated state for the two textures (Figure 4A, see also Section 2.1.1) including the POM particles (green), we observe a strong exudation from the young, fine root tip (see the extension of the mucilage (pink) after 80 days in column (B), Figure 4). After 100 days, the extension of the root is at its maximum, and thus the exudation per root surface is lower (Figure 4C). In all scenarios the initial porosity of 0.35 has dropped to 0.22. The degradation of mucilage occurs in all scenarios with the same maximum rate, however the actual rate might differ due to the occlusion of the phase. Comparing the two textures, Figure 4B demonstrates that at lower clay content (top), mucilage is distributed further into the soil and is less rapidly decomposed although the pores are wider in this case. We report 14428 μm2 mucilage for t = 80 d for the 18% clay and 10024 μm2 in the 33% clay. This holds also true for time step 100 (Figure 4C), where we still note 7532 μm2 mucilage for the 18% clay and 5304 μm2 in the 33% clay. The last column demonstrates the almost complete degradation of mucilage after 150 days, see Figure 4D. The red edges in Figures 4B–D show where mucilage is or was in contact with POM or soil particles. As described in Sections 2.1.3 and 2.1.5 these edges constitute gluing joints and remain as memory edges even after degradation of the mucilage itself.
This process of exudation and the simultaneous creation of memory edges as well as mucilage decomposition and degradation of the memory edges is depicted in Figure 5 in more detail. Shortly after the maximum extension of the root at 100 days (Figure 5A), the fast degradation of mucilage is visible (Figure 5B at day 105). We highlight a zone to focus on the decomposition of mucilage depending on the exposure to the pore space, see the zoom in Figures 5A–C. It is observed that the mucilage phase is decomposed latest close to the surface, that the phase can also be disrupted, and that occluded mucilage is the most persistent (see the small inclusions in Figures 5B, C). The long term evolution from 150 to 1000 days (Figures 5C, D) finally illustrates the degradation of the gluing (memory) edges. This enables the break-up of structures and their reorganization in the long run. For the lower clay soil (Figure 5) the amount of reactive edges decreases from a maximum of 6792 (t = 100 d) to the minimum of 1169 at the end of the simulation (t = 1000 d), in the case of higher clay content from 7957 to 1288.
Finally, we compare the impact on aggregation for the situation after 100 and 1000 days for both textures, considering the extreme cases, i.e. the maximal exudation of mucilage for 100 days and without root exudates in Figure 6. In particular the long term situation indicates, whether a persistent stabilization of structures has taken place. Comparing columns (C) and (D) in Figure 6 it is evident that the presence of mucilage and its distribution into the soil leads to a facilitated aggregation and more persistent structures. After t = 1000 days 22 aggregates with an average size of 7577 μm2 have formed taking into account the distribution of mucilage into the soil with lower clay content. In contrast to this, without mucilage more aggregates (39) with smaller average size (4269 μm2) are present. The texture with higher clay content shows the same trend, leading to 53 aggregates with an average size of 3165 μm2 (with mucilage) opposed to 61 aggregates with an average size of 2746 μm2 (no mucilage).
After the root shrinks, a biopore forms. If structures break up, single building units or larger aggregates may relocate and again occupy the biopore, this is in particular visible in Figure 6C for the situation without exudates. Due to the higher amount of fine clay particles and their higher mobility the biopore is filled more rapidly for the soil with 33% clay. Including mucilage in the simulation the biopore is filled much less by soil particles at t = 1000 d (Figure 6D). However, an accumulation of POM is observed within the gap that the root has created. As new POM is added to the system continuously (at every 10th step) in the pore space, the probability is high that it is located in the biopore. Thus more POM accumulates there.
3.3 Porosity and displacement intensity
We use the local porosity as defined in Section 2.2 as a measure to quantify the structural dynamics in the surroundings of the growing and shrinking root and the remaining biopore. The variation of the local porosity with space and time is depicted in Figure 7 for the two textures and the cases with deposition for 1, 10 and 100 days, and without mucilage production. Note that by definition, the local porosities refer to different absolute positions in the domain as long as the root surface moves. For time steps t = 0 d, t = 500 d, and t = 1000 d there is no root in the domain, thus the corresponding local porosities all relate to the center of the domain. The overall porosity for all scenarios is 35% in the initial state, whereas at t = 100 d (maximum size of the root) it decreases for all scenarios by more than one third to 21.8%.
Three distinct phases can be determined, namely the growth of the root up to 100 days, directly followed by the shrinkage of the root which has vanished after 388 days, and the relocation of particles until the end of the simulation. As long as the root grows, not only the total porosity but also the local porosity close to the root surface decreases due to the compaction of the surrounding soil. The effect also has an impact onto regions quite distant from the root due to the continued relocation. This can be seen comparing the yellow lines (t = 0 d) to the light orange lines (t = 100 d) in all subfigures in Figure 7. For the fully grown root (t = 100 d) the porosity in the first annulus (20 μm width) is higher than in the subsequent ones for all scenarios. This observation has also been reported in experimental studies as a surface/wall effect at the root/soil interface (44, 46). This effect is equally present in earlier growth stages of the root (data not shown). The compaction is higher in the high clay soil, compare the larger drops from the yellow to light orange lines in the right column of Figure 7 to the left column.
After the growing phase of 100 days and as also observed in many experimental studies (40, 42), the shrinking root has reduced root-soil contact and a gap emerges (t = 150 d, orange lines in Figure 7, recall also Figure 4D). The local porosity increases strongly in the first 40 μm close to the root surface in all scenarios. The porosity in the compacted soil zone at a distance between 60 and 140 μm from the root remains unaffected at this early stage.
In the final phase the development of the biopore due to the degradation of the root is apparent in the graphs at time t = 500 d and t = 1000 d (red and brown lines in Figure 7), recall also the final states in Figures 6C, D. The local porosity is close to 1 up to a radius of 100 μm, which was approximately the maximum root radius (recall Figure 6) in all scenarios. But also at larger distances, the local porosities have raised as structures again break up and now have options to move to the adjacent biopore. The persistence of the aggregated structures can be evaluated comparing the final states at t = 1000 d to the ones at t = 500 d. If the local porosity graphs between t = 500 d and t = 1000 d do not differ significantly, the stability of the structures is high. Comparing the extreme situations without (Figures 7A, B) and with 100-day-deposition of mucilage (Figures 7G, H), we observe that the aggregate structures obtained due to root growth remain more stable in the situation with mucilage. This difference is highlighted by the gray areas between the porosity curves of time step 500 and 1000 in Figure 7 at distances between 60 μm and 140 μm in all subfigures. The bigger the area is, the more particles have rearranged into the biopore, although still the previous presence of the root is visible. This is most pronounced for the high clay soil (Figure 7B) since smaller particles are more mobile. In contrast there are only minor changes in porosity in the situation, in which mucilage is present as is evident from the very thin gray areas in Figures 7C–H. Notably this stabilization effect is already visible for 1-day-exudation (Figures 7C, D) and becomes more pronounced the longer mucilage is exuded. To further quantify this we sum up the changes in local porosities in the rings from 60–140 μm for the different scenarios. The precise numbers are given in the Supplementary Material (59), Table S2. In the low clay soil, the local porosities (summed up for these areas) drop by 0.111, corresponding to a summed up change of -10.6% without mucilage. In the presence of mucilage, the drop is at most only 1.7%. For the high clay soil the effect is even larger: Without exudation, the porosity drops sum up to an absolute value of 0.387 or 48.0%, while for one and ten days of exudation, they drop only about 14.2 and 13.5%, respectively. If we assume exudation as long as the root grows, the local porosities drop only by 3.4%. Note that in the largest annulus of 140 μm local porosities mostly grow, as the particles from that ring mostly move to the biopore (see Table S2).
The highest exudation scenarios show also a notable effect of mucilage on the distant regions, as is apparent when comparing the local porosities at a distance of 140 μm. Without mucilage ((A) and (B)) the porosity can again reach its values of the initial states, compare the data points for t = 0 d, t = 500 d and t = 1000 d. For the high exudation (Figures 7G, H) the porosity values remain unchanged after the root was fully grown, i.e. at 0.22 (18% clay) and 0.21 (33% clay), compared to the initial state of 0.34 and 0.31, respectively. The comparison of Figures 7A–H also reveals differences for the distance of 100 μm corresponding to the edge of the biopore. In the scenario where mucilage was exuded, the local porosities remain significantly higher for both textures and exhibits steeper gradients. Without mucilage the local porosities are smaller and the less steep gradients indicate that the biopore already decreased and has a less sharp interface (recall also Figures 6C, D).
The drop in the local porosities in the very center (Figure 7, 20 μm) for all scenarios in the case of the degraded root (500 and 1000 days) is due to the aggregation of fresh POM (Figures 6C, D) in the biopore.
Finally, we use the displacement intensity as defined in Section 3.2 as a measure to quantify the structural dynamics until the maximum growth stage of the root. More precisely, the displacement of all particles during root growth is evaluated in Figure 8 for the two textures, comparing time t = 0 d to t = 100 d. The displacement is normed by the root expansion, yielding the displacement intensity. Naturally, the particles closest to the root are displaced most, even up to more than 100% as the root expands and occupies their space. The displacement is resulting from a combination of the root expansion, but also the induced break-up of aggregates and subsequent movement of particles to other attractive spots in the pore space. Further away from the root, at distances of 250-350 μm the displacement intensity drops to 50-70%. For the high clay soil the displacement is higher than for the low clay soil up to 100 μm from the root, whereas the inverse situation can be reported for the larger distances from 200 μm on.
4 Discussion
We presented a process-based pore scale model to study the interwoven processes of aggregate formation, carbon turnover, root growth and exudation. This novel approach including explicit spatially and temporally dynamic rearrangement of particles, altering root and pore geometries goes beyond the scope of existing soil carbon pool models (8, 19) and also of functional root architecture models (6, 53), while possible extensions to detailed elasticity models are desirable as outlined below. It makes a contribution to the much needed predictive modeling of the spatio-temporal dynamics of the soil system for a better understanding of rhizosphere processes (6, 7) and contributes to a holistic way to consider the relevant constituents as well as their surrounding pore space (9).
The approach established by Zech et al. (24) for POM degradation affecting aggregation, and including the concept of reactive and so-called memory edges on the building units of soils has been successfully extended for mucilage and roots. These edges represent gluing spots on the mineral surfaces of soil particles, which may also persist after the degradation of OM. As for organic matter, the explicit pore scale model allows to distinguish fast degradation in the pore space from slower to no degradation in occluded situations. Root growth and degradation have been included in the algorithms explicitly and the simulations show that the induced compaction and subsequent increase in porosity in the rhizosphere result from these processes. Compaction is observed up to 140 μm from the root surface. Note that the simulation domain has been limited to 500 μm × 500 μm and conclusions for larger distances cannot be drawn from these calculations (70). assumes ranges of soil compaction up to 4 times the root radius. The displacement of particles by the root also led to moderate elevated porosities in the closest annulus at the root/soil interface, a surface/wall effect also observed in experiments (44, 46). Keyes et al. (3) measured displacement intensities for 3D experiments with previously grown root tips monitored under different moisture conditions for a time span of 42 minutes. Although the data cannot be compared directly due to the different time frames and spatial scales they also show largest displacements closest to the root and a decrease over distance from the root. However the measured intensities are much smaller [in the range of 40-5%, see Figure 7C in (3)] than the intensities shown in Figure 8 (range of 175 to 50%). This can be explained by the much smaller time span of the experiment, the fact that the root tip has already been grown when the measurement started, and also the presence of biopores which were used by the root for expansion. The higher displacement intensities of the high clay soil close to the root can be explained by the higher mobility of the small particles. The displacement along with potential break-up of structures also triggers rearrangement by aggregation. Koebernick et al. (46) also report a decreased fraction of larger pores next to the epidermis, which could be explained by this rearrangement.
The drivers mucilage and texture have been varied in eight simulation scenarios. They span the time of the growth of a fine root for 100 days, and the following degradation and formation of a biopore. The aggregate formation and turnover is observed for 1000 days including the addition of fresh POM in the system. According to the texture, root growth in the vicinity of large soil particles was hampered since they have strong spatial restrictions while rearranging. This was more pronounced in the low clay soil, whereas in the high clay soil, the rearrangement of the smaller particles was facilitated. Due to this mutual interaction, the shape of the root might be distorted, as the cambrial cells can only grow in the remaining pore space. The CAM mimicks this natural, cell-based growth process. Such distortions have also been seen in CT cross-sections as shown, e.g., in (3), Figure S3.
The simulation results support that the deposition of mucilage is an important driver for structure formation in the rhizosphere. Although mucilage is degraded within a few days after exudation, it leads to a persistent stabilization of the aggregated structures for both textures. This stabilization is significantly different from the structures encountered when only POM could trigger the evolution of gluing spots, the reactive surface sites on the mineral particles, and is already observable for short-term exudation of one or ten days. The mucilage scenarios also revealed that the same amount of exuded mucilage is degraded faster in the high clay soil. In the way the model has been realized this can only be explained by more contact faces of the mucilage to water filled pores. So the narrow pores in the high clay soils nevertheless in sum have more contact faces of mucilage to the water filled pore space than the wider (but fewer) pores in the low clay soil have, which leads to a higher decomposition rate.
Comparing the textures, the 18% clay soil remains more stable after root degradation (independent of mucilage), because the larger particles are blocked in the compacted soil and thus rearranged to a smaller extent. In the 33% clay soil the larger amount of smaller particles is more mobile and has more options to move in the biopore or fill the gap around the retracting root.
In general our simulation indicates that persistent porosity changes in the rhizosphere are obtained which may be used for future roots which exploit preferably existing macropores (48, 71).
Although the model already allows to study the process interactions under the given assumptions, future work should link the model to laboratory or field studies of aggregation in the rhizosphere. On the other hand the particle shape libraries and reactive surface properties can be extended to a larger variety of soils, and the parametrization of the biophysical processes varied systematically to study their influence on aggregation. Note that it would also be worth investigating the degrading root itself as a carbon source. An important limitation of the current study is the assumption of a completely water-filled pore space and inelastic soil particles. However capillary forces, shrinking or swelling of roots, mucilage or clay minerals during drought or imbibition, and the interplay of mucilage with air and water also interacts with aggregation (11). In future work such dynamic saturation changes in the pore space should be incorporated in the model to investigate their influence on aggregation. Likewise, elastic properties as considered in detail e.g. in (51) and their impact on larger scales should be taken into account such as demonstrated e.g. in the model in (52).
Data availability statement
The raw data supporting the conclusions of this article will be made available by the authors, without undue reservation.
Author contributions
AP and NR contributed to conception and design of the study. MR implemented the model, performed the simulation studies and provided the figures. AP and NR wrote the first draft of the manuscript. All authors contributed to the article and approved the submitted version.
Funding
This work was carried out in the framework of the priority programme 2089 (Rhizosphere spatiotemporal organization-a key to rhizosphere functions) funded by the German Research Foundation DFG under the project number 403660839.
Acknowledgments
We thank both reviewers for their elaborated, in-depth comments on our manuscript. Their effort enabled us to improve the manuscript in many respects.
Conflict of interest
The authors declare that the research was conducted in the absence of any commercial or financial relationships that could be construed as a potential conflict of interest.
The handling editor ML declared a past co-authorship with the author AP.
Publisher’s note
All claims expressed in this article are solely those of the authors and do not necessarily represent those of their affiliated organizations, or those of the publisher, the editors and the reviewers. Any product that may be evaluated in this article, or claim that may be made by its manufacturer, is not guaranteed or endorsed by the publisher.
Supplementary material
The Supplementary Material for this article can be found online at: https://www.frontiersin.org/articles/10.3389/fsoil.2023.1155889/full#supplementary-material
References
1. Roose T, Keyes SD, Daly KR, Carminati A, Otten W, Vetterlein D, et al. Challenges in imaging and predictive modeling of rhizosphere processes. Plant Soil (2016) 407:9–38. doi: 10.1007/s11104-016-2872-7
2. Vetterlein D, Carminati A, Kögel-Knabner I, Bienert GP, Smalla K, Oburger E, et al. Rhizosphere spatiotemporal organization–a key to rhizosphere functions. Front Agron (2020) 2:8. doi: 10.3389/fagro.2020.00008
3. Keyes SD, Cooper L, Duncan S, Koebernick N, McKay Fletcher DM, Scotson CP, et al. Measurement of micro-scale soil deformation around roots using four-dimensional synchrotron tomography and image correlation. J R Soc Interface (2017) 14:20170560. doi: 10.1098/rsif.2017.0560
4. van Veelen A, Tourell MC, Koebernick N, Pileio G, Roose T. Correlative visualization of root mucilage degradation using X-ray CT and MRI. Front Environ Sci (2018) 6:32. doi: 10.3389/fenvs.2018.00032
5. Meurer K, Barron J, Chenu C, Coucheney E, Fielding M, Hallett P, et al. A framework for modelling soil structure dynamics induced by biological activity. Global Change Biol (2020) 26:5382–403. doi: 10.1111/gcb.15289
6. Schnepf A, Carminati A, Ahmed MA, Ani M, Benard P, Bentz J, et al. Linking rhizosphere processes across scales: opinion. Plant Soil (2022) 478:5–42. doi: 10.1007/s11104-022-05306-7
7. Hinsinger P, Bengough AG, Vetterlein D, Young IM. Rhizosphere: biophysics, biogeochemistry and ecological relevance. Plant Soil (2009) 321:117–52. doi: 10.1007/s11104-008-9885-9
8. Pot V, Portell X, Otten W, Garnier P, Monga O, Baveye PC. Accounting for soil architecture and microbial dynamics in microscale models: current practices in soil science and the path ahead. Eur J Soil Sci (2021) 73:13142. doi: 10.1111/ejss.13142
9. Vogel HJ, Balseiro-Romero M, Kravchenko A, Otten W, Pot V, Schlüter S, et al. A holistic perspective on soil architecture is needed as a key to soil functions. Eur J Soil Sci (2022) 73:1–14. doi: 10.1111/ejss.13152
10. Six J, Bossuyt H, Degryze S, Denef K. A history of research on the link between (micro)aggregates, soil biota, and soil organic matter dynamics. Soil Tillage Res (2004) 79:7–31. doi: 10.1016/j.still.2004.03.008
11. Totsche KU, Amelung W, Gerzabek MH, Guggenberger G, Klumpp E, Knief C, et al. Microaggregates in soils. J Plant Nutr Soil Sci (2018) 181:104–36. doi: 10.1002/jpln.201600451
12. Crawford JW, Verrall S, Young IM. The origin and loss of fractal scaling in simulated soil aggregates. Eur J Soil Sci (1997) 48:643–50. doi: 10.1111/j.1365-2389.1997.tb00564.x
13. Crawford JW, Deacon L, Grinev D, Harris JA, Ritz K, Singh BK, et al. Microbial diversity affects self-organization of the soil - microbe system with consequences for function. J R Soc Interface (2012) 9:1302–10. doi: 10.1098/rsif.2011.0679
14. Ray N, Rupp A, Prechtel A. Discrete-continuum multiscale model for transport, biomass development and solid restructuring in porous media. Adv Water Resour (2017) 107:393–404. doi: 10.1016/j.advwatres.2017.04.001
15. Rupp A, Totsche KU, Prechtel A, Ray N. Discrete-continuum multiphase model for structure formation in soils including electrostatic effects. Front Environ Sci (2018) 6:96. doi: 10.3389/fenvs.2018.00096
16. Chopard B. Cellular automata modeling of physical systems. New York, NY: Springer New York (2009) p. 865–92. doi: 10.1007/978-0-387-30440-3
17. Rupp A, Guhra T, Meier A, Prechtel A, Ritschel T, Ray N, et al. Application of a cellular automaton method to model the structure formation in soils under saturated conditions: a mechanistic approach. Front Environ Sci (2019) 7:170. doi: 10.3389/fenvs.2019.00170
18. Zech S, Dultz S, Guggenberger G, Prechtel A, Ray N. Microaggregation of goethite and illite evaluated by mechanistic modeling. Appl Clay Sci (2020) 198:105845. doi: 10.1016/j.clay.2020.105845
19. Baveye PC, Otten W, Kravchenko A, Balseiro-Romero M, Beckers É, Chalhoub M, et al. Emergent properties of microbial activity in heterogeneous soil microenvironments: different research approaches are slowly converging, yet major challenges remain. Front Microbiol (2018) 9:1929. doi: 10.3389/fmicb.2018.01929
20. Ruiz S, Fletcher DM, Williams K, Roose T. Plant–soil modelling. Annu Plant Rev Online (2021) 4:127–98. doi: 10.1002/9781119312994.apr0755
21. Portell X, Pot V, Garnier P, Otten W, Baveye PC. Microscale heterogeneity of the spatial distribution of organic matter can promote bacterial biodiversity in soils: insights from computer simulations. Front Microbiol (2018) 9:1583. doi: 10.3389/fmicb.2018.01583
22. Tang Y, Valocchi AJ. An improved cellular automaton method to model multispecies biofilms. Water Res (2013) 47:5729–42. doi: 10.1016/j.watres.2013.06.055
23. Tang Y, Valocchi AJ, Werth CJ, Liu H. An improved pore-scale biofilm model and comparison with a microfluidic flow cell experiment. Water Resour Res (2013) 49:8370–82. doi: 10.1002/2013WR013843
24. Zech S, Schweizer SA, Bucka FB, Ray N, Kögel-Knabner I, Prechtel A. Explicit spatial modeling at the pore scale unravels the interplay of soil organic carbon storage and structure dynamics. Global Change Biol (2022) 28:4589–604. doi: 10.1111/gcb.16230
25. Baumert VL, Vasilyeva NA, Vladimirov AA, Meier IC, Kögel-Knabner I, Mueller CW. Root exudates induce soil macroaggregation facilitated by fungi in subsoil. Front Environ Sci (2018) 6:140. doi: 10.3389/fenvs.2018.00140
26. Morel JL, Habib L, Plantureux S, Guckert A. Influence of maize root mucilage on soil aggregate stability. Plant Soil (1991) 136:111–9. doi: 10.1007/BF02465226
27. Amellal N, Burtin G, Bartoli F, Heulin T. Colonization of wheat roots by an exopolysaccharide-producing pantoea agglomerans strain and its effect on rhizosphere soil aggregation. Appl Environ Microbiol (1998) 64:3740–7. doi: 10.1128/aem.64.10.3740-3747.1998
28. Angers DA, Caron J. Plant-induced changes in soil structure: processes and feedbacks. Biogeochemistry (1998) 42:55–72. doi: 10.1023/A:1005944025343
29. Traoré O, Groleau-Renaud V, Plantureux S, Tubeileh A, Boeuf-Tremblay V. Effect of root mucilage and modelled root exudates on soil structure. Eur J Soil Sci (2000) 51:575–81. doi: 10.1046/j.1365-2389.2000.00348.x
30. Gregory PJ, George TS, Paterson E. New methods for new questions about rhizosphere/plant root interactions. Plant Soil (2022) 476:699–712. doi: 10.1007/s11104-022-05437-x
31. Zickenrott I-M, Woche SK, Bachmann J, Ahmed MA, Vetterlein D. An efficient method for the collection of root mucilage from different plant species–a case study on the effect of mucilage on soil water repellency. J Plant Nutr Soil Sci (2016) 179:294–302. doi: 10.1002/jpln.201500511
32. Monrroy M, García E, Ríos K, García JR. Extraction and physicochemical characterization of mucilage from opuntia cochenillifera (L) Miller. J Chem (2017) 2017:4301901. doi: 10.1155/2017/4301901
33. Di Marsico A, Scrano L, Labella R, Lanzotti V, Rossi R, Cox L, et al. Mucilage from fruits/seeds of chia (Salvia hispanica l.) improves soil aggregate stability. Plant Soil (2018) 425:57–69. doi: 10.1007/s11104-018-3565-1
34. Zarebanadkouki M, Fink T, Benard P, Banfield CC. Mucilage facilitates nutrient diffusion in the drying rhizosphere. Vadose Zone J (2019) 18:190021. doi: 10.2136/vzj2019.02.0021
35. Williams KA, Ruiz SA, Petroselli C, Walker N, McKay Fletcher DM, Pileio G, et al. Physical characterisation of chia mucilage polymeric gel and its implications on rhizosphere science - integrating imaging, MRI, and modelling to gain insights into plant and microbial amended soils. Soil Biol Biochem (2021) 162:108404. doi: 10.1016/j.soilbio.2021.108404
36. Landl M, Haupenthal A, Leitner D, Kroener E, Vetterlein D, Bol R, et al. Simulating rhizodeposition patterns around growing and exuding root systems. Silico Plants (2021) 3:1–14. doi: 10.1093/insilicoplants/diab028
37. Amelung W, Meyer N, Rodionov A, Knief C, Aehnelt M, Bauke SL, et al. Process sequence of soil aggregate formation disentangled through multi-isotope labelling. Geoderma (2023) 429:116226. doi: 10.1016/j.geoderma.2022.116226
38. Wang X, Yin L, Dijkstra FA, Lu J, Wang P, Cheng W. Rhizosphere priming is tightly associated with root-driven aggregate turnover. Soil Biol Biochem (2020) 149:107964. doi: 10.1016/j.soilbio.2020.107964
39. Vidal A, Hirte J, Bender SF, Mayer J, Gattinger A, Höschen C, et al. Linking 3D soil structure and plant-Microbe-Soil carbon transfer in the rhizosphere. Front Environ Sci (2018) 6:9. doi: 10.3389/fenvs.2018.00009
40. Helliwell JR, Sturrock CJ, Mairhofer S, Craigon J, Ashton RW, Miller AJ, et al. The emergent rhizosphere: imaging the development of the porous architecture at the root-soil interface. Sci Rep (2017) 7:1–10. doi: 10.1038/s41598-017-14904-w
41. Lucas M, Schlüter S, Vogel H-j, Vetterlein D. Roots compact the surrounding soil depending on the structures they encounter. Sci Rep (2019) 9:16236. doi: 10.1038/s41598-019-52665-w
42. Carminati A, Vetterlein D, Koebernick N, Blaser S, Weller U, Vogel H-J. Do roots mind the gap? Plant Soil (2013) 367:651–61. doi: 10.1007/s11104-012-1496-9
43. Carminati A, Zarebanadkouki M, Kroener E, Ahmed MA, Holz M. Biophysical rhizosphere processes affecting root water uptake. Ann Bot (2016) 118:561–71. doi: 10.1093/aob/mcw113
44. Koebernick N, Daly KR, Keyes SD, George TS, Brown LK, Raffan A, et al. High-resolution synchrotron imaging shows that root hairs influence rhizosphere soil structure formation. New Phytol (2017) 216:124–35. doi: 10.1111/nph.14705
45. Kroener E, Holz M, Zarebanadkouki M, Ahmed M, Carminati A. Effects of mucilage on rhizosphere hydraulic functions depend on soil particle size. Vadose Zone J (2018) 17:1–11. doi: 10.2136/vzj2017.03.0056
46. Koebernick N, Daly KR, Keyes SD, Bengough AG, Brown LK, Cooper LJ, et al. Imaging microstructure of the barley rhizosphere: particle packing and root hair influences. New Phytol (2019) 221:1878–89. doi: 10.1111/nph.15516
47. Bodner G, Leitner D, Kaul H-P. Coarse and fine root plants affect pore size distributions differently. Plant Soil (2014) 380:133–51. doi: 10.1007/s11104-014-2079-8
48. Phalempin M, Lippold E, Vetterlein D, Schlüter S. Soil texture and structure heterogeneity predominantly governs bulk density gradients around roots. Vadose Zone J (2021) 20:1–17. doi: 10.1002/vzj2.20147
49. Aravena JE, Berli M, Ruiz S, Suárez F, Ghezzehei TA, Tyler SW. Quantifying coupled deformation and water flow in the rhizosphere using X-ray microtomography and numerical simulations. Plant Soil (2014) 376:95–110. doi: 10.1007/s11104-013-1946-z
50. Landl M, Phalempin M, Schlüter S, Vetterlein D, Vanderborght J, Kroener E, et al. Modeling the impact of rhizosphere bulk density and mucilage gradients on root water uptake. Front Agron (2021) 3:622367. doi: 10.3389/fagro.2021.622367
51. Ruiz S, Or D, Schymanski SJ. Soil penetration by earthworms and plant roots–mechanical energetics of bioturbation of compacted soils. PloS One (2015) 10:1–26. doi: 10.1371/journal.pone.0128914
52. Daly KR, Keyes SD, Roose T. Determination of macro-scale soil properties from pore scale structures: image-based modelling of poroelastic structures. Proc R Soc A: Mathematical Phys Eng Sci (2018) 474:20170745. doi: 10.1098/rspa.2017.0745
53. Dunbabin VM, Postma JA, Schnepf A, Pagès L, Javaux M, Wu L, et al. Modelling root–soil interactions using three–dimensional models of root growth, architecture and function. Plant Soil (2013) 372:93–124. doi: 10.1007/s11104-013-1769-y
54. Postma JA, Kuppe C, Owen MR, Mellor N, Griffiths M, Bennett MJ, et al. OpenSimRoot: widening the scope and application of root architectural models. New Phytol (2017) 215:1274–86. doi: 10.1111/nph.14641
55. Schnepf A, Leitner D, Landl M, Lobet G, Mai TH, Morandage S, et al. CRootBox: a structural–functional modelling framework for root systems. Ann Bot (2018) 121:1033–53. doi: 10.1093/aob/mcx221
56. Witzgall K, Vidal A, Schubert DI, Höschen C, Schweizer SA, Buegger F, et al. Particulate organic matter as a functional soil component for persistent soil organic carbon. Nat Commun (2021) 12:4115. doi: 10.1038/s41467-021-24192-8
57. Bucka FB, Kölbl A, Uteau D, Peth S, Kögel-Knabner I. Organic matter input determines structure development and aggregate formation in artificial soils. Geoderma (2019) 354:113881. doi: 10.1016/j.geoderma.2019.113881
58. Kleber M, Sollins P, Sutton R. A conceptual model of organo-mineral interactions in soils: self-assembly of organic molecular fragments into zonal structures on mineral surfaces. Biogeochemistry (2007) 85:9–24. doi: 10.1007/s10533-007-9103-5
59. Rötzer M, Prechtel A, Ray N. Pore scale modeling of the mutual influence of roots and soil aggregation in the rhizosphere: supplementary material. Front Soil Sci (2023) 3:1155889. doi: 10.3389/fsoil.2023.1155889
60. Schweizer SA, Bucka FB, Graf-Rosenfellner M, Kögel-Knabner I. Soil microaggregate size composition and organic matter distribution as affected by clay content. Geoderma (2019) 355:113901. doi: 10.1016/j.geoderma.2019.113901
61. Strock CF, Lynch JP. Root secondary growth: an unexplored component of soil resource acquisition. Ann Bot (2020) 126:205–18. doi: 10.1093/aob/mcaa068
62. Thamm A, Sanegre-Sans S, Paisley J, Meader S, Milhinhos A, Contera S, et al. A simple mathematical model of allometric exponential growth describes the early three-dimensional growth dynamics of secondary xylem in arabidopsis roots. R Soc Open Sci (2019) 6:190126. doi: 10.1098/rsos.190126
63. Pagès L, Bécel C, Boukcim H, Moreau D, Nguyen C, Voisin A-S. Calibration and evaluation of archisimple, a simple model of root system architecture. Ecol Model (2014) 290:76–84. doi: 10.1016/j.ecolmodel.2013.11.014
64. Schnepf A, Leitner D, Lobet G, Mai TH, Zörner M, Landl M. CRootBox parameter files. (2017), figshare. collection. doi: 10.6084/m9.figshare.c.3745478.v1.
65. Nguyen C, Froux F, Recous S, Morvan T, Robin C. Net n immobilisation during the biodegradation of mucilage in soil as affected by repeated mineral and organic fertilisation. Nutrient Cycling Agroecosystems (2008) 80:39–47. doi: 10.1007/s10705-007-9119-1
66. Holz M, Leue M, Ahmed MA, Benard P, Gerke HH, Carminati A. Spatial distribution of mucilage in the rhizosphere measured with infrared spectroscopy. Front Environ Sci (2018) 6:87. doi: 10.3389/fenvs.2018.00087
67. Iijima M, Sako Y, Rao T. A new approach for the quantification of root-cap mucilage exudation in the soil. Plant Soil (2003) 255:399–407. doi: 10.1023/A:1026183109329
68. Boussinesq J. Application des potentiels à l’étude de l’équilibre et du mouvement des solides élastiques: principalement au calcul des deformations et des pressions que produisent, dans ces solides, des efforts quelconques exercés sur und petite partie de leur surface ou de leur intérieur; memoire suivi de notes étendues sur divers points de physique mathématique et d’analyse. Gauthier-Villars (1885).
69. Burr-Hersey JE, Ritz K, Bengough GA, Mooney SJ. Reorganisation of rhizosphere soil pore structure by wild plant species in compacted soils. J Exp Bot (2020) 71:6107–15. doi: 10.1093/jxb/eraa323
70. Dexter AR. Compression of soil around roots. Plant Soil (1987) 97:401–6. doi: 10.1007/BF02383230
Keywords: aggregation, micro-scale, image-based model, soil organic matter turnover, root exudates, mucilage, cellular automaton method, structural self-organization
Citation: Rötzer M, Prechtel A and Ray N (2023) Pore scale modeling of the mutual influence of roots and soil aggregation in the rhizosphere. Front. Soil Sci. 3:1155889. doi: 10.3389/fsoil.2023.1155889
Received: 31 January 2023; Accepted: 23 June 2023;
Published: 01 August 2023.
Edited by:
Magdalena Landl, Helmholtz Association of German Research Centres (HZ), GermanyReviewed by:
Siul Ruiz, University of Southampton, United KingdomDaniel McKay Fletcher, Scotland’s Rural College, United Kingdom
Copyright © 2023 Rötzer, Prechtel and Ray. This is an open-access article distributed under the terms of the Creative Commons Attribution License (CC BY). The use, distribution or reproduction in other forums is permitted, provided the original author(s) and the copyright owner(s) are credited and that the original publication in this journal is cited, in accordance with accepted academic practice. No use, distribution or reproduction is permitted which does not comply with these terms.
*Correspondence: Alexander Prechtel, cHJlY2h0ZWxAbWF0aC5mYXUuZGU=; Nadja Ray, bmFkamEucmF5QGt1LmRl