 Anderson Santos de Freitas1*†
 Luís Felipe Guandalin Zagatto1†
 Gabriel Silvestre Rocha1
 Franciele Muchalak1
 Solange dos Santos Silva1
 Aleksander Westphal Muniz2Rogério Eiji Hanada3
 Siu Mui Tsai1
- 1Cell and Molecular Biology Lab, Center for Nuclear Energy in Agriculture, University of São Paulo, Piracicaba, Brazil
- 2Western Amazon Agroforestry Research Center, Brazilian Agricultural Research Corporation, Manaus, Brazil
- 3General Coordination of Research, Training and Extension, National Institute for Amazonian Research, Manaus, Brazil
Introduction: Deforestation of areas for agriculture and cattle breeding is the leading cause of ecological degradation and loss of biodiversity. The solution to mitigate these damages relies on techniques that improve soil health and the microbial quality of these degraded areas. Here, we demonstrate that the high nutrient and microbiological contents of Amazonian Dark Earths (ADE) can promote the development of trees used in ecological restoration projects.
Methods: We used degraded soil from crops as control and ADE from the Central Amazon to conduct the experiment, using 20% of ADE as inoculum in degraded agricultural soil. Our goal was to assess whether a small amount of ADE could promote changes that improve plant development similar to its growth under a 100%ADE. We simulated conversion from pasture to forest restoration area by planting U. brizantha in all pots. After 60 days, we removed it and planted Cecropia pachystachya, Peltophorum dubium, and Cedrela fissilis.
Results: Our results demonstrated that both 20%ADE and 100%ADE treatments increased pasture productivity and, consequently, soil carbon stock. Also, in these treatments, P. dubium and C. fissilis had better growth and development, with 20%ADE plants showing a performance similar to those planted in 100%ADE. Both 20%ADE and 100%ADE showed similar numbers of taxa, being significantly higher than in the control soil.
Discussion: The 20%ADE was sufficient to increase significantly the microbial richness in the soil, providing several beneficial microorganisms to all tree species such as Pedomicrobium, Candidatus Nitrososphaera, and members of Paenebacillaceae. Nevertheless, C. pachystachya, a common pioneer tree in the Amazonian Forest showed a small response even to 100%ADE with a corresponding lower taxa number than the other two species. In conclusion, we point out that microbial structure remains very similar among plants but dissimilar among treatments, highlighting the role of ADE as an enhancer of plant development and beneficial microbiota enrichment in the rhizosphere. The use of 20%ADE was sufficient to alter the microbial community. Therefore, we believe our data could contribute to speeding up forest restoration programs by adopting new biotechnological approaches for forest restoration ecology.
1 Introduction
The rising loss of forest cover is one of the key drivers of global climatic changes. It is urgent to find and apply suitable and cost-effective solutions to mitigate this problem (1). In Brazil, more than 189 hectares of forest were lost per hour in 2021, mainly due to pastures opening for cattle breeding (2). Over 8% of the Amazon rainforest was lost only to this practice in the last 33 years, equivalent to the loss of eighteen trees per minute (3, 4).
Projects for the recovery of natural forests have increased in the past decades, but are still insufficient and need more effort to become reliable and efficient in the long term (5). Passive restoration is the main restoration approach used in Brazil, mainly due to land-use history and reduction of costs, but new techniques and products that raise the restoration power and speed lead to better perspectives in the future (6). Some of these improvements rely on the adoption of active restoration, once this approach accelerates and improves the canopy cover, species density, and the number of trees in the forest environment (7).
Additionally, one of the most promising fields of study in plant technology, and consequently active restoration, is the introduction of microorganisms for promoting better adaptations in plants. Several studies have investigated microorganisms with the potential to improve plant growth (8), drought resistance (9), and availability of nutrients (10), and the microbes that may enhance restoration could be in their forests. It’s also already known the potential of some trees to recruit nitrogen-fixing bacteria, increasing the general soil fertility, proving that the interaction between plants and microbes is a key factor for soil health (11).
The crucial point to prospect for these beneficial microorganisms is to study the soils of the forest as they harbor a wide diversity of species and functions that help the forest maintain itself (12). Some examples are the Amazonian Dark Earths (ADE), which are small portions of soil located close to rivers and ancient populations’ habitations in the Amazon rainforest. The formation of these soils is correlated with the human action of pre-Columbian natives due to the presence of pottery artifacts, bones, and biochar in their superficial layers (13, 14). For this reason, they present high organic matter content, huge availability of nutrients, and no toxic compounds (15, 16). Studies have revealed their potential to build a suppressive soil that enhances plant growth and production as well as inhibits pathogens and diseases (17).
Based on this, we compared the soil microbial shifts in the transition from pasture to trees in ADEs and agricultural control soil. We also measured the effects of the addition of 20% of ADE on the control, aiming to map whether ADE can enhance the growth of forest species to restoration and provide microorganisms of interest to restoration in an environment of warm temperatures, as the first step for a biotechnological solution for ecological restoration. We hypothesized that the introduction of a small portion of ADE could provide positive feedback and improve soil microbial health and plant growth.
2 Materials and methods
2.1 Soil sampling
This study was registered in the Brazilian National System for Management of Genetic Patrimonial and Associated Traditional Knowledge (SISGEN) under the access number AD13FB3. Control agricultural soil was collected from an experimental field of the “Luiz de Queiróz” Superior School of Agriculture (ESALQ-USP) located in Piracicaba-SP, Brazil (22°71’52’’ W, 47°63’20’’ S). The soil was characterized as sandy loam by the USDA classification system (18). Dark Earths were collected in a secondary forest from the Caldeirão Experimental Research Station from Embrapa Amazônia Ocidental, located in Iranduba-AM, Brazil (60°23’00’’ W, 03°26’00’’ S) and transported to the Cell and Molecular Biology Laboratory, located at Piracicaba-SP, Brazil.
Soil samples from control and ADE initial soils were collected at three random points in each area, 15 meters apart from each other. We collected soil only from the arable layer of the soil (0–20 cm) and soils from each area were mixed to generate a composed substrate for downstream analysis.
2.2 Experimental design
For the experiment, the purpose was to mimic the transition of pasture to restoration in a controlled vase environment. Thirty-six 4L pots (20 cm diameter, 16 cm height) were filled with 3 kg of soil, 12 of them with agricultural soil (Control), 12 with 100% Dark Earths (100% ADE), and 12 with a mixture of Control and ADE in a proportion of 4:1 (20% ADE), according to the literature recommendations for feedback experiments (19).
All pots were distributed in a completely randomized assay in a greenhouse and then irrigated. After 48 h of acclimatization, for the first phase of the experiment, we sowed U. brizantha seeds, the main pasture species used in Brazil, in all pots to simulate pasture seeding. Two weeks later, we normalized the number of plants per pot and conducted this phase for 60 days. Posteriorly, we cut the grasses, leaving only its roots in pots. For the second phase of the experiment, those 36 pots with conditioned soils were divided into three groups per soil with four pots each. Each four pots group was used for the plantation of a primary species (Cecropia pachystachya), a secondary species (Peltophorum dubium), or a climax species (Cedrela fissilis), forming an arrange of 3 plants x 3 soils with 4 replicates per treatment. This second phase was conducted for 90 days. The greenhouse temperature was kept at 33.7 ± 4.6 °C during the whole experiment, considering a scenario of Earth heating due to climatic changes (20).
At the end of the second phase, we measured plant height, and root size, and collected the aerial part of the plants to measure dry matter production, the most important characteristic of measuring plant development (19). Plant tissues were dried in oven at 60 °C for 48 h and then weighed. For each pot, the chemical and physical properties of the soil were assessed through analyses performed by specialized laboratory (Agrilab. Botucatu, Brazil), following the methodologies suggested by van Raij and colleagues (21). The parameters evaluated were the amount of organic matter (oxidation), pH (CaCl2), phosphorus (resin), potassium (resin), calcium (resin), magnesium (resin), aluminum (KCl), sulfur (calcium phosphate), boron (hot water), copper (DTPA), iron (DTPA), manganese (DTPA) and zinc (DTPA), and the soil texture. We also collected vase soil for DNA extraction and for downstream molecular procedures.
2.3 Molecular procedures
We extracted the whole genomic DNA from the final 36 experimental pots, as well as 4 replicates of each initial soil (Control and ADE separated before the experiment start), totaling 44 different samples. The extraction was carried out with the DNeasy PowerLyzer PowerSoil KitTM (Qiagen, Hilden, Germany) following the modifications proposed by Venturini and colleagues for tropical soils (22). DNA quality and concentration were measured using the NanoDrop 2000c spectrophotometer (Thermo Fisher Scientific, Waltham, MA, United States).
The V4 region of the 16S rDNA was amplified to access the abundance of prokaryotes (bacteria and archaea) from samples by using the updated primers 515F (23) and 816R (24). The paired-end sequencing with 2 x 250 bp reads was performed in Illumina HiSeq 2500 platform. Both amplification and sequencing were performed by Novogene Bioinformatics Technology using standard approaches as defined by the Earth Microbiome Project (25). The raw reads from this sequencing were deposited in the SRA under the Bioproject PRJNA932330.
2.4 Data analyses
All statistical analyses related to the second phase of the experiment were performed using the following design: three soils (Control, 100%ADE, and 20%ADE), three tree species (C. pachystachya, P. dubium, and C. fissilis), and four replicates.
All bioinformatics and statistical analyses were carried out in the R environment (version 4.2) using the RStudio program (version 2022.2.3.492) (26). All figures were produced using the package ggplot2 (27). The whole scripts could be publicly found at GitHub (https://github.com/FreitasAndy/freitasetal2023_FSC). As the Shapiro-Wilk test showed the data did not fit in normal distribution and we had few samples in each group (n < 30), it was not possible to treat the data as normally distributed. Data was not transformed or normalized to avoid misinterpretations.
Differences in plant production (dry mass, roots size, and plant height) among groups were analyzed by Kruskal-Wallis followed by post hoc Dunn test (28). In a similar way, differences in soil texture and chemical properties (OM, pH, P, K, Ca, Mg, H, Al3, S, Cu, Fe, Mn, Zn, sand, clay, and silt) among groups were analyzed by Kruskal-Wallis post hoc Dunn test (28).
For the microbial communities analysis, raw reads were analyzed using the DADA2 pipeline (29), considering acceptable sequences with a quality score greater than 30. Filtered reads were grouped into amplicon sequence variants (ASVs) and matched to taxonomy using the SILVA database v. 138.1 (30). The resulting ASV table was imported into a phyloseq object (31) for downstream analysis. The sequencing effort was measured by Good’s coverage (32).
We measured observed microbial diversity by calculating the number of different taxa identified in each soil sample and measured the dominance of samples by calculating the inverse Simpson index (33), considering as different at confidence level of 95% by the Kruskal-Wallis test. For dissimilarity analysis, we transform the dataset by a centered log-ratio, aiming to reflect the compositional structure of the data (34). The data ordination was made by the Euclidean distance and plotted the principal coordinates on two axes. Significance was calculated by permutational multivariate analysis of variance (PERMANOVA), at the level of significance of 5%, using the adonis function from the package vegan (35).
For taxonomic analysis, we plotted the phyla distribution for all samples. We also performed the redundancy analysis (RDA) using all chemical and sequencing data (at family level) as explanatory variables for the dissimilarity (response variable) among samples, aiming to find the key drivers for differentiation over the substrates (Control, 20%ADE, and 100%ADE). Besides, we predicted the most important genera for the classification of groups by using a random forest analysis and estimated the functional abundance through the algorithm FAPROTAX (36). All these final analyses were carried out in the microeco package (37).
3 Results
3.1 Control soil and ADEs have very different chemical compositions
At the beginning of the experiment (before we planted the plants), initial ADEs have shown higher amounts of nutrients than the control soil. There was 3-fold more organic matter in ADE than in control, besides higher amounts of magnesium, sulfur, and potassium (Table 1). The levels of phosphorus in ADE were 30-fold higher than in the control, followed by calcium (six-fold higher), zinc, calcium (five-fold higher), iron, carbon, and copper (four-fold higher). Additionally, the ADE’s mean pH was higher and it has more sand and silt and less clay than the control. The only nutrient which was depleted in ADE was manganese, for which the control had a higher amount (9.6mg/dm³ vs. 2.0mg/dm³ from ADEs). At the end of the experiment, after removing the plants, these relations between the soil parameters and the treatments were maintained with 100% ADE pots presenting higher levels of nutrients than control as well as 20% ADE pots with intermediate mean values for the same nutrients (Table 1).
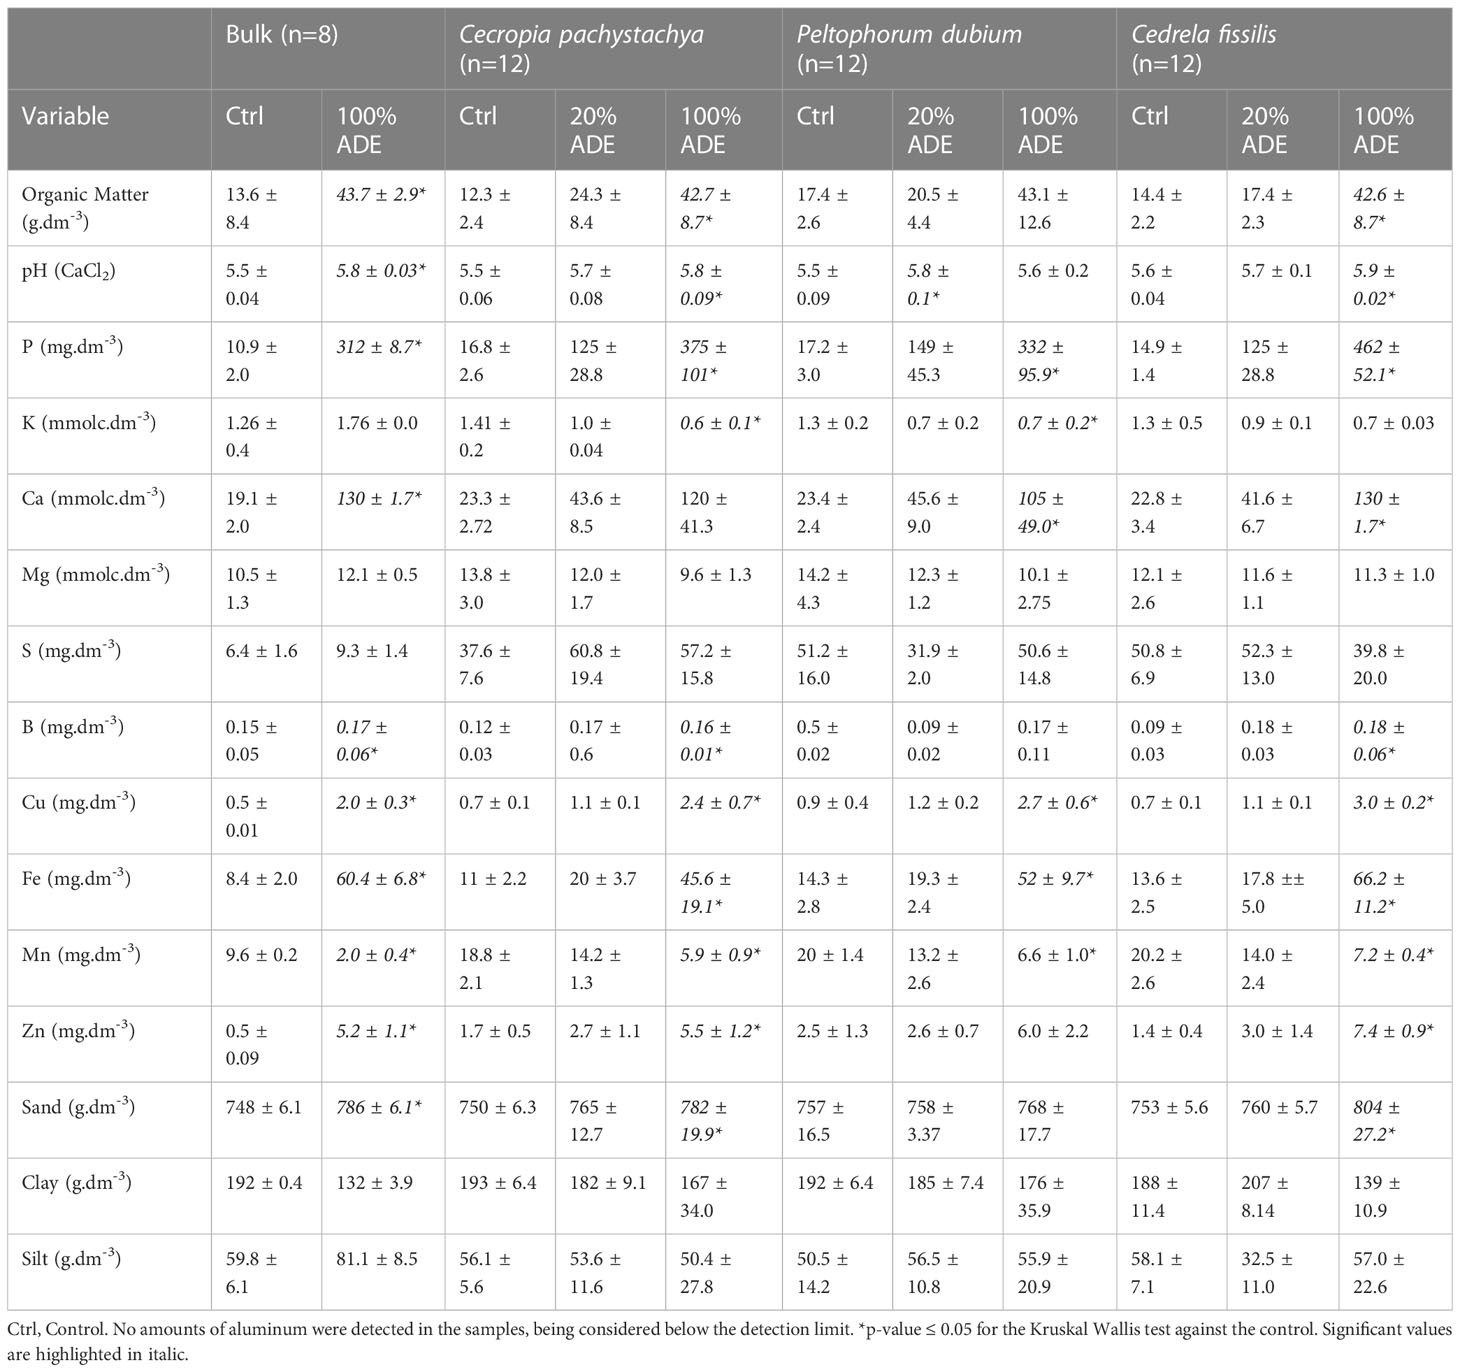
Table 1 Description of chemical variables for each treatment and initial soils.
3.2 Twenty percent of ADE improve survival, growth, and mass production in non-primary trees
The use of ADEs in vases was very successful in establishing and growing plant trees. The initial U. brizantha produced more than twice the dry matter cultivated with 20% of ADE and almost five times more with 100% of ADE compared with the control (Figure 1A). For the primary species C. pachystachya, no plant has survived in control vases nor 20% of ADE vases, but all plants have survived in only ADE pots. The secondary P. dubium survived but had a minimum dry mass production in control pots. The climax plant C. fissilis was the only one that survived well in the control substrate (Figure 1B).
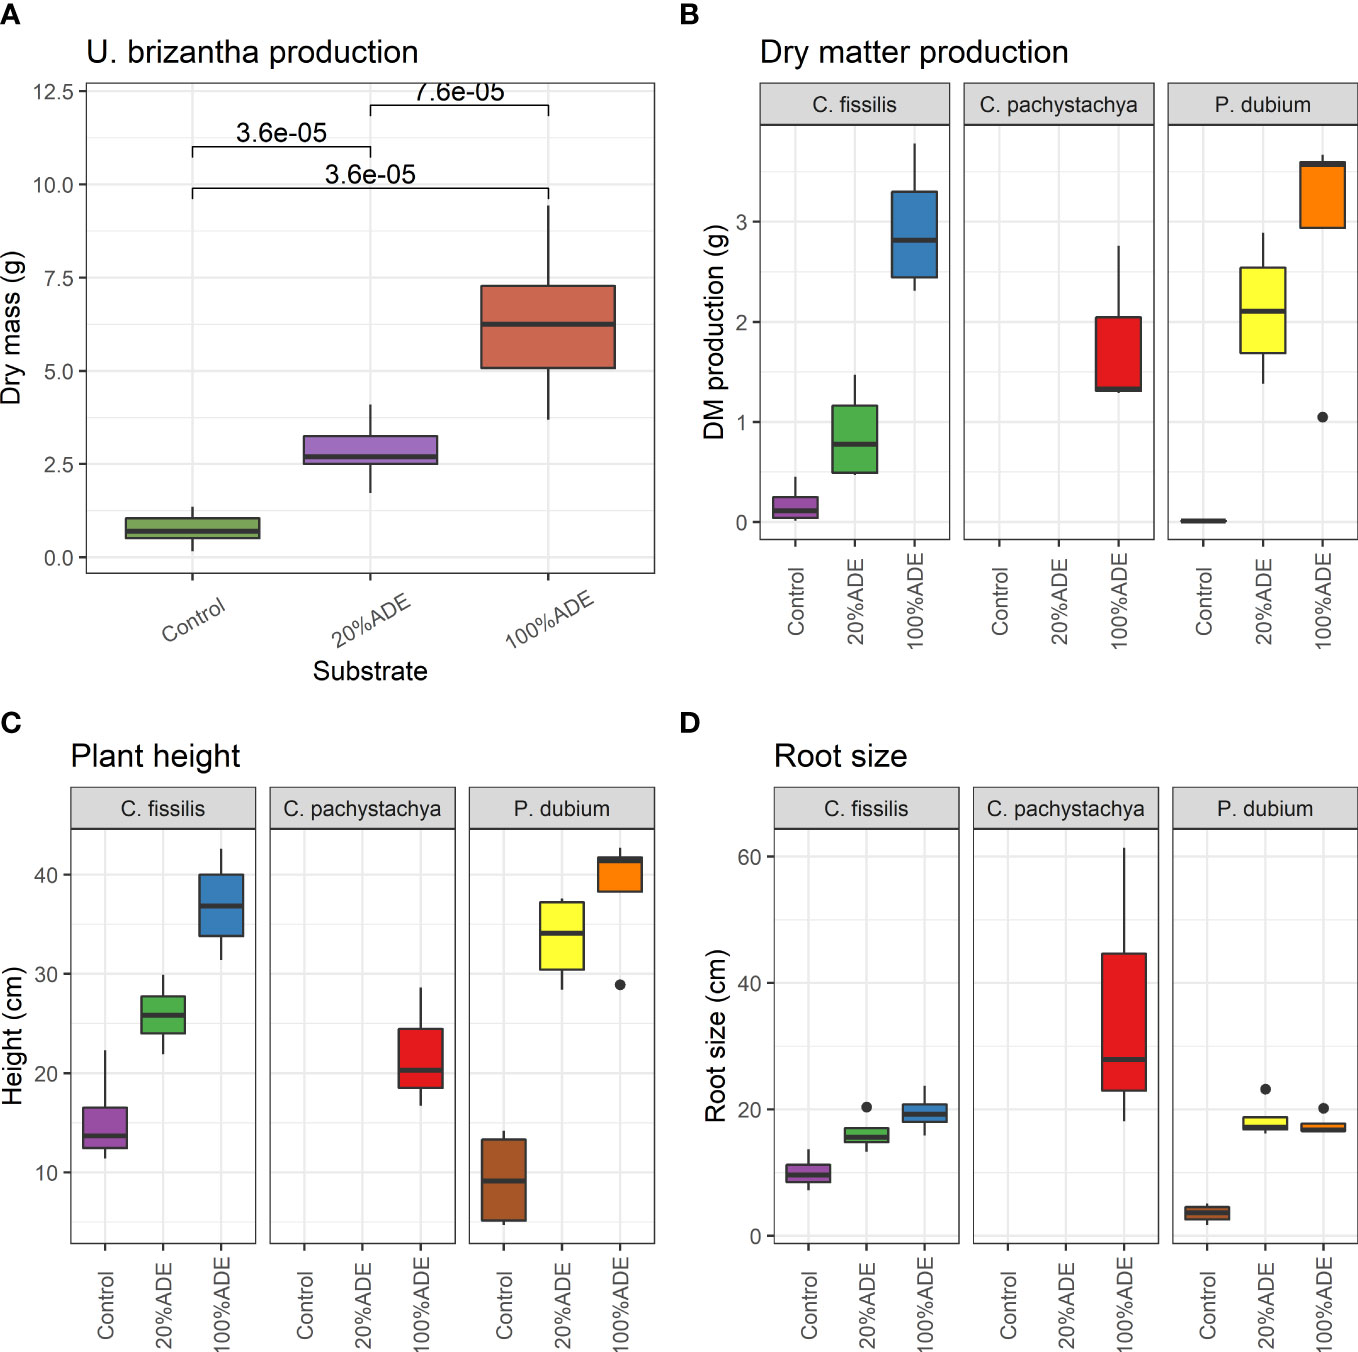
Figure 1 Evaluation of plant parameters for each Control, 20%ADE, and 100%ADE substrates in the experiment. (A) Dry mass production of U. brizantha cv. Marandu after 60 days of seeding, at the end of phase I. (B) Dry mass production of C. fissilis, C. pachystachya, and P. dubium after 120 days of planting, at the end of phase II. (C) Plant height of the same species in B after 120 days of planting. (D) Root length of species from B and C after 120 days. Boxes span the first to third quartiles; the horizontal line inside the boxes represents the median. Whiskers extending vertically from the boxes indicate variability outside the upper and lower quartiles, and the single black circles indicate outliers. All observations are significantly different from each other in treatments, except root size (20%ADE x 100%ADE is not significant), by the Kruskal Wallis post hoc Dunn test at a significance level of 95%.
All tested plants in phase 2 also had an increase in height and dry matter production with the addition of ADE (Figure 1C). Even in the 20%ADE treatment, the plants grew more and produced more dry mass than plants in the control. However, the root size was not significantly different among treatments for C. fissilis, and although lower in control pots with P. dubium, there was no difference between 20% and 100% of ADE (Figure 1D). In short, all the additions of ADEs improved the growth and development of trees under warm conditions.
3.3 The ADE inclusion increased microbial diversity, and microbial distribution was similar among treatments
The microbial communities differ in the initial soils (Control x ADE before the experiment start), mainly driven by the lower levels of Acidobacteria in ADE compensated by the higher levels of Firmicutes. This pattern was maintained at the end of the experiment, independently of the tree planted in the pot. Generally, there were few differences in the phyla distribution among treatments neither between the beginning and end of the experiment (Figure 2).
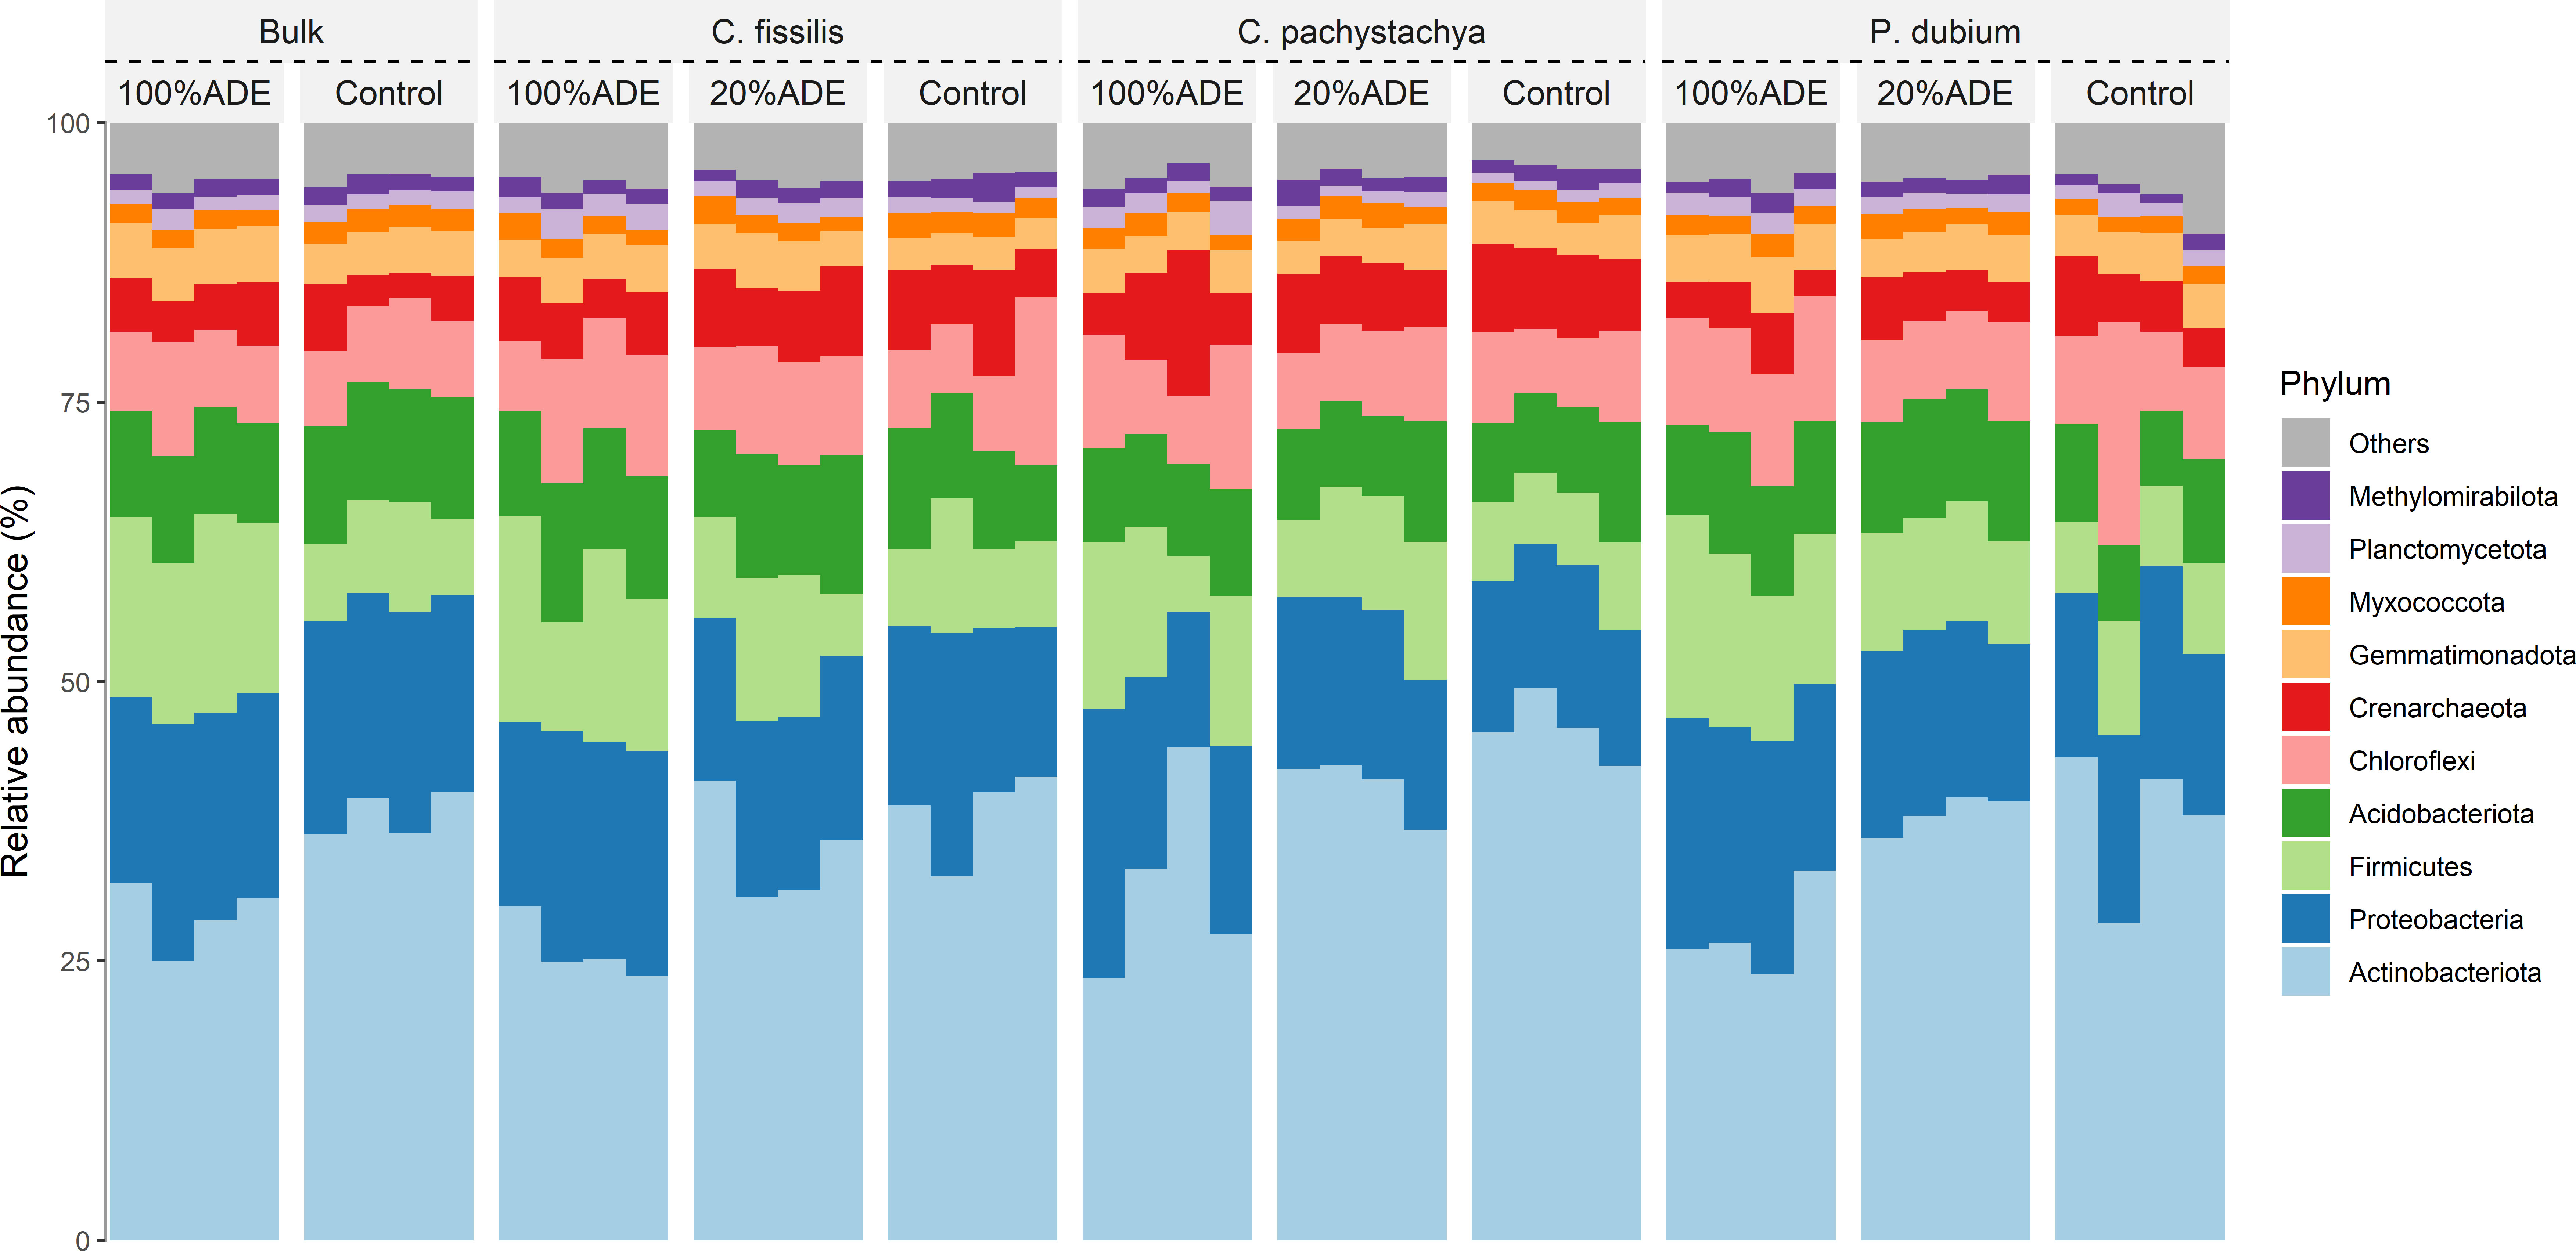
Figure 2 Frequencies of the ten most abundant phyla in each plant in each treatment. Bulk means the initial soils that were used to produce the studied vases. The panels represent the average of phyla per sample.
The diversity level was similar between ADE and Control at the experiment start, but decreased with the addition of plants on them, mainly in the control at the end of the experiment. Besides, in all pots with 20% or 100% of ADE, there were more microbial taxa than in the control with the same plant (Figure 3B). The effect of ADE is also seen in the beta diversity analysis when almost all samples with 100% ADE group together and the 20%ADE group formed a cluster between the two groups (Figure 3B). The effects of substrate and trees were low, but significant to separate the groups (R2 = 0.11, p-value = 0.001). Initial samples were the most distant from the center of dispersion and among themselves, whereas all plants tended to group but were separated by the substrate (Figure 3B).
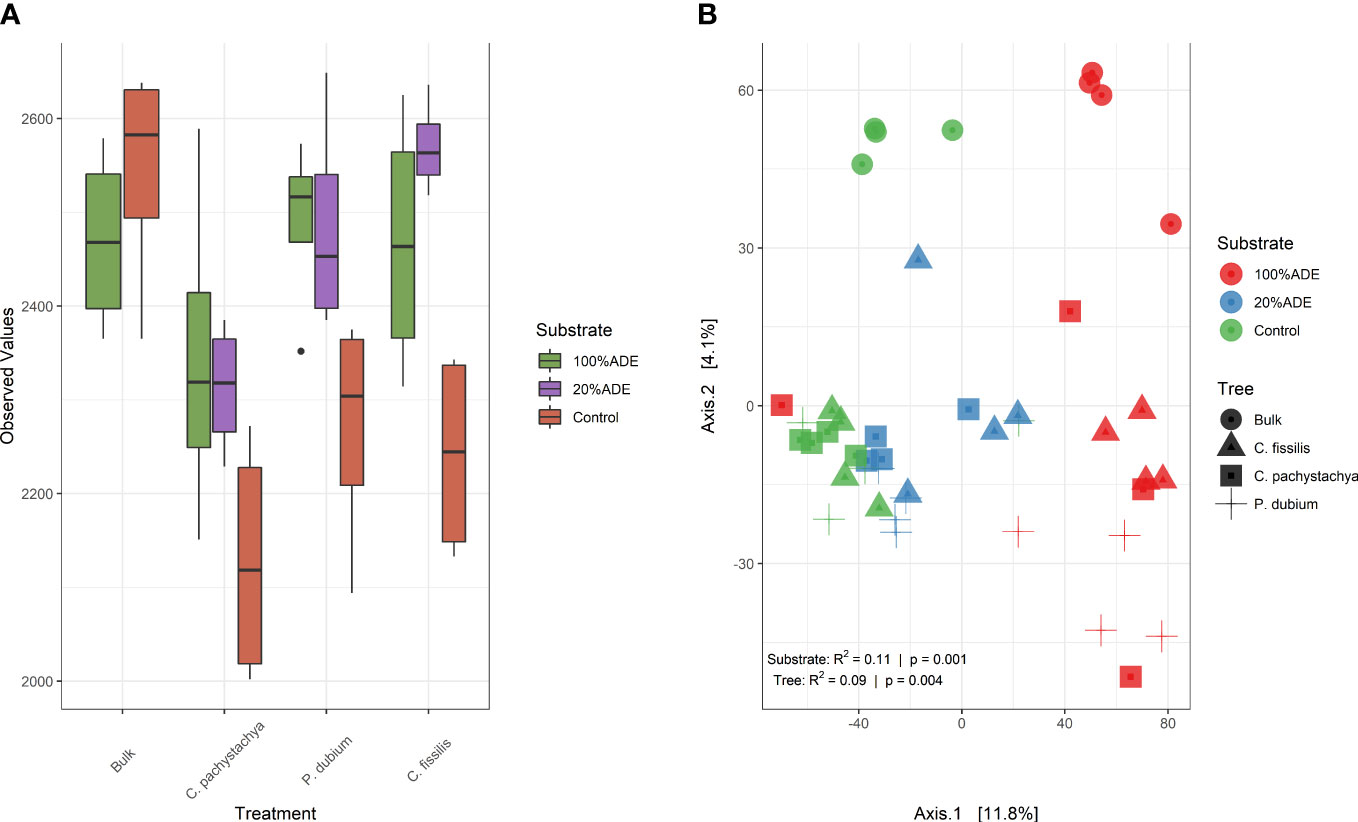
Figure 3 Diversity analysis of samples. (A) Alpha diversity. Observed diversity (represented by the total number of ASVs observed) of microbial communities in each group. There are no significant differences among plants, but control communities have less diversity in all C. pachystachya, P. dubium, and C. fissilis (p < 0.05 in Kruskal Wallis post hoc Dunn test. (B) Beta diversity. Overall comparisons of samples based on principal coordinate analysis (PCoA) measured by the Euclidean distance. Points closer to each other represent similar microbial communities, while points farther from each other represent dissimilar microbial communities. The statistical significance for the differences among both substrate and tree species was calculated by perMANOVA and is shown in the figure.
3.4 The ADE effect on plants is driven by both nutrients and microbes
The redundancy analysis showed that 100%ADE microbial communities were highly correlated with the nutrient amounts, mainly Zn, Cu, Ca, and P, independently of the tree planted (Figure 4). The grouping of these pots was also driven by the families Paenibacillaceae, Planococcaceae, Micromonosporaceae, and Hyphomicroblaceae. On the other hand, the control was more driven by the amounts of K and Mg, as well as by the abundance of the families Nitrososphaeraceae, Gaiellaceae, Solirubrobactereaceae, 67-14, and Nocardioidaceae (Figure 4). As shown in beta diversity analysis (Figure 3B) the 20% ADE group grouped between Control and 100% ADE, representing the intersection of the other two substrates.
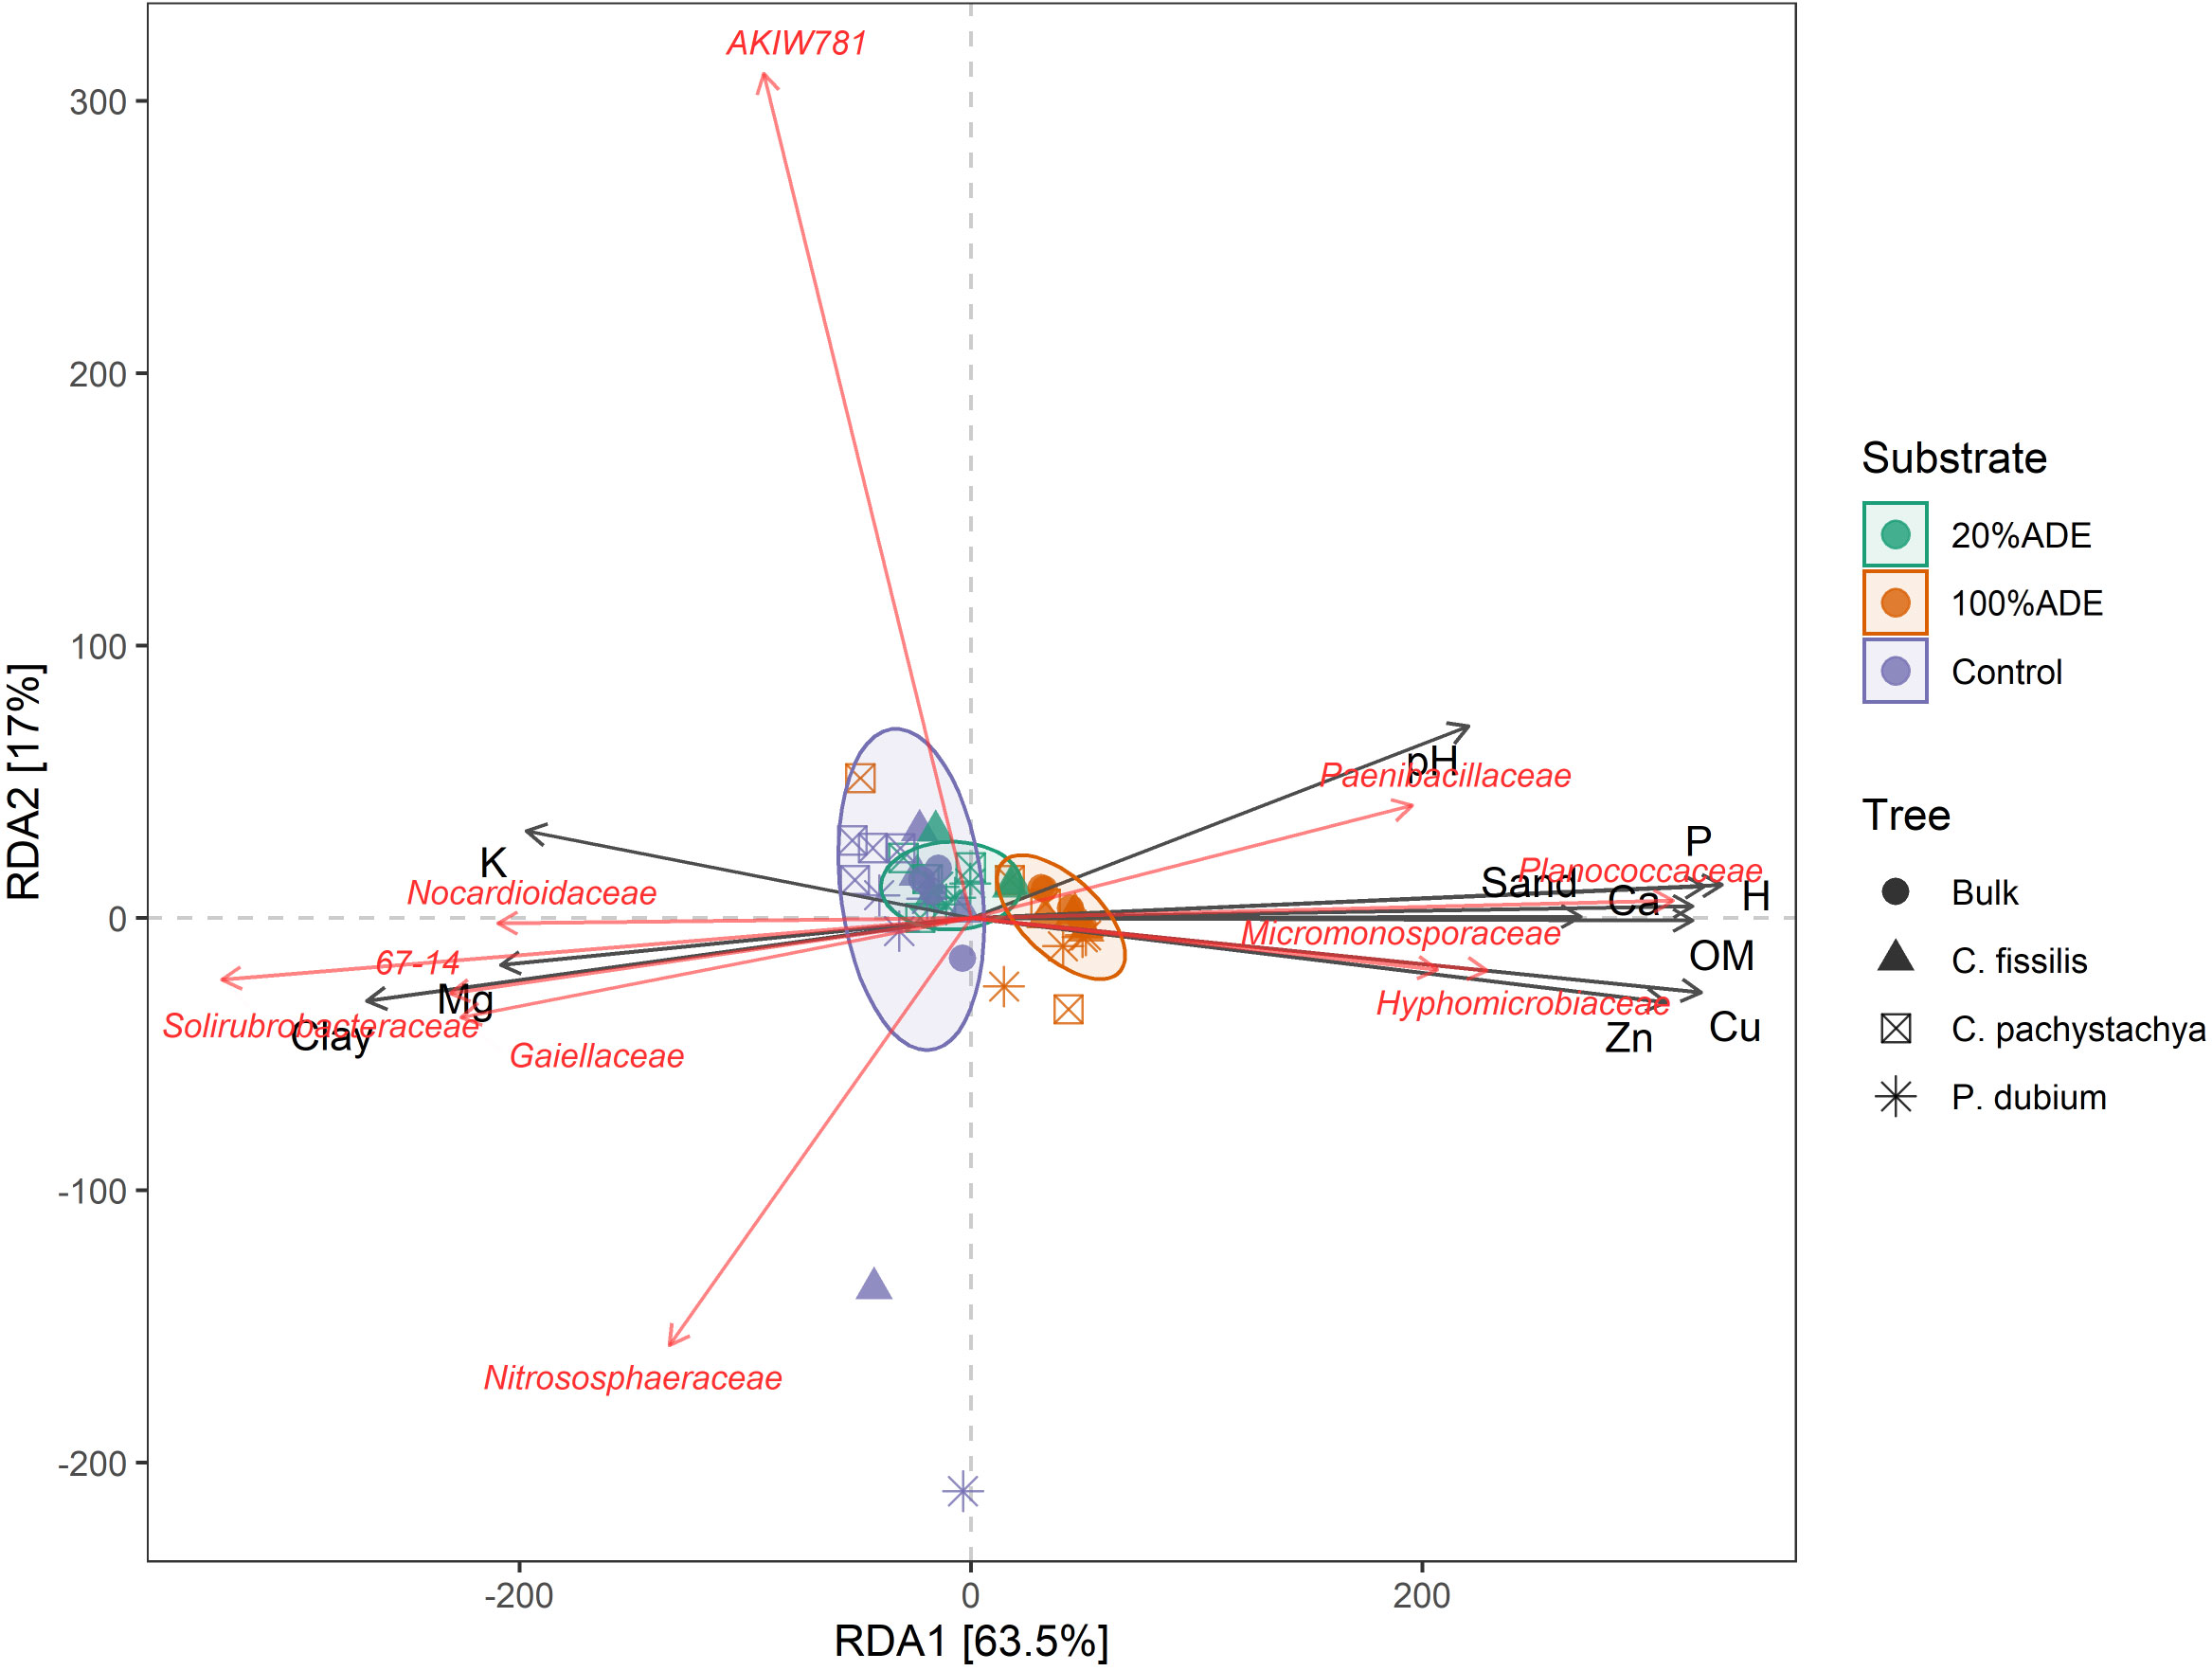
Figure 4 The first two dimensions of the ordination space from redundancy analysis ordination (RDA) for variables related to the vase’s chemistry and microbial composition at the family level. Colors indicate the substrate and shapes indicate the tree species.
The random forest analysis has found that members of these families could be used as biomarkers of the substrate. The main biomarkers of the control are archaea from the family Nitrososphaeraceae: Candidatus Nitrocosmicus (Figure 5). Gaiella, Labrys, Nocardioides, RB41, and Actinomycetospora are also biomarkers for the control. For 100%ADE, the main biomarker was Candidatus Nitrosphaera, also an archaeon from the family Nitrososphaeraceae (Figure 5). Actinomadura, Luedemannella, Microbispora, and Pedomicrobium were also important markers of ADE. Finally, only Aeromicrobium was a biomarker of the 20%ADE treatment.
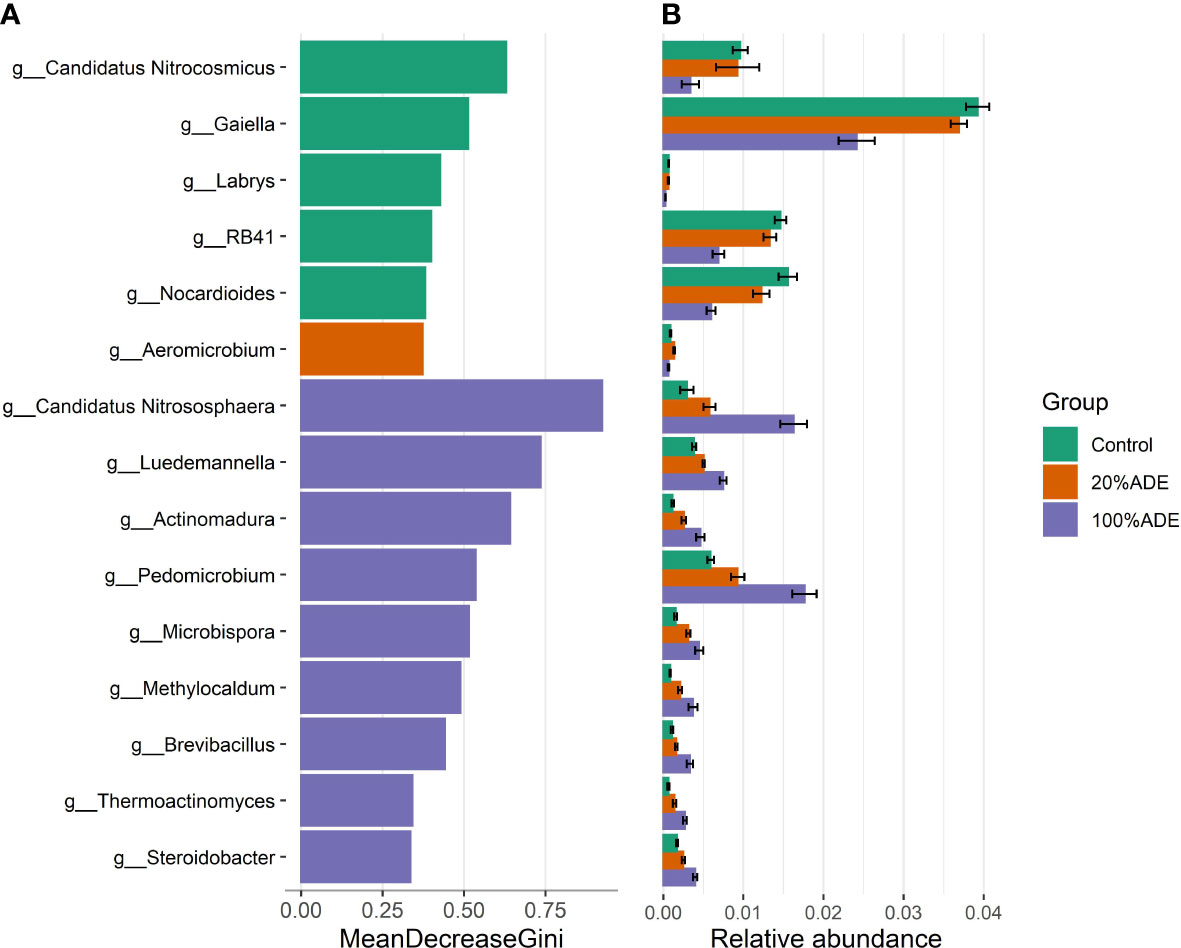
Figure 5 Random forests analysis for biomarkers of each substrate. (A) The 15 most important microbial genera for the classification of each group. (B) The relative abundance of each one of these genera in each substrate. Data are shown in mean ± standard deviation.
Looking at the functional profiles, the only process with a difference among treatments is nitrogen fixation. The control soil presented more nitrogen-fixing bacteria than ADE, and this pattern was kept in P. dubium pots, which had fewer nitrogen fixers when grown in 100%ADE than in the control. However, this pattern was reverted by C. fissilis, which had higher abundance of nitrogen fixers in 100% ADE pots than in control (Table 2). The other functions (methanogenesis, methanotrophy, hydrocarbon degradation, fermentation, nitrification, and denitrification) had no difference either among treatments or compared with initial samples.
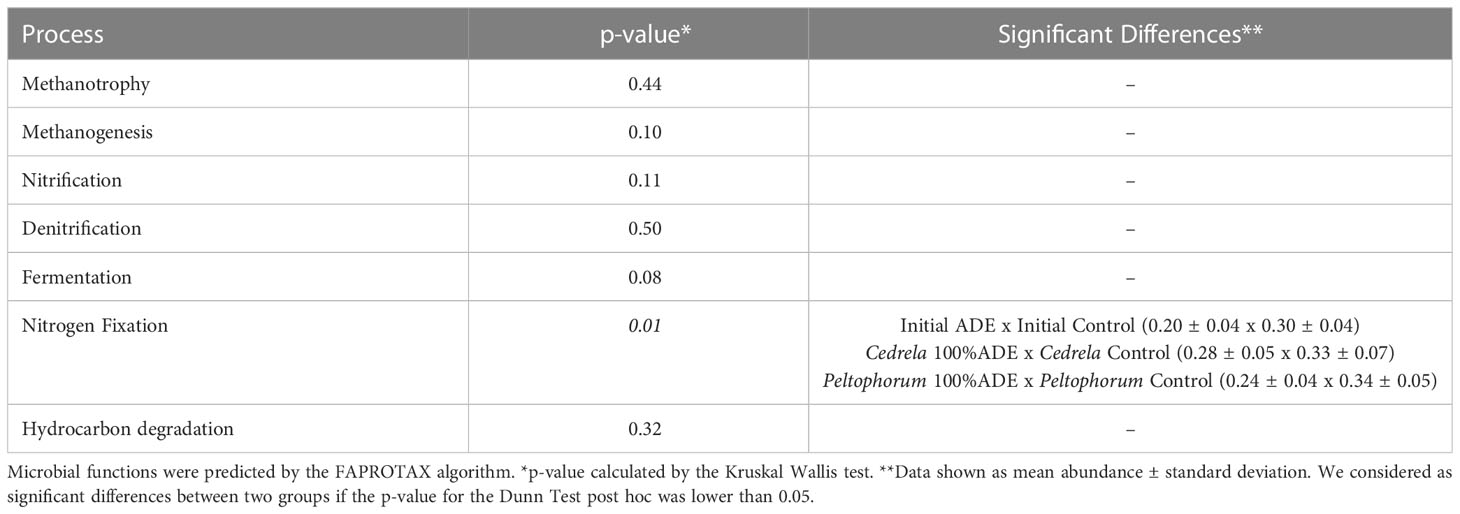
Table 2 Differences in predicted microbial functions between groups.
4 Discussion
The improvement in restoration ecology starts with works that attempt to find insights into the environment to produce useful knowledge. Here, we present the Amazonian Dark Earths as a source of improvements to restoration by enhancing tree plant growth over warm temperatures. Our results suggest that both nutrient and microbial contents drive those improvements.
The reported huge amount of nutrients in ADEs (Table 1) is coherent with recent works that attempted to map chemical patterns in this type of soil. High levels of P, Ca, Mg, and Zn were found in ADE forest soils all over the Amazon, highlighting the homogeneity of this soil formation and its potential as a restoration enhancer (15, 38, 39). First, the inclusion of at least 20% of ADE in the soil has improved U. brizantha production (Figure 1), the most used forager in Amazonian pastures (40), increasing the capacity of the system to produce biomass. Higher production of U. brizantha could be positive either by the increasing availability of animal food in future agroforestry systems as well as by the benefits of this grass such as carbon sequestration, soil coverage, and recruitment of mycorrhizas, enhancing the general soil quality for downstream approaches (41). Those benefits are still bigger considering a temperature increase, as we conducted in the experiment and as the Earth is going for (42).
The ADE addition followed by the growth of U. brizantha also increased the development of the three tree species studied. The primary species C. pachystachya couldn’t even establish in control or 20%ADE treatment. Cecropia species use to grow up in glades, starting natural processes of recovery (43). However, as we saw here, their potential to survive in warmer conditions could be affected. Even though the annual temperature range in the Amazon rainforest is between 22 and 28 °C, studies have shown an increase of 0.18 °C per decade in the Earth’s average temperature since 1981, leading to each year warmer scenarios as well as the most extreme one we tested here (44). For the other species, both P. dubium and C. fissilis were able to grow in control but produced much more dry matter with the addition of ADE (Figure 1). In fact, the use of non-primary species is recommended for restoration since they can accelerate the process, by improving soil quality and recruiting wildlife (45, 46).
The main reasons for the success of plants in ADE may rely on both nutrient content and specific microorganisms. The huge amount of Ca, OM, Zn, and Cu has already been shown to improve the growth of many Amazon trees (47). Besides, native people from the Amazon have used the ADE to plant food over centuries, and don’t need fertilization for the plants (38). The ADE is also known to present a stable microbial community all over the sites in the forest, very often dominated by a few fungal taxa and soil-borne bacteria (39, 48). In our data, it is clear the microbial differentiation between control soil and ADEs soils. The increase in Firmicutes in initial ADE was kept independent of the plant in the pot, as well as the decrease of Actinobacteriota (Figure 2). Those patterns may be due to the soil origin since Firmicutes are lactic acid bacteria correlated to pathogen protection in forests (ADE used came from a secondary forest) and Actinobacteriota is one of the main phyla present in the rhizosphere of crop plants (control came from an agricultural soil) (9, 49). We also reported a decrease in diversity for all plants in the control (Figure 3A). However, for ADE and 20%ADE there was no decrease in observed diversity when we compared ADE plants with initial ADE, supporting the current theory that plants shape the microbial community around the roots by selecting those that are beneficial to them (50, 51).
The microbial community selected by each species was similar, but different when considering each treatment (Figure 4). The family Paenibacillaceae, for example, was one of the most influential taxa to identify and separate ADE samples from other groups. This family includes microorganisms that produce biopesticides and enhance plant growth, which may help the plants in the restoration process (52). In fact, the Paenbacillaceae genera Brevibacillus and Thermobacillus were associated with ADE pots (Figure 4) and are known by their potential as plant growth-promoting rhizobacteria, biocontrol agent against plant diseases and the decomposition of biomass (53, 54). Besides, archaea from the genus Candidatus Nitrososphaera were the main taxa for classifying ADE pots. This genus is an ammonia-oxidizing genus that could resist high levels of heavy metals (55). Finally, many other beneficial genera were found as increased in ADE pots, i.e. the manganese-oxidizing Pedomicrobium, and the complex organic compounds degrading Luedemannella (56, 57).
Alternatively, control samples are closest defined by the phylogenetically related families Gaiellaceae, Nocardioidaceae, Solirubrobactereaceae, and 67-14, all of them composed of Gram-positive aerobic bacteria from the phylum Actinobacteriota (58, 59). These differences were inherited from the initial soils when the control presented more Actinobacteriota than ADE in response to a decrease in Firmicutes and kept in all plants at the end of the experiment (Figure 2).
In short, our data point to a mixture of soil nutrients and adapted microorganisms to improve the establishment of plant trees in restoration. ADEs provide a wide range of organic matter, chemical compounds, and microorganisms that enhance plant development and may be used as biotechnological solutions in restoration ecology.
Data availability statement
The datasets presented in this study can be found in online repositories. The names of the repository/repositories and accession number(s) can be found in the article.
Author contributions
AF: designed and performed the experiment, analyzed the data, wrote the paper. LZ: designed and performed the experiment, analyzed the data, wrote the paper. GR: performed the experiment, wrote the paper. FM: performed the experiment, validated the results. SS: validated the results, wrote the paper. AM: analyzed the data, validated the results. RH: provided technical support, wrote the paper. ST: designed the experiment, provided financial support, wrote the paper. All authors contributed to the article and approved the submitted version.
Funding
This work was supported by the São Paulo Research Foundation (FAPESP; grant numbers 2020/08927-0, 2018/19000-4, 2014/50320-4 and felowships 2021/10.626-0, 2021/10.716-0, 2021/11.386-3), the National Council for Scientific and Technological Development (CNPq; grant numbers 423437/2021-6, 314806/2021-0 and fellowship 140237/2022-4), and the Coordination for the Improvement of Higher Education Personnel - Brasil (CAPES; fellowship 887.597909/2021-00) - Finance Code 001.
Acknowledgments
We thank Wagner Piccinini for the assistance in the field and the Large-Scale Biosphere-Atmosphere Program (LBA), coordinated by the National Institute for Amazon Research (INPA), for the logistical support and infrastructure during field activities, and the Bauru’s Municipal Botanical Garden for the plant donation to the experiments and the technical support.
Conflict of interest
The authors declare that the research was conducted in the absence of any commercial or financial relationships that could be construed as a potential conflict of interest.
Publisher’s note
All claims expressed in this article are solely those of the authors and do not necessarily represent those of their affiliated organizations, or those of the publisher, the editors and the reviewers. Any product that may be evaluated in this article, or claim that may be made by its manufacturer, is not guaranteed or endorsed by the publisher.
References
1. Lemos LN, Pedrinho A, de VATR, SM T, Mendes LW. Amazon Deforestation enriches antibiotic resistance genes. Soil Biol Biochem (2021) 153:108110. doi: 10.1016/j.soilbio.2020.108110
2. Azevedo T, Rosa MR, Shimbo JZ, de Oliveira MG, Valdiones AP, Lama CD, et al. Relatório Anual Desmatamento (2021) 2022:126.
3. Alves-Pinto HN, Latawiec AE, Strassburg BBN, Barros FSM, Sansevero JBB, Iribarrem A, et al. Reconciling rural development and ecological restoration: strategies and policy recommendations for the Brazilian Atlantic forest. Land Use Policy. 1o janeiro (2017) 60:419–26. doi: 10.1016/j.landusepol.2016.08.004
4. Projeto MapBiomas. Coleção 4.1 da série anual de mapas de cobertura e uso de solo do brasil. (2020). Available at: https://plataforma.brasil.mapbiomas.org/cobertura.
5. Nunes S, Gastauer M, Cavalcante RBL, Ramos SJ, Caldeira CF, Silva D, et al. Challenges and opportunities for large-scale reforestation in the Eastern Amazon using native species. For Ecol Manag 15 junho (2020) 466:118120. doi: 10.1016/j.foreco.2020.118120
6. Buckingham K. Beyond trees: restoration lessons from china’s loess plateau. In: China’s new sources econ growth. ANU press vol. 379. (2016).
7. Brancalion PHS, Schweizer D, Gaudare U, Mangueira JR, Lamonato F, Farah FT, et al. Balancing economic costs and ecological outcomes of passive and active restoration in agricultural landscapes: the case of Brazil. Biotropica novembro (2016) 48(6):856–67. doi: 10.1111/btp.12383
8. Finkel OM, Salas-González I, Castrillo G, Conway JM, Law TF, Teixeira PJPL, et al. A single bacterial genus maintains root growth in a complex microbiome. Nat 5 novembro (2020) 587(7832):103–8. doi: 10.1038/s41586-020-2778-7
9. Fitzpatrick CR, Copeland J, Wang PW, Guttman DS, Kotanen PM, Johnson MTJ. Assembly and ecological function of the root microbiome across angiosperm plant species. Proc Natl Acad Sci 6 fevereiro (2018) 115(6):E1157–65. doi: 10.1073/pnas.1717617115
10. Tejera N, Lluch C, Martìnez-Toledo MV, Gonzàlez-López J. Isolation and characterization of azotobacter and azospirillum strains from the sugarcane rhizosphere. Plant Soil 1o março (2005) 270(1):223–32. doi: 10.1007/s11104-004-1522-7
11. de Souza CR, Rossi LMB, de Azevedo CP. Comportamento da acacia mangium e de clones de eucalyptus grandis x e. urophylla em plantios experimentais na amazônia central. Sci Florestalis (2004) 65:7.
12. Goss-Souza D, Mendes LW, Borges CD, Rodrigues JLM, Tsai SM. Amazon Forest-to-agriculture conversion alters rhizosphere microbiome composition while functions are kept. FEMS Microbiol Ecol 1o março (2019) 95(3):fiz009. doi: 10.1093/femsec/fiz009
13. Kern DC, D’aquino G, Rodrigues TE, Frazao FJL, Sombroek W, Myers TP, et al. Distribution of Amazonian dark earths in the Brazilian Amazon. In: Lehmann J, Kern DC, Glaser B, Wodos WI, editors. Amazonian Dark earths: origin properties management. Dordrecht: Springer Netherlands (2003). p. 51–75. doi: 10.1007/1-4020-2597-1_4
14. Macedo RS, Teixeira WG, Lima HN, de Souza ACG, Silva FWR, Encinas OC, et al. Amazonian Dark earths in the fertile floodplains of the Amazon river, Brazil: an example of non-intentional formation of anthropic soils in the central Amazon region. Bol Mus Para Emílio Goeldi Ciênc Humanas (2019) 14(1):207–27. doi: 10.1590/1981-81222019000100013
15. Lima AB, Cannavan FS, Navarrete AA, Teixeira WG, Kuramae EE, Tsai SM. Amazonian Dark earth and plant species from the Amazon region contribute to shape rhizosphere bacterial communities. Microb Ecol (2015) 69(4):855–66. doi: 10.1007/s00248-014-0472-8
16. McMichael CH, Palace MW, Bush MB, Braswell B, Hagen S, Neves EG, et al. Predicting pre-Columbian anthropogenic soils in Amazonia. Proc R Soc B Biol Sci (2014) 281(1777):20132475. doi: 10.1098/rspb.2013.2475
17. de Souza RC, Cannavan F de S, Kanzaki LIB, Mendes LW, Ferrari BM, Hanada RE, et al. Analysis of a bacterial community structure and the diversity of phzF gene in samples of the Amazonian dark earths cultivated with cowpea [Vigna unguiculata (L.) wald]. Afr J Agric Res (2018) 13(38):1980–9. doi: 10.5897/AJAR2018.13021
18. García-Gaines RA, Frankenstein S. USCS and the USDA soil classification system: development of a mapping scheme: Fort belvoir, VA: defense technical information center (2015). Available at: http://www.dtic.mil/docs/citations/ADA614144.
19. van der Putten WH, RD B, JD B, TM B, BB C, Fukami T, et al. Plant–soil feedbacks: the past, the present and future challenges. J Ecol (2013) 101(2):265–76. doi: 10.1111/1365-2745.12054
20. Malhi Y, Roberts JT, Betts RA, Killeen TJ, Li W, Nobre CA. Climate change, deforestation, and the fate of the Amazon. Science (2008) 319(5860):169–72. doi: 10.1126/science.1146961
21. Raij B, de JC, Cantarella H, Quaggio JA. Análise química para avaliação da fertilidade de solos tropicais. Campinas: Instituto Agronômico (2001).
22. Venturini AM, Nakamura FM, Gontijo JB, da França AG, Yoshiura CA, Mandro JA, et al. Robust DNA protocols for tropical soils. Heliyon (2020) 6(5):e03830. doi: 10.1016/j.heliyon.2020.e03830
23. Parada AE, Needham DM, Fuhrman JA. Every base matters: assessing small subunit rRNA primers for marine microbiomes with mock communities, time series and global field samples. Environ Microbiol (2016) 18(5):1403–14. doi: 10.1111/1462-2920.13023
24. Apprill A, McNally S, Parsons R, Weber L. Minor revision to V4 region SSU rRNA 806R gene primer greatly increases detection of SAR11 bacterioplankton. Aquat Microb Ecol (2015) 75(2):129–37. doi: 10.3354/ame01753
25. Gilbert JA, Jansson JK, Knight R. The earth microbiome project: successes and aspirations. BMC Biol (2014) 12(1):69. doi: 10.1186/s12915-014-0069-1
26. R Development Core Team. R: a language and environment for statistical computing. Vienna, Austria: R Foundation for Statistical Computing (2022). Available at: http://www.R-project.org.
28. Kruskal WH, Wallis WA. Use of ranks in one-criterion variance analysis. J Am Stat Assoc (1952) 47(260):583–621. doi: 10.1080/01621459.1952.10483441
29. Callahan BJ, McMurdie PJ, Rosen MJ, Han AW, Johnson AJA, Holmes SP. DADA2: high-resolution sample inference from illumina amplicon data. Nat Methods (2016) 13(7):581–3. doi: 10.1038/nmeth.3869
30. Quast C, Pruesse E, Yilmaz P, Gerken J, Schweer T, Yarza P, et al. The SILVA ribosomal RNA gene database project: improved data processing and web-based tools. Nucleic Acids Res (2013) 41(Database issue):D590–6. doi: 10.1093/nar/gks1219
31. McMurdie PJ, Holmes S. Phyloseq: an r package for reproducible interactive analysis and graphics of microbiome census data. PLoS One (2013) 8(4):e61217. doi: 10.1371/journal.pone.0061217
32. Good IJ. The population frequencies of species and the estimation of population parameters. Biometrika (1953) 40(3/4):237. doi: 10.1093/biomet/40.3-4.237
33. Hunter PR, Gaston MA. Numerical index of the discriminatory ability of typing systems: an application of simpson’s index of diversity. J Clin Microbiol (1988) 26(11):2465–6. doi: 10.1128/jcm.26.11.2465-2466.1988
34. Gloor GB, Macklaim JM, Pawlowsky-Glahn V, Egozcue JJ. Microbiome datasets are compositional: and this is not optional. Front Microbiol (2017) 8. doi: 10.3389/fmicb.2017.02224/full
35. Oksanen J, Blanchet FG, Kindt R, Legendre P, Minchin PR, O’Hara RB, et al. Vegan: community ecology package. R package vegan. Kenya: World Agroforestry Centre Nairobi (2015).
36. Sansupa C, Wahdan SFM, Hossen S, Disayathanoowat T, Wubet T, Purahong W. Can we use functional annotation of prokaryotic taxa (FAPROTAX) to assign the ecological functions of soil bacteria? Appl Sci (2021) 18. doi: 10.3390/app11020688
37. Liu C, Cui Y, Li X, Yao M. Microeco: an r package for data mining in microbial community ecology. FEMS Microbiol Ecol (2021) 97(2):fiaa255. doi: 10.1093/femsec/fiaa255
38. Silva LCR, Corrêa RS, Wright JL, Bomfim B, Hendricks L, Gavin DG, et al. A new hypothesis for the origin of Amazonian dark earths. Nat Commun (2021) 12(1):127. doi: 10.1038/s41467-020-20184-2
39. Lucheta AR, Cannavan F de S, Tsai SM, Kuramae EE. Amazonian Dark earth and its black carbon particles harbor different fungal abundance and diversity. Pedosphere (2017) 27(5):832–45. doi: 10.1016/S1002-0160(17)60415-6
40. Reis RA, Ruggieri AC, Oliveira AA, Azenha MV, Casagrande DR. Supplementation as a strategy for the production of the beef quality in tropical pastures. Rev Bras Saúde E Produção Anim (2012) 13:642–55. doi: 10.1590/S1519-99402012000300005
41. Barbosa MV, Pedroso D de F, Pinto FA, dos SJV, Carneiro MAC. Arbuscular mycorrhizal fungi and Urochloa brizantha: symbiosis and spore multiplication. Pesqui Agropecuária Trop (2019) 39. doi: 10.1590/1983-40632019v4954530
42. de Faria AP, MA M, Gaspar M, França MGC. The increase of current atmospheric CO2 and temperature can benefit leaf gas exchanges, carbohydrate content and growth in C4 grass invaders of the cerrado biome. Plant Physiol Biochem (2018) 127:608–16. doi: 10.1016/j.plaphy.2018.04.042
43. Berg CC, Rosselli PF, Davidson DW. Cecropia. Flora Neotropica. (2005) 94:1–230. Available at: http://www.jstor.org/stable/4393938.
44. Bueno GT, Cherem LFS, Toni F, Guimarães FS, Bayer M, Salgado AAR, et al. Organizadores. The physical geography of Brazil : environment, vegetation and landscape. Cham: Springer International Publishing (2019) p. 169–97. doi: 10.1007/978-3-030-04333-9_9
45. Strassburg BBN, Beyer HL, Crouzeilles R, Iribarrem A, Barros F, de Siqueira MF, et al. Strategic approaches to restoring ecosystems can triple conservation gains and halve costs. Nat Ecol Evol (2019) 3(1):62–70. doi: 10.1038/s41559-018-0743-8
46. Gann GD, McDonald T, Walder B, Aronson J, Nelson CR, Jonson J, et al. International principles and standards for the practice of ecological restoration. 2nd ed.. Restor. ecol., Vol. 27. (2019). doi: 10.1111/rec.13035.
47. Quintero-Vallejo E, Peña-Claros M, Bongers F, Toledo M, Poorter L. Effects of Amazonian dark earths on growth and leaf nutrient balance of tropical tree seedlings. Plant Soil (2015) 396(1):241–55. doi: 10.1007/s11104-015-2558-6
48. Navarrete AA, Cannavan FS, Taketani RG, Tsai SM. A molecular survey of the diversity of microbial communities in different Amazonian agricultural model systems. Diversity (2010) 2(5):787–809. doi: 10.3390/d2050787
49. Turner TR, James EK, Poole PS. The plant microbiome. Genome Biol (2013) 14(6):209. doi: 10.1186/gb-2013-14-6-209
50. Bever JD. Feeback between plants and their soil communities in an old field community. Ecology (1994) 75(7):1965–77. doi: 10.2307/1941601
51. Mendes LW, Tsai SM, Navarrete AA, de Hollander M, van Veen JA, Kuramae EE. Soil-borne microbiome: linking diversity to function. Microb Ecol (2015) 70(1):255–65. doi: 10.1007/s00248-014-0559-2
52. Singh P, Mazumdar P. Chapter 5 - microbial pesticides: trends, scope and adoption for plant and soil improvement. In: Rakshit A, Meena VS, Abhilash PC, Sarma BK, Singh HB, Fraceto L, editors. Biopesticides. Woodhead Publishing (2022). p. 37–71. Available at: https://www.sciencedirect.com/science/article/pii/B9780128233559000237.
53. Ray S, Patel N, Amin D. Chapter 9 - brevibacillus. In: Amaresan N, Senthil Kumar M, Annapurna K, Kumar K, Sankaranarayanan A, editors. Beneficial microbes in agro-ecology. Academic Press (2020). p. 149–67. Available at: https://www.sciencedirect.com/science/article/pii/B9780128234143000095.
54. Rakotoarivonina H, Hermant B, Monthe N, Rémond C. The hemicellulolytic enzyme arsenal of thermobacillus xylanilyticus depends on the composition of biomass used for growth. Microb Cell Factories (2012) 11(1):159. doi: 10.1186/1475-2859-11-159
55. Spang A, Poehlein A, Offre P, Zumbrägel S, Haider S, Rychlik N, et al. The genome of the ammonia-oxidizing candidatus nitrososphaera gargensis: insights into metabolic versatility and environmental adaptations. Environ Microbiol (2012) 14(12):3122–45. doi: 10.1111/j.1462-2920.2012.02893.x
56. Sly LI, Arunpairojana V, Hodgkinson MC. Pedomicrobium manganicum from drinking-water distribution systems with manganese-related “Dirty water” problems. Syst Appl Microbiol (1988) 11(1):75–84. doi: 10.1016/S0723-2020(88)80051-1
57. Trujillo ME, Hong K, Genilloud O. The family micromonosporaceae. In: Rosenberg E, DeLong EF, Lory S, Stackebrandt E, Thompson F, editors. The prokaryotes: actinobacteria. Berlin, Heidelberg: Springer (2014). p. 499–569. doi: 10.1007/978-3-642-30138-4_196
58. Albuquerque L, da Costa MS. The families conexibacteraceae, patulibacteraceae and solirubrobacteraceae. In: Rosenberg E, DeLong EF, Lory S, Stackebrandt E, Thompson F, editors. The prokaryotes: actinobacteria. Berlin, Heidelberg: Springer (2014). p. 185–200. doi: 10.1007/978-3-642-30138-4_200
Keywords: degraded soil restoration, forest restoration, land use change, microbiota biodiversity, tropical native trees
Citation: Freitas AS, Zagatto LFG, Rocha GS, Muchalak F, Silva SS, Muniz AW, Hanada RE and Tsai SM (2023) Amazonian dark earths enhance the establishment of tree species in forest ecological restoration. Front. Soil Sci. 3:1161627. doi: 10.3389/fsoil.2023.1161627
Received: 08 February 2023; Accepted: 03 April 2023;
Published: 05 May 2023.
Edited by:
Dasiel Obregon, University of Guelph, CanadaReviewed by:
Thiago Gumiere, Laval University, CanadaTolulope Grace Mafa-Attoye, University of Guelph, Canada
Copyright © 2023 Freitas, Zagatto, Rocha, Muchalak, Silva, Muniz, Hanada and Tsai. This is an open-access article distributed under the terms of the Creative Commons Attribution License (CC BY). The use, distribution or reproduction in other forums is permitted, provided the original author(s) and the copyright owner(s) are credited and that the original publication in this journal is cited, in accordance with accepted academic practice. No use, distribution or reproduction is permitted which does not comply with these terms.
*Correspondence: Anderson Santos de Freitas, YW5kZXJzb25mcmVpdGFzQHVzcC5icg==
†These authors have contributed equally to this work