 Karolane Bourdon
 Josée Fortin
 Jacynthe Dessureault-Rompré
 Jean Caron
- Department of Soil and Agri-Food Engineering, Laval University, Québec, QC, Canada
Repeated applications of straw and wood chips were recently proposed as a conservation strategy for preserving cultivated peatland carbon (C) stock. However, the variability in the amendment biostability and the possible divergent responses of contrasting peat soils need to be assessed. This study investigated the effect of amendment with different plant materials on carbon dioxide (CO2) emissions from two contrasting peat soils (sapric and hemic) in two laboratory experiments. The sapric soil received one application of plant materials and was incubated for 3190 degree-days (145 days at 22°C), while the hemic soil received three successive applications of plant materials and was incubated for three successive periods of 3150 degree-days (126 days at 25°C). CO2 emissions were measured at time intervals ranging from 2 to 14 days and the apparent proportion of the plant material’s C remaining in the soil was modeled using an exponential decay function. CO2 emissions from the 0-25 cm horizon of the unamended peats represented 0.7 t C-CO2 ha-1 yr-1 in the sapric soil and 7.3, 1.1, and 0.5 t C-CO2 ha-1 yr-1 in the hemic soil for the first, second, and third amendment periods, respectively. The apparent remaining C of the plant material varied from 52% to 81% in the two experiments, resulting in biomass requirements ranging from 2 to 32 t ha-1. The apparent remaining C was from 26% to 36% higher in the sapric soil than in the hemic soil. The apparent remaining C was also 9% to 38% higher for the treated softwoods than the untreated materials (straws: miscanthus, switchgrass, sorghum; wood chips: willow, birch). The repeated application of straw and wood chips increased CO2 emissions in the first 35 days following each application, resulting in an increased decomposition rate for the tested model. However, no change was detected for the final apparent remaining C across the three applications. These findings highlight the importance of considering soil properties, material types, and the impact of repeated applications for designing effective amendment programs and accurate C projection models for cultivated peatlands.
1 Introduction
Peatlands are a major carbon reservoir, accounting for approximately 33% of the planet’s soil carbon despite covering only 3% to 4% of its land area (1). Peat soils — also known as Histosols (2) or Organic soils (3) — are made up of partially decomposed plant material that has accumulated under water-saturated conditions over thousands of years (4). When drained, these soils can be converted into highly productive farmland. Historically, about 30 × 106 ha of the world’s 488 × 106 ha peatland has been drained and converted into farmland (1, 5). Drainage, however, triggers degradation processes in peat soils that lead to a continual thinning of the peat layer (subsidence) and to the release of nutrient and carbon dioxide (CO2). Subsidence of arable peat soils typically ranges from 1 to 5 cm yr-1 and is mainly caused by the combined effect of [1] peat decomposition, [2] compaction and settlement, and [3] erosion (6–9). Ultimately, the organic layer of these fertile lands can disappear entirely, leaving behind the underlying material, which may have less or no farming potential (10–12). The decomposition process of the organic matter also gradually transforms the peat material into fine particles, a phenomenon called humification. Peat materials are described as fibric, hemic, and sapric as their degree of humification increases (2). Peat decomposition, combined with compaction, leads to the degradation of the soil’s physical properties, such as porosity and drainage and reduces crop productivity (13–17).
In Canada, the total peatland area is estimated to be 113 × 106 ha, with 97% occurring in the Boreal Peatland Region (64%) and Subarctic Peatland Region (33%) (18). The extent of peatlands that have been drained and converted into farmland in Canada remains highly uncertain, as a vast extent of cultivated chernozem in the Prairies (Alberta, Saskatchewan, and Manitoba) are confounded for cultivated peatlands in recent global mapping efforts (1). The larger areas of cultivated peat soils reported in Canada are primarily concentrated near major urban centers in the provinces of Quebec (Montérégie region, south of Montreal, about 9’000 ha), Ontario (Holland Marsh, north of Toronto, about 3’000 ha), and British Columbia (Fraser lowland near Vancouver). These peatlands are extensively employed for vegetable production. Moreover, some areas of peatlands are also employed as grassland in British Columbia and Newfoundland. In the Montérégie region, in Quebec, drainage efforts to convert peatland into farmland started in 1929 and have continued until recently (19). The remaining 21745 ha of undrained peatlands of Montérégie (20) are now protected by law (21), as are the rest of the province wetlands, thereby preserving valuable ecosystem services (22) and preventing further agricultural expansion on peatlands. Agricultural activities on Montérégie peat soils supply a substantial volume of fresh vegetables to the population of the North American East Coast (Canada and the United States) (23). As observed worldwide, however, the lifespan and productivity of Montérégie peat soils under agricultural use are threatened by degradation processes. The subsidence rate of these soils was last recorded to range from 0.3 to 4.3 cm yr-1 (24). Farmers also report loss of peat soil acreage on their farms (complete disappearance of the organic layer) and reduced productivity in some areas. While some lands lie upon mineral soil that can be cultivated despite the disappearance of the organic layer, others lie upon saline and impermeable coprogenic material with no agricultural potential (10, 12). Moreover, studies revealed loss of porosity and reduced hydraulic conductivity in Montérégie peat soils, symptoms of land degradation which can explain the reduced productivity reported by farmers (14, 15). Currently, around 16% of Montérégie peat soils are estimated to be degraded and shallow (< 60 cm of peat layer) (25). The degradation and disappearance of cultivated peatlands in the Montérégie region have caused deep concern among farmers who have mobilized in collaboration with researchers and with the support of policymakers to develop and implement conservation management practices to ensure the sustainability of their production systems (26, 27).
Some of the strategies proposed in the literature to address cultivated peatlands degradation and environmental impact (11, 28–31) involve land use changes such as rewetting to natural function, paludiculture, and wet prairies. In contrast, other strategies are aimed at adapting land management practices to mitigate environmental impact and extend the lifespan and productivity of the soil. One conservation strategy in line with this latter approach and currently being investigated is the application to the soil of stable organic amendments, such as grass straw and wood chips, also referred to as biomass in this paper. This strategy showed promising potential in preserving cultivated peatland C stock in C projection studies (32, 33). This strategy could also potentially compensate for soil subsidence (34), reduce nutrient loss (35, 36), and maintain (and restore) soil porosity and hydraulic conductivity (37–39). However, several factors need to be further investigated to help develop and implement effective organic amendment programs on these soils. Until now, the decomposition dynamic of three plant materials (miscanthus straw, sorghum straw, and willow chips) has been studied in one field located in Montérégie using the mesh bag technique (32). This study showed that from 17 to 29 t ha-1 of biomass (7.5 to 12 t C ha-1) could be required to compensate for a loss of 4.5 t C-CO2 ha-1 yr-1, which represents approximately 0.5 cm of soil thickness in the cultivated peatlands of Montérégie. Such high application rates could be difficult to implement at the farm scale for economic and technical reasons, could immobilize large amounts of nitrogen (35, 36) and reduce crop yield (38, 40). Other materials with greater biostability could be tested, such as treated wood fibers, to help reduce the amount of biomass required. Treated wood fibers are obtained by mechanical and thermal treatment of wood residue, usually softwood, and are currently used in growing media (41, 42).
Another challenge with the biomass-based conservation approach is the accurate determination of the amount of material required to compensate for soil C loss as CO2 (C-CO2 loss). CO2 emissions from agricultural peat soils can vary greatly, typically ranging from 2 to 16 t C-CO2 ha-1 yr-1 in temperate environments (43–48). This variability in C-CO2 loss depends on several pedoclimatic conditions such as temperature, water table depth, pH, and nutrient content, as well as the degree of humification of the peat (47). This is because recalcitrant organic matter can accumulate in peat over time following drainage (47, 49–52). This latter effect is expected to be significant across the Montérégie peat soils due to their heterogenous drainage history and humification degree (19, 53). However, the variability in CO2 emissions from these soils remains uncertain, as little data on CO2 emissions is available. Besides the variability in the native CO2 emissions of the soil, the application of exogenous materials to the soil can induce a change in the decomposition rate of the native soil organic carbon (SOC), a phenomenon called the priming effect (PE) (54, 55). The priming effect has not yet been considered in this conservation strategy and it could affect (positively or negatively) the efficiency of the plant materials in compensating for the peat C-CO2 loss (56). The soil’s humification degree could also influence the decomposition rate of the applied material, as cellulose can decompose more slowly in soils with higher levels of humification (47). Moreover, repeated application of plant material to the soil could significantly increase the decomposition of the applied material (57, 58) and reduce the efficiency of the material in compensating for peat C-CO2 loss.
Therefore, the objectives of this paper were to assess the influence of [1] the degree of humification of the soil, [2] the type of plant material, and [3] the repeated applications of plant material on CO2 emissions from peat soils, which include the decomposition and the priming effect of the added materials. This paper also examines the consequences of these effects on the amount of material required to preserve the peat C stock and on C projection models based on an exponential decay function.
2 Materials and methods
2.1 Soils and plant materials
A sapric and a hemic soil (2) were sampled from the 0-25 cm horizon of two cultivated fields in the regional county “Les Jardins-de-Napierville” in Montérégie, Quebec, Canada (Sapric: 45.124858° N, 73.534667° W; Hemic: 45.133972° N, 73.492528° W) in the fall of 2018 and 2019, respectively. The study region cumulates from 3000 to 3200 degree-days (base 0°C) during the growing period, from April 1st to October 31st (59). Degree-days were calculated with the averaging method, i.e., by subtracting 0°C from the mean daily temperature and summing the result for each day from April 1st to October 31st (59). The study region has a daily mean temperature of 21°C in July, the hottest month of the year (60). The field of the sapric soil was first drained around 1955 and had a peat thickness of 40 cm when the soil was sampled. The field of the hemic soil was first drained around 2000 and had a peat thickness of 120 cm when the soil was sampled. The general characteristics of the two soils are presented in Table 1. Based on the rubbed fibers and loss-on-ignition reported by Deragon (53) survey of 114 soil profiles, those two materials are representative of opposing ends of the decomposition spectrum observed for the 0-25 cm layer of soils from the study area.
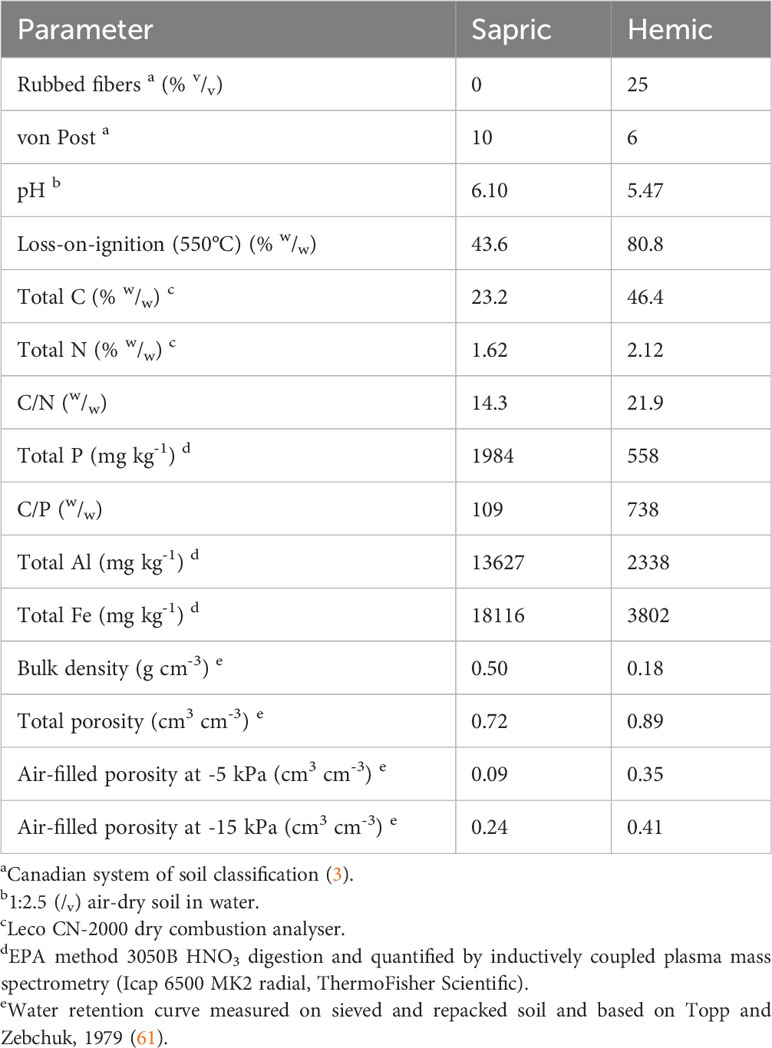
Table 1 General characteristics of the tested soils.
Seven different plant materials were tested in the two experiments of this study (Table 2; Figure 1). Five of the biomasses were untreated materials that were chipped to a maximum particle size of 3 cm: miscanthus straw [Miscanthus X giganteus], switchgrass straw [Panicum virgatum], sorghum straw [Sorghum bicolor (L.) Moench], willow chips [Salix miyabeana], and birch chips [Betula papyrifera]. The other two materials were mechanically treated softwoods residues that were obtained from a local supplier. One softwood material was conifer fibers, a fibrous material (Figure 1) produced by defibrating residues from various conifer species. The second treated softwood material was pressed pine chips produced by applying pressure on eastern white pine [Pinus strobus] logs before chipping. The two treatments of the softwood removed part of the biomass cellular fluid with the objective of increasing the material biostability, an approach commonly used for growing media (41). All the plant materials were analyzed for their carbon and nitrogen content by dry combustion (Leco CN-2000) and for their biochemical fractions (soluble, hemicellulose, cellulose, and lignin) based on the Van Soest (62) sequential extraction technique and the XPU 44-162 standard method as described in Dessureault-Rompré et al. (32) (Table 2).
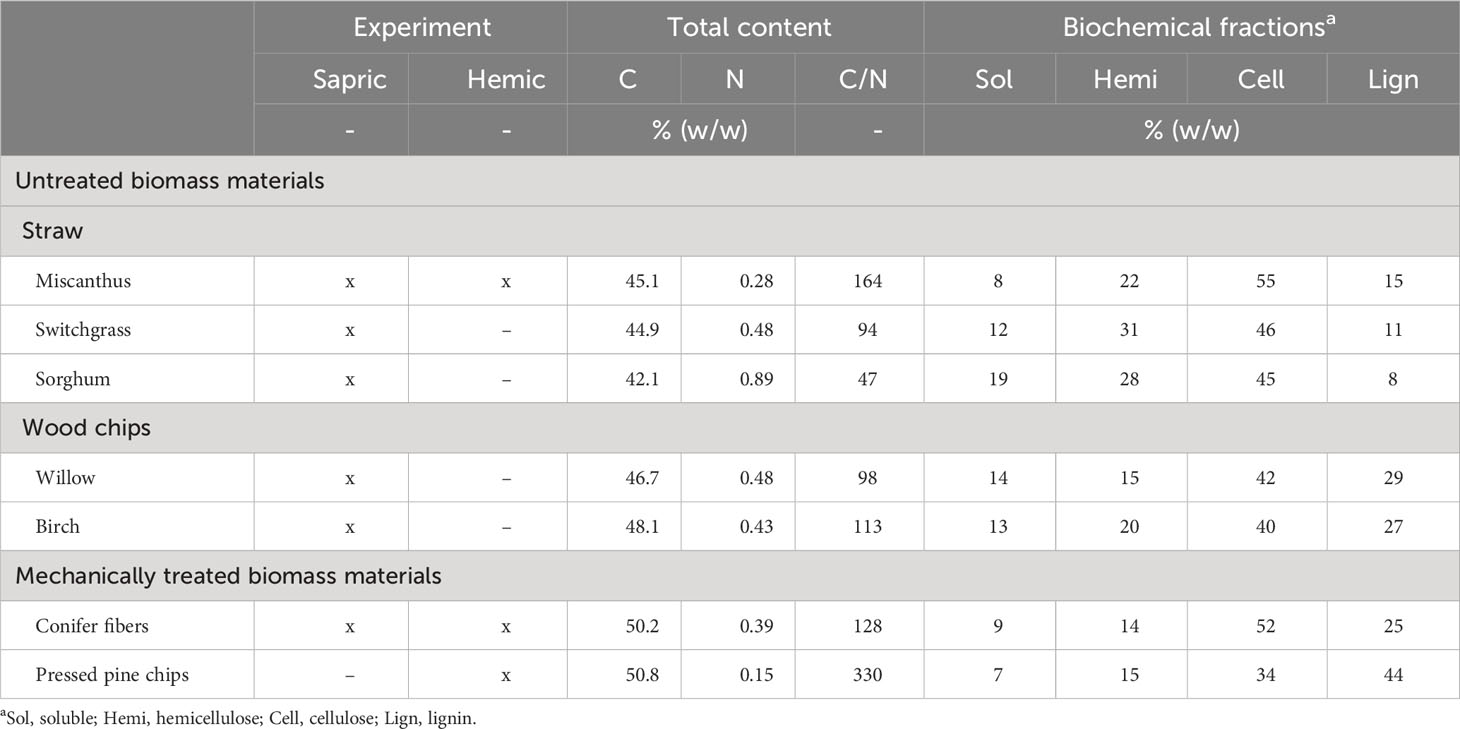
Table 2 List of the plant materials tested in the two experiments and their biochemical properties.
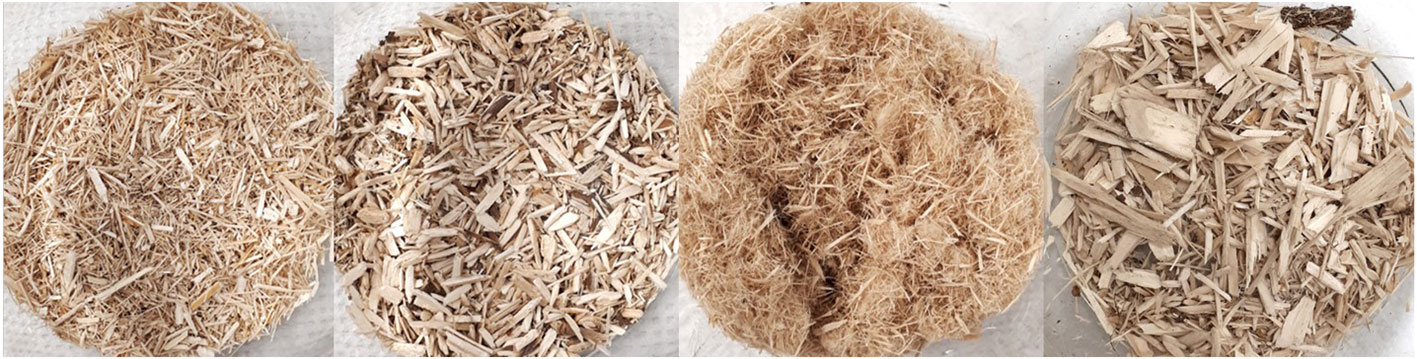
Figure 1 Four of the tested plant materials. From left to right: miscanthus, willow, conifer fibers, and pressed pine.
2.2 Incubation experiments
Incubation experiments were done separately for each soil. The sapric soil experiment took place one year before the hemic soil experiment, aligning with the sampling year of each soil. Both incubations were carried out in 2 L glass jars filled with 1 L of soil and set in a completely randomized design with three replications per treatment. The same volume of soil was used in both experiments, ensuring consistent volume comparison between the soils despite their contrasting bulk densities (Table 1). The objective was to report results for a volume of soil corresponding to a 0-25 cm layer, which represents the average tillage depth in the field. During both incubations, the soils’ water potential was maintained at -15 kPa by adding distilled water to compensate mass loss once a week at least 24 hours before any respiration measurements. Such water potential corresponds to the irrigation threshold commonly used in the field. The temperature within the growth chamber was monitored each time CO2 emissions were measured, and variations did not exceed 1°C throughout both incubations. The tested biomass application rates were chosen to simulate an application of about 15 to 20 t ha-1 incorporated to a depth of 25 cm based on the results of a previous study (32).
2.2.1 Sapric soil incubation
The sapric material was first air-dried due to excessive water content at the time of sampling, then sieved to 2 mm, removing any visible crop residue. The soil was rewetted to a water potential of -15 kPa and stored in the lab at room temperature in a closed bin (not completely airtight) for three weeks before the beginning of the experiment to avoid measuring the initial microbial flush (63). At the beginning of the incubation, 2 L glass jars were filled with 1 L of rewetted soil (500 g dry basis) and the soil was amended according to the treatment and thoroughly mixed. Seven treatments were tested: unamended control, untreated materials (miscanthus straw, switchgrass straw, sorghum straw, willow chips, and birch chips), and treated material (conifer fibers) (Table 2). The plant materials were applied at a rate of 15 g per kg of soil (dry basis). Such soil-biomass ratio would be obtained for a field application rate of 18.75 t ha-1 (dry basis) incorporated to a depth of 25 cm. The treatments were incubated at 22°C for 145 days, cumulating 3190 degree-days base 0°C (DD), which corresponds to the cumulated heat of one growing season in the study area.
2.2.2 Hemic soil incubation
The freshly sampled hemic material was sieved to 5 mm without prior drying, removing any visible crop residue. A larger sieve size was used for this soil because of its higher fiber content. Sieving to 2 mm would have significantly altered the peat fibers length and changed the soil’s porosity compared to its original field conditions. The soil water potential was adjusted to -15 kPa immediately after sieving, and the soil was stored in the lab at room temperature in a closed bin (not completely airtight) for three weeks to avoid measuring the initial microbial flush (63). At the beginning of the incubation, 2 L glass jars were filled with 1 L of soil (180 g dry basis) and the soil was amended according to the treatments and thoroughly mixed. Four treatments were tested: unamended control, untreated material (miscanthus straw), and treated materials (conifer fibers and pressed pine) (Table 2). For technical reasons, the number of tested plant materials was reduced for this experiment. In the sapric soil experiment, the untreated materials generally had a similar effect on CO2 emissions, so only one material belonging to this category was selected. Among the untreated materials, miscanthus was chosen because it generally produced higher straw yields on farmers’ research plots (unpublished data). The pressed pine, available only in 2019, was added as a treated material for this experiment to compare with the conifer fiber, which showed promising results in the sapric soil experiment. The treatments were incubated at 25°C for 378 days, cumulating 9450 DD, which corresponds to the cumulated heat of three growing seasons in the study area. During this period, three biomass applications were made to simulate one application per year. The plant materials were applied on days 0, 126 (3150 DD), and 252 (6300 DD) at a rate of 33.3, 28.8 and 31.7 g per kg of amended soil (dry basis), respectively. These soil-biomass ratios would be obtained for applications of 15, 13, and 14 t ha-1 incorporated to a depth of 25 cm, respectively. All the treatments, including the unamended control, were mixed and sampled on days 126 and 251 when the biomass was applied. The soils were also mixed and sampled on day 63 because of the high CO2 emissions observed in all the treatments, including the unamended control, over several consecutive days. All the soil samples were kept for future analysis (not presented in this study). The incubation duration for this soil was shortened compared to the sapric soil to compensate for the higher incubation temperature and accumulate a similar number of degree-days per year for both soils (3150 DD for the hemic soil and 3190 DD for the sapric soil). The incubation duration for each period of measurement in the hemic soil was 13% shorter than that of the sapric soil (126 days vs 145 days), while the temperature was 14% higher (25°C vs 22°C).
2.3 CO2 emission measurements
CO2 emission was monitored using the alkali trap method based on Hopkins (63) and Winkler et al. (64). Soil CO2 emissions were measured each 1-2 days at the beginning of the incubation, when emissions were more dynamic, and then spaced to 7-14 days when emissions were more stable. Vials containing NaOH 0.5 M for the sapric soil and NaOH 1.0 M for the hemic soil were placed on a wire mesh on the soil surface. The molarity of NaOH was increased for the hemic incubation experiment due to the higher rate of CO2 emissions. Such molarities of NaOH were recommended to ensure optimal CO2 absorption efficiency of alkali traps (65). The jars containing the NaOH vials were sealed with a screw cap lid, and the NaOH was incubated with the soil for 3 to 5 hours. NaOH vials were also placed in three empty jars to correct for ambient CO2 catchment. At the end of the NaOH incubation, the vials were removed and immediately capped, and the jars were left open until the next CO2 measurement to ensure soil gas exchanges. The quantity of CO2 captured by the NaOH was determined by titration with HCl 0.05 M for the sapric soil and HCl 0.10 M for the hemic soil using phenolphthalein as pH indicator and after having precipitated carbonates and dissolved CO2 with BaCl2 1 M (1 ml for the sapric soil and 2 ml for the hemic soil). The same procedure was used for the blanks. No more than 20% of OH were neutralized throughout the measurements to ensure efficient CO2 capture (66).
2.4 Data analysis
The respiration rate was reported in mg C-CO2 kg-1 h-1 according to the following equation.
Where CO2 experimental unit is the quantity [mmole] of CO2 trapped in each experimental unit during the NaOH incubation, CO2 blank is the mean quantity [mmole] of CO2 trapped in the three blanks during the same period, msoil and mbiomass are the weight [kg] of soil and plant material in the jar at the time of measurement (subtracting the mass of the soil samples and the cumulative loss of C-CO2), and tincubation is the NaOH incubation time [h].
The carbon balance of each experimental unit was calculated according to the following equation.
Where Cadded represents the quantity of C added with the biomass [g C jar-1], and the cumulative C-CO2 is the quantity of C-CO2 cumulated in each experimental unit [g C jar-1] calculated with linear interpolation between each point. The C balance was reported in t ha-1 for a 0-25 cm horizon using the soil’s initial mass and bulk density (Table 1). For the hemic soil, this calculation was performed separately for each amendment period and thus returned to zero at the beginning of each period.
The rate of C-CO2 emissions induced by the application of biomass, which combines biomass decomposition and priming effect, was calculated for each experimental unit according to the following equation.
Where C-CO2 amended is the emission rate [mg C-CO2 kg-1 h-1] from each experimental unit amended with biomass and C-CO2 unamended is the mean emission rate [mg C-CO2 kg-1 h-1] of the three replicates of the unamended control.
The apparent remaining C of the biomass materials was calculated according to the following equation.
This parameter indicates the apparent fraction of applied C [g g-1] that is not lost through increased CO2 emissions (combines the biomass decomposition and priming effect) and thus reflects the biomass’ efficacy in compensating C-CO2 loss from the soil. The cumulative C-CO2 biomass induced expressed in g C-CO2 jar-1 was calculated by subtracting the mean cumulative emission [mg C-CO2 jar-1] of the three replicates of the unamended control from those cumulated in each experimental unit amended with biomass [mg C-CO2 jar-1]. The cumulative emissions were calculated with linear interpolation between each point. For the hemic soil, this calculation was done separately for each amendment period and thus returned to 1 at the beginning of each period.
The quantity of biomass required to compensate for C-CO2 loss for each soil and each amendment period was calculated according to the following equation.
The biomass requirement was reported in t ha-1 for a 0-25 cm horizon using the initial mass of soil and bulk density of each soil (Table 1).
The apparent remaining C temporal dynamics were modelled for each plant material using a simple exponential decay equation (67) based on Dessureault-Rompré et al. (32) study.
Where C(t) is the apparent proportion of applied C [g g-1] that remains in the soil at time t (days), C1 is the apparent fraction of applied C [g g-1] at t0 subject to exponential decay, k is the exponential decomposition rate of C1 [day-1], and C0 is the apparent fraction of applied C [g g-1] that remains unaffected. The modelling was done with the “minimize” function from the module scipy.optimize (v.1.10.1) in Python 3 (v.3.9.16) and Nelder-Mead method was used for optimizing C1, k, and C0.
2.5 Statistical analysis
Analysis of variance (ANOVA) and Tukey tests were performed using the mixed procedure in SAS University (Version 3.8). The homogeneity of variance and normality of residual were verified graphically, and a p-value<0.05 was considered significant.
For the CO2 emissions time series of both experiments, a factorial ANOVA was used with time as a repeated measure to test the effect of the treatments across time. A heterogeneous auto-regressive variance-covariance structure was chosen for both ANOVA based on the temporal trend of the parameter and the best Akaike criterion (AIC). A natural logarithm transformation was applied to the CO2 emissions of both experiments to respect the ANOVA assumptions. Differences across the treatments were determined with Tukey tests.
For the sapric experiment, a one-way ANOVA was used to consider the treatment effect on the cumulative CO2 emissions, carbon balance, apparent remaining C, biomass requirement, and model parameters. Differences across the treatments were determined with Tukey tests.
For the hemic experiment, a factorial ANOVA was used with the amendment period as repeated measures to test the treatment main effect, the period main effect and their interaction on the cumulative CO2 emissions, carbon balance, apparent remaining C, biomass requirement, and model parameters. Variance-covariance structure was chosen based on the temporal trend of the parameters and the best Akaike criterion (AIC): heterogeneous compound symmetry for the cumulative CO2 emissions and homogenous compound symmetry for the carbon balance, apparent remaining C, biomass requirement, and parameters of the model. A natural logarithm transformation was applied to the biomass requirement to respect the ANOVA assumptions. Differences across the treatments and periods were determined with Tukey tests.
3 Results
3.1 Sapric soil experiment
3.1.1 Temporal dynamic
In the sapric soil, CO2 emission rates were significantly higher in the amended treatments than in the unamended control at all measurement points during the incubation period (Figure 2). CO2 emissions in the biomass treatments were higher during the early phase of decomposition, approximately the first 35 days, then stabilized at a level above that of the control for the rest of the incubation period. CO2 emissions in the first 35 days of incubation were much smaller in the conifer fiber treatment than in the other biomass treatments, while sorghum treatment resulted in the highest CO2 emissions. This effect was reflected in the apparent remaining C calculated after 35 days of incubation, which was the highest for the conifer fiber treatment and the lowest for the sorghum treatment (Table 3). It was also reflected in the decomposition rate (k) values of the apparent remaining C model, which was the lowest for the conifer fiber treatment and the highest for the sorghum treatment (Figure 3; Table 4). The other tested materials (miscanthus, switchgrass, willow, and birch) showed little difference in their 35-day apparent remaining C (Table 3) and k values (Table 4).

Figure 2 CO2 emission rates of the treatments as a function of time in the sapric soil (means ± standard deviations).
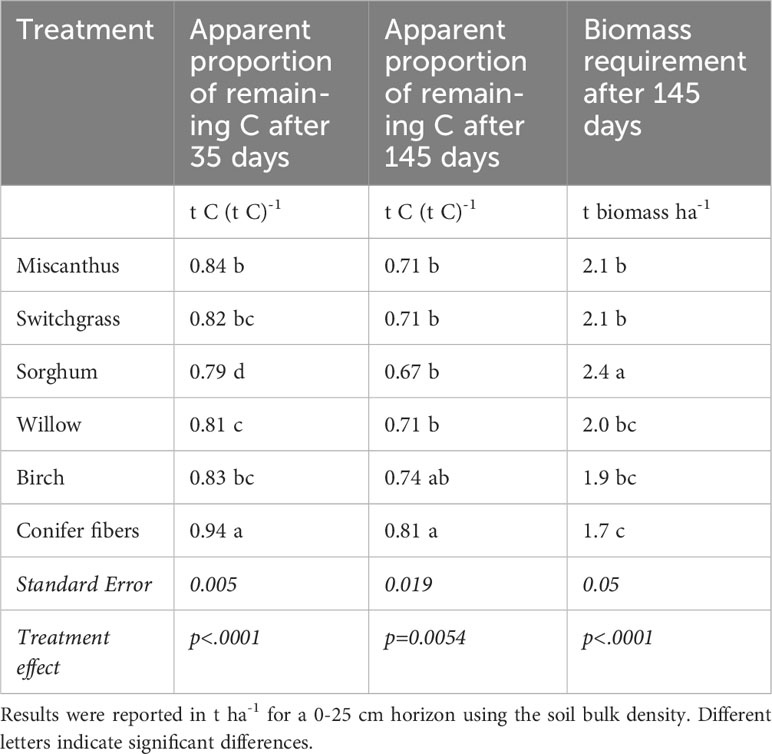
Table 3 Treatment main effect on the apparent proportion of remaining C after 35 and 145 days of incubation and biomass requirement after 145 days of incubation in the sapric soil (means and standard errors).
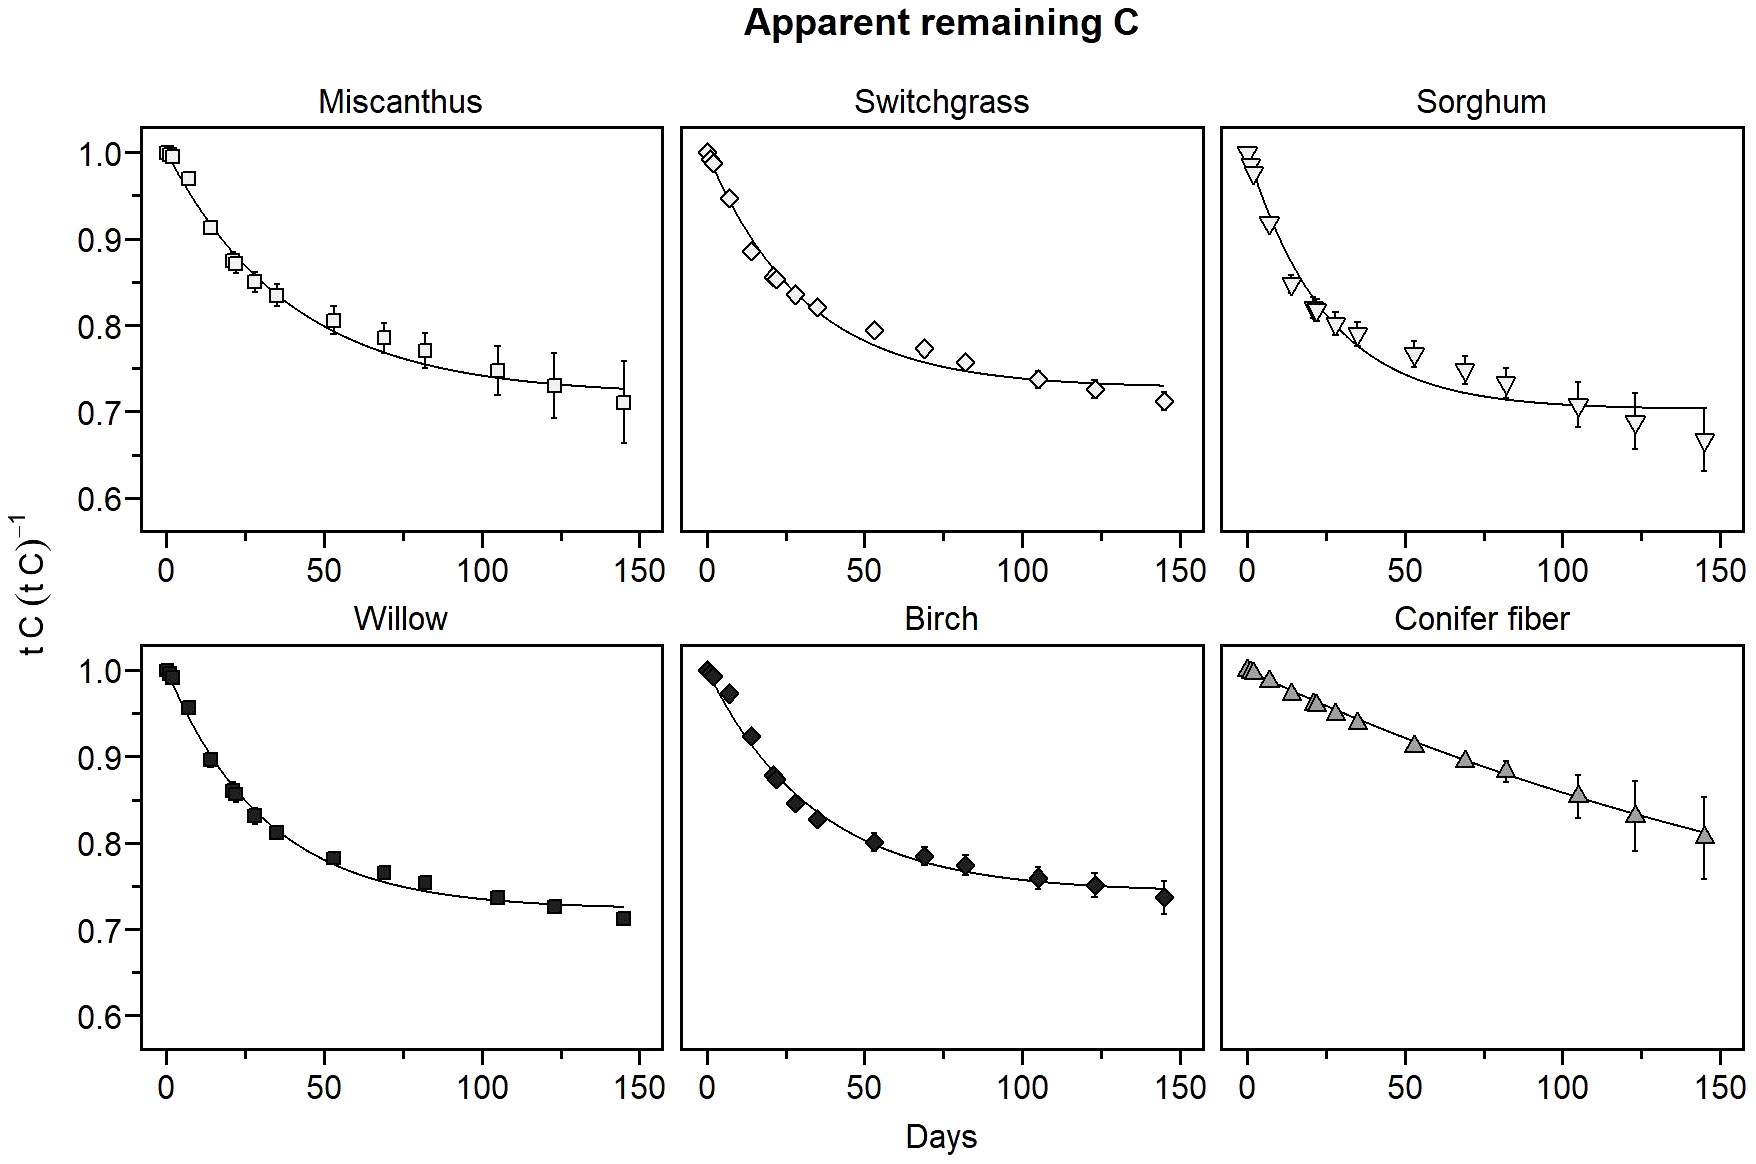
Figure 3 Apparent remaining C of the plant materials as a function of time in the sapric soil (means ± standard deviations). The curves represent the apparent remaining C models.
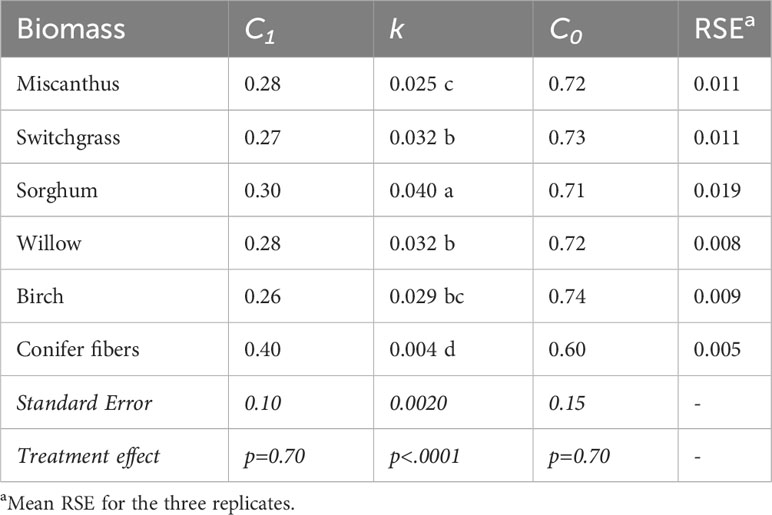
Table 4 Parameters of the apparent remaining C models of the biomass materials tested in the sapric soil (means and standard errors).
3.1.2 Cumulative effect at the end of the experiment
The proportion of applied C that apparently remained in the soil at the end of the 145-day incubation period ranged from 0.81 to 0.67 across the tested materials (Table 3), representing a variation of up to 21%. The highest apparent remaining C was obtained for the conifer fiber treatment, while the lowest was for sorghum treatment. The difference between the sorghum treatment and the remaining untreated biomass treatments (miscanthus, switchgrass, willow, and birch) was not significant, nor was the difference between the conifer fiber and birch treatments. For all biomass treatments except conifer fiber, the apparent remaining C models approached the asymptote value (C0) by the end of the incubation period, with a difference of less than 0.01 unit (Figure 3; Table 4). For these treatments, the C0 values were often comparable to the 145-day apparent remaining C, although C0 was up to 0.04 unit higher than actual data (Tables 3 and 4).
The C balance at the end of the 145-day incubation period was negative for the control but positive for all the amended treatments, indicating that the quantity of biomass required to compensate for the soil C-CO2 loss was smaller than the 15 g kg-1 (19 t ha-1 incorporated a depth of 25 cm) applied for all the tested materials (Figure 4). At the end of the incubation, CO2 emissions cumulated in the unamended control represented 0.7 t C-CO2 ha-1 for a 0-25 cm horizon (Figure 4). The quantity of biomass needed to compensate for this loss ranged from 1.7 to 2.4 t ha-1 for a 0-25 cm soil horizon (Table 3), representing a variation of up to 41% compared to a variation of up to 21% for the apparent remaining C. This increased difference in the biomass requirement compared to the apparent remaining C is due to the different C content of the plant materials (Table 2). The biomass requirement was, on average, 19% lower for the conifer fiber and 19% higher for the sorghum than for the other plant materials (miscanthus, switchgrass, willow, and birch).
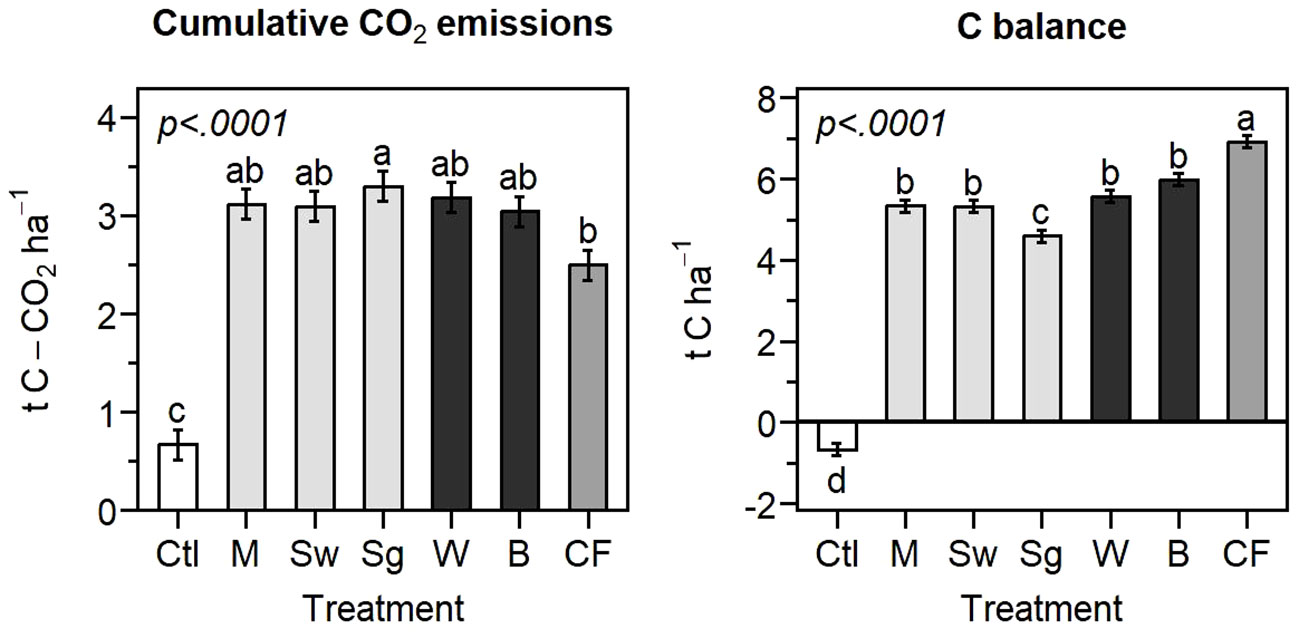
Figure 4 Treatment main effect on the cumulative CO2 emissions and carbon balance at the end of the sapric soil incubation (means ± standard errors). Different letters indicate significant differences. Ctl, control; M, miscanthus; Sw, switchgrass; Sg, sorghum; W, willow; B, birch; CF, conifer fibers.
3.2 Hemic soil experiment
3.2.1 Temporal dynamic
In the hemic soil, CO2 emissions were significantly higher in the amended treatments than in the unamended control at all measurement points throughout the three periods of the experiment (Figure 5A). The temporal dynamic in CO2 emissions was markedly different in the first amendment period compared to the second and third periods despite stable incubation conditions and a steady measurement method. During the first period, a substantial increase in CO2 emissions occurred from day 33 to day 84. CO2 emissions induced by the biomass were also more pronounced from day 42 to day 105 (Figure 5B). Due to the marked increase in CO2 emission, it was decided to mix and sample the soils on day 63 for future microbial and chemical analysis (not presented in this paper). CO2 emissions from all treatments had reached a stable level prior to soil sampling, from day 60 to day 63. There was an increase in CO2 emissions after the soil sampling on day 63. Then, emissions returned to relatively stable rates on days 64 and 67 before decreasing from day 67 to 77. During the second and third amendment periods, CO2 emissions were more stable, and the temporal trend of the treatments resembled that observed in the sapric soil. The marked change in the biomass-induced CO2 emissions pattern from period one to periods two and three affected the temporal pattern of the apparent remaining C, which followed more of a sigmoidal pattern during the first amendment period and an exponential decrease pattern in the second and third periods (Figure 6). The tested model did not accurately describe the first period sigmoidal pattern (Figure 6; Table 5).
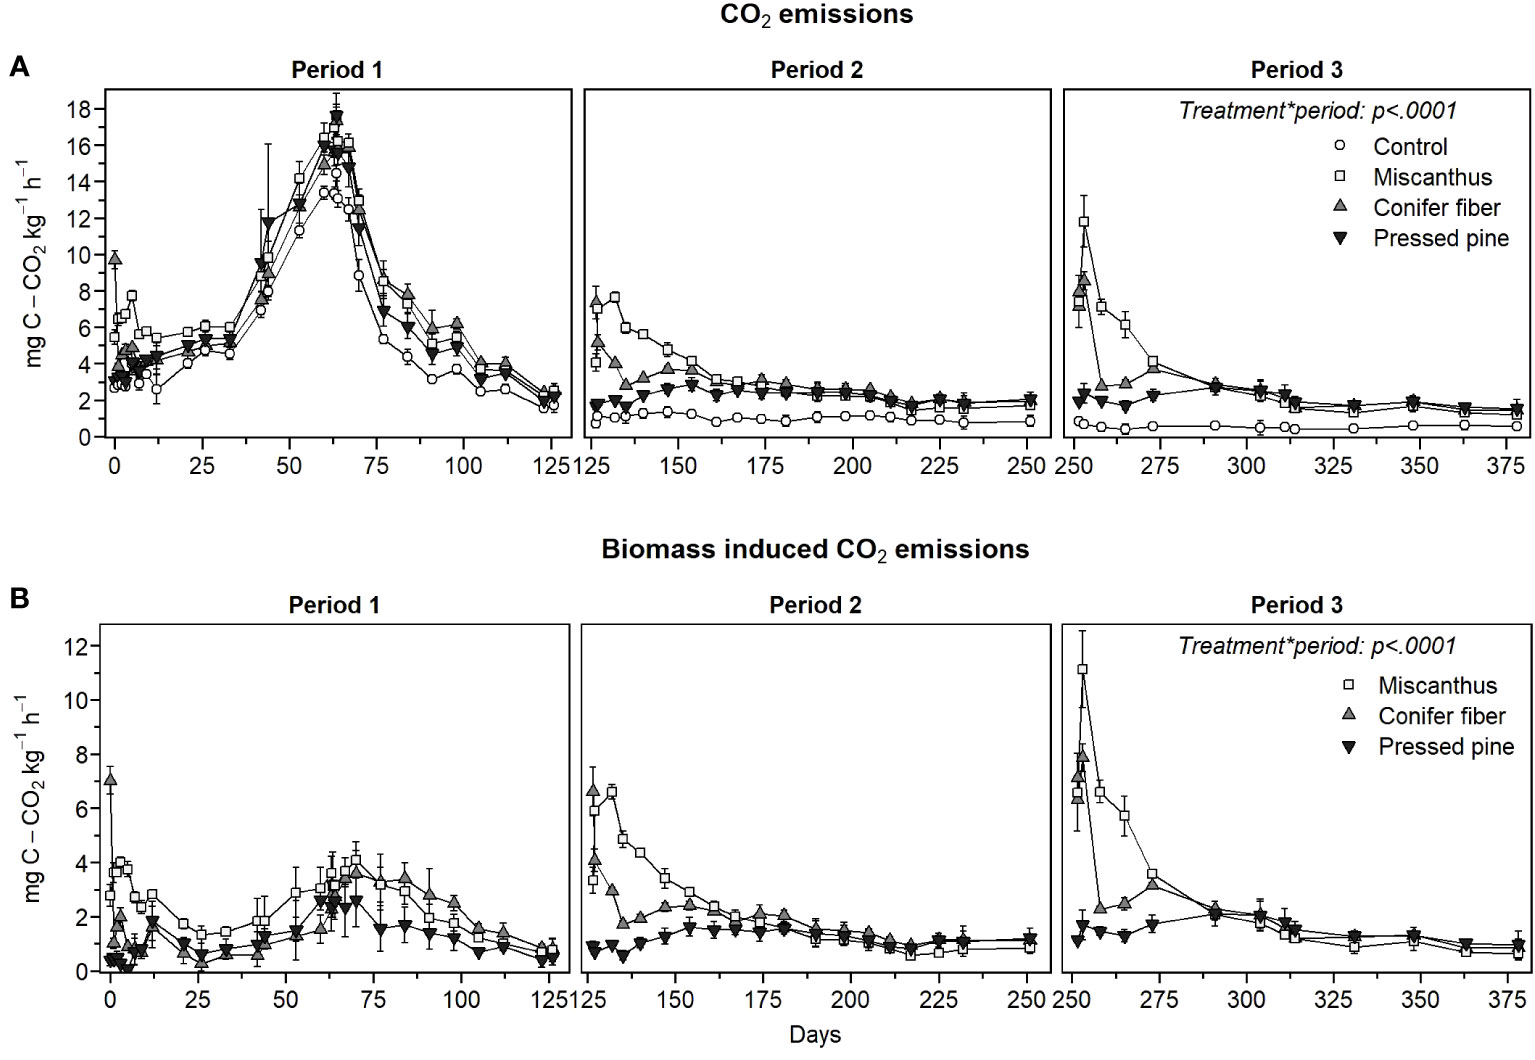
Figure 5 CO2 emission rate of the treatments (A) and biomass induced CO2 emission rate (B) as a function of time for the three amendment periods of the hemic soil (means ± standard deviations).
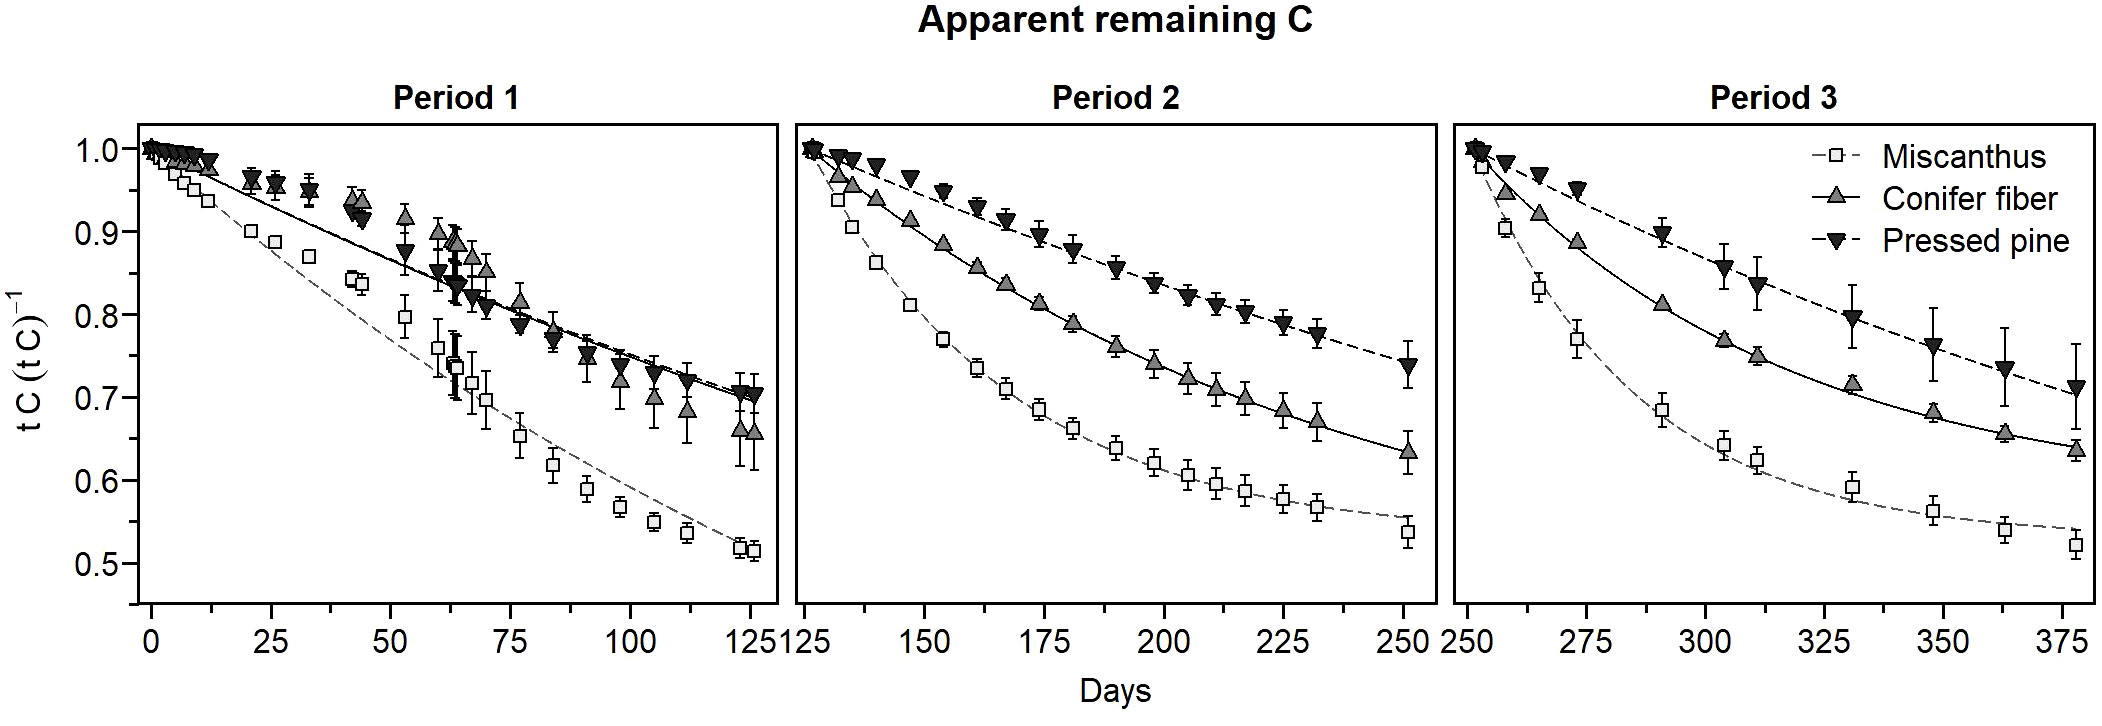
Figure 6 Apparent remaining C of the plant materials as a function of time for the three amendment periods of the hemic soil (means ± standard deviations). The curves represent the apparent remaining C models.
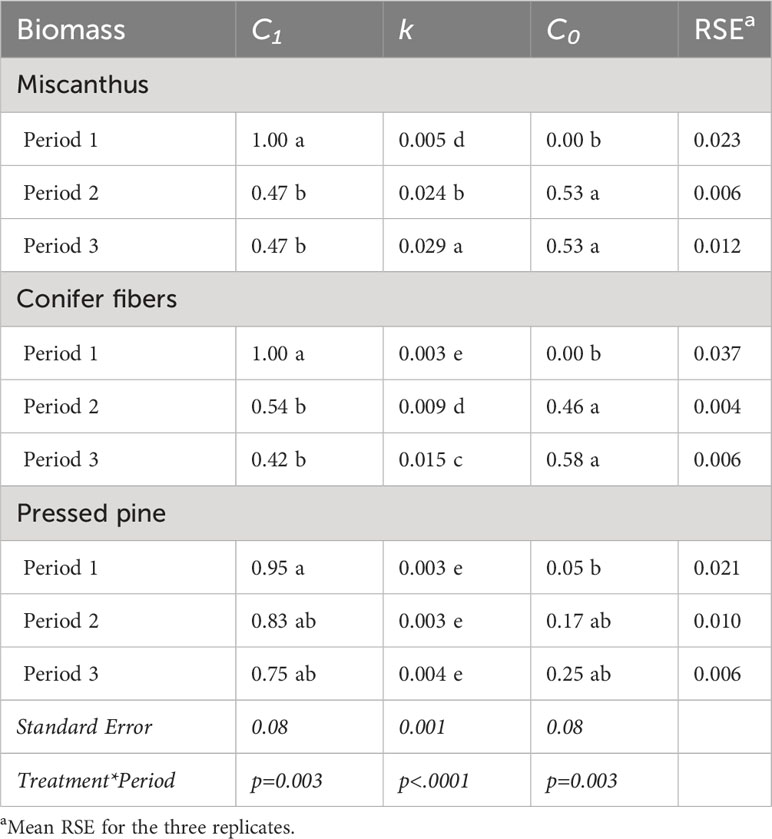
Table 5 Parameters of the apparent remaining C models of the biomass for the three amendment periods of the hemic soil (means and standard errors).
The biomass-induced CO2 emissions in the early phase of decomposition, approximately the first 35 days of incubation in each amendment period, increased across the three periods, although the increase in the pressed pine treatment was less pronounced (Figure 5B). This effect caused a decrease in the 35-day apparent remaining C across the periods (Tables 6, 7), although the effect was significant only for miscanthus and conifer fiber from period one to periods two and three. This effect also caused significant increases in the decomposition rates (k) of the apparent remaining C models across the periods for the miscanthus and conifer fiber treatments (Table 5).
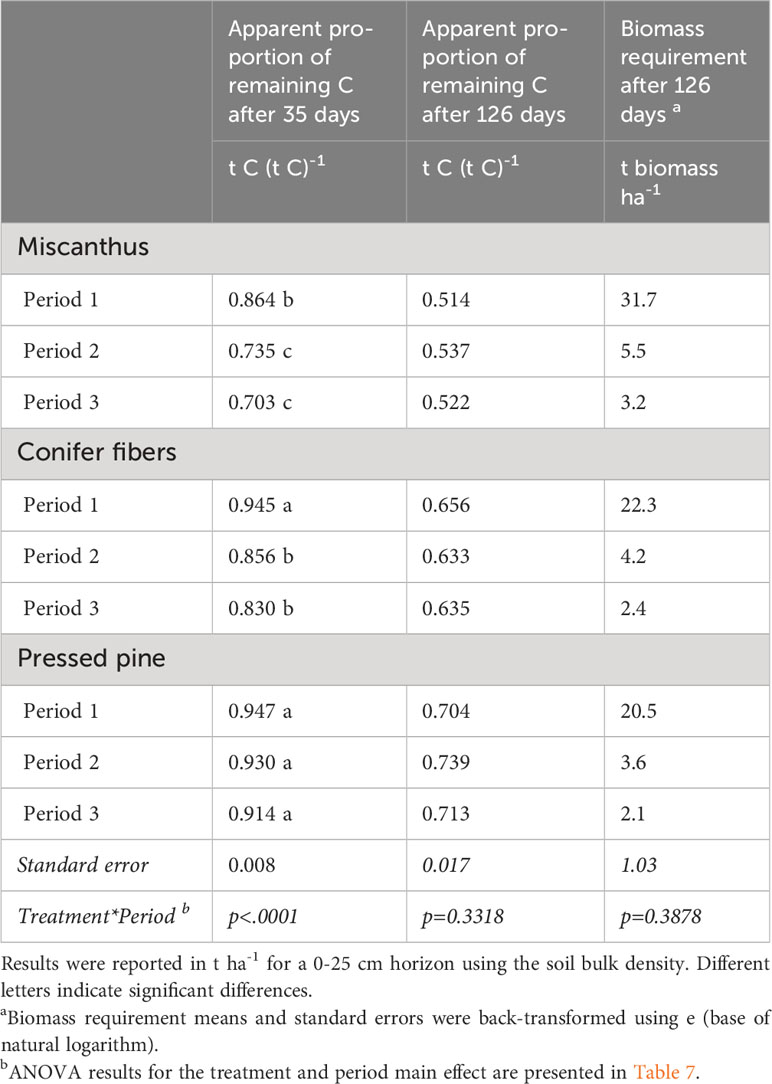
Table 6 Interaction between treatments and periods for the apparent proportion of apparent remaining C after 35 days and 126 days and the biomass requirement after 126 days of incubation in the hemic soil (means and standard errors).
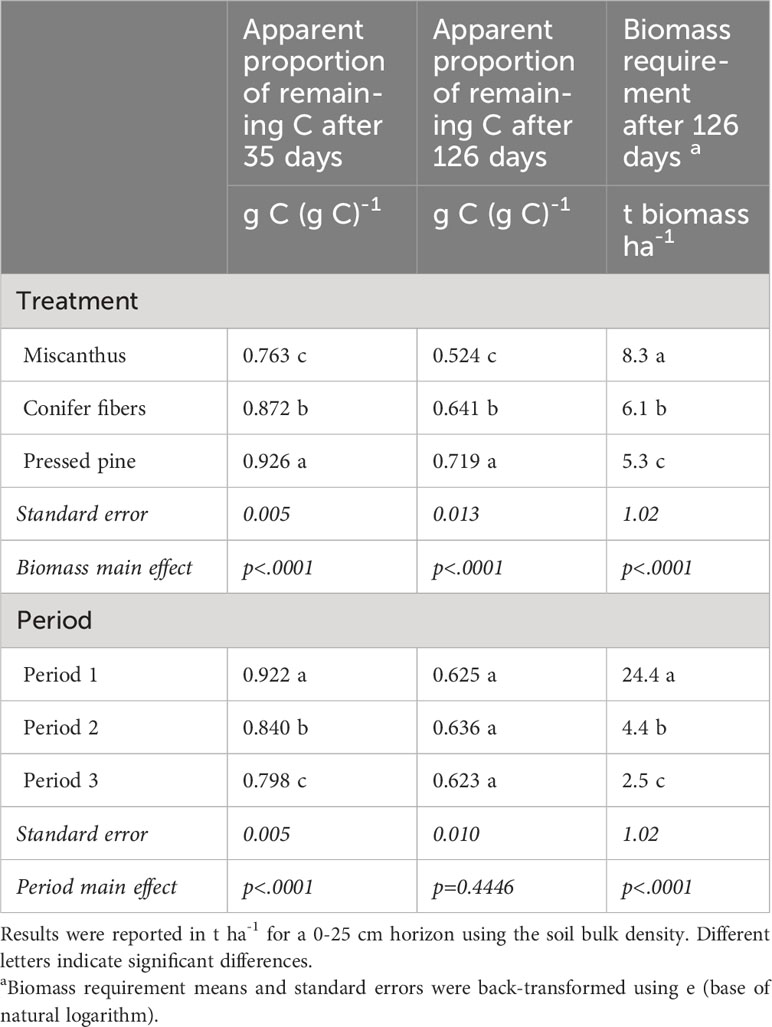
Table 7 Treatment and period main effect on the apparent proportion of remaining C after 35 days and 126 days and the biomass requirement after 126 days of incubation in the hemic soil (means and standard errors).
The pattern in biomass-induced CO2 emissions in the early phase of decomposition differed across the tested materials (Figure 5B). The three applications of miscanthus and conifer fiber induced CO2 peaks in the early phase of decomposition, and the peaks were lower in the conifer fiber treatment than in the miscanthus treatment. During the same period, the pressed pine treatment had lower and more stable emissions. These effects affected the 35-day apparent remaining C, which followed the ordering: pressed pine > conifer fibers > miscanthus for the three periods, except for the conifer fiber and the pressed pine in the first period (Tables 6, 7). It also affected the values of k, which followed the ordering: pressed pine< conifer fibers< miscanthus for the three periods, except for the conifer fiber and the pressed pine in the first period (Table 5).
3.2.2 Cumulative effect at the end of each amendment period
Cumulative CO2 emissions in the unamended control showed a marked decline from period one to period two and three, representing respectively 7.3, 1.1, and 0.5 t C-CO2 ha-1 for a 0-25 cm horizon (Figure 7). The biomass treatments also went from a negative carbon balance in the first period to a positive one in the second and third amendment periods (Figure 7). The calculated amount of biomass required to compensate for the C-CO2 loss averaged 24, 4.4, and 2.5 t ha-1 for the first, second, and third periods, respectively (Table 7). Given that the 126-day apparent remaining C of the plant materials was not significantly affected by the amendment periods (Tables 6, 7), the changes in biomass requirement across the periods were mainly driven by the marked reduction in C-CO2 loss from the unamended control.
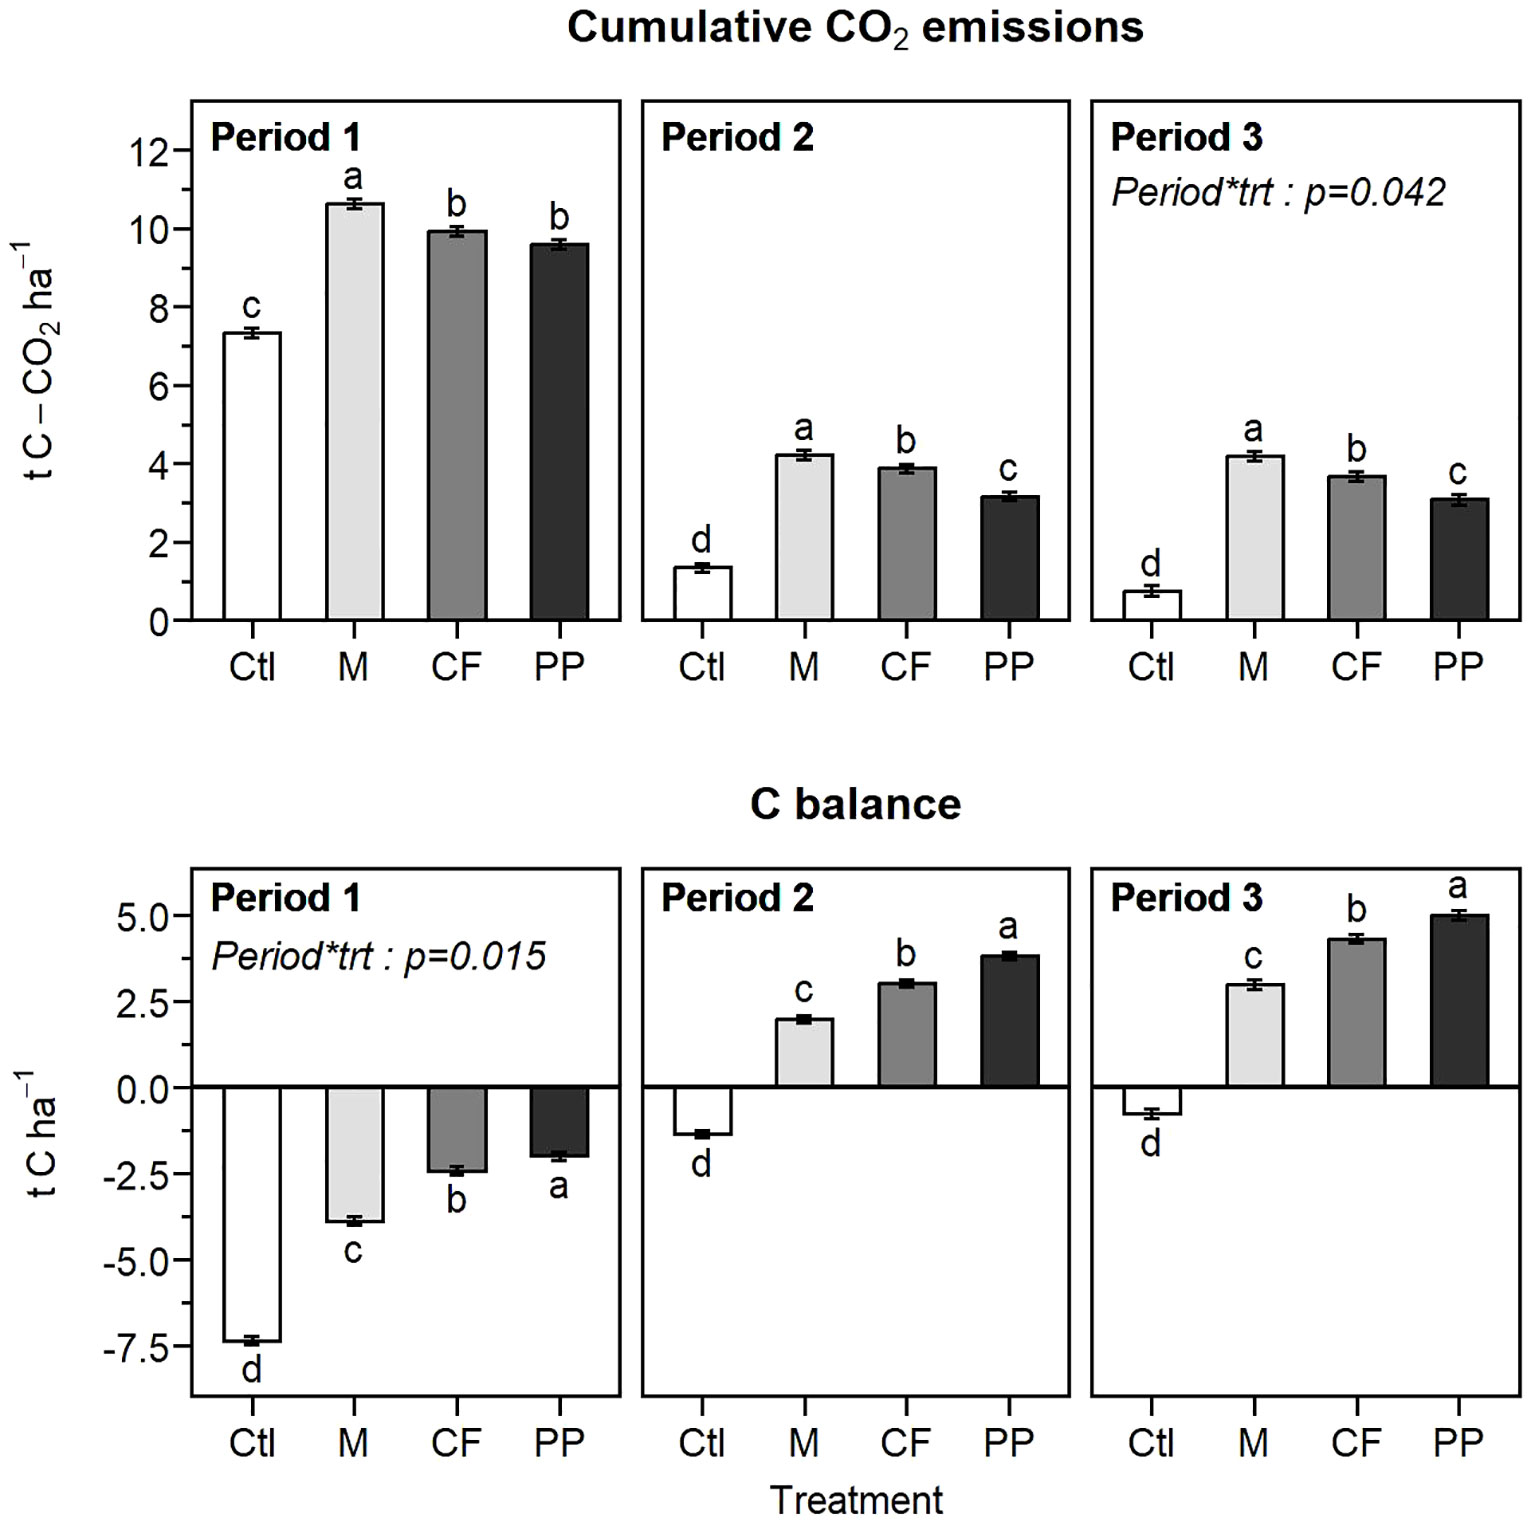
Figure 7 Interaction between treatments and periods for the cumulated C-CO2 emissions and carbon balance at the end of each period of the hemic soil (means ± standard errors). Results were reported in t ha-1 for a 0-25 cm horizon using the soil bulk density. Different letters indicate significant differences. Ctl, control; M, miscanthus; CF, conifer fibers; PP, pressed pine.
The 126-day apparent remaining C was significantly different across the plant materials with the following order: pressed pine > conifer fibers > miscanthus (Table 7). The biomass requirement followed the same ordering but with a more pronounced contrast between the miscanthus treatment and the two softwood treatments (Table 7) due to the miscanthus lower C content compared to the two softwoods (Table 2). The biomass requirement was, on average, 46% higher for the miscanthus than the two softwoods, while its 126-day apparent remaining C was only 23% lower. The biomass requirement was also 13% higher for the conifer fiber than for the pressed pine, while its apparent remaining C was 12% lower.
The miscanthus apparent remaining C model approached the model asymptote value by the end of period two and three, with differences of less than 0.02 unit (Figure 6; Tables 5, 6). However, the apparent remaining C data often decreased further than the C0 values (Figure 6; Tables 5, 6). For the miscanthus treatment, the model overestimated the final apparent remaining C by 3% and 4% on periods two and three but was within 0.5% of difference for the first period. The model also overestimated the final apparent remaining C by 6% and 1% for the conifer fibers treatment in periods one and three, respectively, and underestimated the final apparent remaining C by 1% for the pressed pine treatment in periods one and three. The model was within 0.5% of difference for the other periods of the conifer fibers and pressed pine treatments.
4 Discussion
4.1 Effect of the soil
The effect of the two soils on CO2 emissions was assessed by comparing the results for the three treatments that were tested in both soils, i.e., control, miscanthus straw, and conifer fibers (Table 2). The influence of the soil on the unamended control CO2 emissions will be discussed first, followed by the influence on the biomass treatments. It should be noted that differences in accumulated CO2 emissions between the two soils may partly result from variations in experimental conditions. Notably, the hemic soil’s incubation temperature, which was 3°C higher than that of the sapric soil, may have increased microbial activity (51, 68). Nevertheless, the 13% shorter incubation duration for the hemic soil is expected to have counterbalance much of the effect of the 14% higher incubation temperature. Furthermore, the drying and rewetting of the sapric soil three weeks before the experiment could have contributed to its lower CO2 emissions compared to the hemic soil, which did not undergo this drying-rewetting cycle prior to the experiment. Soil drying-rewetting can prompt short-term increases in CO2 emissions and subsequent long-term reductions. However, multiple drying-rewetting cycles are generally required to achieve significant reductions in soil CO2 emissions (69).
4.1.1 Effect of the soil on accumulated CO2 emissions from the unamended controls
Accumulated CO2 emissions from the unamended control showed important differences between the two soils. CO2 emissions estimated for a 0-25 cm horizon represented 0.7 t C-CO2 ha-1 yr-1 in the sapric soil and 7.3, 1.1, and 0.5 t C-CO2 ha-1 yr-1 in the hemic soil for the first, second, and third amendment period, respectively. Therefore, C-CO2 loss from the unamended control were 10-fold higher in the first measurement period of the hemic soil than in the sapric soil. Given that deeper soil layers, beyond 25 cm, can contribute to CO2 emissions, the levels of C-CO2 loss measured in the two unamended soils seem consistent with values reported in the literature. Emissions ranging from 2 to 16 t C-CO2 ha-1 yr-1 were reported for cultivated peat soils in temperate regions (43–48) and emissions ranging from 1.6 to 6.0 t C-CO2 ha-1 yr-1 were reported for a field and a laboratory study of Montérégie peat soils (70, 71).
The marked difference between the two soils for the first period is mainly due to the important increase in CO2 emissions that occurred in the hemic soil from days 33 to 84. Similar increases in CO2 emissions from unamended soils were observed in other incubation studies (72–74) and were attributed to a succession of soil microbial communities. Microbial succession might have been triggered in the hemic soil by the initial sieving of the soil, breaking peat fibers and exposing materials that were initially inaccessible to decomposers. In this case, the fact that mixing the hemic soil on days 63, 126 and 251 did not cause additional increases in CO2 emissions may be explained by the different intensity of soil perturbation, as soil mixing on these days was performed gently with a spoon and caused little damage to the peat fibers compared to the initial sieving. This observation suggests that soil perturbation intensity caused by different tillage practices, for instance, could strongly affect CO2 emissions from the tested hemic soil and, in turn, the amount of biomass required to compensate for these emissions. However, this interpretation should be considered with caution as the observed effect may result from the experimental conditions causing an artificial decrease in microbial activity and CO2 emissions in the long-term compared to field conditions, an effect that was observed in other long-term incubation studies (74, 75).
The fact that CO2 emissions did not markedly increase in the unamended sapric soil compared to the hemic soil despite its initial sieving suggests that different peat soils might respond differently to physical perturbation. This explanation would be consistent with the divergent findings reported in the literature concerning the effect of tillage on CO2 emissions from cultivated peatlands (11, 76–81). In the present study, the divergent response to the initial sieving could be explained by the different humification degrees of the soils (sapric versus hemic) and their different drainage history. Peat decomposability generally decreases as the humification degree and time since the onset of drainage increase (47, 49–52). If this effect is true for the two tested soils, the sieving process would have exposed materials with poorer decomposability in the sapric soil compared to the hemic soil, resulting in lower CO2 emissions in the former. Further investigation is necessary to determine if the humification degree can explain the divergent response of peat CO2 emissions to perturbation intensity and tillage practices. In future studies, it would be valuable to consider the potential additional benefits of reduced tillage for conserving cultivated peatlands and mitigating their environmental impacts, such as reduced N2O emissions (79) and reduced erosion.
The initial 10-fold difference in CO2 emissions observed between the two unamended soils appears highly unlikely to be solely a result of the 3°C temperature difference between the two experiments (51, 68) or the drying-rewetting of the sapric soil (69). Such a substantial variation in CO2 emissions suggests that C-CO2 loss could vary significantly across the cultivated peat soils of the Montérégie region. This effect could have profound implications for the design of straw and wood chips amendment programs as the biomass application rate could not be generalized to the whole cultivated peat soils of the region. Assessing the spatial variability in CO2 emissions across the cultivated peatlands of Montérégie is a crucial step for developing and implementing effective conservation strategies on these soils, as CO2 emissions data are limited for these soils. The variability in CO2 emissions from these soils may be related, in part, to their heterogenous humification degree (53) and drainage history (19). In turn, these two factors could be used for delineating management zones with specific recommendations for biomass application rates. The acquisition of additional data on CO2 emissions in these soils would also help project the effect of diverse scenarios for conserving these soils.
4.1.2 Effect of the soil on accumulated CO2 emissions from the biomass treatments
The biomass treatments affected CO2 emissions from the two tested soils differently. The final apparent remaining C of miscanthus straw and conifer fibers were 36% and 26% higher in the sapric soil than in the hemic soil, respectively (absolute difference of 0.187 and 0.165). These results indicate that a smaller proportion of applied C was lost through increased CO2 emissions in the sapric soil than in the hemic soil. This effect may be due to several reasons, such as a positive PE in the hemic soil, a negative PE in the sapric soil (56), and a slower decomposition rate of the plant material in the sapric soil compared to the hemic soil due to its higher humification degree (47). The lower air-filled porosity in the sapric soil compared to the hemic soil (Table 1) may also have reduced oxygen availability to microbial communities and slow the decomposition process (82). Under oxygen-limited conditions, however, applying plant materials might trigger denitrification since C bioavailability and soil aeration level were identified as primary drivers of N2O emissions in Quebec cultivated peat soils (83). Studying the influence of the plant materials on soil N2O emissions would therefore help evaluate the overall efficiency of this biomass-based strategy in attenuating the climate impact of cultivated peatlands.
The difference in the final apparent remaining C of the plant materials across the two soils suggests that the efficiency of the materials in compensating soil CO2 emissions could potentially differ across various peat soils. Further investigations are required to validate this observation and evaluate the variability in apparent remaining C across different peat soils. Identifying the factors contributing to this variation would also provide valuable information for the development of successful amendment programs on cultivated peat soils. Given that the soil humification degree can be a factor driving the decomposition and priming effect of plant materials (47, 56), it would be relevant to assess if soils with similar humification degree react similarly to the application of biomass in the Montérégie region. If their behavior is similar, then the production of a map delineating management zones based on the humification degree could be used to consider the variation in biomass efficiency across the region, in addition to the variation in the soil basal CO2 emissions, for the recommendation of biomass application rates. Additional parameters, such as the drainage history and air-filled porosity, may also help capture the variability in biomass efficiency.
4.2 Effect of the plant material type
The results of the two experiments revealed significant variations in the efficiency of the different plant materials in compensating for soil C-CO2 loss. The most pronounced difference in biomass requirement was observed between the treated softwoods and the untreated materials. Variations were also observed among the two treated softwoods and among the untreated plant materials. Each of these effects will be discussed in detail in the following subsections.
4.2.1 Treated softwoods vs untreated straws and hardwoods chips
In the two experiments, the mechanically treated softwoods had 9% to 38% higher apparent remaining C than the untreated straws and hardwoods chips. This effect, combined with the higher C content of the treated softwoods (Table 2), resulted in 11% to 35% lower amounts of biomass required to compensate for the soil C-CO2 loss for the treated softwoods than for the untreated materials. This difference can result in substantial reductions in the amount of biomass required at the farm scale and in the cost of this biomass-based conservation strategy. Further investigation incorporating cost-benefit analyses is needed to determine whether this reduced application rate could effectively reduce the soil conservation cost for farmers, as the mechanical treatment of the biomass can increase the purchase cost of this biomass type compared to untreated materials.
The higher apparent remaining C of the treated softwoods mainly results from lower CO2 emissions during the early phase of decomposition. This dynamic can be due to the lower fraction of soluble and hemicellulose-like components present in the mechanically treated softwoods (Table 2) compared to the untreated material since these fractions generally decompose more rapidly in the soil (84, 85). Although this effect has consequences for the biomass efficiency in compensating for soil C-CO2 loss, it might not necessarily affect its efficiency in compensating for soil subsidence if the C lost during the early phase of decomposition in the untreated biomass treatments has limited structural functions in the soil matrix. Further studies, including measurements of soil height, are required to evaluate the relative efficiency of mechanically treated softwoods and untreated straws and hardwoods chips in mitigating soil height loss in cultivated peatlands.
Using mechanically treated softwoods instead of untreated biomass materials could have additional benefits beyond those related to soil C stock. Prior research has demonstrated that the application of untreated biomass materials to peat soils can result in a substantial decrease in N availability (35, 36) and crop yield (38, 40). As observed in growing media, this decline in N availability and consequences for crop yield might be lessened by using treated softwoods instead of untreated biomass materials (86, 87). Moreover, increased CO2 emissions in peat amended with wood materials have been found to inhibit crop germination in growing media (88). Hence, the lower CO2 emissions during the early phase of decomposition for the treated softwoods compared to the untreated materials might attenuate adverse effects on crop germination. Additional research is required to assess the agronomical advantages of using mechanically treated materials compared to untreated materials, along with their impact on soil C stock and subsidence. Conducting such studies would offer valuable insights into the advantages and disadvantages of various material options. This information would prove valuable for farmers when deciding which biomass crops to include in their crop rotations or which biomass materials to purchase.
4.2.2 Difference among the treated softwoods
The two treated softwoods tested in the hemic soil had different efficiency in compensating for the soil C-CO2 loss, with 12% higher apparent remaining C and 13% lower biomass requirement for the pressed pine than for the conifer fiber. This effect results mainly from smaller CO2 emissions during the early phase of decomposition in the pressed pine treatment. This effect may be due to several reasons, including [1] the lower specific surface area of the pressed pine as compared to conifer fiber (Figure 1), limiting decomposer accessibility, [2] its higher C/N ratio (Table 2), limiting nitrogen availability to decomposers, and [3] its higher lignin content (Table 2), protecting cellulose against decomposers (84). As mentioned in section 4.2.1, this effect could reduce the amount of biomass required at the farm scale and the cost of soil conservation for farmers. Lower CO2 emissions in the early phase of decomposition might also have other agronomical advantages if associated with a lesser reduction in N availability and if it prevents inhibiting crop germination.
4.2.3 Difference among the untreated straws and hardwoods chips
The apparent remaining C of the untreated plant materials tested in the sapric soil did not significantly differ. The biomass requirement was, however, significantly higher, by 19%, for sorghum than for the other untreated materials. This effect is due to the not statistically significant 6% lower apparent remaining C of sorghum and its lower C content (Table 2). The lower efficiency of sorghum in compensating for the soil C-CO2 loss is consistent with Dessureault-Rompré et al. (32) study. However, the difference observed in the present study is much smaller. In Dessureault-Rompré et al. (32), study, the values of remaining C measured in mesh bags after 12 months of incubation in the field were 0.30, 0.67, and 0.56 for sorghum, miscanthus, and willow, respectively. Hence, in this previous study, the remaining C was 51% lower for sorghum than for miscanthus and willow, while the difference was only of 6% in the present study. The difference between the two studies may be due to the different experimental methods. Leaching of dissolved organic matter may have increased the loss of biomass C in the mesh bag experiment as compared to the present CO2 emissions study. Leaching can contribute significantly to plant litter C loss, especially for materials with higher proportions of soluble compounds and lower proportions of lignin-protected cellulose (89), such as sorghum (Table 2). The leaching of C from the biomass does not necessarily imply that this C is lost from the overall peat C stock, however, as it might still be retained in the soil. Further research addressing the fate of biomass C (CO2 emissions and leaching in and out of the soil) would help understand the decomposition dynamic of the plant materials and better assess their efficiency in preserving peat C stock.
The similar levels of biomass requirements for the untreated materials tested other than sorghum (miscanthus, switchgrass, willow, and birch) suggest that farmers could choose one of these biomass materials based on other characteristics, such as purchase cost, without compromising the effectiveness of their efforts to compensate for soil C-CO2 loss. Given the much smaller difference between sorghum straw and other untreated materials in the present study compared to the previous study (32), it would be valuable to conduct further investigations into the relative efficiency of sorghum and other untreated plant materials in preserving peat C stock. Sorghum is the only annual crop examined thus far in the context of this biomass-based conservation strategy, and its integration into crop rotations could be easier for farmers compared to perennial crops. Although perennial crops have their own advantages, such as higher biomass yield, the use of annual crops could facilitate on-farm biomass production and encourage the adoption of this biomass-based conservation strategy among farmers.
4.3 Effect of repeated applications of plant material
Contrary to the anticipated outcomes, repeated biomass applications to the hemic soil did not significantly affect the final remaining C of the tested plant materials. This result could suggest that CO2 emissions induced by the plant materials would not increase with repeated applications and that additive models, as projected in Dessureault-Rompré et al. (32), could reasonably reflect changes in the C stock of amended peat soils. However, the marked change in CO2 emissions dynamic from the first amendment period to the second and third amendment periods may have interfered with the actual influence of repeated applications. Indeed, the increased biomass-induced CO2 emissions during days 33 to 105 of the first amendment period reduced the biomass apparent remaining C compared with the second and third amendment periods. The reduction in the 35-day apparent remaining C across the applications for the miscanthus straw and conifer fibers treatments nevertheless suggests that the temporal dynamic of the apparent remaining C of these materials may change with repeated applications. This effect may need to be considered in C projection models as it affected the decomposition rate (k) of the tested exponential decay model. Further research is needed to understand better the influence of the repeated application of straw and wood chips on the soil CO2 emissions and consequences for calculating the biomass application rate required to compensate for peat C-CO2 loss and for developing accurate C projection models.
The difference observed between the final apparent remaining C of the biomass treatments and the model’s predicted value can have implications for the accuracy of soil C stock projections. In the case of simulating repeated biomass applications, the cumulative effect of overestimating or underestimating the final remaining C at each application can lead to substantial deviations in the projections. It is crucial for future studies focusing on peat C stock projections with repeated biomass applications to consider the potential consequences of reduced accuracy in modeling the final level of remaining C. One way to improve the model accuracy could be to apply a decomposition rate on the asymptote of the tested model, as the model asymptote was often higher than the final apparent remaining C value. This approach would align with other soil C stock models such as RothC and Century (90, 91).
4.4 Limitations and future consideration
This study provides valuable insights into the dynamics of CO2 emissions from contrasting cultivated peat soils amended with various plant materials. However, several limitations should be considered. It should be noted that soil layers extending beyond the 0-25 cm depth, which was exclusively considered in the calculations of the present study, can make a substantial contribution to the loss of C-CO2 in cultivated peat soils. Additionally, the present study, conducted under controlled conditions, cannot fully capture the dynamic nature of decomposition in the field where edaphic conditions constantly change due to variations in temperature and water content (precipitation and irrigation), for instance. Therefore, the values reported in the present study are not equal to actual values in the field, either for the 0-25 cm horizon or the entire soil depth. Moreover, the use of an incubation temperature higher than average field conditions, as tested in this incubation study, can influence CO2 emissions, either positively or negatively, depending on the degree of adaptation of microbial communities to this temperature (92). N fertilizer applications in the field may also lift N-limiting conditions (35, 36) and accelerate organic matter decomposition rate. The presence of roots can also both accelerate the loss of C-CO2 from the soil through the priming effect and add C to the soil through the production of root biomass and exudate (93, 94). Moreover, erosion (6, 9) and leaching processes (95) in the field can increase soil C loss. Addressing these factors in future studies would provide a more comprehensive understanding of the complex dynamics of C lost from cultivated peat soil and the potential of this biomass-based conservation strategy in preserving the soil C stock. In addition to the effect on the soil C stock, the effect of the plant materials on the peat thickness should be considered. A recent laboratory study showed that miscanthus and switchgrass straw could have twice the effect of willow and birch chips on the height of peat soil columns when regularly applied on a fixed mass basis (t ha−1) (34). Incorporating the measurement of peat thickness alongside soil C stock would provide a more comprehensive understanding of the efficiency of different plant materials in conserving cultivated peatlands. The economic sustainability of employing of straw and wood chips as a conservation method for cultivated peatlands is also a critical aspect to evaluate and is currently undergoing.
Furthermore, ways of slowing peat decomposition could be studied to reduce the amount of biomass required at the farm scale. Water table management, for instance, is one of the most recognized and efficient approaches (43, 47, 96, 97). The application of polyphenols, inspired by the ‘enzymic latch’ in natural peatlands (98–100), has shown promising results, with a 61% reduction in CO2 emissions observed in the same hemic soil that was tested in the present study (101). This approach was recently studied as an alternative method of slowing peat decomposition due to the difficulty for many farmers to adopt reduced tillage and maintain a high water table in the context of vegetable cropping systems. Exploring the interaction between plant materials and polyphenols is necessary to determine if this combination could reduce the amount of biomass required to compensate for cultivated peatland CO2 emissions and reduce the cost of soil conservation.
5 Conclusion
The findings of this study highlight the potential heterogeneity in C-CO2 loss from peat with contrasting humification degrees in the Montérégie region. Additionally, this study has demonstrated a potential variation in the effectiveness of applied biomass in compensating for C-CO2 loss in different peat soils. This study also identified plant materials that were more efficient in compensating peat C-CO2 loss, notably mechanically treated softwoods. The findings also suggest that repeated biomass applications would not result in a detectable change in its efficiency in compensating for peat C-CO2 loss. However, further investigation is required to validate this latter premise because CO2 emissions across the applications were inconsistent. This study nevertheless indicates that repeated application of miscanthus straw and conifer fibers could increase the short-term CO2 emissions induced by the biomass and affect the decomposition rate in the tested model. These findings emphasize the need to consider soil properties, plant material types, and the effect of repeated applications in the design of amendments program and C projection models. These findings underscore the need for additional research for characterizing the spatial variability in CO2 emissions in Montérégie peat soils and the response of their C stock to the application of plant materials. This effort would help develop and implement effective amendment programs in the heterogenous cultivated peatlands of Montérégie.
Data availability statement
The raw data supporting the conclusions of this article will be made available by the authors, without undue reservation.
Author contributions
KB: Conceptualization, Formal Analysis, Investigation, Visualization, Writing – original draft, Writing – review and editing. JF: Conceptualization, Resources, Supervision, Writing – review and editing. JD: Conceptualization, Supervision, Writing – review and editing. CL: Conceptualization, Formal Analysis, Supervision, Writing – review and editing. JC: Conceptualization, Funding acquisition, Project administration, Resources, Supervision, Writing – review and editing.
Funding
The author(s) declare financial support was received for the research, authorship, and/or publication of this article. This work was supported by the Natural Sciences and Engineering Research Council of Canada through a Postgraduate Scholarship [ES D3-559589-2021] awarded to the first author and an Industrial Research Chair [IRCPJ 411630-17] awarded to the last author. This study received funding from the following agri-businesses: Delfland Inc., Les Fermes du Soleil Inc., Les Fermes Hotte et Van Winden Inc., Les Fermes R.R. et Fils Inc., C. Isabelle & fils Inc., Les Jardins A Guérin & Fils Inc., Maraîchers J.P.L Guérin et Fils Inc., R. Pinsonneault et fils Ltée, Le Potager Montréalais Ltée, Le Potager Riendeau Inc., La Production Barry Inc., Productions Horticoles Van Winden Inc., Productions maraîchères Breizh Inc., and Vert Nature Inc. The funder was not involved in the study design, collection, analysis, interpretation of data, the writing of this article or the decision to submit it for publication. All authors declare no other competing interests.
Acknowledgments
We would like to thank Raphaël Deragon for sharing his expertise on the Montérégie agricultural peat soils degradation state. We would also like to thank Félix L’Heureux-Bilodeau and Diane Bulot for their help in the lab and the farmers of the agri-business partners for their support and financial contribution in this research. We also acknowledge the financial support of the Natural Sciences and Engineering Research Council of Canada (NSERC).
Conflict of interest
The authors declare that the research was conducted in the absence of any commercial or financial relationships that could be construed as a potential conflict of interest.
The author JD-R declared that they were an editorial board member of Frontiers, at the time of submission. This had no impact on the peer review process and the final decision.
Publisher’s note
All claims expressed in this article are solely those of the authors and do not necessarily represent those of their affiliated organizations, or those of the publisher, the editors and the reviewers. Any product that may be evaluated in this article, or claim that may be made by its manufacturer, is not guaranteed or endorsed by the publisher.
References
1. UNEP. Global peatlands assessment–the state of the world’s peatlands: Evidence for action toward the conservation, restoration, and sustainable management of peatlands. main report. global peatlands initiative. Kenya: United Nations Environment Programme Nairobi (2022).
2. IUSS Working Group WRB. World reference base for soil resources 2014, update 2015: International soil classification system for naming soils and creating legends for soil maps. World Soil Resour Rep No (2015) 106:192. Available at: https://www.fao.org/3/i3794en/I3794en.pdf.
3. Soil Classification Working Group. The Canadian system of soil classification. Agric Agri-Food Canada Publ (1998) 1646:187.
4. Loisel J, Yu Z, Beilman DW, Camill P, Alm J, Amesbury MJ, et al. A database and synthesis of northern peatland soil properties and Holocene carbon and nitrogen accumulation. Holocene (2014) 24(9):1028–42. doi: 10.1177/0959683614538073
6. Cumming AMJ. Multi-annual carbon flux at an intensively cultivated lowland peatland in East Anglia, UK [dissertation]. Univ Leicester (2018).
7. Deverel SJ, Leighton DA. Historic, recent, and future subsidence, sacramento-san Joaquin delta, California, USA. San Francisco Estuary and Watershed Science. California: eScholarship, University of California, Vol. 8. (2010).
8. Ilnicki P. Agricultural production systems for organic soil conservation. In: Parent LE, Ilnicki P, editors. Organic soils and peat materials for sustainable agriculture. Boca Raton, Florida: CRC Press (2003). p. 187–200.
9. Parent L, Millette J, Mehuys G. Subsidence and erosion of a Histosol. Soil Sci Soc America J (1982) 46(2):404–8. doi: 10.2136/sssaj1982.03615995004600020039x
10. Saurette DD, Deragon R. Better recognition of limnic materials at the great group and subgroup levels of the Organic Order of the Canadian System of Soil Classification. Can J Soil Sci (2022) 103(1):1–20. doi: 10.1139/cjss-2022-0030
11. Kløve B, Berglund K, Berglund Ö, Weldon S, Maljanen M. Future options for cultivated Nordic peat soils: Can land management and rewetting control greenhouse gas emissions? Environ Sci Policy (2017) 69:85–93. doi: 10.1016/j.envsci.2016.12.017
12. Lamontagne L, Martin A, Nolin MC. Étude pédologique du comté de Napierville (Québec). Laboratoires de pédologie et d'agriculture de précision, Centre de recherche et de développement sur les sols et les grandes cultures, Direction générale des sciences et de la technologie, Agriculture et Agroalimentaire Canada. (2014).
13. Hyväluoma J, Räty M, Kaseva J, Keskinen R. Changes over time in near-saturated hydraulic conductivity of peat soil following reclamation for agriculture. Hydrol Processes (2020) 34(2):237–43. doi: 10.1002/hyp.13578
14. Dessureault-Rompré J, Thériault L, Guedessou CV, Caron J. Strength and permeability of cultivated Histosols characterized by differing degrees of decomposition. Vadose Zone J (2018) 17(1):1–5. doi: 10.2136/vzj2017.08.0156
15. Hallema DW, Lafond JA, Périard Y, Gumiere SJ, Sun G, Caron J. Long-term effects of peatland cultivation on soil physical and hydraulic properties: case study in Canada. Vadose Zone J (2015) 14(6):vzj2014–10. doi: 10.2136/vzj2014.10.0147
16. Lafond JA, Piette ÉB, Caron J, Rancourt GT. Evaluating fluxes in Histosols for water management in lettuce: A comparison of mass balance, evapotranspiration and lysimeter methods. Agric Water Manag (2014) 135:73–83. doi: 10.1016/j.agwat.2013.12.016
17. Kechavarzi C, Dawson Q, Leeds-Harrison P. Physical properties of low-lying agricultural peat soils in England. Geoderma (2010) 154(3–4):196–202. doi: 10.1016/j.geoderma.2009.08.018
18. Tarnocai C, Kettles IM, Lacelle B. Peatlands of Canada. Geol Survey Canada Open File (2011) 6561. doi: 10.4095/288786
19. Sauriol P. Histoire des terres noires des Jardins-de-Napierville (2020). Available at: http://cld-jardinsdenapierville.com/wp-content/uploads/2020/12/CLD_JDN_Terres-noires_histoire.pdf.
20. Beaulieu J, Dulude P, Falardeau I, Murray S, Villeneuve C. Mise à jour de la cartographie détaillée des milieux humides pour le territoire de la Montérégie et le bassin versant de la rivière Yamaska. Tech Report Canards Illimités Canada Ministère du Développement (2013). Available at: https://belsp.uqtr.ca/id/eprint/1150/1/Canards%20Illimit%C3%A9s%20Canada_2013_Rapport_carto_mhs_Mont%C3%A9r%C3%A9gie_A.pdf.
21. National Assembly of Québec. Bill 132 (2017, chapter 14) An Act respecting the conservation of wetlands and bodies of water. Québec Official Publisher (2017).
22. Costanza R, De Groot R, Sutton P, van der Ploeg S, Anderson SJ, Kubiszewski I, et al. Changes in the global value of ecosystem services. Global Environ Change (2014) 26:152–8. doi: 10.1016/j.gloenvcha.2014.04.002
23. MAPAQ. Portrait-diagnostic sectoriel des légumes frais au Québec (2018). Available at: https://www.mapaq.gouv.qc.ca/fr/Publications/Portraitsectoriellegumesfrais.pdf.
24. Esselami D, Boudache M, Grenon L. L’évolution des terres noires et le problème de la compaction. Journée Horticoles St-Rémi (2014). Available at: https://www.mapaq.gouv.qc.ca/SiteCollectionDocuments/Regions/Monteregie-Ouest/Journees_horticoles_2014/4_decembre/Terres_noires/9h05_b_JH2014_profil_compaction_DEssalami.pdf.
25. Deragon R, Julien AS, Dessureault-Rompré J, Caron J. Using cultivated organic soil depth to form soil conservation management zones. Can J Soil Sci (2022) 102(03):633–50. doi: 10.1139/cjss-2021-0148
26. ULaval Nouvelles. Freiner la dégradation des sols organiques cultivés au Québec (2019). Available at: https://nouvelles.ulaval.ca/2019/04/24/freiner-la-degradation-des-sols-organiques-cultives-au-quebec-a:de91610d-e63b-4be6-bf06-270249005a21 (Accessed August 29, 2023).
27. NSERC. NSERC Industrial Research Chair in Conservation and Restoration of Cultivated Organic Soils (2018). Available at: https://www.nserc-crsng.gc.ca/Chairholders-TitulairesDeChaire/Chairholder-Titulaire_eng.asp?pid=735 (Accessed August 29, 2023).
28. Paul S, Leifeld J. Management of organic soils to reduce soil organic carbon losses. In: Understanding and fostering soil carbon sequestration. Cambridge, UK: Burleigh Dodds Science Publishing (2023) pp. 617–680. doi: 10.19103/AS.2022.0106.20
29. Freeman BW, Evans CD, Musarika S, Morrison R, Newman TR, Page SE, et al. Responsible agriculture must adapt to the wetland character of mid-latitude peatlands. Global Change Biol (2022) 28(12):3795–811. doi: 10.1111/gcb.16152
30. Ferré M, Muller A, Leifeld J, Bader C, Müller M, Engel S, et al. Sustainable management of cultivated peatlands in Switzerland: Insights, challenges, and opportunities. Land Use Policy (2019) 87:104019. doi: 10.1016/j.landusepol.2019.05.038
31. Joosten H, Tapio-Biström ML, Tol S. Peatlands: guidance for climate change mitigation through conservation, rehabilitation and sustainable use. Food Agric Organ United Nations Rome. 2nd edition. (2012) pp. 9–20.
32. Dessureault-Rompré J, Libbrecht C, Caron J. Biomass crops as a soil amendment in cultivated histosols: Can we reach carbon equilibrium? Soil Sci Soc America J (2020) 84(2):597–608. doi: 10.1002/saj2.20051
33. Rodriguez AF, Gerber S, Daroub SH. Modeling soil subsidence in a subtropical drained peatland. The case of the everglades agricultural Area. Ecol Modelling (2020) 415:108859. doi: 10.1016/j.ecolmodel.2019.108859
34. Bulot D, Dessureault-Rompré J, Bourdon K, Caron J. Restoring cultivated organic soils through organic amendments. Can Soc Soil Sci Annu meeting; 2021 June Virtual (2021).
35. Marmier V, Dessureault-Rompré J, Frossard E, Caron J. Impact of plant-based amendments on water-soluble nitrogen release dynamics in cultivated peatlands. Nitrogen (2022) 3(3):426–43. doi: 10.3390/nitrogen3030028
36. Bourdon K, Fortin J, Dessureault-Rompré J, Caron J. Agricultural peatlands conservation: How does the addition of plant biomass and copper affect soil fertility? Soil Sci Soc America J (2021) 85(4):1242–55. doi: 10.1002/saj2.20271
37. Béliveau M. Drainage des sols organiques peu profonds par tranchée drainante [master's thesis]. Québec, Canada: Laval University (2020). Available at: http://hdl.handle.net/20.500.11794/67137.
38. Rémy M. Reconstitution de propriétés physiques d'un sol organique affaissé: essais de différents amendements [master's thesis]. Québec, Canada: Laval University (2020). Available at: http://hdl.handle.net/20.500.11794/66448.
39. Grégoire V. L’apport de biomasse végétale et l’amélioration des propriétés hydrauliques des sols organiques cultivés [master's thesis]. Québec, Canada: Laval University (2020). Available at: http://hdl.handle.net/20.500.11794/66302.
40. Dessureault-Rompré J, Gloutney A, Caron J. Nutrient availability for Lactuca sativa cultivated in an amended peatland: an ionic exchange study. Nitrogen (2022) 3(1):26–42. doi: 10.3390/nitrogen3010002
41. Carlile W, Cattivello C, Zaccheo P. Organic growing media: Constituents and properties. Vadose Zone J (2015) 14(6). doi: 10.2136/vzj2014.09.0125
42. Gruda N, Schnitzler WH. Suitability of wood fiber substrate for production of vegetable transplants: I. Physical properties of wood fiber substrates. Scientia Hortic (2004) 100(1-4):309–22. doi: 10.1016/j.scienta.2003.10.001
43. Evans C, Peacock M, Baird A, Artz R, Burden A, Callaghan N, et al. Overriding water table control on managed peatland greenhouse gas emissions. Nature (2021) 593(7860):548–52. doi: 10.1038/s41586-021-03523-1
44. Elsgaard L, Görres CM, Hoffmann CC, Blicher-Mathiesen G, Schelde K, Petersen SO. Net ecosystem exchange of CO2 and carbon balance for eight temperate organic soils under agricultural management. Agric Ecosyst Environ (2012) 162:52–67. doi: 10.1016/j.agee.2012.09.001
45. Leifeld J, Müller M, Fuhrer J. Peatland subsidence and carbon loss from drained temperate fens. Soil Use Manag (2011) 27(2):170–6. doi: 10.1111/j.1475-2743.2011.00327.x
46. Grønlund A, Sveistrup TE, Søvik AK, Rasse DP, Kløve B. Degradation of cultivated peat soils in Norway based on field scale CO2, N2O and CH4 emission measurements. Arch Agron Soil Sci (2006) 52:149–59. doi: 10.1080/03650340600581968
47. Ilnicki P, Zeitz J. Irreversible loss of organic soil functions after reclamation. In: Organic soils and peat materials for sustainable agriculture. Boca Raton, Florida: CRC Press (2003). p. 15–32.
48. Kasimir-Klemedtsson Å, Klemedtsson L, Berglund K, Martikainen P, Silvola J, Oenema O. Greenhouse gas emissions from farmed organic soils: a review. Soil Use Manag (1997) 13:245–50. doi: 10.1111/j.1475-2743.1997.tb00595.x
49. Leifeld J, Steffens M, Galego-Sala A. Sensitivity of peatland carbon loss to organic matter quality. Geophys Res Lett (2012) 39(14). doi: 10.1029/2012GL051856
50. Glatzel S, Basiliko N, Moore T. Carbon dioxide and methane production potentials of peats from natural, harvested and restored sites, eastern Québec, Canada. Wetlands (2004) 24(2):261–7. doi: 10.1672/0277-5212(2004)024[0261:CDAMPP]2.0.CO;2
51. Scanlon D, Moore T. Carbon dioxide production from peatland soil profiles: the influence of temperature, oxic/anoxic conditions and substrate. Soil Sci (2000) 165(2):153–60. doi: 10.1097/00010694-200002000-00006
52. Lévesque M, Mathur S. A comparison of various means of measuring the degree of decomposition of virgin peat materials in the context of their relative biodegradability. Can J Soil Sci (1979) 59(4):397–400. doi: 10.4141/cjss79-045
53. Deragon R. Caractérisation des sols organiques cultivés du sud-ouest de Montréal: formation de groupes de gestion des sols à des fins de conservation [master's thesis]. Québec, Canada: Université Laval (2021). Available at: http://hdl.handle.net/20.500.11794/71034.
54. Blagodatskaya Е, Kuzyakov Y. Mechanisms of real and apparent priming effects and their dependence on soil microbial biomass and community structure: critical review. Biol Fertil Soils (2008) 45:115–31. doi: 10.1007/s00374-008-0334-y
55. Kuzyakov Y, Friedel J, Stahr K. Review of mechanisms and quantification of priming effects. Soil Biol Biochem (2000) 32(11–12):1485–98. doi: 10.1016/S0038-0717(00)00084-5
56. Bader C, Müller M, Szidat S, Schulin R, Leifeld J. Response of peat decomposition to corn straw addition in managed organic soils. Geoderma (2018) 309:75–83. doi: 10.1016/j.geoderma.2017.09.001
57. Zhao S, Qiu S, Xu X, Ciampitti IA, Zhang S, He P. Change in straw decomposition rate and soil microbial community composition after straw addition in different long-term fertilization soils. Appl Soil Ecol (2019) 138:123–33. doi: 10.1016/j.apsoil.2019.02.018
58. Cookson W, Beare M, Wilson P. Effects of prior crop residue management on microbial properties and crop residue decomposition. Appl Soil Ecol (1998) 7(2):179–88. doi: 10.1016/S0929-1393(97)00032-2
59. Agrométéo. Moyenne des degrés-jours (base 0 °C) cumulés entre le 1er avril et le 31 octobre (2023). Available at: https://www.agrometeo.org/index.php/atlas/map/moyenne30/base0/1979-2008/false (Accessed August 29, 2023).
60. Environment Canada. Canadian Climate Normals 1981-2010 Hemmingford four winds Station Data. Government of Canada (2010). Available at: https://climate.weather.gc.ca/climate_normals/.
61. Topp G, Zebchuk W. The determination of soil-water desorption curves for soil cores. Can J Soil Sci (1979) 59(1):19–26. doi: 10.4141/cjss79-003
62. Van Soest P, McQueen R. The chemistry and estimation of fibre. Proc Nutr Soc (1973) 32(3):123–30. doi: 10.1079/PNS19730029
63. Hopkins DW. Carbon mineralization. In: Carter MR, Gregorich EG, editors. Soil Sampling and Methods of Analysis. Boca Raton, Florida: CRC Press (2007). p. 589–98.
64. Winkler JP, Cherry RS, Schlesinger WH. The Q10 relationship of microbial respiration in a temperate forest soil. Soil Biol Biochem (1996) 28(8):1067–72. doi: 10.1016/0038-0717(96)00076-4
65. Rochette P, Hutchinson GL. Measurement of soil respiration in situ: chamber techniques. Micrometeorol Agric Syst (2005) 47:247–86. doi: 10.2134/agronmonogr47.c12
66. Gupta S, Singh J. Effect of alkali concentration, volume and absorption area on the measurement of soil respiration in a tropical sward. Pedobiologia (1977) 17:233–9. doi: 10.1016/S0031-4056(23)00176-2
67. Archontoulis SV, Miguez FE. Nonlinear regression models and applications in agricultural research. Agron J (2015) 107(2):786–98. doi: 10.2134/agronj2012.0506
68. Bader C, Müller M, Schulin R, Leifeld J. Peat decomposability in managed organic soils in relation to land use, organic matter composition and temperature. Biogeosciences (2018) 15(3):703–19. doi: 10.5194/bg-15-703-2018
69. Fierer N, Schimel JP. Effects of drying–rewetting frequency on soil carbon and nitrogen transformations. Soil Biol Biochem (2002) 34(6):777–87. doi: 10.1016/S0038-0717(02)00007-X
70. Glenn S, Heyes A, Moore T. Carbon dioxide and methane fluxes from drained peat soils, southern Quebec. Global Biogeochem Cycles (1993) 7(2):247–57. doi: 10.1029/93GB00469
71. Mathur SP, Rayment AF. Influence of trace element fertilization on the decomposition rate and phosphatase activity of a mesic fibrisol. Can J Soil Sci (1977) 57(4):397–408. doi: 10.4141/cjss77-045
72. Fu X, Wang J, Xie M, Zhao F, Doughty R. Increasing temperature can modify the effect of straw mulching on soil C fractions, soil respiration, and microbial community composition. PloS One (2020) 15(8):e0237245. doi: 10.1371/journal.pone.0237245
73. Wang J, Ren C, Feng X, Zhang L, Doughty R, Zhao F. Temperature sensitivity of soil carbon decomposition due to shifts in soil extracellular enzymes after afforestation. Geoderma (2020) 374:114426. doi: 10.1016/j.geoderma.2020.114426
74. Tian Q, He H, Cheng W, Zhang X. Pulse-dynamic and monotonic decline patterns of soil respiration in long term laboratory microcosms. Soil Biol Biochem (2014) 68:329–36. doi: 10.1016/j.soilbio.2013.10.015
75. Birge HE, Conant RT, Follett RF, Haddix ML, Morris SJ, Snapp SS, et al. Soil respiration is not limited by reductions in microbial biomass during long-term soil incubations. Soil Biol Biochem (2015) 81:304–10. doi: 10.1016/j.soilbio.2014.11.028
76. L’Heureux-Bilodeau F, Dessureault-Rompré J, Rousseau A. Carbon dioxide emission from organic soil amended with straw and wood chips. Acta Horticulturae. ISHS: Proceedings of the I International Symposium on Growing Media, Compost Utilization and Substrate Analysis for Soilless Cultivation; 2023 June 11-15; Quebec city, Canada. Acta Horticulturae (under press) (2023).
77. Taft HE, Cross PA, Jones DL. Efficacy of mitigation measures for reducing greenhouse gas emissions from intensively cultivated peatlands. Soil Biol Biochem (2018) 127:10–21. doi: 10.1016/j.soilbio.2018.08.020
78. Berglund Ö, Berglund K. Continuous measurements of CO2 emission from cultivated peat soil-effect of tillage intensity. In: EGU Gen Assembly Conf Abstracts (2014) 16, 1865.
79. Elder JW, Lal R. Tillage effects on gaseous emissions from an intensively farmed organic soil in North Central Ohio. Soil Tillage Res (2008) 98(1):45–55. doi: 10.1016/j.still.2007.10.003
80. Gesch RW, Reicosky DC, Gilbert RA, Morris DR. Influence of tillage and plant residue management on respiration of a Florida Everglades Histosol. Soil Tillage Res (2007) 92(1–2):156–66. doi: 10.1016/j.still.2006.02.004
81. Morris D, Gilbert R, Reicosky D, Gesch R. Oxidation potentials of soil organic matter in Histosols under different tillage methods. Soil Sci Soc America J (2004) 68(3):817–26. doi: 10.2136/sssaj2004.8170
82. Gliński J, Stępniewski W. Soil aeration and its role for plants. CRC Press (2018) pp. 105–135. doi: 10.1201/9781351076685
83. Rochette P, Tremblay N, Fallon E, Angers DA, Chantigny MH, MacDonald JD, et al. N2O emissions from an irrigated and non-irrigated organic soil in eastern Canada as influenced by N fertilizer addition. Eur J Soil Sci (2010) 61(2):186–96. doi: 10.1111/j.1365-2389.2009.01222.x
84. Berg B, McClaugherty C. Plant litter: decomposition, humus formation, carbon sequestration. Heidelberg: Springer Berlin (2008) pp. 115–147. doi: 10.1007/978-3-662-05349-2
85. Weil RR, Brady NC. The nature and properties of soils. 15th. Essex, England: Pearson Education Limited (2017). p. 1104.
86. Vandecasteele B, Muylle H, De Windt I, Van Acker J, Ameloot N, Moreaux K, et al. Plant fibers for renewable growing media: Potential of defibration, acidification or inoculation with biocontrol fungi to reduce the N drawdown and plant pathogens. J Cleaner Prod (2018) 203:1143–54. doi: 10.1016/j.jclepro.2018.08.167
87. Barrett GE, Alexander PD, Robinson JS, Bragg NC. Achieving environmentally sustainable growing media for soilless plant cultivation systems–A review. Scientia Hortic (2016) 212:220–34. doi: 10.1016/j.scienta.2016.09.030
88. Naasz R, Caron J, Legault J, Pichette A. Efficiency factors for bark substrates: Biostability, aeration, or phytotoxicity. Soil Sci Soc America J (2009) 73(3):780–91. doi: 10.2136/sssaj2008.0058
89. Soong JL, Parton WJ, Calderon F, Campbell EE, Cotrufo MF. A new conceptual model on the fate and controls of fresh and pyrolized plant litter decomposition. Biogeochemistry (2015) 124:27–44. doi: 10.1007/s10533-015-0079-2
90. Coleman K, Jenkinson D. RothC-26.3-A Model for the turnover of carbon in soil. In: Evaluation of soil organic matter models: Using existing long-term datasets. Berlin: Springer (1996) p. 237–46.
91. Parton W, Scurlock J, Ojima D, Gilmanov T, Scholes RJ, Schimel DS, et al. Observations and modeling of biomass and soil organic matter dynamics for the grassland biome worldwide. Global Biogeochem cycles. (1993) 7(4):785–809. doi: 10.1029/93GB02042
92. Allison SD, Wallenstein MD, Bradford MA. Soil-carbon response to warming dependent on microbial physiology. Nat Geoscience. (2010) 3(5):336–40. doi: 10.1038/ngeo846
93. Comeau LP, Hergoualc’h K, Hartill J, Smith J, Verchot LV, Peak D, et al. How do the heterotrophic and the total soil respiration of an oil palm plantation on peat respond to nitrogen fertilizer application? Geoderma (2016) 268:41–51. doi: 10.1016/j.geoderma.2016.01.016
94. Cheng W, Johnson DW, Fu S. Rhizosphere effects on decomposition: controls of plant species, phenology, and fertilization. Soil Sci Soc America J (2003) 67(5):1418–27. doi: 10.2136/sssaj2003.1418
95. Liu H, Zak D, Rezanezhad F, Lennartz B. Soil degradation determines release of nitrous oxide and dissolved organic carbon from peatlands. Environ Res Lett (2019) 14(9):094009. doi: 10.1088/1748-9326/ab3947
96. Moore T, Knowles R. The influence of water table levels on methane and carbon dioxide emissions from peatland soils. Can J Soil Sci (1989) 69(1):33–8. doi: 10.4141/cjss89-004
97. Stephens JC, Allen LH, Chen E. Organic soil subsidence. Rev Eng geology. (1984) 6:107–22. doi: 10.1130/REG6-p107
98. Dunn C, Freeman C. The role of molecular weight in the enzyme-inhibiting effect of phenolics: the significance in peatland carbon sequestration. Ecol Engineering. (2018) 114:162–6. doi: 10.1016/j.ecoleng.2017.06.036
99. Freeman C, Fenner N, Shirsat AH. Peatland geoengineering: an alternative approach to terrestrial carbon sequestration. Phil Trans R Soc A (2012) 370(1974):4404–21. doi: 10.1098/rsta.2012.0105
100. Freeman C, Ostle N, Kang H. An enzymic’latch’on a global carbon store. Nature (2001) 409(6817):149–9. doi: 10.1038/35051650
Keywords: organic soil, histosol, peat decomposition, soil conservation, sustainable land management, carbon storage
Citation: Bourdon K, Fortin J, Dessureault-Rompré J, Libbrecht C and Caron J (2023) Mitigating CO2 emissions from cultivated peatlands: Efficiency of straws and wood chips applications in maintaining carbon stock in two contrasting soils. Front. Soil Sci. 3:1285964. doi: 10.3389/fsoil.2023.1285964
Received: 30 August 2023; Accepted: 24 October 2023;
Published: 09 November 2023.
Edited by:
Katell Quenea, Sorbonne Universités, FranceReviewed by:
Jörg Luster, Snow and Landscape Research (WSL), SwitzerlandFrancesco De Mastro, University of Bari Aldo Moro, Italy
Copyright © 2023 Bourdon, Fortin, Dessureault-Rompré, Libbrecht and Caron. This is an open-access article distributed under the terms of the Creative Commons Attribution License (CC BY). The use, distribution or reproduction in other forums is permitted, provided the original author(s) and the copyright owner(s) are credited and that the original publication in this journal is cited, in accordance with accepted academic practice. No use, distribution or reproduction is permitted which does not comply with these terms.
*Correspondence: Karolane Bourdon, a2Fyb2xhbmUuYm91cmRvbi4xQHVsYXZhbC5jYQ==