 Marshall Kana Samuel
 Stephanie Evers
- 1Soil Science and Water Program, Malaysian Agricultural Research and Development Institute (MARDI), Roban, Sarawak, Malaysia
- 2School of Biological and Environmental Science, Faculty of Science, Liverpool John Moores University, Liverpool, United Kingdom
Compaction is recognized as an effective method for mitigating the risk of fires by enhancing soil moisture levels. This technique involves restricting peat pore spaces through compaction, facilitating improved capillary action for water retention and rehydration. The compaction of tropical peatlands, while beneficial for fire prevention, has the potential to influence biogeochemical processes and subsequent carbon emissions. The magnitude of compaction and groundwater level are strongly coupled in such environments, making it difficult to distinguish the control of physicochemical properties. Therefore, this study seeks to understand how peat compaction affects its properties, carbon emissions, and their relationship, with a focus on geophysical processes. Intact peat samples were collected from a secondary peat swamp forest and an oil palm plantation in Selangor, Peninsular Malaysia. Compaction treatments were applied to achieve three levels of volume reduction. CO2 and CH4 emissions were measured using an automated gas analyzer, and the physicochemical properties of the peat were determined. The results revealed that mechanical compaction significantly altered the physicochemical properties of the secondary forest peat, displaying an opposite pattern to the oil palm plantation, particularly regarding total nitrogen and sulfur. Moreover, the average reduction percentage ratio of CO2 emissions (from 275.4 to 182.0 mg m-2 hr-1; 33.9%) to CH4 uptakes (from -17.8 to -5.2 µg m-2 hr-1; 70.1%) (~1:2) indicated distinct stages of decomposition and translocation of less decomposed peat to deeper layers due to compaction, predominantly in secondary peat swamp forest samples. The oil palm plantation samples were unaffected by compaction in terms of physicochemical properties and carbon emissions, indicating the ineffectiveness of this approach for reducing fire risk in already drained systems. This study underscores the necessity of understanding the effects of compaction in the absence of groundwater to accurately evaluate the widespread application of this technique.
1 Introduction
Tropical peatlands are very fragile and sensitive ecosystems. The conversion of these areas into agricultural farms necessitates intensive inputs and management practices, which can adversely affect the ecosystem and lead to land degradation and environmental issues. Tropical peatlands require intensive and proper management for sustainable crop productivity (1). The drainage of tropical peatlands brings about alterations in soil bio-geo-physicochemical, thereby influencing the release of CO2, CH4, organic acids and organic particulates. Moreover, the rate of carbon loss is expected to be affected by climate change (2), particularly from the establishment of oil palm through the drainage and conventional slash-and-burn technique (3, 4).
The compaction method, currently employed by oil palm companies in Sarawak, Malaysia, addresses emerging environmental concerns and aims to enhance palm yield. Peat compaction can occur passively through natural processes such as shrinkage, subsidence, and compression, or actively through the use of heavy machinery (5). Apart from improving yield and serving as soil mechanical anchorage for the oil palm root system (6), this technique is believed to effectively reduce the risk of fire by enhancing soil moisture levels (7–9). Restricting peat pore spaces through compaction facilitates enhanced capillary action, leading to improved water retention and rehydration (10). Importantly, the improved yields resulting from this method contribute to the efficient use of land, ensuring that less land is needed for the same agricultural outputs. This dual impact on environmental sustainability and land efficiency highlights the compaction method broader positive implications. However, several reports have suggested that the peat pores may become disconnected when the groundwater level is too low (11–14). Despite the widespread use of this technique in Malaysia (15, 16), no comprehensive study has yet verified these claims.
Carbon fluxes in a peatland ecosystem are highly influenced by the groundwater level (12, 17, 18). During the wet season, a high groundwater level restricts the diffusion of atmospheric oxygen into the peat soil, thereby restraining microbial activity and decomposition rates (19). Carbon removal is primarily carried out by methanogenic microbes, which convert organic substrate into CH4. However, these microbes are unable to metabolize organic matter into CO2 due to the limited availability of oxygen (20). On the other hand, a low water table leads to increased air within the peat soil and subsequent water depletion, resulting in shrinkage (21). Under such conditions, aerobic decomposition occurs, which is characterized by a decrease in the water-filled pore space. In this process, carbon is lost in the form of CO2 as microbes metabolize organic matter in an unsaturated zone (22).
In peat swamp forest areas, the groundwater level is typically high and subject to seasonal variations. However, in secondary peat swamp forests with a history of logging activities, there is a legacy drainage network spanning over 250 km (23). Although vegetative recovery has occurred since 1990, it is likely that the hydrological impact persists, resulting in a reduced overall groundwater level and altered natural seasonal fluctuations (24). Despite the protection of secondary peat swamp forests by the Malaysian State Forestry Department such as the Tanjong Karang peat swamp forest and drain blocking efforts, the observed groundwater fluctuations indicate the restoration of natural responses to seasonal changes. Overall, these peat swamp forest areas appear to effectively store carbon (25–27). On the other hand, in oil palm plantations, water table control can be seen as an opportunity to mitigate carbon emissions. The National Interpretation of RSPO Principles and Criteria for Sustainable Palm Oil Production in 2015 (28) highlights specific guidance for water table standards in existing plantations on peat, particularly under National Principle and Criteria number 4.3.4. It proposes maintaining a water table level of 40.0 cm to 60.0 cm from the peat surface to sustain productivity of the palm oil plantations while simultaneously reducing carbon oxidation.
While a high groundwater level offers the advantage of controlling CO2 and CH4 emissions, it also has implications for pore deformation in peat and the self-recovery behavior of actively compacted peat (18). Also, Baker et al. (29) reported that the sub-irrigated soils are unable to develop stable aggregates due to water interference, resulting in slacking of soil macroaggregates. In general, peat pores decrease in size from the surface to deeper layers owing to different decomposition levels during peat formation (30). As a result, anisotropic pores that are important for water transportation and geochemical functions are developed (30). On the other hand, compaction causes the reconfiguration of pores, resulting in a horizontally laminated structure. This can lead to the entrapment of biogenic gases and the creation of an oxygen-limited environment that favors anaerobic conditions, which may have adverse effects on the overall peatland community (30–32).
Based on the above rationale, the main objective of this study is to assess compaction and mitigate groundwater-related challenges through an ex-situ experiment. It is hypothesized that compaction, in the absence of groundwater fluctuation, can change the physicochemical properties of peat and affect carbon emissions from the peat surface. The objectives of this study are: (1) to manipulate the bulk density (to vary the degree of compactness) of intact peat samples; (2) to examine the changes in the physicochemical properties and carbon emissions of peat under varying degrees of compaction; (3) to establish a correlation between the physicochemical properties of peat and its carbon emissions; and (4) to discuss and interpret the results in light of geophysical processes and mechanisms.
2 Materials and methods
2.1 Collection of intact peat sample
Undisturbed peat cores (intact peat samples) were collected from two tropical peatlands in Selangor, peninsular Malaysia: a drained and previously selectively logged-over peat swamp forest (SF) in Tanjong Karang (3°41’49.2” N 101°11’06.0” E) in Northern Selangor that had been logged at least 30 years before the study as well as a 10-year-old, 2nd generation oil palm plantation (OP) in Sepang (2°44’20.4” N 101°39’10.8” E) in Southern Selangor that was originally converted in 1978 (Figure 1). This contrasted the semi-natural and the human-modified landscapes in the study area. The sampling was conducted in July 2017. According to the data from the Malaysian Meteorological Department (MetMalaysia), Tanjong Karang (the nearest weather station at MARDI Tanjong Karang) had an average temperature of 28.1°C, a maximum temperature of 33.5°C and a minimum temperature of 23.6°C in July 2017. The total rainfall was 127.8 mm, and the average relative humidity was 81%. Meanwhile, Sepang had an average temperature of 28.3°C, a maximum temperature of 33.6°C and a minimum temperature of 23.9°C in July 2017. The total rainfall was 97.4 mm, and the average relative humidity was 79%. Both locations experienced warm and humid weather in July 2017, with similar temperature ranges and rainfall amounts. However, Sepang had slightly higher temperatures and lower humidity than Tanjong Karang.
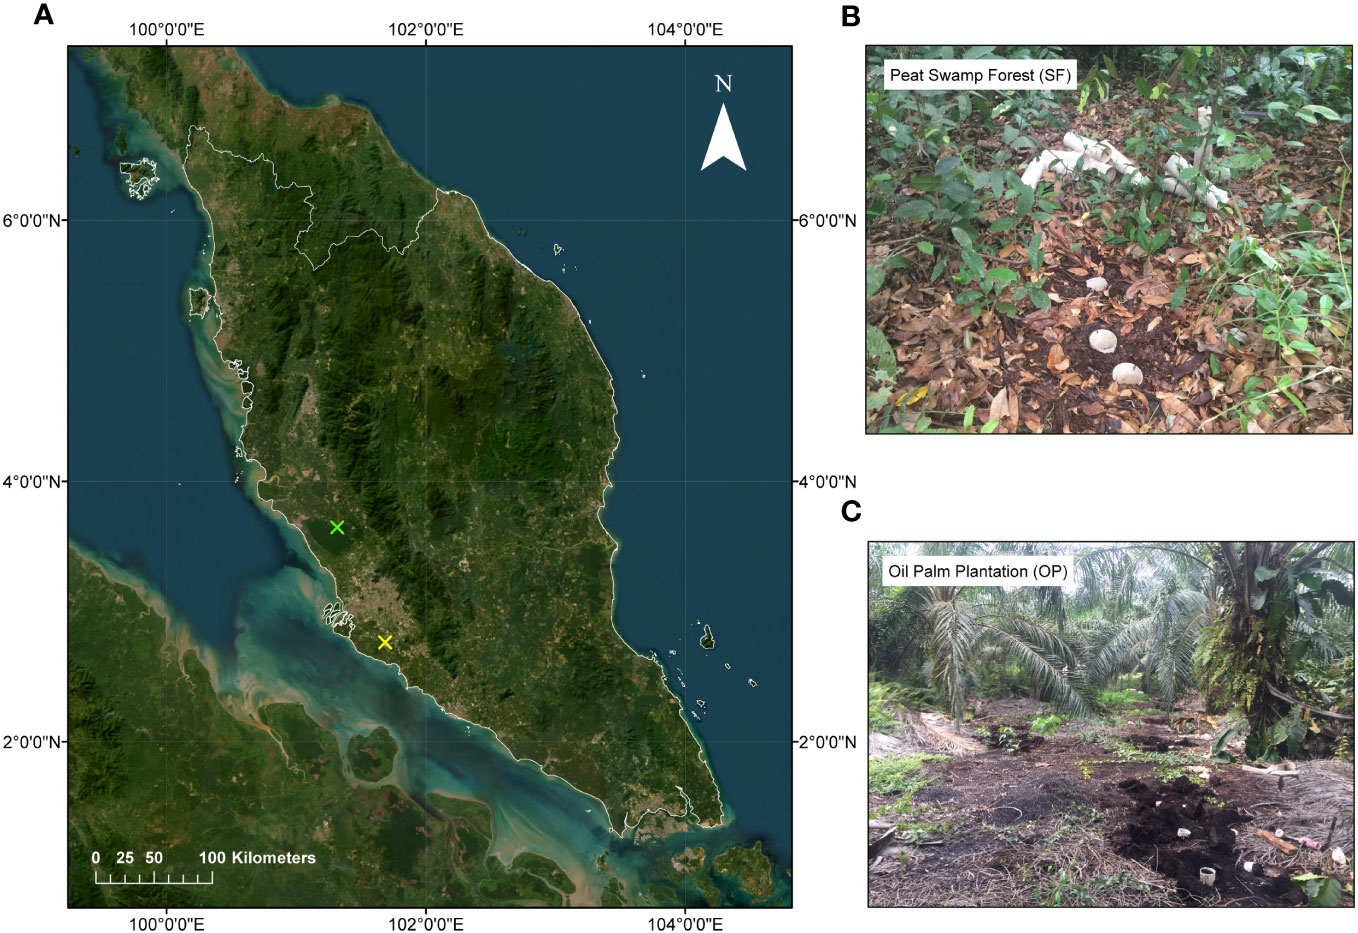
Figure 1 (A) Map of Peninsular Malaysia that shows the locations of intact peat samples collected from two different ecosystems in Selangor state that are marked by colored X: (B) Peat Swamp Forest with the green X and (C) Oil Palm Plantation with the yellow X.
The groundwater level was between 50.0 cm and 70.0 cm below the peat surface at both sites. Groundwater level conditions facilitated intact peat sampling because peat aggregates are more stable without the interference of groundwater fluctuations (29). Uniform PVC tubes with a 5.08 cm inner radius and 40.0 cm height were used to extract the intact peat samples. The sampling site in SF was selected based on aboveground plant biomass that was covered by a sapling, making the root young and easy to collect. Meanwhile, in the OP, sampling was performed on the harvesting path, specifically more than 3.0 m away from the palms. A total of 50 intact samples were extracted from both ecosystems, including ten reference samples that were taken alongside the intact samples to determine the peat moisture content. The peat moisture content values were used as a standard to manipulate compaction treatments and estimate the initial bulk density.
2.2 Manipulation of compaction treatments using bulk density value
The gravimetric water content of intact peat samples was estimated by measuring their fresh weight before conducting the compaction treatment. This parameter affects the bulk density and porosity of peat, which are important properties for assessing its compression potential. The samples from each ecosystem group, e.g., SF (1933.8 ± 58.4 g) (n=25) and OP (2838.1 ± 59.2 g) (n=25), had similar fresh weight values, indicating that they had comparable water content levels. Therefore, the intact samples within each group were considered as dependent samples that could be paired and analyzed for changes in peat properties. Moreover, the homogeneity of the samples within each group in terms of fresh weight would reduce the variability and increase the reliability of the results, as the effects of the treatment on bulk density could be isolated from the effects of initial sample weight.
Estimation of the initial peat dry bulk density was based on the percentage water loss from the reference samples, which had been dried in an oven at 105°C for 48 hours. While waiting for the reference samples to dry, the water lost from intact peat through evaporation was corrected using gravimetric calculation. Water loss correction was made through the addition of rainwater to mimic the water source from aboveground rainfed peatlands (ombrotrophic), maintain consistent soil moisture contents in daily course.
With the reference samples, maximum compaction was also tested to assess PVC durability in withstanding extreme pressure. From these trials (n = 5 for each land use type), the maximum compression for the peat samples from SF was as high as 30% of the modified soil height. However, OP intact samples could only be compressed by 15%. compared to the SF area (Figure 2). Thus, compaction treatments used were chosen to provide a range of compaction levels (namely 10, 20 and 30% for SF and 5, 10 and 15% for OP). Uncompressed control cylinder samples were also assessed alongside treatments. In addition, to account for the total compaction because of cylinder insertion, total height reduction from the original surface (pre cylinder insertion) and the final height after cylinder insertion and compaction treatment were also recorded.
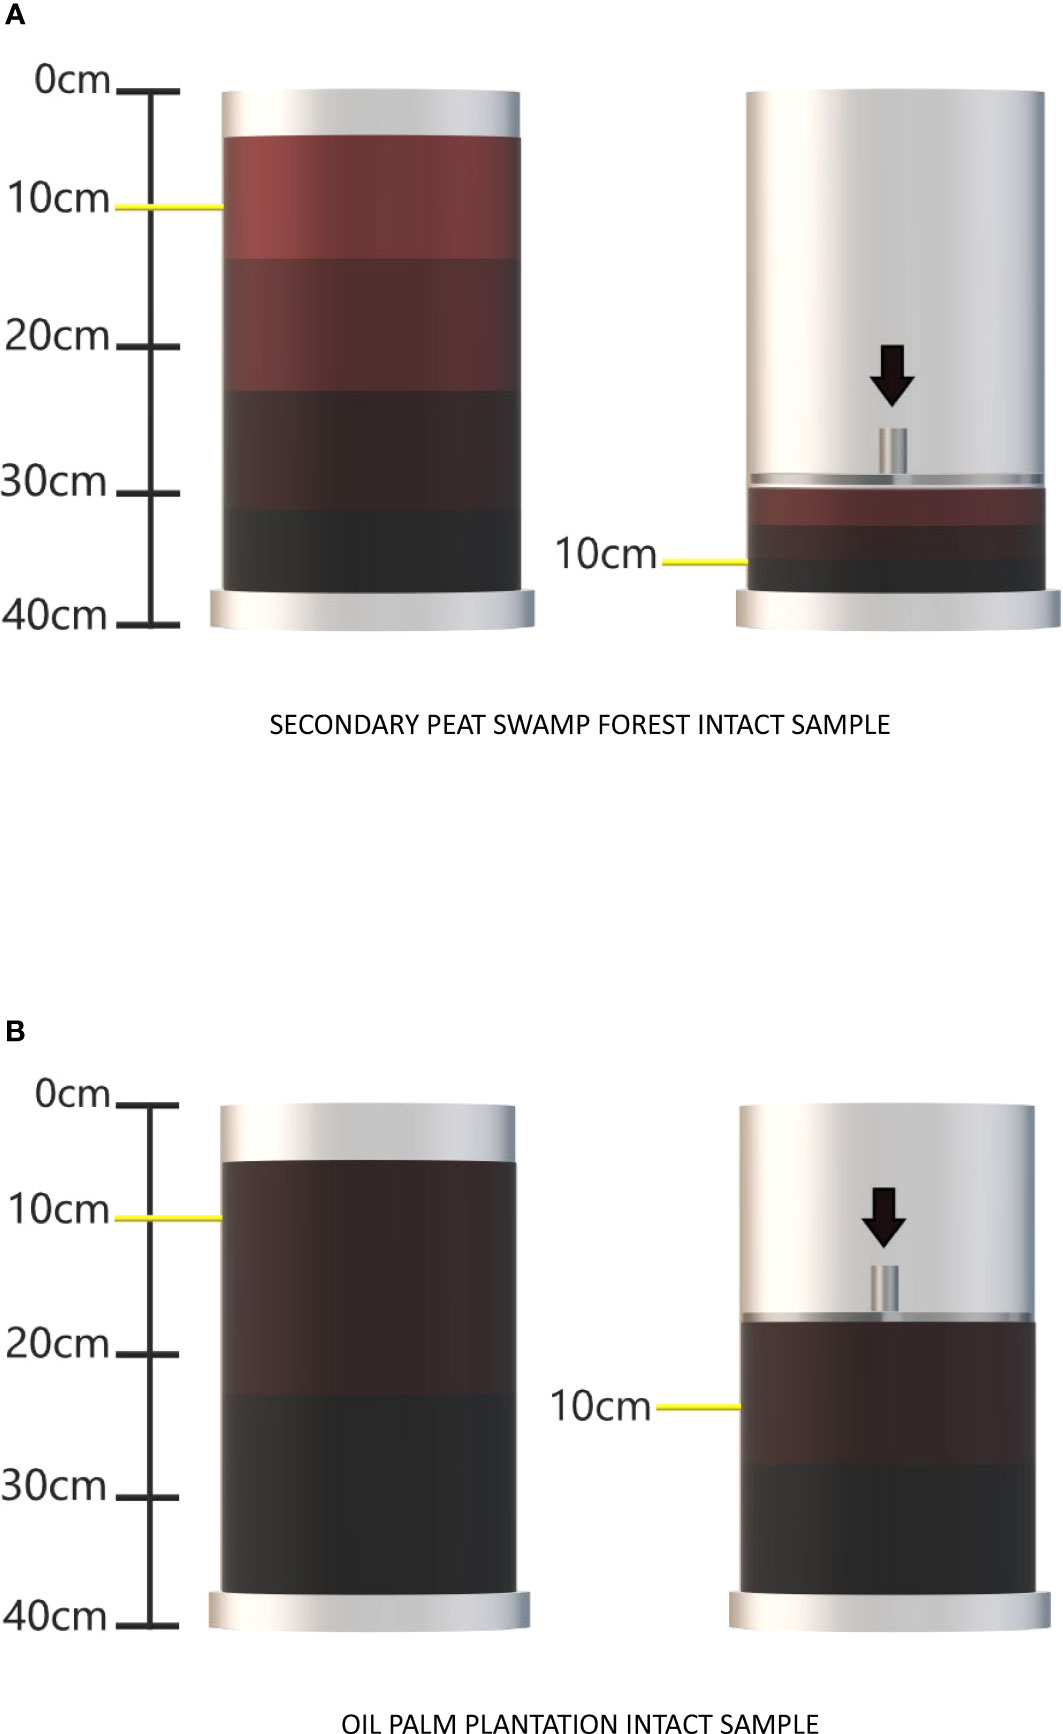
Figure 2 Illustrating the translocation mechanism between the peat surface and deeper layers resulting from mechanical compaction in (A) secondary peat swamp forest and (B) oil palm plantation intact samples.
To establish compaction magnitudes for the assigned treatments, bulk density values were calculated based on the altered volume of peat sample. To calculate the bulk density, the mass of the soil within the cylinder and the volume of the cylinder must be known. The bulk density can be calculated using the following Equation (1):
The soil mass can be determined by weighing the soil based on the volume of the soil. Once the soil mass is known, the volume of the soil within the cylinder can be calculated using the height of the soil cylinder core volume.
Assuming a constant radius of the cylinder, the volume of the soil can be calculated using the following Equation (2):
Where is the radius of the cylinder and is the height of the soil cylinder core volume. Substituting this equation into the bulk density Equation (3) gives:
To calculate the altered bulk density value, the height of the initial peat in the PVC tube was adjusted to account for the volume of peat. This calculation is presented in Equation (4):
Where is the height of the initial peat in centimeters with one decimal place, is the initial peat weight in grams, is approximately 3.142, is the inner radius of the PVC tube in centimeters, and is the value of bulk density obtained from the proposed treatment that is expressed in grams per cubic centimeter (g cm-3). It is important to note that this equation assumes the peat soil to be homogeneous throughout the cylinder and the cylinder to have a constant radius. If the soil is not homogeneous or if the radius of the cylinder varies, the equation would need to be adjusted accordingly.
The experiment consisted of two phases: a pre-compaction phase lasting 120 hours for SF and 96 hours for OP which aimed at testing emissions stability and serving as a control for post-compression emissions. The post-compaction phase lasted 120 hours for both SF and OP samples which aimed to assess the effects of compaction. In this study, intact core samples were randomly placed inside a covered room and maintained at a constant temperature of 30.0°C for a total duration of 216 to 240 hours. It is important to note that gas measurements at the 0-hour mark were excluded from the dataset. This decision was made to address concerns about potential disturbances during the relocation from the initial field conditions.
2.3 Peat sampling and physicochemical properties analysis
The peat (actual) bulk density samples were collected separately from the intact peat cores at the end of the compaction experiment. Considering the small inner diameter of the peat surface within the PVC tube (0.051 m diameter and 0.002 m2 area), a bulk density core sub-sample with a volume of 50.0 cm3 at a peat depth of 7.0 cm was extracted from the soil collar (18). This was accomplished using a modified open-ended syringe (50.0 ml) whereby the luer part of the syringe was previously cut off (0.027 m diameter with 0.0006 m2 area). Then, 30.0 g of fresh peat was scooped out using a spatula for further analysis of selected peat physicochemical properties. In this study, there was an emphasis on peat surface sampling because peat soil plays a significant role in regulating CO2 and CH4 emissions within the depth range of 0 to 10.0 cm (33, 34) as well as influencing physicochemical properties (35). Moreover, this depth range is considered effective for soil compaction (36).
In the laboratory, the analysis of dry bulk density was conducted using the core method as mentioned in the earlier section. Loss on ignition () was determined from a small fraction of composite oven-dried peat (5.0 g) () via complete combustion by adhering to the method prescribed by Marwanto et al. (14). After that, the weighed dried peat was transferred to muffle furnace (Thermo Scientific Thermolyne Industrial Benchtop Muffle Furnaces, Fisher Scientific, USA) at 550 °C for 12 hours, including a cooling process to 60 °C. Next, crucible cups containing ash were placed in the desiccator to gain weighed ash () upon hitting room temperature at 30 °C. The was calculated using Equation (5), (6) and expressed in percentage (%).
Following the method suggested by Santos et al. (37), the value of particle density (DS) can be obtained using pycnometer or specific gravity flask (Phunque Flask). The peat particle density value was calculated using Equation (7). Where () refers to water density (g.cm-3) at the temperature; () denotes weight of peat soil sample; () represents weight of pycnometer, peat soil, and water, while () stands for weight of pycnometer and water. The calculation of total porosity () had been based on peat particle density value using Equation (8).
Water-filled pore space () was determined by using gravitational moisture content based on dry weight () and volume of moisture content () parameters, as given in Equation (9), (10) (38). The calculated values were used to estimate , as shown in Equation (11).
The composite dry samples from soil core were crushed by mortar and pestle and passed through 2.0 mm sieve to determine their chemical properties (39). The peat pH value was determined by using a benchtop pH meter model (Sartorius Benchtop Meters: pHBasic+ Series, Fisher Scientific, USA) by adding 5.0 g of dried and sieved peat sample into 12.5 ml deionized water (soil-water ratio of 1:2.5) in a 25.0 ml glass beaker. To determine the total carbon, total nitrogen, hydrogen, sulfur and CN ratio, the samples were analyzed using the standard method of elemental analysis following ISO 13878:1998. This analysis was carried out using a CHNS analyzer (Vario MACRO cube, Elementary Analysis System, Germany).
2.4 Gas sampling, measurement, and analysis
A 0.5 L cylindrical chamber made of transparent plastic with two ports for gas exchange was inserted into the peat surface to a depth of 5.0 cm. Gas sampling, including CO2 and CH4, was allowing the chamber to reach gravimetric equilibrium with rainwater for approximately one hour. To ensure a secure seal, 500 g of ballast was placed on top of the chamber. Gas carbon emissions were measured using an automated Los Gatos Research analyzers with Off-Axis Integrated Cavity Output Spectroscopy (OA-ICOS) (Ultraportable gas analyzer model GLA132-GGA, ABB, Switzerland). Real-time analysis of the mixed gas accumulation was performed for six minutes, with each gas concentration point representing 20 seconds. The data were recorded and stored automatically in the analyzer’s data logger. To account for any disruption caused by lid installation, the first three concentration points recorded during the first minute were excluded from the analysis. The gas concentration in ppm was calculated using the ideal gas law as outlined by Marwanto et al. (14). The change in the head-space concentration over time (hour, h-1) divided by the head-space volume (L) and peat surface area covered (m2) were fitted into a linear regression (LR). The slope from LR was considered as the rate of CO2 emission or CH4 emission (+ value) or uptake (-value) (18). In this study, carbon emissions from fresh and intact peat were reported in terms of mg m-2 hr-1 and µg m-2 hr-1 rather than per gram of dry peat (33). The focus was mainly on the gas emission from the peat surface and undisturbed intact sample (34, 40, 41). Carbon emission measurements were consistently taken on a daily basis during the specified timeframe of 9 to 10 am. This consistent sampling approach was chosen to ensure accuracy and reliability in capturing and representative data throughout the study period.
To assess the relative impact of different greenhouse gas emissions on climate change, the values of possible carbon emission reductions were converted to a GWP index using Equation (12). The GWP index is a way for comparing the contribution of different greenhouse gases to global warming over a certain period, usually 100 years. It considers the energy absorption capacity of each gas and its atmospheric residence time. The GWP index uses CO2 as a reference, which has a GWP of 1 and assigns a GWP of 30 to CH4 from fossil sources (42). The results were presented in CO2-eq.
2.5 Statistical analyses
Assumptions of data normality and equality of variance were checked using Ryan-Joiner’s method (similar to Shapiro-Wilk’s method) (43, 44) and Levene’s method. The physicochemical properties of peat were analyzed using One-Way Analysis of Variance (ANOVA) for the compaction treatments and the control samples of each ecosystem. Any significant effects were further analyzed for multiple comparisons of means to the control at p ≤ 0.05 using Dunnett’s post-hoc test. For carbon emissions, compaction effects at three levels of compaction magnitudes in two incubation phases within the ecosystem were analyzed using Two-Way Analysis of Variance (ANOVA). Any significant effects were further analyzed using multiple comparisons of means at p ≤ 0.05 based on Tukey’s HSD post-hoc analysis. The correlation between each gas carbon species and the peat physicochemical properties was investigated using Pearson’s correlation moment. Significant correlations (r) were further analyzed using an R2 regression model at p ≤ 0.05, unless stated otherwise. All statistical analyses were calculated and formulated using statistical software (Minitab version 21.3.1, USA, 2022), while the graphs were plotted using graphical software (Sigmaplot 14, Systat Software Incorporation, UK, 2017).
3 Results
3.1 Comparison between targeted bulk density value with reference sample
The treatments were designed to achieve different levels of proportional compaction by volume based on the reference and control sample bulk densities. However, these treatments did not yield bulk density increments comparable to expected values (Table 1). There was no clear relationship between the proportional compaction by volume and the resulting bulk density despite low variance in the reference and control sample bulk densities used as a basis for compression treatments. Nevertheless, in most SF samples, there was an increase in bulk density where treatment was applied (with the exception of sample T20%, which exhibited a slight significance, p=0.045). This was not the case with the OP samples, where reference bulk density was in many cases higher than treatments, and again no clear proportional relationship was observed.
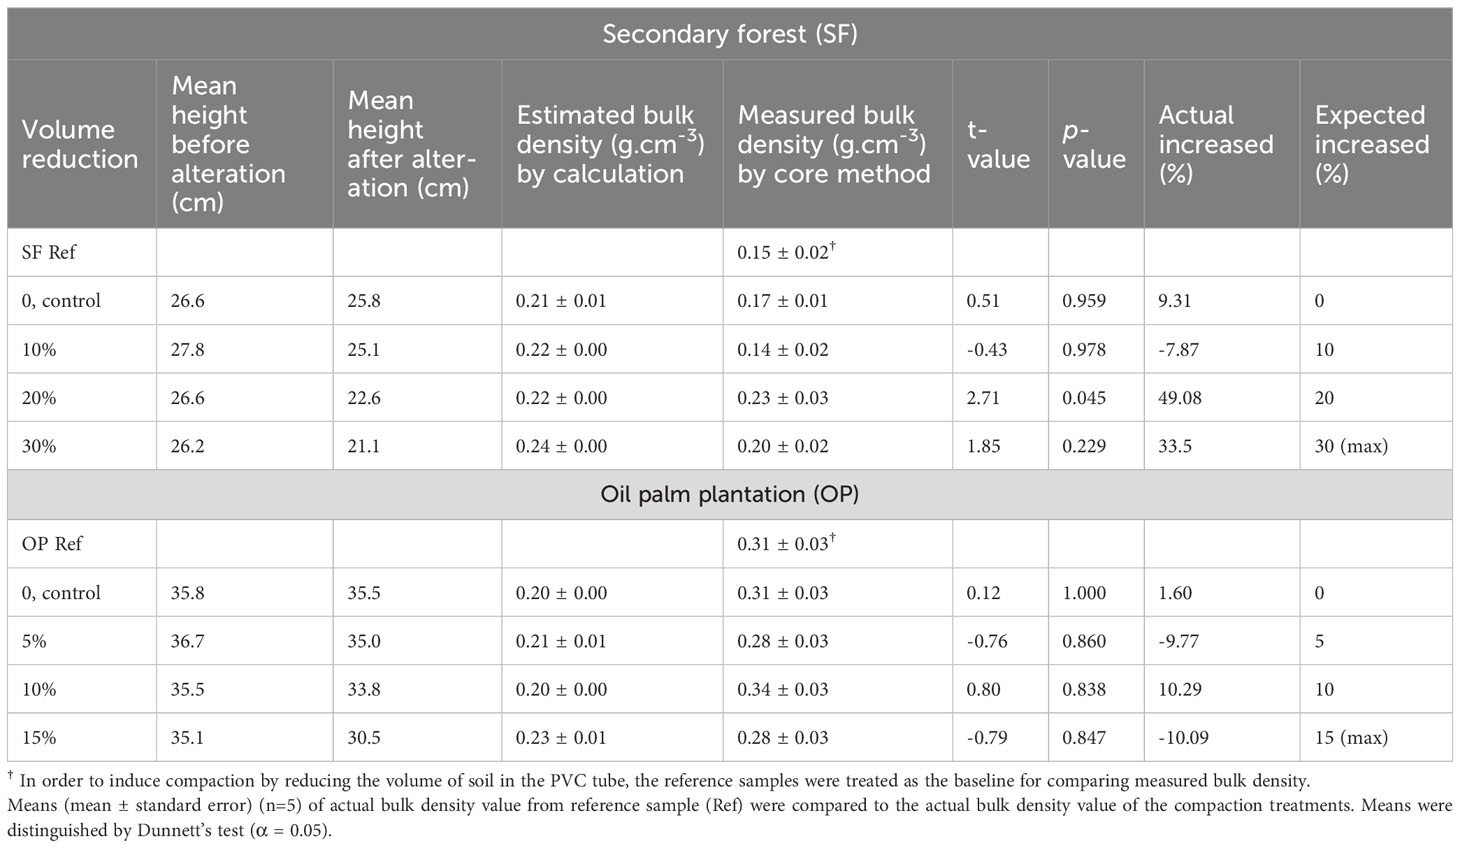
Table 1 Manipulation of bulk density value for compaction treatments based on the height of peat reference sample.
3.2 Alteration of physicochemical properties by mechanical compaction
The effects of different compaction magnitudes on the peat physicochemical properties are presented in Table 2, showing both increasing and decreasing patterns (Table 3). The physical properties of the samples from SF showed a change in the water-filled pore space and volumetric water content, particularly with the T30% compaction treatment, where the values were higher than the control by 17.92% and 15.09% respectively. However, the compaction treatments did not have a significant effect on bulk density (mean of 0.184 ± 0.012 g cm-3; p = 0.081). Furthermore, there was no impact on loss on ignition, total porosity, or gravimetric water content, with mean values of 79.64%, 88.97% and 261.8% respectively.
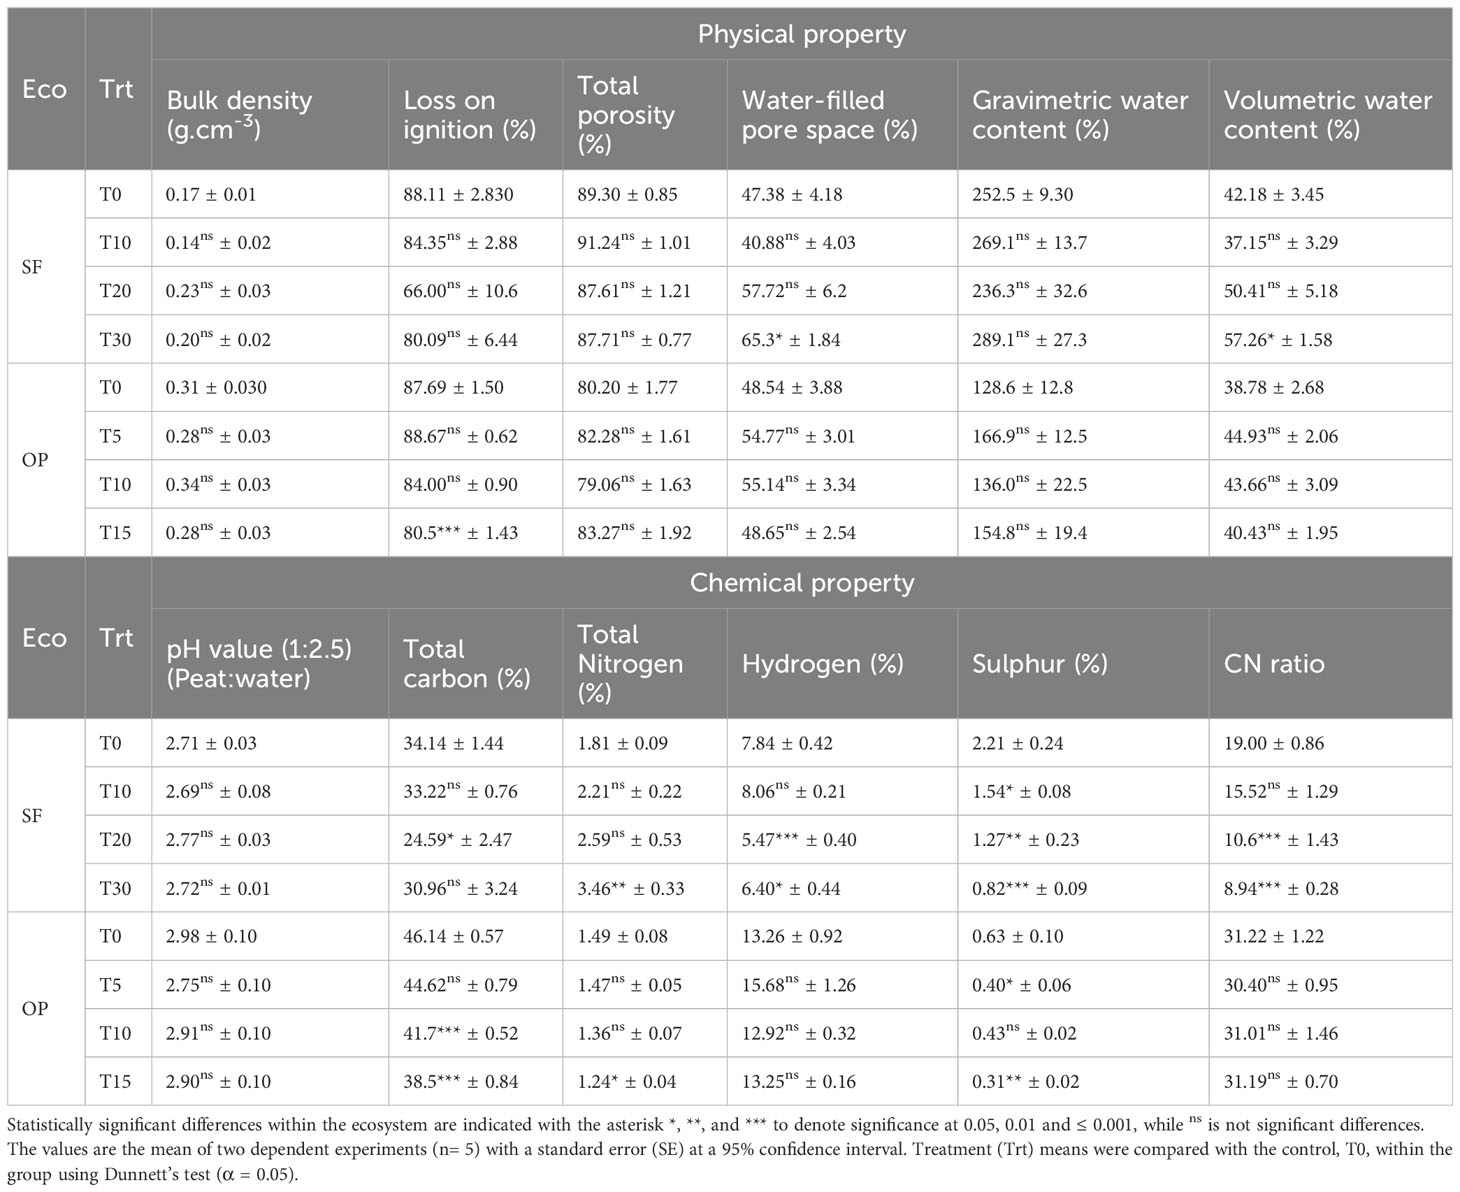
Table 2 Physicochemical properties of intact samples from compaction treatments in two ecosystems (Eco).
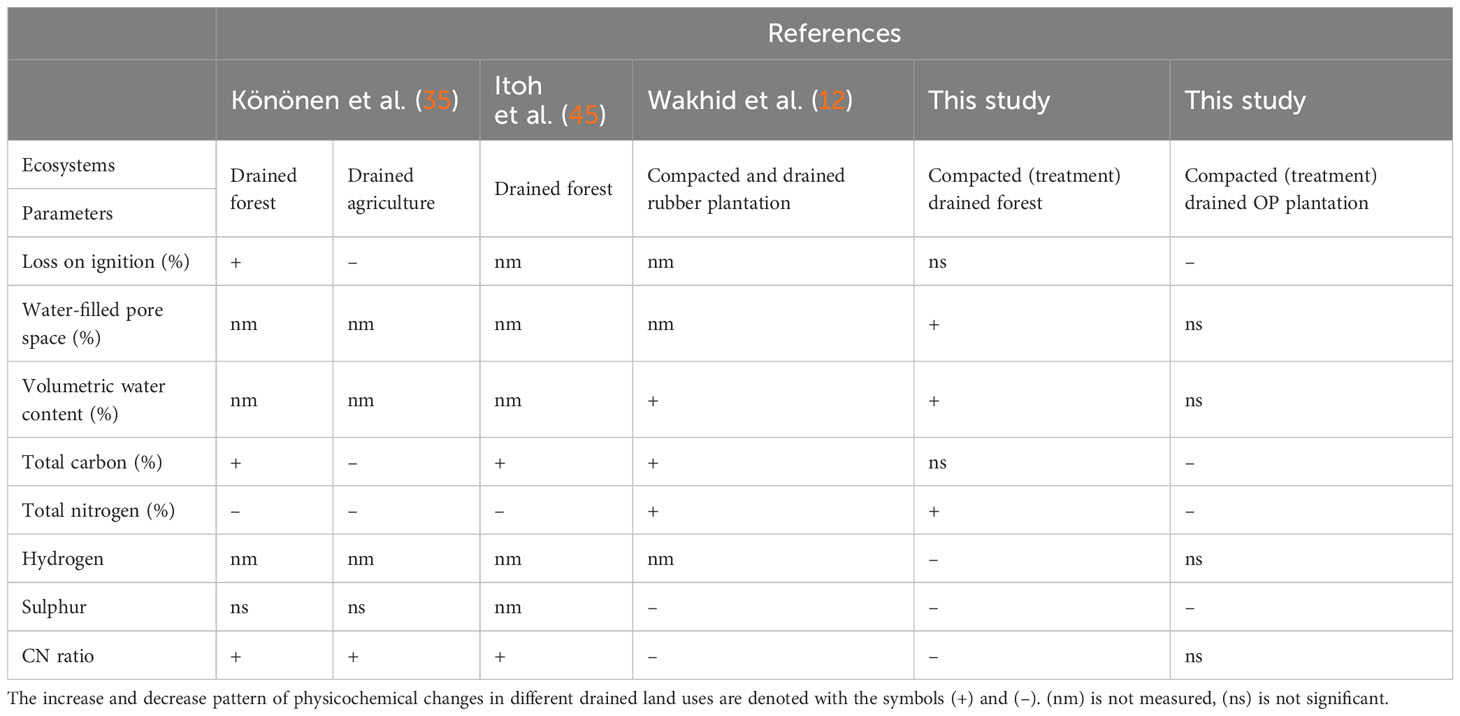
Table 3 Comparison between previous studies on significant physicochemical changes pattern of increasing and decreasing from surface to deeper peat within the range (0 to 45.0 cm) peat depth.
When considering the chemical variation with treatment, it was observed that there was no alteration to pH, which ranged from pH 2.69 to 2.77 compared to the control. Total carbon after the T20% treatment was lower by 9.6%, while no difference was observed for other treatments, with mean values ranging from 31.0% to 33.2%. The total nitrogen increased with treatment intensity, but only at T30% to 3.46%, while less intense treatments ranged from 2.21% to 2.59%. On the other hand, T20% and T30% led to reduced hydrogen concentrations, with decreases of 2.4% and 1.4% respectively. Interestingly, sulfur decreased in the following order of compaction treatments: T10% > T20% > T30%, with a mean reduction of 0.7%, 0.9% and 1.4% respectively. Similarly, the CN ratio also decreased at T20% and T30%, with mean reductions of 8.4 and 10.1, except for T10%, which had a reduction of 15.5 compared to the control value of 19.0.
The physicochemical properties of the sub-core samples from OP showed a change in loss on ignition, total carbon, nitrogen, and sulfur because of compaction treatments. A decrease in loss on ignition of 7.2% was observed at T15% compared to the control. Total carbon decreased after the T10% and T15% treatments by 4.4% and 7.7% respectively. Total nitrogen was also decreased after the T15% treatment, with a mean reduction of 0.25%. Sulfur content decreased at T5% and T15% treatments, with mean reductions of 0.2% and 0.3%, respectively. Conversely, bulk density, total porosity, water-filled pore space, gravimetric water content, volumetric water content, pH, hydrogen, and CN ratio did not show significant changes because of artificial compaction, with mean values of 0.30 g cm-3, 81.2%, 51.8%, 146.5%, 42.0%, 2.89, 13.8% and 31.0% respectively.
3.3 CO2 and CH4 emissions due to artificial compaction in absence of groundwater
CO2 emissions from the intact samples taken from the SF and OP ecosystems between compaction phases (pre- and post-compaction) are presented in Figures 3A, B. Changes in gas emission patterns can be observed between the two phases, especially in the SF samples. On the other hand, the OP samples consistently exhibited uneven emissions throughout the experiment. The effect of peat compaction at different phases on the cumulative CO2 emissions from both ecosystems is presented in Figures 3C, D. During the pre-compaction phase, the intact samples from SF and OP had a mean cumulative CO2 emission of 276.3 and 226.4 mg m-2 hr-1 respectively. In the post-compaction phase, the intact SF and OP samples emitted 199.4 and 204.6 mg m-2 hr-1 respectively. By comparing the pre-compaction and post-compaction phases within each treatment of the SF intact samples, the highest reduction in CO2 emissions was observed at T30%, followed by T10% and T20% with a decrease of 115.9, 84.4, and 79.7 mg m-2 hr-1 respectively. The slightly significant difference in bulk density observed after manipulation in T20% may influence the effectiveness of this CO2 reduction (see Table 1). The control sample, however, exhibited no changes, with a mean ranging from 251.5 to 279.1 mg m-2 hr-1. Meanwhile, the OP samples showed comparable means ranging from 195.1 to 265.85 mg m-2 hr-1.
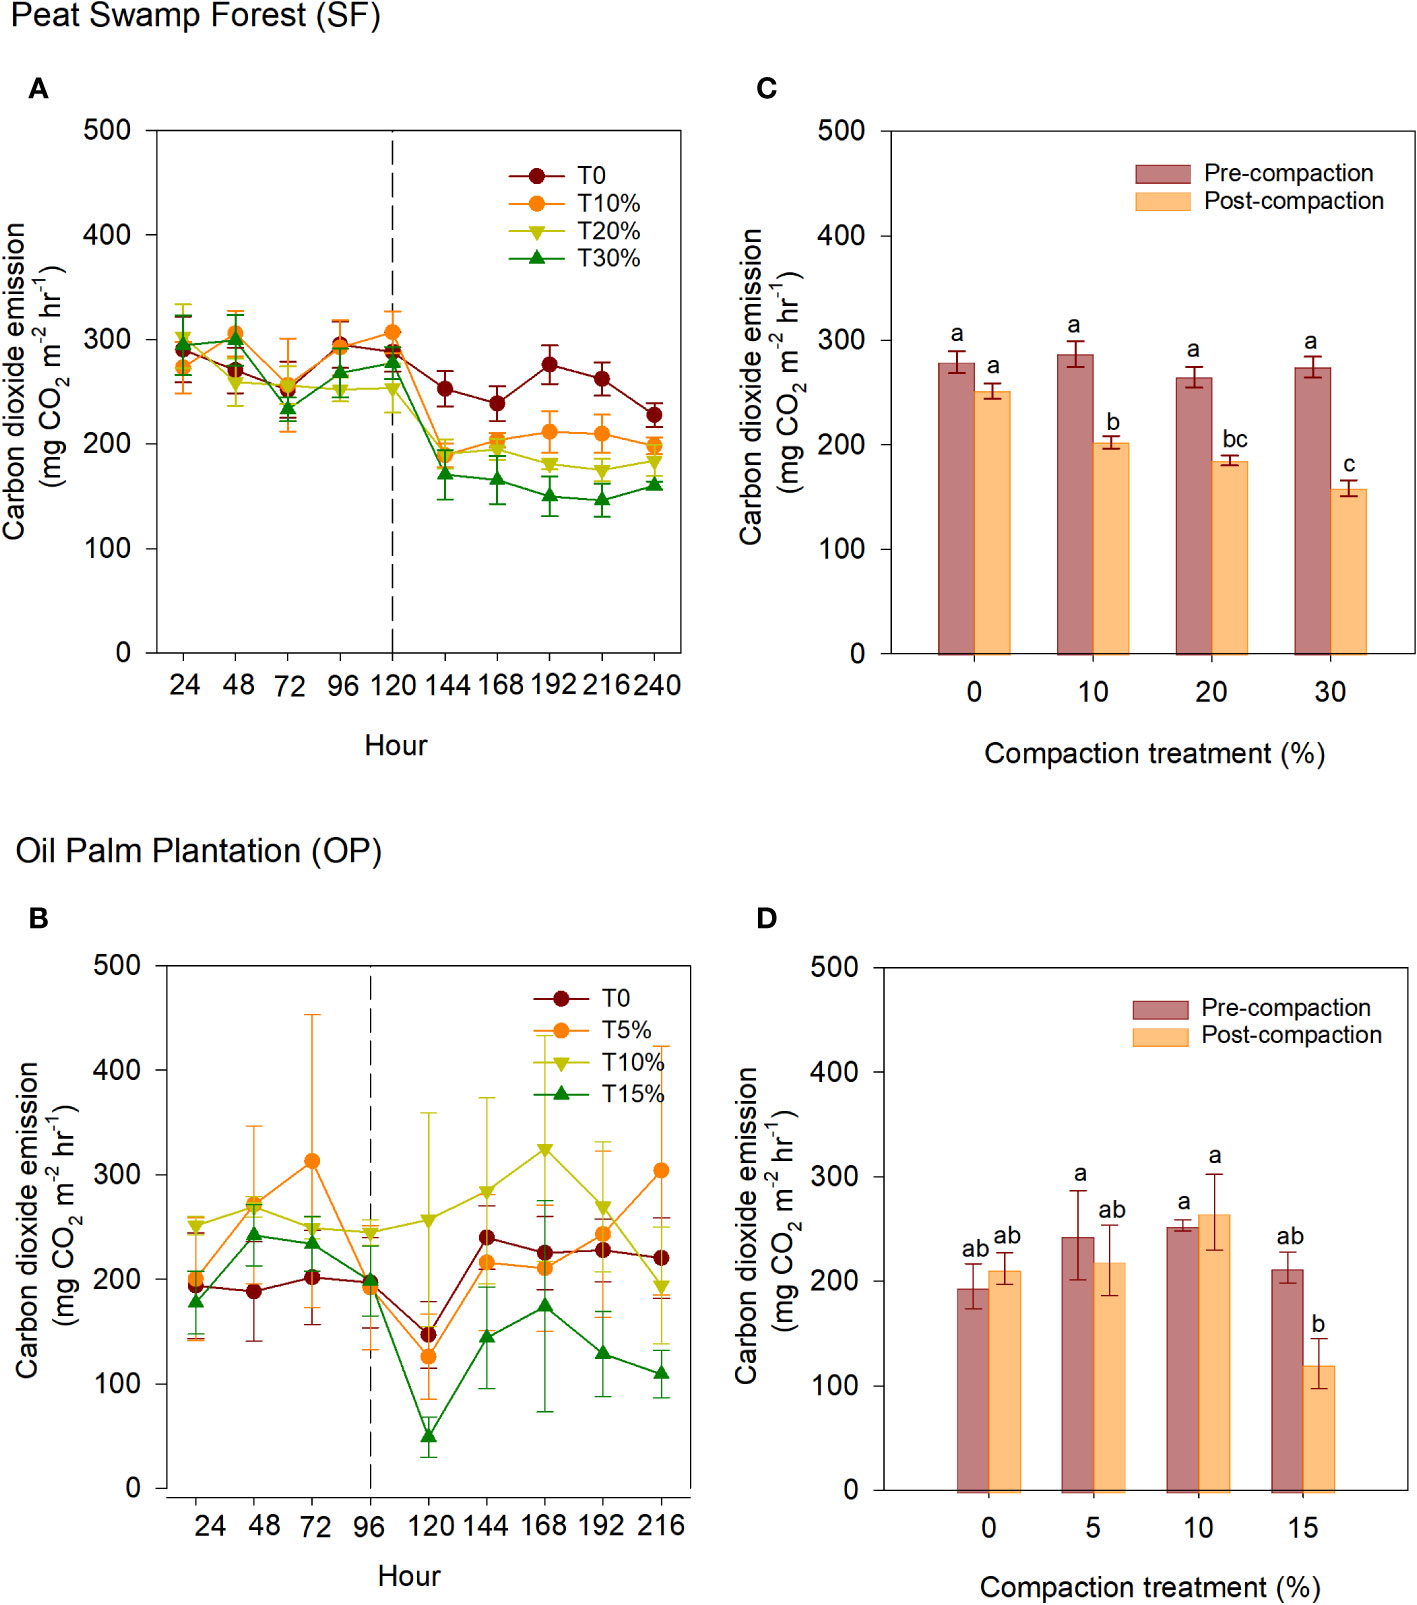
Figure 3 CO2 emissions between compaction treatments and phases within intact samples of (A) SF and (B) OP. The middle-dashed line within the ecosystems indicates that compaction was applied. Meanwhile, cumulative CO2 emissions of intact samples from: (C) SF and (D) OP in different phases; pre- and post-artificial compaction. The error bars indicate the standard error of means (n=5). The different letters indicate significant differences between treatments within different phases. The means were separated using Tukey’s HSD post-hoc test (α = 0.05).
The CH4 uptakes of the intact samples obtained from the SF and OP ecosystems between phases are presented in Figures 4A, B. Like CO2, significant changes in CH4 uptakes can be observed in the SF samples, while the OP sample exhibited consistent CH4 uptake reduction until the end of the experiment. The effect of peat soil compaction at different phases on the cumulative CH4 uptakes from both ecosystems is presented in Figures 4C, D. During the pre-compaction phase, the intact samples from SF and OP had a cumulative mean CH4 uptake reduction of −16.6 and −3.6 µg m-2 hr-1 respectively. In the post-compaction phase, the intact SF and OP samples exhibited CH4 uptakes reduction of −7.2 and -1.0 µg m-2 hr-1 respectively. In the SF intact samples, all compaction treatments led to reduced CH4 uptakes, as shown in Figure 4A. Compared to the pre-compaction phase, the highest reduction in CH4 uptakes was observed in the 30% treatment, followed by 20% and 10% with a mean reduction of 18.7, 10.7, and 8.3 µg m-2 hr-1 respectively. The control sample (0%) showed no changes between the two phases, with a mean ranging from −13.0 to −13.1 µg m-2 hr-1. In contrast to the SF samples, intact samples from OP exhibited relatively consistent means ranging from −7.3 to 0.3 µg m-2 hr-1.
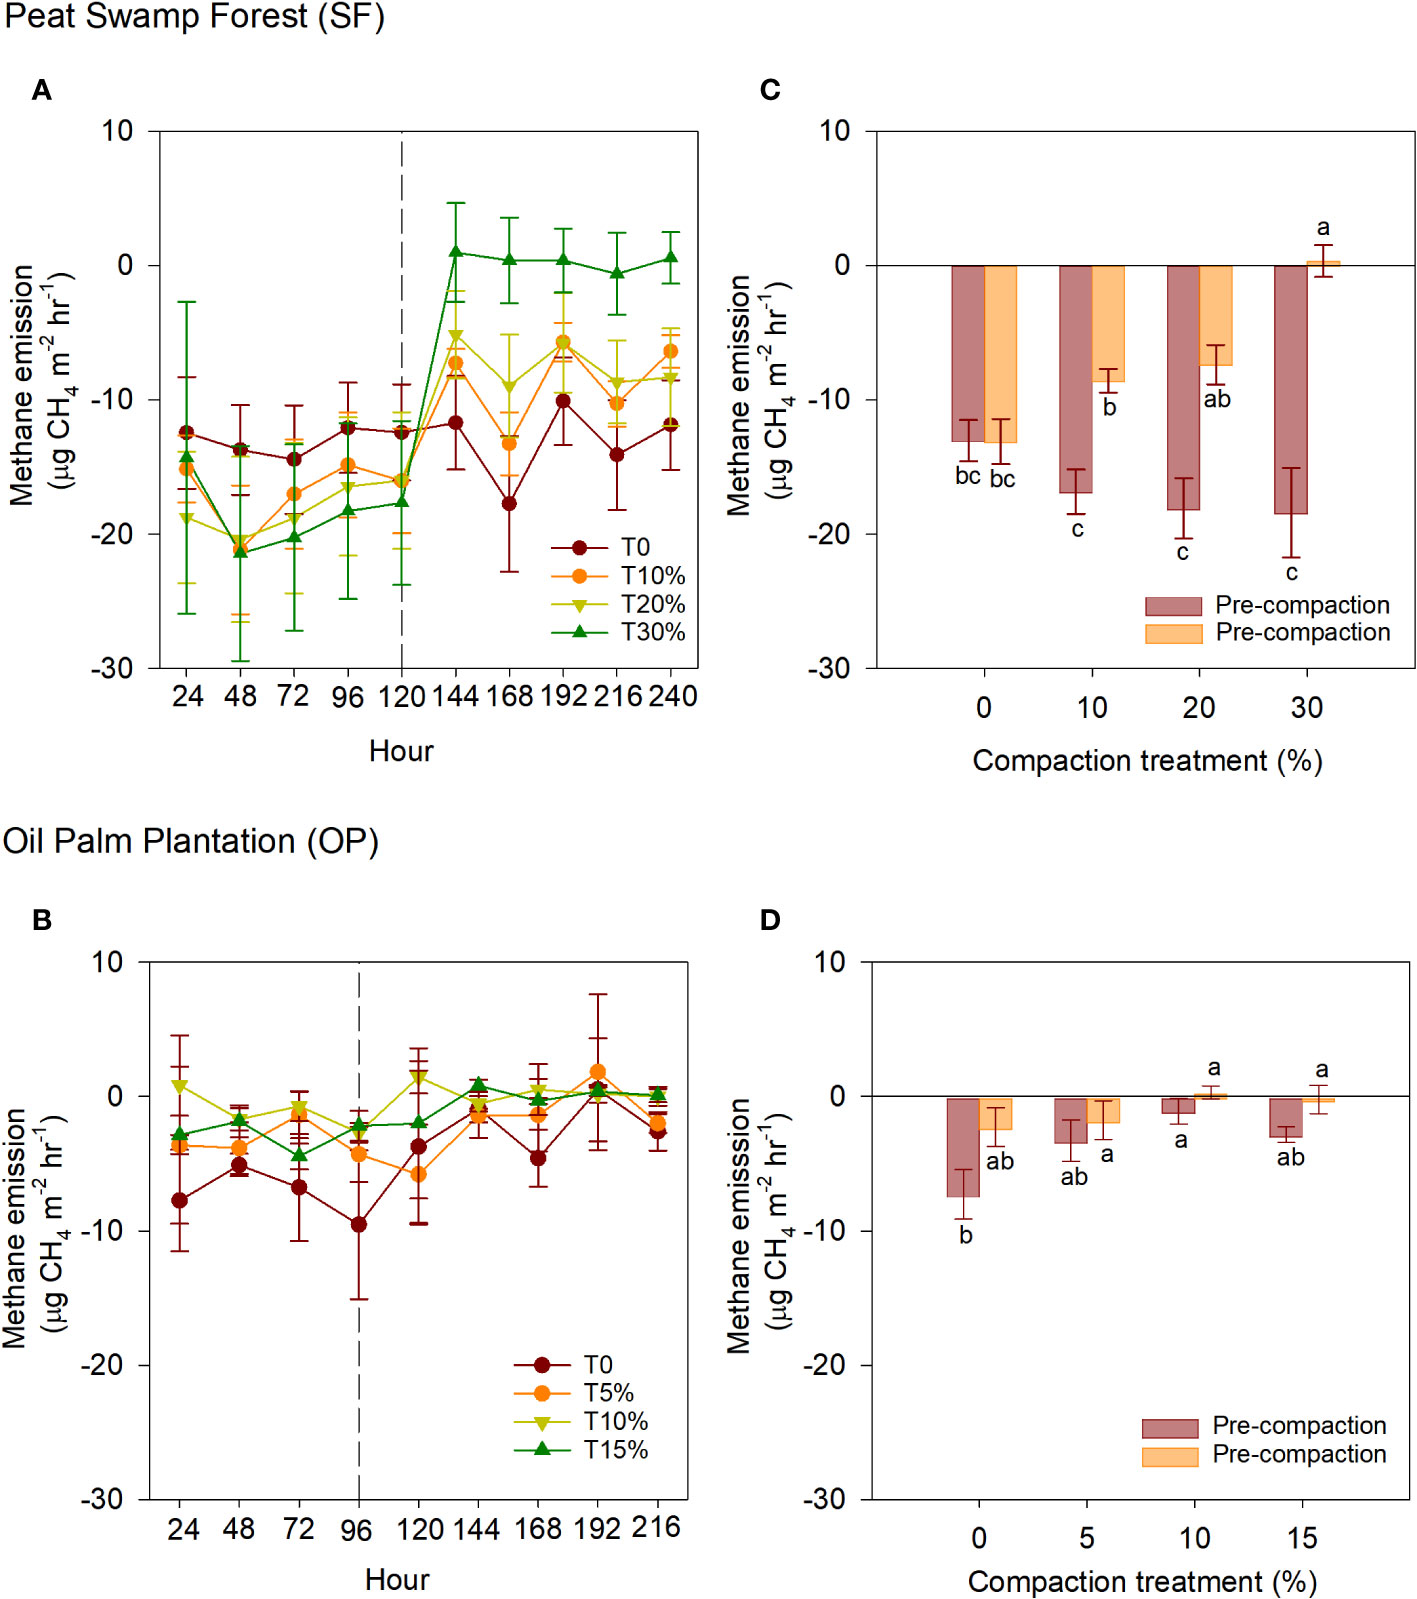
Figure 4 CH4 emissions between compaction treatments and phases within intact samples of (A) SF and (B) OP. The middle-dashed line within the ecosystems indicates that compaction was applied. Meanwhile, cumulative CH4 emissions of intact samples from: (C) SF and (D) OP in different phases; pre- and post-artificial compaction. The error bars indicate the standard error of means (n=5). The different letters indicate significant differences between treatments within different phases. The means were separated using Tukey’s HSD post-hoc test (α = 0.05).
In the SF samples, the CO2 emissions decreased by an average of 34% (ranging from 275.4 to 182.0 mg m-2 hr-1) and the CH4 uptakes reduced by an average of 70% (ranging from -17.8 to -5.2 µg m-2 hr-1) for T10%, T20% and T30% respectively. This translates to a reduction average percentage ratio of approximately 1:2 (CO2 emission: CH4 uptake) compared to the initial emissions with an average alteration of height reduction of approximately 3.93 cm or 0.2 g.cm-3 due to compaction. Although the CH4 uptake reduce because of compaction by half to one-fold compared to pre-compaction, when calculated together with CO2 emission in terms of global warming potential (GWP), the CH4 uptake reduction is negligible (-4.0 to 0.18 g C m-2 yr-1). These results were similar to those reported by Sakabe et al. (46) in an ecosystem-scale of CH4 (-3.7 to 4.0 g C m−2 yr−1) during an incubation experiment in heavily disturbed peat swamp forests in Indonesia. Overall, in terms of GWP, the effect of CO2-eq emissions could be observed in T20% and T30%, which resulted in a reduction of 22 to 33% (4.5 to 6.7 t CO2-eq ha-1 yr-1) compared to the control (Figure 5).
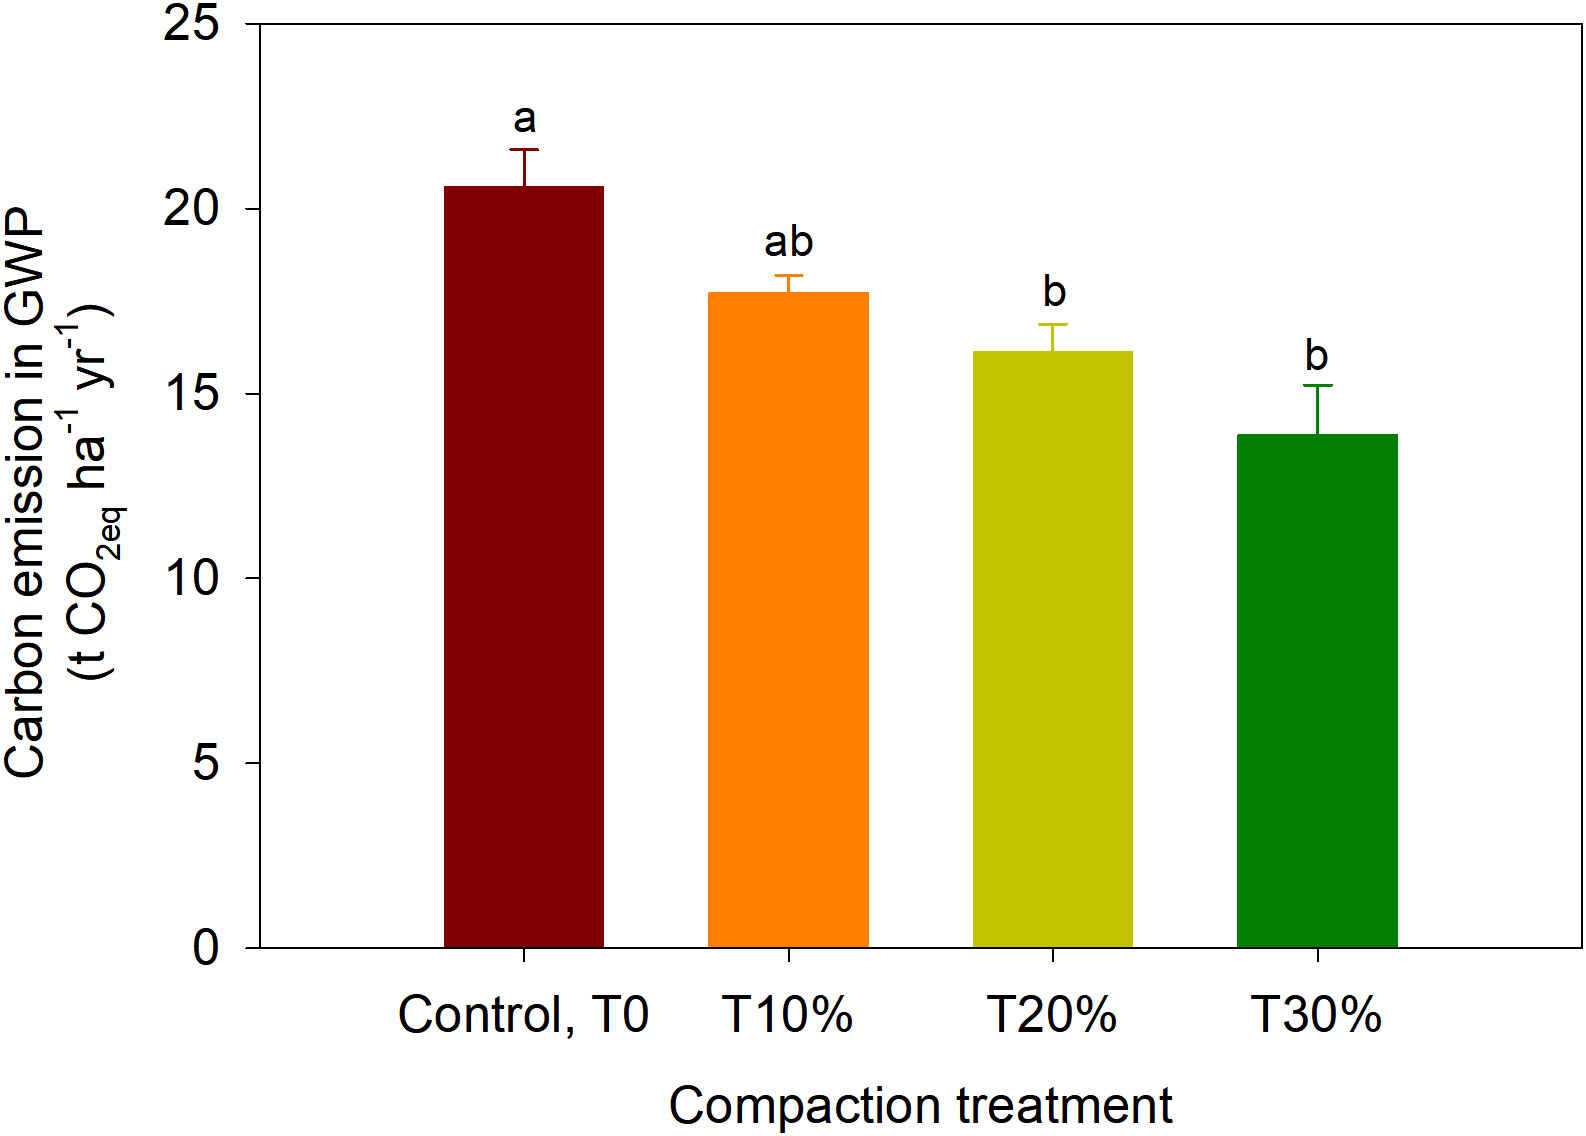
Figure 5 The Global Warming Potential (GWP) of studied intact samples from secondary peat swamp forest. The error bars indicate the standard error of means (n =5). The different letters indicate significant differences between treatments within different phases. The means were separated using Tukey’s HSD post-hoc test (α = 0.05).
3.4 Correlation between CO2 and CH4 emissions with physicochemical properties
The average emissions over the 120-hour period were used to analyze the relationship between peat physicochemical properties and carbon gas emissions during the post-compaction phase. Pearson’s correlation coefficient (r) was calculated to assess the correlation between carbon emissions and peat physicochemical properties for both SF and OP samples and the results are summarized in Table 4. In the SF samples, the results revealed that CO2 emissions (Figure 6) were positively correlated with sulfur (p = 0.003) and CN ratio (p< 0.001), while they were negatively correlated with water-filled pores space (p = 0.035), gravimetric water content (p = 0.048), volumetric water content (p = 0.023) and total nitrogen (p = 0.001). Meanwhile, CH4 uptakes (Figure 7) were inversely correlated with CO2 but positively correlated with water-filled pores space (p = 0.003), gravimetric water content (p = 0.002), volumetric water content (p = 0.001) and total nitrogen (p< 0.001). They were also negatively correlated with sulfur (p = 0.042) and CN ratio (p = 0.001). In contrast, the CO2 emissions for the OP samples exhibited a positive correlation with total nitrogen (p = 0.047) and a negative correlation with the CN ratio (p = 0.043) (Figure 8). In contrast, no significant correlation was found between CH4 uptake and the physicochemical properties of the OP intact samples.
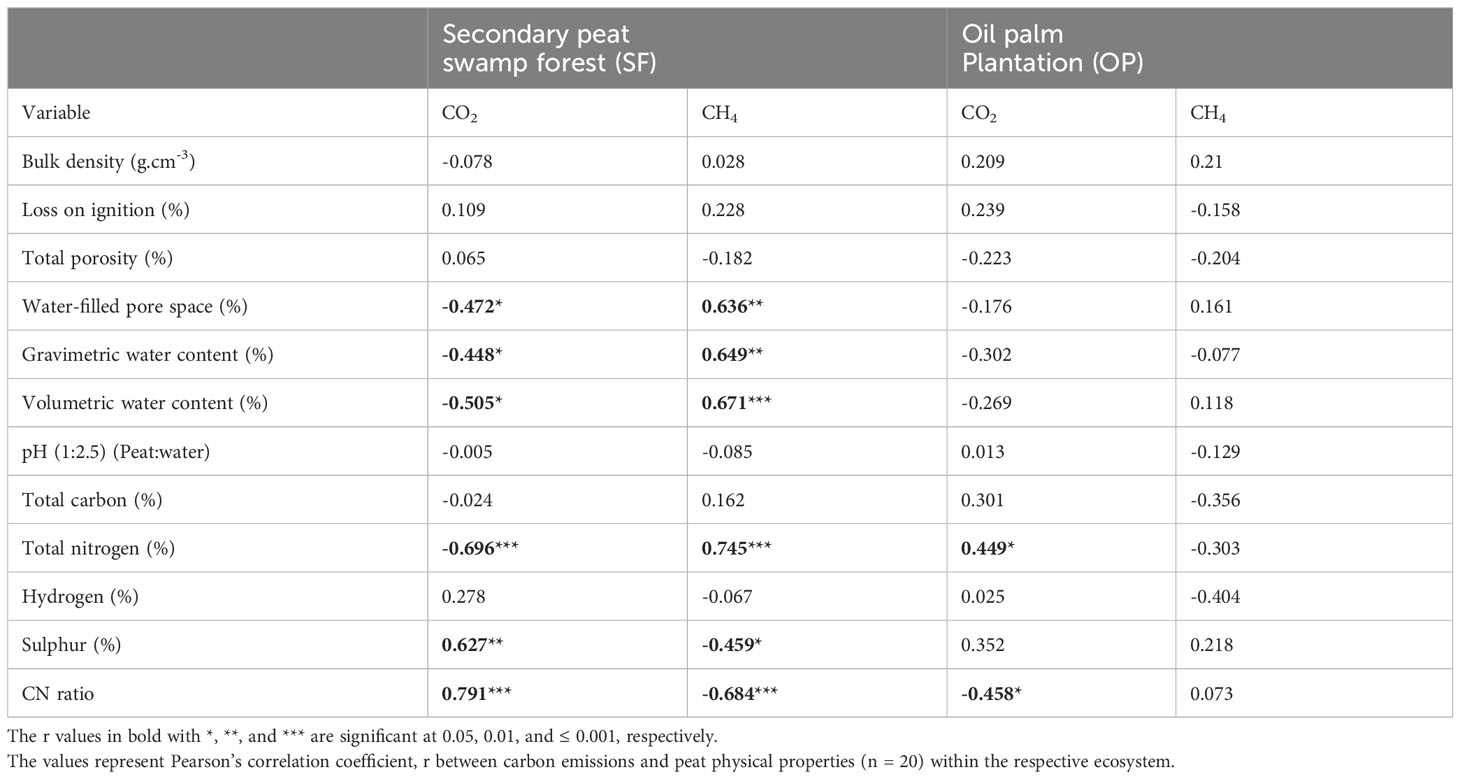
Table 4 Pearson’s correlation moment product between CO2 and CH4 emissions with some of the physicochemical parameters used in this experiment.
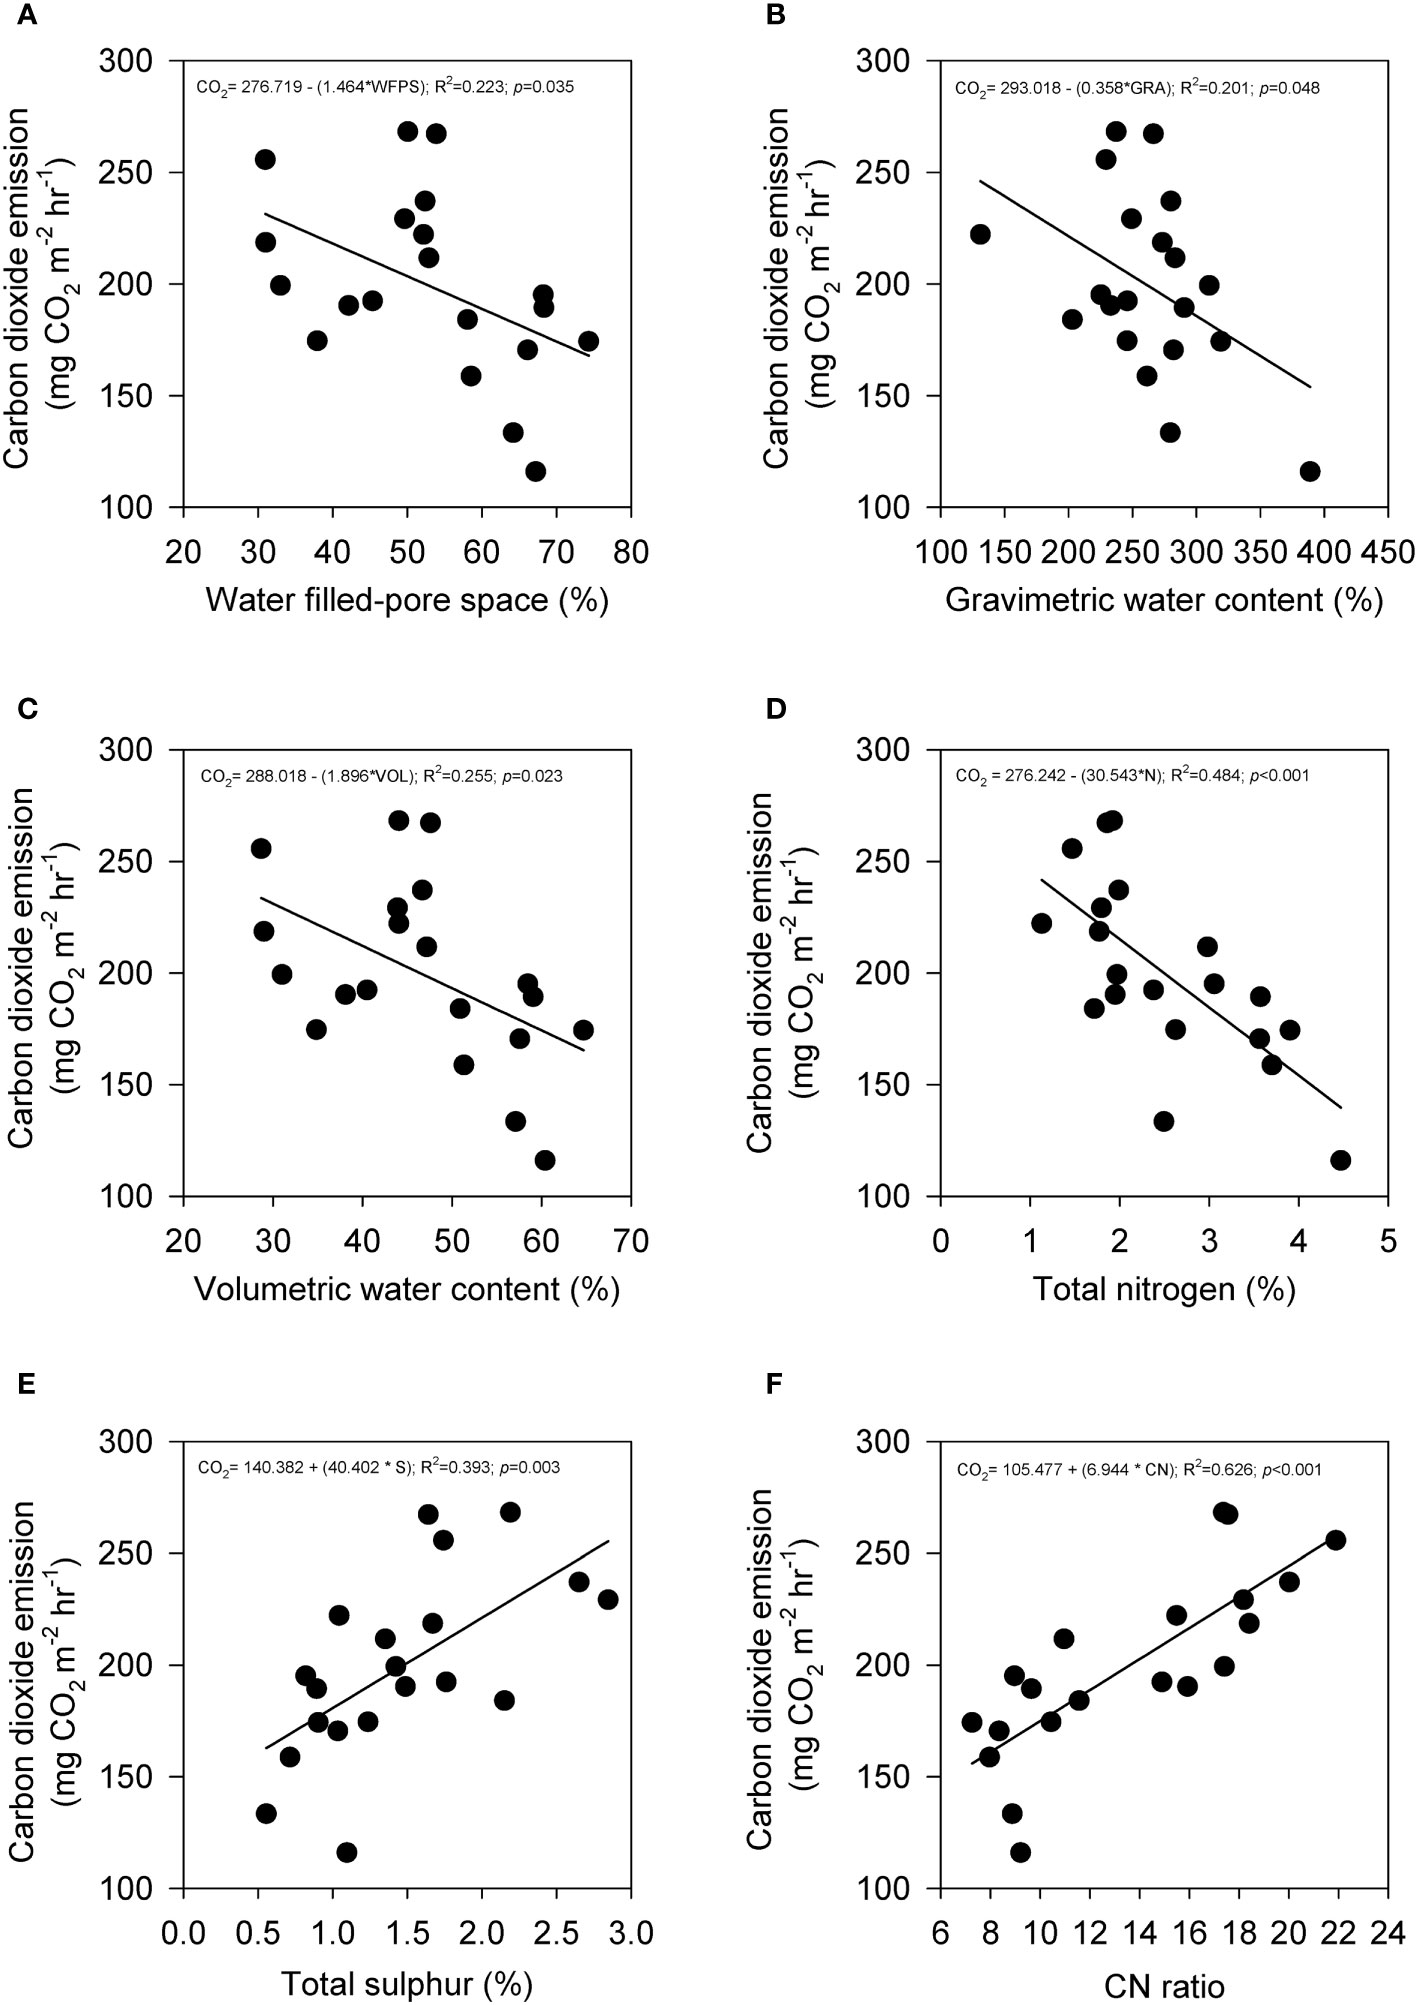
Figure 6 The relationship between CO2 emission with (A) water-filled pore space, (B) gravimetric water content, (C) volumetric water content, (D) total nitrogen, (E) sulfur, and (F) CN ratio from secondary peat swamp forest intact samples that underwent mechanical compaction treatment. Total points are (n=20) and solid line indicates regression line.
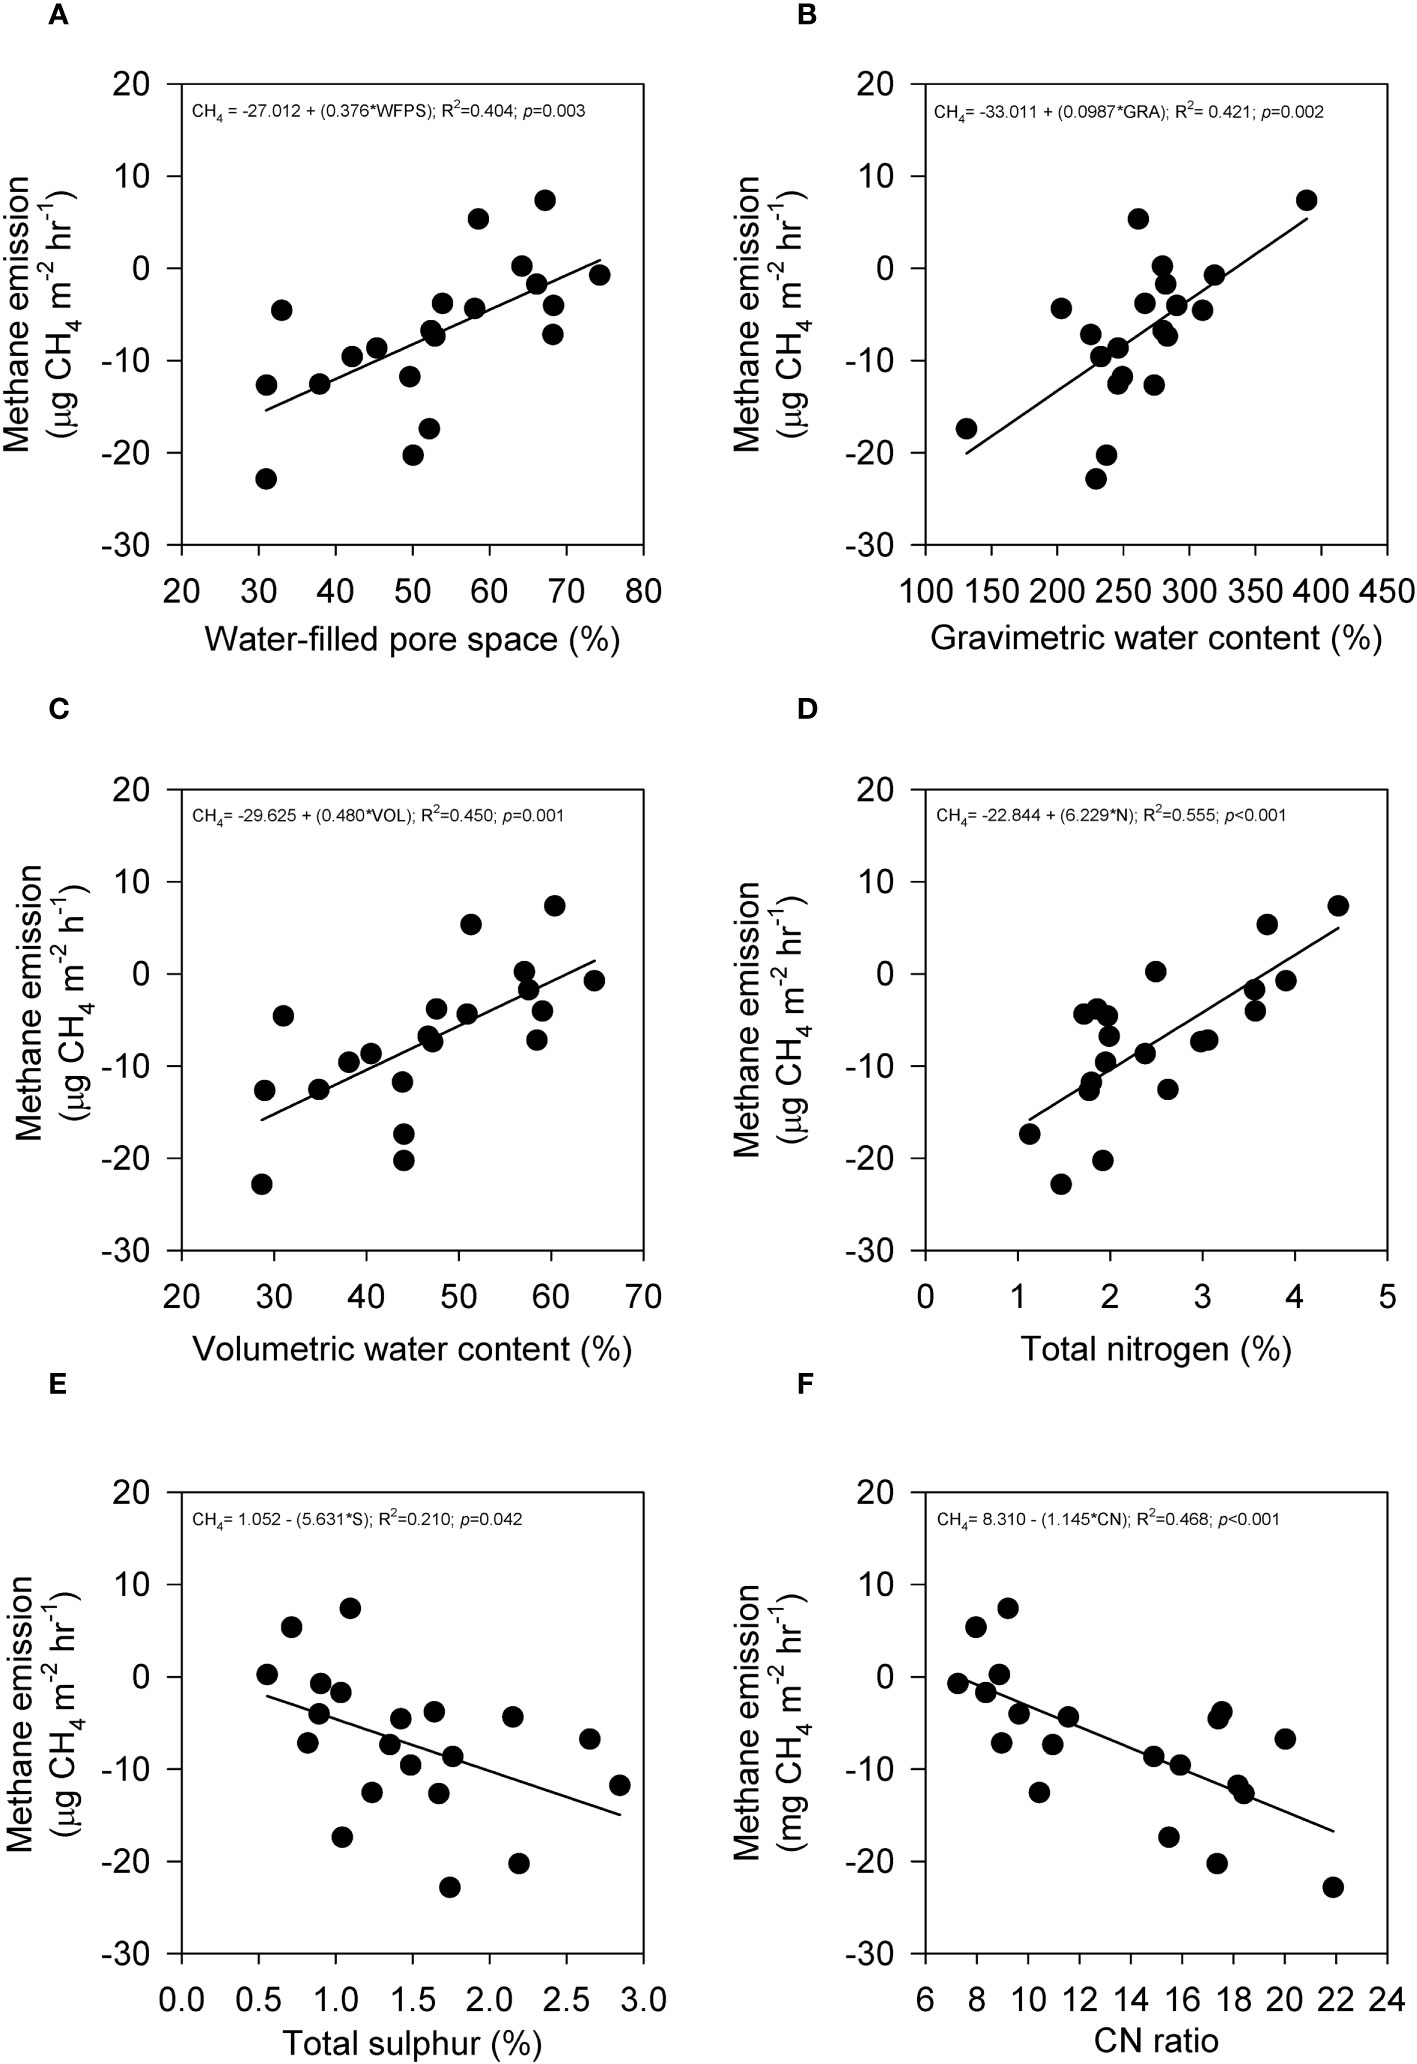
Figure 7 The relationship between CH4 emission with (A) water-filled pore space, (B) gravimetric water content, (C) volumetric water content, (D) total nitrogen, (E) sulfur, and (F) CN ratio from secondary peat swamp forest intact samples that underwent mechanical compaction treatment. Total points are (n=20) and solid line indicates regression line.
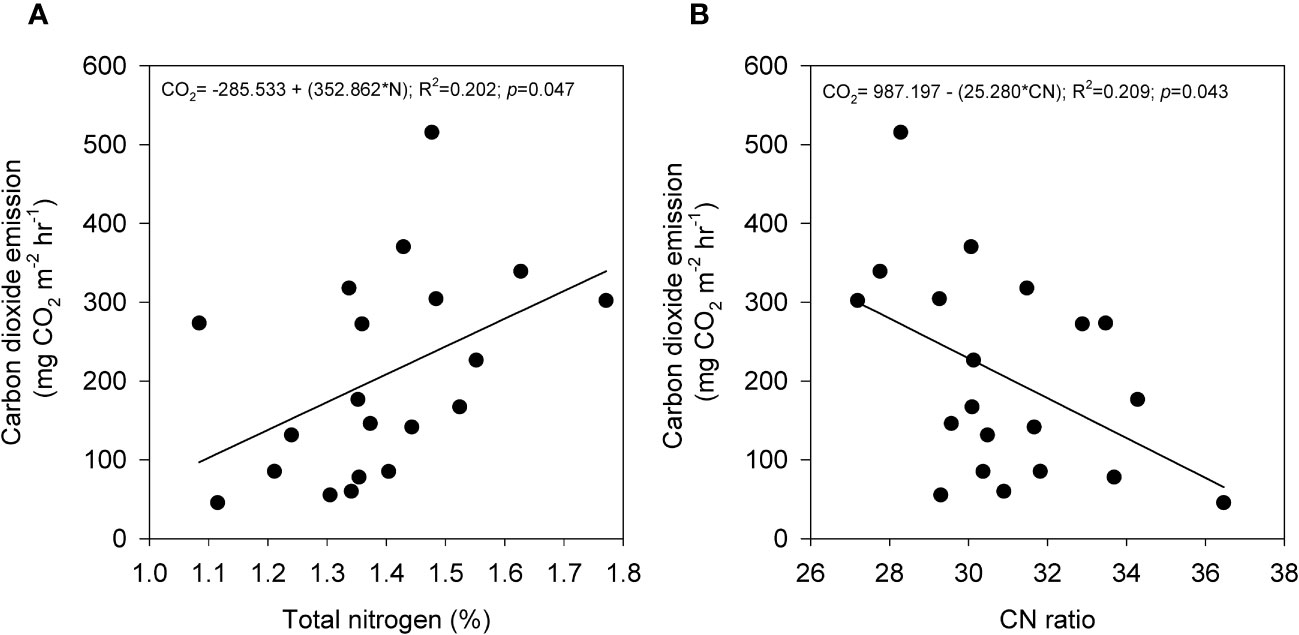
Figure 8 The relationship between CO2 emission with (A) total nitrogen and (B) CN ratio from oil palm plantation intact samples that underwent mechanical compaction treatment. Total points are (n=20) and solid line indicates regression line.
4 Discussion
4.1 Limitations
The bulk density measurements from the reference cylinder samples in this experiment exhibited a one-fold increase, particularly in the reference samples from oil palm plantation compared to previous studies (38, 47, 48). It was likely that the process of inserting the cylinder had an impact on the bulk density measurements due to peat friction with the cylinder edge. Additionally, this could be due to the irreversible drying effect because the water correction method using gravimetric water content appeared to be less effective for the oil palm plantation samples compared to the secondary peat swamp forest samples. The overall CO2 and CH4 emissions for secondary peat swamp forest and oil palm plantation, with mean values of 238.3 and 214.3 mg m-2 hr-1 and −48.4 to 59.95 and −3.94 to 3.63 µg m-2 hr-1 respectively, were significantly comparable to the values reported in field measurements (49, 50).
The experiment was conducted for a duration of 240 hours and consistent emissions of CO2 and CH4 (n = 380) were observed until hour 216, after which they began to decline. This decline suggests that the extraction of the sample from its original condition may have caused moisture losses, leading to peat shrinkage (30, 51, 52), microbial inactivation or stress due to the new environment (53), nutrient depletion (54, 55) and inconsistent temperature (56, 57). Although there was no specific time frame for how long an intact peat sample would continue to produce carbon emissions during incubation, the focus of this study was to investigate the geophysical processes of the compaction mechanism on carbon gas emissions. Nevertheless, this frontier study opens multiple avenues for further exploration. Future research should consider a longer observational period to fully capture the timeline of carbon emissions from intact peat samples treated with compaction efforts.
4.2 Translocation of physicochemical properties from the peat surface to deeper horizon
The hypothesis in this study, which stated that physicochemical properties will change due to compaction in the absence of the water table interference, was accepted for both samples from different ecosystems. Profound physicochemical changes were mainly observed in the intact samples from the secondary peat swamp forest ecosystems. This was because of the more porous conditions and higher compressibility of the peat in secondary peat swamp forest, which was indicative of a higher labile carbon content resulting from the continuous supply of labile carbon sources from the surrounding trees in the peat forest samples (58). In contrast, the matured oil palm plantation samples (38) were more exposed to recalcitrant carbon on the peat surface (3, 59). Additionally, the high compressibility observed in the secondary peat swamp forest samples is also associated with the vertical movement of the water table level and the rearrangement of pore structures due to uncontrolled groundwater levels, particularly in less drained forest systems. This can result in the formation of distinct layers with varying levels of decomposition (30). On the other hand, in a drained and controlled system such as an oil palm plantation, the groundwater level is controlled by existing water gate surrounding the plantation. In general, the water level is controlled within the range of 40 cm to 60 cm from the peat surface to ensure the survival of oil palm that is intolerant to prolonged flooding conditions. Thus, the peat in the advanced decomposition stage in the oil palm plantation is predominantly found at the surface, alongside a lack of labile carbon sources within the plantation.
The usage of bulk density as an index of compactness was relatively unrepresentative of the magnitude of compression induced on tropical peat. However, considering the small variance in bulk density observed between the reference and control samples, it was unlikely that the experimental samples, which were collected from the same location, would have significantly greater variability in bulk density. Therefore, the ineffectiveness of compression effort in controlling bulk density is a significant finding for management purposes. However, it is important to consider which other physiochemical variables are likely to have affected emissions according to the treatment. The observed patterns of increasing and decreasing parameters, including water-filled pore space, volumetric water content, total carbon, nitrogen, hydrogen, sulfur, and CN ratio in the secondary peat swamp forest intact samples as well as loss on ignition, total carbon, nitrogen, and sulfur in the oil palm plantation sample, varied according to the treatments and were specific to the ecosystem origin.
Interestingly, induced compaction led to changes in all physicochemical properties of the secondary peat swamp forest samples. When considering the 0 to 10 cm soil physiochemistry in relation to the depth of compaction within the cylinder (as shown in Figure 2A), it was observed that samples compressed to the greatest depth exhibited decreasing values for CN ratio and total nitrogen at the new 0 to 10 cm horizon. These results suggest that the higher nitrogen content present on the peat surface was translocated downwards towards the deeper peat horizon because of induced compaction. A higher CN ratio (generally above 20) is normally associated with organic matter from vascular land plants, whereas lower CN ratios suggest wetter conditions within the range of water table fluctuation (60). These findings were also reflected by the volumetric water content and water-filled pore space observed in the deeper peat layer.
The findings of this study aligned with the results reported by Wakhid et al. (12), who observed a significant decreasing pattern in physicochemical properties such as sulfur and total nitrogen in compacted peat during the establishment of a rubber plantation in Central Kalimantan, Indonesia at a water table level of 1.0 m. Hence, based on the comparison outlined in Table 3, it can be inferred that mechanical compaction may serve as a potential mechanism for shifting surface peat with less advanced decomposition to a deeper horizon characterized by more advanced decomposition, particularly under severely low water table level conditions. This shifting process could also lead to the formation of a new admixture ratio resulting from the accumulation of different stages of decomposition in the peat horizons (30, 61, 62). For example, the CN ratio in this study exhibited a decrease consistent with the treatment in SF.
The higher starting bulk densities observed in the oil palm plantation samples (as evident from the control and reference samples) could likely be attributed to periodic drainage, which leads to shrinkage. Shrinkage indicates the presence of constricted pores initially (30) and may have resulted in ineffective mechanical compaction owing to low compressibility (Figure 2B). The high carbon content observed in the oil palm plantation intact samples (i.e., 46%) supported this assumption, and it was believed to be associated with intensive agricultural inputs since 1978, leading to the exposure of recalcitrant carbon (3). The significant changes in the pattern of physicochemical properties such as loss on ignition, total carbon, nitrogen, and CN ratio resemble the characteristics of drained peat in agricultural land.
4.3 New admixture of peat potentially controls carbon emissions in the absence of groundwater
The previous finding showed profound physicochemical changes in the secondary peat swamp forest samples. Therefore, the emission of CO2 and the uptake reduction of CH4 from the intact samples obtained from this ecosystem could be due to the compression between young and old peat, which resulted in a new admixture where availability of surface labile carbon was reduced. The inverse emission patterns corroborate the results of several studies, which measured the same gas species under laboratory conditions with depth treatments (33, 63).
Nevertheless, it is suspected that this carbon emission reduction will be temporary since peat with fresh labile carbon will recover immediately after the water table rises and remains at 40.0 cm to 60.0 below the peat surface. Consequently, the CO2 emission reduction due to the consolidation of peat with different decomposition degrees will be ineffective due to this incompressible condition. A similar experiment was conducted by Novara et al. (64) on the effect of mineral soil compaction and rainfall. They noted that when the compressed soil was repaired due to raindrops, it resulted in inefficient CO2 emissions as the aggregates broke down, leading to the exposure of encapsulated organic carbon. This finding was also in agreement with Wakhid et al. (12), who found that rainfall can induce momentary CO2 emissions in compacted peat in rubber plantations, thereby confounding groundwater level fluctuation that was a major predictor for peat decomposition. Indeed, the production of CO2, which is known as the birch effect (65) or the impulsive response to carbon emissions in the form of CO2 and CH4 under physicochemical antagonistic recovery, was not observed and should be the focus of future research.
As mentioned above, the changes reflect the admixture of different peat layers, which correspond to the stratified water content and decomposition status (30, 66). This is further supported by the relationships observed between water content (water-filled pore space, gravimetric water content and volumetric water content) and decomposition indicators (total nitrogen, sulfur, and CN ratio) in relation to CO2 (Figure 4) and CH4 (Figure 5). In the deeper soil layers, the pores become significantly smaller (67) and less interconnected due to the collapse of vascular plant debris and the development of a horizontal laminar structure, resulting in restricted flow and increased tortuosity (30). Consequently, a new micro-niche environment is established near the peat surface, which is characterized by limited oxygen availability, enhanced water retention and substrate enrichment (31, 68).
Despite the intact oil palm plantation samples showing no difference in carbon emissions due to compaction, CO2 exhibited a positive relationship with total nitrogen and a negative relationship with the CN ratio (Figure 8), which opposes the same variable relationship of the secondary peat swamp forest intact samples. As discussed previously, the induced artificial compaction at oil palm plantation was unsuccessful in merging decomposition stages due to a large composition of inert carbon being exposed to the peat surface (59). Peat in an advanced decomposition state has a more stable structure (3), a more confined and restricted pore volume due to the collapsed anisotropic structure (30), and a higher lignin composition (38), making it invulnerable to mechanical compaction. Therefore, it is suggested that proposals to undertake mechanical compaction of already drained peatlands (10) would be both ineffective in altering emissions and would make very little difference to peat structure. As such, it would be unlikely to have any impact on the ignitability of drained peatlands and would be ineffective as an ‘after-the-fact’ management strategy for drained peatlands.
5 Conclusion
One of the effects of soil compaction is the translocation of physicochemical properties from the soil surface to deeper horizons. This means that the substances and properties normally found in the upper soil layers are moved downwards due to compaction forces, resulting in a mixing of soil constituents in the lower layers. Partial agreement was expressed regarding the fact that compaction, which occurred during the lowering of the water table and self-subsidence up to 1.0 meter, could change the physicochemical properties of peat. However, it is important to note that these changes are dependent on extremely low groundwater levels, and the peatland must remain undisturbed for a certain period to allow for compressibility due to the presence of fresh labile carbon. Subsequently, it was observed that CO2 levels decreased by 34% from the peat surface, while CH4 levels increased by 70%, resulting in an inverse percentage ratio of approximately 1:2. This study also observed increased water content parameters and decomposition proxies in young peat (secondary peat swamp forest intact samples) due to compaction without the presence of groundwater interference.
Considering these findings, the study suggests the following conclusions:
Firstly, compaction of secondary peat swamp forest during the conversion to oil palm does not lead to changes in bulk density but affects emissions, water content parameters and decomposition proxies. Despite a 33% reduction in net emissions, emissions are still not counterbalanced by organic matter inputs, resulting in net emissions to the atmosphere. Additionally, the soil remains vulnerable to the birch effect when seasonal rewetting occurs.
Secondly, compaction of pre-drained peat is deemed pointless and ineffective in reducing emissions or lowering the ignitibility of peat.
Lastly, since this study focused on the effects in the absence of groundwater variability, any effects resulting from compaction of secondary peat swamp forest will be negated by water table fluctuations during the wet season.
Data availability statement
The original contributions presented in the study are included in the article/Supplementary Material. Further inquiries can be directed to the corresponding author.
Author contributions
MS: Conceptualization, Data curation, Formal Analysis, Investigation, Methodology, Resources, Validation, Visualization, Writing – original draft, Writing – review & editing, Funding acquisition, Software. SE: Supervision, Writing – review & editing.
Funding
The author(s) declare financial support was received for the research, authorship, and/or publication of this article. Open access funding provided by Malaysian Agricultural Research and Development Institute (MARDI) under 12th Malaysia Plan with grant no. PRP515-1001-P29999. The research leading to these results received funding from MARDI 2016 Ph.D. Scholarship under Agreement No. MDI/SM/PL/312/001Jld.14 at The University of Nottingham, Malaysia.
Acknowledgments
We would like to thank Mr. Dzularsyilaizat for the field and laboratory support. We would also like to thank the former Director of the Forestry Department of Selangor Dato’ Dr. Mohd Puat Dahalan and the Manager of MAB Agriculture-Horticulture Sdn Bhd., the late Mr. Nizam for enabling us to visit their sites and run various experiments.
Conflict of interest
The authors declare that the research was conducted in the absence of any commercial or financial relationships that could be construed as a potential conflict of interest.
Publisher’s note
All claims expressed in this article are solely those of the authors and do not necessarily represent those of their affiliated organizations, or those of the publisher, the editors and the reviewers. Any product that may be evaluated in this article, or claim that may be made by its manufacturer, is not guaranteed or endorsed by the publisher.
Supplementary material
The Supplementary Material for this article can be found online at: https://www.frontiersin.org/articles/10.3389/fsoil.2024.1259907/full#supplementary-material
References
1. Dhandapani S, Girkin NT, Evers S, Ritz K, Sjögersten S. Is intercropping an environmentally-wise alternative to established oil palm monoculture in tropical peatlands? Front For Glob Change (2020) 3:70. doi: 10.3389/ffgc.2020.00070
2. Saidy AR, Razie F, Aidawati N, Hidayat T. (2020). Increases in greenhouse gases following the use of peatlands for agricultural areas. In: IOP conference series: earth and environmental science, volume 499, International symposium on wetlands environmental management 5-7 November 2019, (Banjarbaru, Indonesia: IOP Publishing Ltd). doi: 10.1088/1755-1315/499/1/012021
3. Cooper HV, Vane CH, Evers S, Aplin P, Girkin NT, Sjögersten S. From peat swamp forest to oil palm plantations: The stability of tropical peatland carbon. Geoderma (2019) 342:109–17. doi: 10.1016/j.geoderma.2019.02.021
4. Raharjo JT, Fauzi R, Hadiyan Y, Andriyani EP, Mulyono BT. (2023). Feasibility study of zero burning peatland agriculture in Mempawah District, West Kalimantan. In: IOP conference series: earth and environmental science, volume 1168, 5th International conference on food and agriculture. (Banyuwangi, Indonesia: IOP Publishing Ltd). doi: 10.1088/1755-1315/1168/1/012006
5. Samuel MK, Evers SL. The role of compaction on physicochemical properties and carbon emissions of tropical peat soils: A review. Jurnal Teknologi (Sci Eng) (2023) 85:83–96. doi: 10.11113/jurnalteknologi.v85.18340
6. Mutert E, Fairhurst TH, von Uexkull HR. Agronomic management of oil palms on deep peat. Better Crops Int (1998) 13(1):22–7.
7. Melling L, Henson IE. Greenhouse gas exchange of tropical peatlands-A review. J Oil Palm Res (2011) 23:1087–95.
8. Melling L, Tang ACI. Water table and soil moisture management. In: Haze and Biomass Burning in Asia – A Systems Perspective to Reveal Opportunities with Benefits for Long-term Transformations. Bandung, Indonesia: International Institute for Applied Systems Analysis (2018).
9. Busman NA, Maie N, Ishak CF, Sulaiman MF, Melling L. Effect of compaction on soil CO2 and CH4 fluxes from tropical peatland in Sarawak, Malaysia. Environ Dev Sustainability (2021) 23(8):11646–59. doi: 10.1007/s10668-020-01132-y
10. Bernama. Indonesia to test Sarawak’s peatland compaction method (2016). Borneo Post Online. Available at: https://www.theborneopost.com/2016/04/03/Indonesia-to-test-sarawaks-peatland-compaction-method/ (Accessed 3 April 2016).
11. Ishikura K, Yamada H, Toma Y, Takakai F, Morishita T, Darung U, et al. Effect of groundwater level fluctuation on soil respiration rate of tropical peatland in Central Kalimantan, Indonesia. Soil Sci Plant Nutr (2017) 63(1):1–13. doi: 10.1080/00380768.2016.1244652
12. Wakhid N, Hirano T, Okimoto Y, Nurzakiah S, Nursyamsi D. Soil carbon dioxide emissions from a rubber plantation on tropical peat. Sci Total Environ (2017) 581-582:857–65. doi: 10.1016/j.scitotenv.2017.01.035
13. Ishikura K, Hirano T, Okimoto Y, Hirata R, Kiew F, Melling L, et al. Soil carbon dioxide emissions due to oxidative peat decomposition in an oil palm plantation on tropical peat. Agriculture Ecosyst Environ (2018) 254:202–12. doi: 10.1016/j.agee.2017.11.025
14. Marwanto S, Sabiham S, Funakawa S. Importance of CO2 production in subsoil layers of drained tropical peatland under mature oil palm plantation. Soil Tillage Res (2019) 186:206–13. doi: 10.1016/j.still.2018.10.021
15. Othman H, Darus FM, Tarmizi A, Mohammed. Experiences in Peat Development for Oil Palm Planting in the MPOB Research Station at Sessang, Sarawak (2009). Oil Palm Bulletin. Available at: http://palmoilis.mpob.gov.my/OPB/index.php/2020/03/29/experiences-in-peat-development-for-oil-palm-planting-in-the-mpob-research-station-at-sessang-sarawak/ (Accessed 5 September 2016).
16. Wijedasa LS, Jauhiainen J, Könönen M, Lampela M, Vasander H, Leblanc MC, et al. Denial of long‐term issues with agriculture on tropical peatlands will have devastating consequences. Global Change Biol (2017) 23(3):977–82. doi: 10.1111/gcb.13516
17. Carlson KM, Goodman LK, May-Tobin CC. Modeling relationships between water table depth and peat soil carbon loss in Southeast Asian plantations. Environ Res Lett (2015) 10(7):74006. doi: 10.1088/1748-9326/10/7/074006
18. Samuel MK, Evers SL. Assessing the potential of compaction techniques in tropical peatlands for effective carbon reduction and climate change mitigation. SN Appl Sci (2023) 5(12):347. doi: 10.1007/s42452-023-05548-9
19. Levy-Booth DJ, Giesbrecht I, Kellogg CTE, Heger TJ, D’Amore DV, Keeling PJ, et al. Seasonal and ecohydrological regulation of active microbial populations involved in DOC, CO2, and CH4 fluxes in temperate rainforest soil. ISME J (2018) 13(4):950–63. doi: 10.1038/s41396-018-0334-3
20. Welte CU, Deppenmeier U. Bioenergetics and anaerobic respiratory chains of aceticlastic methanogens. Biochim Et Biophys Acta (Bba) - Bioenergetics (2014) 1837(7):1130–47. doi: 10.1016/j.bbabio.2013.12.002
21. Huat BBK, Kazemian S, Prasad A, Barghchi M. State of an art review of peat: general perspective. Int J Phys Sci (2011) 6:1988–96. doi: 10.5897/IJPS11.192
22. Arora B, Spycher N, Steefel CI, Molins S, Bill M, Conrad MF, et al. Influence of hydrological, biogeochemical and temperature transients on subsurface carbon fluxes in a flood plain environment. Biogeochemistry (2016) 127:367–96. doi: 10.1007/s10533-016-0186-8
23. Brühl CA. Leaf litter ant communities in tropical lowland rain forests in Sabah, Malaysia. German: Universität Würzburg (2001).
24. Surahman A, Soni P, Shivakoti GP. Reducing CO2 emissions and supporting food security in Central Kalimantan, Indonesia, with improved peatland management. Land Use Policy (2018) 72:325–32. doi: 10.1016/j.landusepol.2017.12.050
25. Armstrong A, Holden J, Kay P, Francis B, Foulger M, Gledhill S, et al. The impact of peatland drain-blocking on dissolved organic carbon loss and discolouration of water; results from a national survey. J Hydrol (2010) 381(1):112–20. doi: 10.1016/j.jhydrol.2009.11.031
26. Fujimoto K, Miura M, Kobayashi S, Simbolon H. Habitat evolution of a peat swamp forest and belowground carbon sequestration during the holocene along the coastal lowland in Central Sumatra, Indonesia. Prog Earth Planetary Sci (2019) 6:41. doi: 10.1186/s40645-019-0288-8
27. Mardhiana N, Panjaitan R, Diana R, Harryati T. (2022). Study of the ground cover species important for agriculture in peat swamp forest area Tengku Dacing Village. In: IOP conference series: earth and environmental science, volume 1083, International conference on climate change, agriculture, biodiversity, and environment study. (IOP Publishing Ltd). doi: 10.1088/1755-1315/1083/1/012056
28. RSPO, MYNI-TF. Malaysian Interpretation of RSPO Principles and Criteria for Sustainable Palm Oil Production (2015). Available at: https://cdn.scsglobalservices.com/files/program_documents/rspo_int_Malaysianationalinterpretation_march2015_0.pdf (Accessed 17 June 2020).
29. Baker BJ, Fausey NR, Islam KR. Comparison of soil physical properties under two different water table management regimes. Soil Sci Soc America J (2004) 68(6):1973–81. doi: 10.2136/SSSAJ2004.1973
30. Rezanezhad F, Price JS, Quinton WL, Lennartz B, Milojevic T, Cappellen PV. Structure of peat soils and implications for water storage, flow and solute transport: A review update for geochemists. Chem Geol (2016) 429:75–84. doi: 10.1016/j.chemgeo.2016.03.010
31. Blodau C, Moore TR. Micro-scale CO2 and CH4 dynamics in a peat soil during a water fluctuation and sulfate pulse. Soil Biol Biochem (2003) 35(4):535–47. doi: 10.1016/S0038-0717(03)00008-7
32. Estop-Aragonés C, Knorr K-H, Blodau C. Controls on in situ oxygen and dissolved inorganic carbon dynamics in peats of a temperate fen. J Geophys Res: Biogeosci (2012) 117(G02002):1–14. doi: 10.1029/2011JG001888
33. Moore TR, Dalva M. Methane and carbon dioxide exchange potentials of peat soils in aerobic and anaerobic laboratory incubations. Soil Biol Biochem (1997) 29(8):1157–64. doi: 10.1016/S0038-0717(97)00037-0
34. Comeau L-P, Lai DYF, Cui JJ, Hartill J. Soil heterotrophic respiration assessment using minimally disturbed soil microcosm cores. MethodsX (2018) 5:834–40. doi: 10.1016/j.mex.2018.07.014
35. Könönen M, Jauhiainen J, Laiho R, Kusin K, Vasander H. Physical and chemical properties of tropical peat under stabilised land uses. Mires Peat (2015) 16:1–13.
36. Kim K-S, Fratta D, Wen H. Field measurements for the effectiveness of compaction of coarse-grained soils. KSCE J Civil Eng (2014) 18(2):497–504. doi: 10.1007/s12205-014-0144-8
37. Santos CF, Ribeiro ICA, Pelegrino MHP, Carneiro JP, Silva BM. A simple gravimetric methodology to determine soil particle density. Commun Soil Sci Plant Anal (2022) 53:1623–9. doi: 10.1080/00103624.2022.2063310
38. Tonks AJ, Aplin P, Beriro DJ, Cooper HV, Evers SL, Vane CH, et al. Impacts of conversion of tropical peat swamp forest to oil palm plantation on peat organic chemistry, physical properties and carbon stocks. Geoderma (2017) 289:36–45. doi: 10.1016/j.geoderma.2016.11.018
39. Sakata R, Shimada S, Arai H, Yoshioka N, Yoshioka R, Aoki H, et al. Effect of soil types and nitrogen fertilizer on nitrous oxide and carbon dioxide emissions in oil palm plantations. Soil Sci Plant Nutr (2015) 61:48–60. doi: 10.1080/00380768.2014.960355
40. Gao F, Yates SR. Laboratory study of closed and dynamic flux chambers: Experimental results and implications for field application. J Geophys Res (1998) 103(D20):26,115–126,125. doi: 10.1029/98JD01346
41. Wei Q, Li X, Xu J, Dai H, Li B, Xu J, et al. Responses of soil N2O and CO2 emissions and their global warming potentials to irrigation water salinity. Atmosphere (2022) 13(11):1777. doi: 10.3390/atmos13111777
42. Arias PA, Bellouin N, Coppola E, Jones RG, Krinner G, Marotzke J, et al. Climate Change 2021: The Physical Science Basis. Contribution of Working Group I to the Sixth Assessment Report of the Intergovernmental Panel on Climate Change (2021). (Accessed 6 April 2023)doi: 10.1017/9781009157896.002.
43. Yap BW, Sim CH. Comparisons of various types of normality tests. J Stat Comput Simulation (2011) 81(12):2141–55. doi: 10.1080/00949655.2010.520163
44. Fitrianto A, Chin LY. Asessing normality for data with different sample sizes using SAS, MINITAB and R. J Eng Appl Sci (2016) 11(18):10845–50.
45. Itoh M, Okimoto Y, Hirano T, Kusin K. Factors affecting oxidative peat decomposition due to land use in tropical peat swamp forests in Indonesia. Sci Total Environ (2017) 609:906–15. doi: 10.1016/j.scitotenv.2017.07.132
46. Sakabe A, Itoh M, Hirano T, Kusin K. Ecosystem-scale methane flux in tropical peat swamp forest in Indonesia. Global Change Biol (2018) 24(11):5123–36. doi: 10.1111/gcb.14410
47. Melling L, Hatano R, Goh KJ. Methane fluxes from three ecosystems in tropical peatland of Sarawak, Malaysia. Soil Biol Biochem (2005) 37:1445–53. doi: 10.1016/j.soilbio.2005.01.001
48. Melling L, Hatano R, Goh KJ. Soil CO2 flux from three ecosystems in tropical peatland of Sarawak, Malaysia. Tellus B: Chem Phys Meteorol (2005) 57:1–11. doi: 10.1111/j.1600-0889.2005.00129.x
49. Dhandapani S, Evers S, Boyd D, Evans CD, Page S, Parish F, et al. Assessment of differences in peat physico-chemical properties, surface subsidence and GHG emissions between the major land-uses of Selangor peatlands. CATENA (2023) 230:107255. doi: 10.1016/j.catena.2023.107255
50. Jovani-Sancho AJ, O’Reilly P, Anshari G, Chong XY, Crout N, Evans CD, et al. CH4 and N2O emissions from smallholder agricultural systems on tropical peatlands in Southeast Asia. Global Change Biol (2023) 29(15):4279–97. doi: 10.1111/gcb.16747
51. Wösten JHM, Ismail AB, van Wijk ALM. Peat subsidence and its practical implications: a case study in Malaysia. Geoderma (1997) 78(1):25–36. doi: 10.1016/S0016-7061(97)00013-X
52. Smith KA, Ball T, Conen F, Dobbie KE, Rey A. Exchange of greenhouse gases between soil and atmosphere: interactions of soil physical factors and biological processes. Eur J Soil Sci (2018) 69(1):2–4. doi: 10.1111/ejss.12537
53. Zhang K, Yan Z, Li M, Kang E, Li Y, Yan L, et al. Divergent responses of CO2 and CH4 fluxes to changes in the precipitation regime on the Tibetan Plateau: Evidence from soil enzyme activities and microbial communities. Sci Total Environ (2021) 801:149604. doi: 10.1016/j.scitotenv.2021.149604
54. Chaudhari PR, Ahire DV, Ahire VD, Chkravarty M, Maity S. Soil Bulk Density as related to Soil Texture, Organic Matter Content and available total Nutrients of Coimbatore Soil. Int J Sci Res Publications (2013) 3(2):1–8.
55. Dhandapani S, Ritz K, Evers SL, Yule CM, Sjögersten S. Are secondary forests second-rate? Comparing peatland greenhouse gas emissions, chemical and microbial community properties between primary and secondary forests in Peninsular Malaysia. Sci Total Environ (2019) 655:220–31. doi: 10.1016/j.scitotenv.2018.11.046
56. Stres B, Danevčič T, Pal L, Fuka MM, Resman L, Leskovec S, et al. Influence of temperature and soil water content on bacterial, archaeal and denitrifying microbial communities in drained fen grassland soil microcosms. FEMS Microbiol Ecol (2008) 66(1):110–22. doi: 10.1111/j.1574-6941.2008.00555.x
57. Bader C, Müller M, Schulin R, Leifeld J. Peat decomposability in managed organic soils in relation to land use, organic matter composition and temperature. Biogeosciences (2018) 15(3):703–19. doi: 10.5194/bg-15-703-2018
58. Jauhiainen J, Limin S, Silvennoinen H, Vasander H. Carbon dioxide and methane fluxes in drained tropical peat before and after hydrological restoration. Ecology (2008) 89(12):3503–14. doi: 10.1890/07-2038.1
59. Könönen M, Jauhiainen J, Straková P, Heinonsalo J, Laiho R, Kusin K, et al. Deforested and drained tropical peatland sites show poorer peat substrate quality and lower microbial biomass and activity than unmanaged swamp forest. Soil Biol Biochem (2018) 123:229–41. doi: 10.1016/j.soilbio.2018.04.028
60. Tanner B, Douglas M, Greenberg CH, Chamberlin J, Styers D. A macroscopic charcoal and multiproxy record from peat recovered from depression marshes in Longleaf Pine Sandhills, Florida, USA. Quaternary (2018) 1(3):25. doi: 10.3390/quat1030025
61. Dommain R, Cobb AR, Joosten H, Glaser PH, Chua AFL, Gandois L, et al. Forest dynamics and tip-up pools drive pulses of high carbon accumulation rates in a tropical peat dome in Borneo (Southeast Asia). J Geophys Res: Biogeosci (2015) 120(4):617–40. doi: 10.1002/2014JG002796
62. Moore TR, Large D, Talbot J, Wang M, Riley JL. The stoichiometry of carbon, hydrogen, and oxygen in peat. J Geophys Res: Biogeosci (2018) 123(10):3101–10. doi: 10.1029/2018JG004574
63. Crill PM. Seasonal patterns of methane uptake and carbon dioxide release by a temperate woodland soil. Global Biogeochemical Cycles (1991) 5(4):319–34. doi: 10.1029/91GB02466
64. Novara A, Armstrong A, Gristina L, Semple KT, Quinton JN. Effects of soil compaction, rain exposure and their interaction on soil carbon dioxide emission. Earth Surface Processes Landforms (2012) 37:994–9. doi: 10.1002/esp.3224
65. Fraser FC, Corstanje R, Deeks LK, Harris JA, Pawlett M, Todman LC, et al. On the origin of carbon dioxide released from rewetted soils. Soil Biol Biochem (2016) 101:1–5. doi: 10.1016/j.soilbio.2016.06.032
66. Yan C, Zhang H, Li B, Wang D, Zhao Y, Zheng Z. Effects of influent C/N ratios on CO2 and CH4 emissions from vertical subsurface flow constructed wetlands treating synthetic municipal wastewater. J Hazard Mater (2012) 203-204:188–94. doi: 10.1016/j.jhazmat.2011.12.002
67. Gharedaghloo B, Price JS. Fate and transport of free-phase and dissolved-phase hydrocarbons in peat and peatlands: developing a conceptual model. Environ Rev (2018) 26:55–68. doi: 10.1139/er-2017-0002
Keywords: compaction, tropical peatland, secondary peat swamp forest, oil palm plantation, biogeochemical processes, groundwater
Citation: Samuel MK and Evers S (2024) Translocation of tropical peat surface to deeper soil horizons under compaction controls carbon emissions in the absence of groundwater. Front. Soil Sci. 4:1259907. doi: 10.3389/fsoil.2024.1259907
Received: 20 July 2023; Accepted: 22 January 2024;
Published: 12 February 2024.
Edited by:
Julia Drewer, UK Centre for Ecology and Hydrology (UKCEH), United KingdomReviewed by:
Amy Pickard, UK Centre for Ecology and Hydrology (UKCEH), United KingdomFrances Claire Manning, University of Aberdeen, United Kingdom
Copyright © 2024 Samuel and Evers. This is an open-access article distributed under the terms of the Creative Commons Attribution License (CC BY). The use, distribution or reproduction in other forums is permitted, provided the original author(s) and the copyright owner(s) are credited and that the original publication in this journal is cited, in accordance with accepted academic practice. No use, distribution or reproduction is permitted which does not comply with these terms.
*Correspondence: Marshall Kana Samuel, bWFyc2hhbGxAbWFyZGkuZ292Lm15