 Hai Guo
 Zesong Wei
 Guangxing Guo2,3
- 1School of Architecture and Design, Beijing Jiaotong University, Beijing, China
- 2School of Geography Science, Taiyuan Normal University, Jinzhong, China
- 3Institute of Big Data Analysis Technology and Application, Taiyuan Normal University, Jinzhong, China
- 4College of Resources and Environment, Shanxi Agricultural University, Taiyuan, Shanxi, China
To investigate the spatial and temporal distribution, sources, and ecological risk of soil polycyclic aromatic hydrocarbons (PAHs) in China’s urban agglomerations from 2000 to 2020, a comprehensive search strategy was employed using the keywords “soil”, “PAHs”, and “city”. A total of 122 relevant studies that provided information on individual PAH content during the specified time period were collected. These studies encompassed 20 urban agglomerations in China, which were further categorized into two distinct periods: 2000 to 2010 and 2011 to 2020. The diagnostic ratio method and principal component analysis were employed to identify the sources of PAHs, and a risk quotient model was used to evaluate the soil ecological risk. The results revealed the average PAH content in the 20 urban agglomerations in China from 2011 to 2020 was 2,439 ± 4,633 ng·g-1, which exceeded the severe pollution level cut-off (> 1,000 ng·g-1). The soil PAH content in the period from 2011 to 2020 decreased by 28% compared to the soil PAH content in the period from 2000 to 2010. Soil PAH pollution was more severe in the northern urban agglomerations than in the southern urban agglomerations. Diagnostic ratios and principal component analysis demonstrated that the principal sources in most urban agglomerations in China were traffic and coal combustion. GeoDetector found that coal and fuel oil consumption were the main factors affecting the spatial differentiation of PAHs. The ecological risk quotient showed that approximately 80% of the urban agglomerations were at a medium-high ecological risk from 2000 to 2010, compared with 72% from 2011 to 2020. Thus, it is necessary to deepen energy structure reform to alleviate the threat of serious pollution caused by coal and fuel oil in urban agglomerations.
1 Introduction
In recent years, rapid urbanization and industrialization have brought great development to most Chinese cities but have also caused serious environmental problems (1, 2). Environmentally toxic pollutants, such as polycyclic aromatic hydrocarbons (PAHs), have attracted widespread attention owing to their carcinogenicity (3, 4). PAHs are mainly derived from combustion processes, such as vehicle emissions and the incomplete combustion of biomass, coal, and natural gas (5, 6). After their release, PAHs tend to adsorb into soil particles through dry and wet atmospheric settlements and then with long-term accumulation in the environment (7, 8). Soil is the main sink of PAHs in the environment, and it has been reported that more than 90% of the PAHs in the environment exist in the soil (9).
The rapid and significant accumulation of PAHs in urban soils has attracted considerable attention. According to a study of soil PAHs in Tianjin, the average Σ16PAHs content in the soil in Tianjin doubled from 620 ng·g-1 to 1,296 ng·g-1 from 2008 to 2012 due to the influence of human activities (10). From 2015 to 2021, the average content of Σ16PAHs in the soil in Shanghai increased from 807 ng·g-1 (11) to 1,776 ng·g-1 (12). The average content of Σ16PAHs in the soil in Nanjing also increased from 979.6 ng·g-1 in 2016 (13) to 2,740 ng·g-1 in 2020 (14). These studies suggest that rapid industrialization and urbanization have resulted in a sharp increase in PAH content (15–17). Average soil Σ16PAHs content in many cities exceeds global heavy pollution standards (18–20), such as the content of soil Σ16PAHs in Chengdu (3106 ng·g-1) (21), Shanghai (1776 ng·g-1) (12), Taiyuan (2086 ng·g-1) (22). The content of the soil Σ16PAHs in these city have exceeded the heavy pollution standard (1000 ng·g-1) (23). Studies of the content and distribution of PAHs in urban soil are of great significance to human health.
The Seventh National Census Communique showed that approximately 64 percent of the Chinese population lives in cities (24). The national economic and social development of the People’s Republic of China, and the 2035 Vision Target Outline in 2021 proposed optimizing the Beijing-Tianjin-Hebei, Yangtze River Delta, Pearl River Delta, Chengdu-Chongqing, and middle reaches of the Yangtze River urban agglomerations; developing Shandong Peninsula, Guangdong and Zhejiang coastal regions, Zhongyuan, Guanzhong Plain, and Beibu Gulf; cultivating the development of Harbin-Changchun, middle southern region of Liaoning, central Shanxi, central Guizhou, central Yunnan, Hohehot-Baotou-Ordos-Yulin, Lanzhou-Xining, Ningxia Yanhuang, and the northern slope of Tianshan Mountain urban agglomerations (25). China will enter a critical period of urbanization construction in the new era. Maintaining environmental fairness among different urban agglomerations is of great significance for their development. At present, most studies are on the scale of cities, and studies on the scale of urban agglomerations are relatively scarce.
Scholars have found that PAH pollution levels are significantly different in different urban soils (18–20); however, at the scale of urban agglomerations, comparative studies of soil PAH content and source differences are lacking, and multiple factors affecting soil PAH accumulation remain to be studied (26). Previous studies have shown that the accumulation of PAHs in soil is mainly related to the generation sources of PAHs (coal burning, oil burning, and biomass burning) (27). Environmental factors (light duration, solar radiation, and soil properties) have also led to differences in PAHs accumulation (28, 29). It is of great significance to explore the main factors influencing PAHs content in urban agglomerations. However, only a limited number of studies have explored the contribution of a few factors to PAHs accumulation in soils, particularly at the urban agglomeration scale. Twenty-one indices (Shown in section 2.3) that may be related to soil PAH accumulation were selected for analysis in this study. We collected 20 urban agglomerations (regions) as research objects and conducted the following studies: (a) an analysis of the spatial and temporal content, composition, and distribution of PAHs in major urban agglomerations in China, (b) the determination of the main sources and influencing factors of PAHs in major urban agglomerations in China, and (c) the calculation and evaluation of the ecological risks of PAHs in major urban agglomerations in China.
2 Materials and methods
2.1 Materials collection and statistics
Using “city”, “PAHs”, and “soil” as the combined keywords searching in abstract of two full-text databases (China National Knowledge Infrastructure, Web of Science), more than 1,300 articles on PAHs in Chinese cities from 2000 to 2020 were collected in June 2021. Articles that did not contain individual PAH content data were discarded. And 161 regions from 122 valid documents were selected and used for subsequent analysis eventually. Soil samples were collected from 2001 to 2020, and the single PAHs included in the analysis were the 16 PAHs listed by the United States Environmental Protection Agency. Basic information and abbreviations for the 16 PAHs are shown in Table 1.
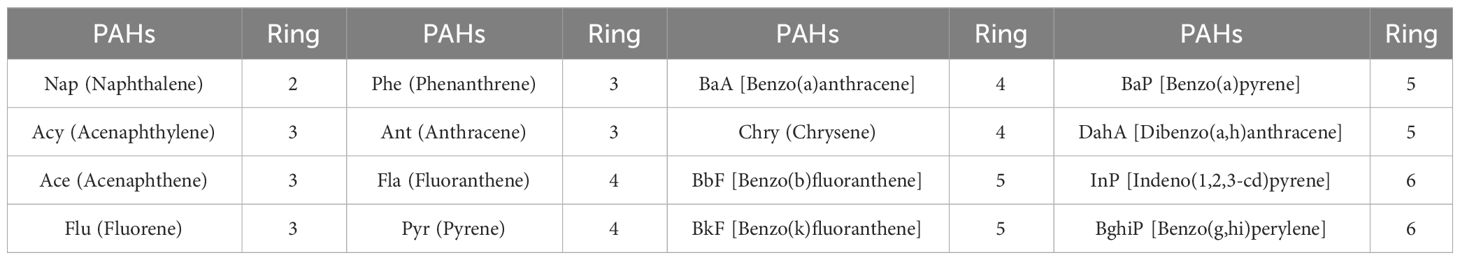
Table 1 Basic information and abbreviations for the 16 PAHs.
2.2 Source analysis
Natural (rock) and anthropogenic (burn) sources are the primary sources of PAHs in the environment. Different PAH types have different sources. The source analysis methods for PAHs usually include principal components analysis (PCA), diagnostic ratios (DRs), positive matrix factorization, and chemical mass balance model methods (30). Based on the research characteristics of this study, DRs (22) and PCA (13, 31) were used to analyze the sources of soil PAH pollution in urban agglomerations. The processes of the PCA are shown in appendix1.
2.3 Selection and collection of factors influencing PAH content
Geographical detector (Geodetector) is a statistical method based on the spatial autocorrelation theory that can detect spatial variation and reveal the driving factors that cause spatial variation (32). It is widely used to study environmental pollution. For example, Ma et al. (33) used geographical detectors to analyze the factors driving the spatial distribution of heavy metals in the soil of non-ferrous metal smelting sites. Xu et al. (34) studied the effects of anthropogenic and natural factors on the spatial distribution of trace elements in soil using a geodetector. Liang et al. (35) analyzed the spatial factors affecting soil heavy metals in Guangzhou by using a geographic detector. However, the current application of geodetector in the field of soil pollution mainly focuses on heavy metals and their influencing factors, and there are few reports on the use of geodetector to analyze the spatial distribution characteristics and driving factors of soil PAHs contents.
Based on the literature and data availability, 21 indicators that may be related to soil PAH accumulation were selected. The energy consumption data for 34 provinces in China from 2000 to 2019 were collected from the China Energy Statistical Yearbook of the National Bureau of Statistics (http://www.stats.gov.cn). Based on data availability, the selected energy consumption (tons of standard coal), coal consumption (tons), coke consumption (tons), oil consumption (tons), crude oil consumption (tons), gasoline consumption (tons), kerosene consumption (tons), diesel consumption (tons) (excluding 2000–2010), fuel oil consumption (tons), liquefied petroleum gas (LPG) consumption (tons), natural gas consumption (100 million cubic meters), and electricity consumption (100 million kilowatt hours) were studied. The relative contents of soil sand, silt, and clay; the total population; and the average gross domestic product interpolation data for 2005 and 2015 were selected from the Resources and Environmental Science Data Registration and Publication System (http://www.resdc.cn), and the average annual solar radiation, average annual temperature, and average annual precipitation data for 2005 and 2015 were obtained from https://crudata.uea.ac.uk (https://www.gscloud.cn/). During data processing, ArcGIS was used to extract the average value of each province and summarize the data into urban agglomerations for analysis. After the selection of the factors, the utility of each factor for the spatial differentiation of PAHs in urban agglomeration soil was analyzed using a geographic detector. Because the geographic detector requires the factors to be classified, the natural breakpoint method was used to classify the factor data.
2.4 Ecological risk assessment
The risk quotient (RQ) values of the 16 PAHs were used to evaluate the ecological risks. The ecological environmental risks of soil PAHs in different urban agglomerations were evaluated by comparing the content of the 16 detected PAHs with their respective negligible concentrations (NCs) and maximum allowable concentrations (MPCs). The equations for the RQs were as Equations 1–3:
CPAHs represent the concentrations of individual PAHs at each sample site, CQV (NCs) is the minimum risk standard value, and CQV (MPCs) is the highest risk standard value. Specific numerical values have previously been reported (11). RQ(NCs) and RQ(MPCs) had the lowest and highest risk concentration entropy values, respectively (11, 22), whereas RQ(NCs) and RQ(MPCs) had the lowest and highest risk-concentration entropy values, respectively. Risk classification of individual and total PAHs are shown in Table 2.
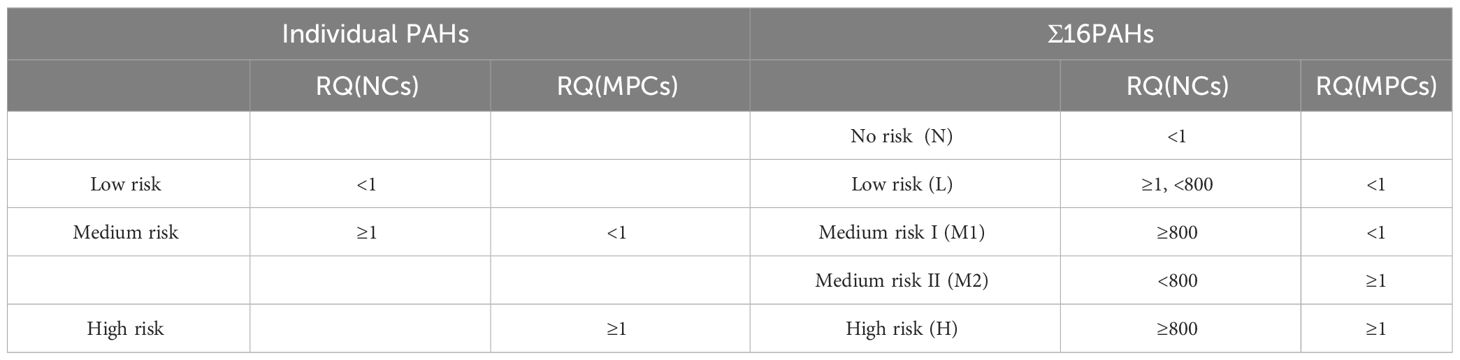
Table 2 Risk classification of individual and total PAHs.
3 Results and analysis
3.1 Statistical characterization of soil PAHs in urban agglomerations
The 122 articles surveyed were distributed across 19 urban agglomerations and Tibetan Plateau areas, as shown in Table 3, and 159 study areas and 9,039 sampling sites were extracted from the literature. These sampling sites were mainly located in the Pearl River Delta, Yangtze River Delta, and Beijing-Tianjin-Hebei megacities; the industrial areas in central Liaoning and central Shanxi; and economically developed coastal areas. Overall, these areas represent the main sources of surface soil PAH pollution in the urban areas of China. To analyze the temporal variation characteristics of soil PAH content in urban agglomerations, the sampling time in 159 study areas was extracted from the literature. The sampling time varied from 2001 to 2020, and soil PAHs were analyzed by equal interval classification on a scale of 10 years.
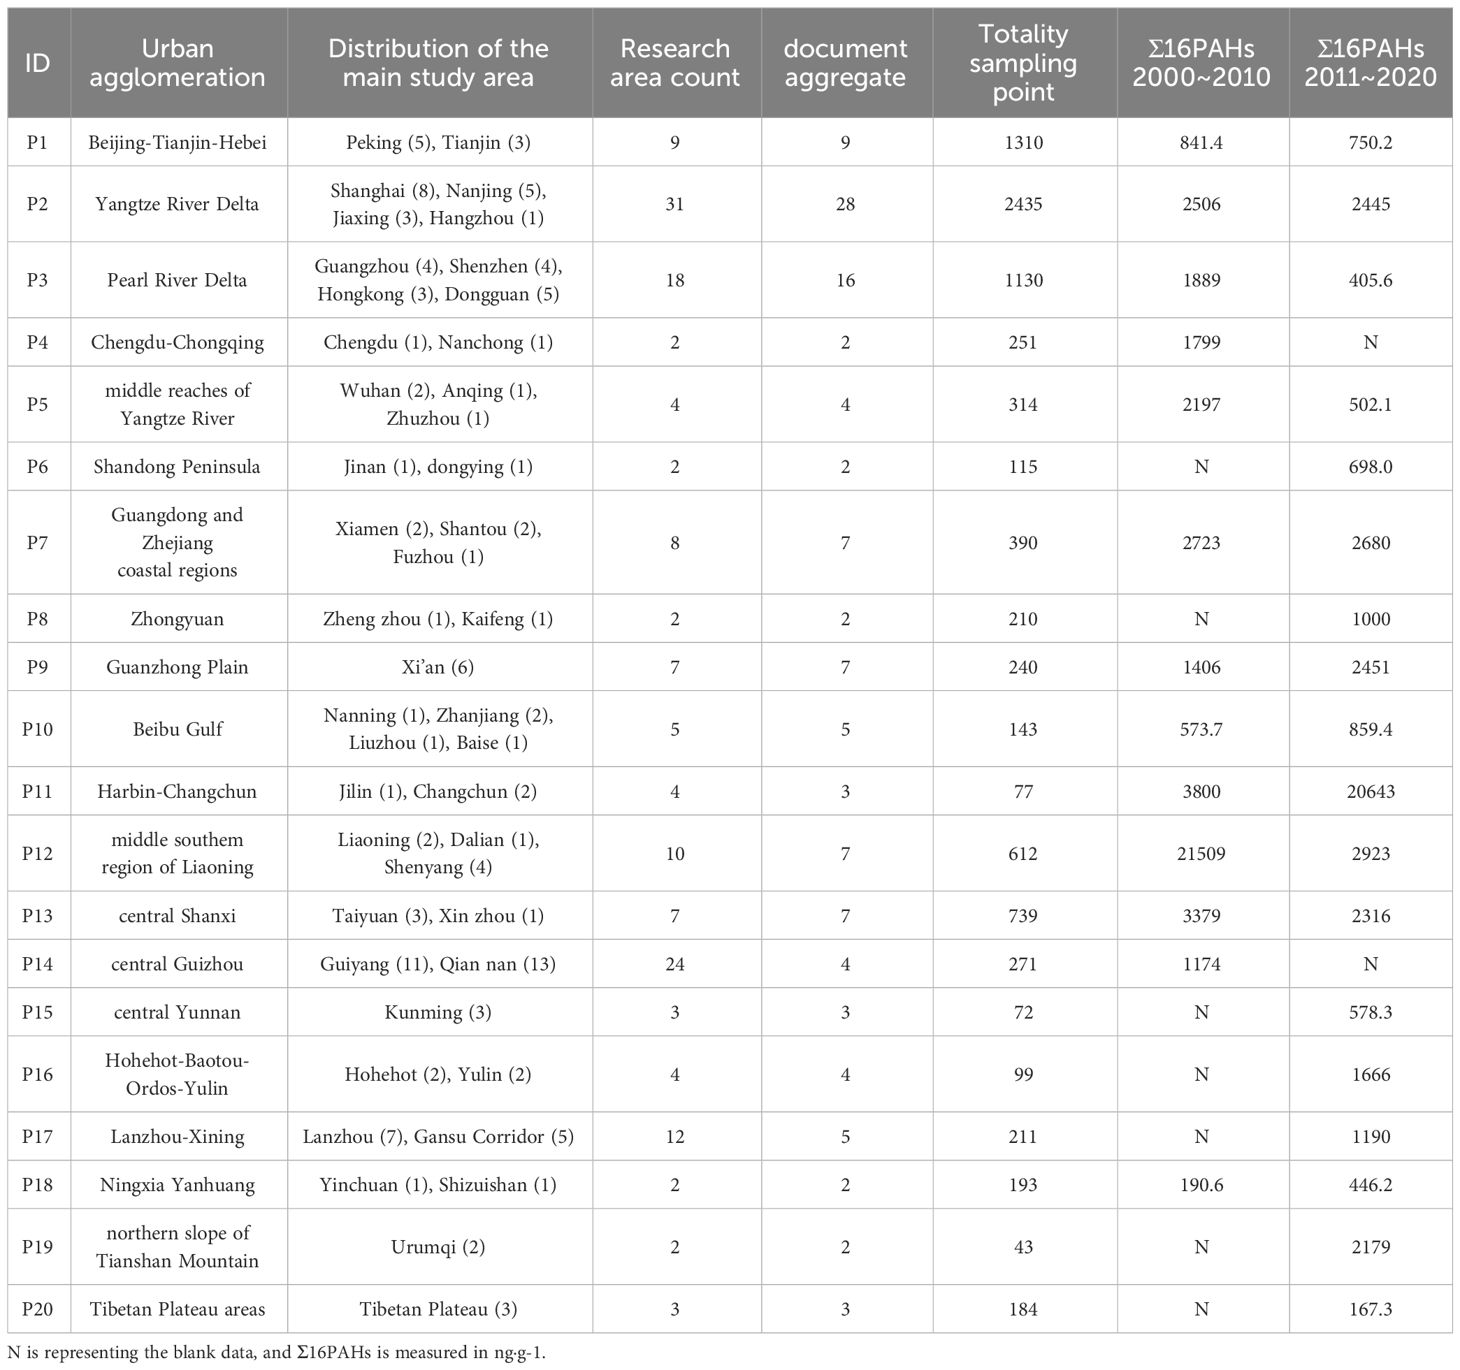
Table 3 Distribution and statistics of literature.
According to the collation of results from the literature, the average content of soil Σ16PAHs in urban agglomerations in China was 3,384 ng·g-1 and the total content ranged from 190.6 ng·g-1 to 21,509 ng·g-1 from 2000 to 2010. From 2011 to 2020, the average soil Σ16PAHs content in urban agglomerations in China was 2,439 ng·g-1, and the total content ranged from 167.3 ng·g-1 to 20,643 ng·g-1. Thus, the average soil PAH content of in Chinese urban agglomerations from 2011 to 2020 decreased by approximately 28% compared to the average soil PAH content from 2000 to 2010. The decrease in soil PAHs concentrations in China may be a response to the adjustment of the energy structure during the past two decades. A comparative study of soil PAHs content in Beijing in 2008 and 2019 inferred that the decreasing trend of soil PAHs was due to the decline seen in the consumption of coal, coke, and some oils and the rising consumption of clean energy, such as electricity and natural gas, in China (36). In accordance with the evaluation standard of Σ16PAHs in soil, the levels were: heavy pollution (>1000 ng·g−1), moderate pollution (600~1000 ng·g−1), and light pollution (200~600 ng·g−1) (23). Approximately 8% of the urban agglomerations with PAH data were moderately polluted, and more than 77% of the urban agglomerations were severely polluted from 2000 to 2010. From 2011 to 2020, these proportions were 17% and 56%, respectively.
Figure 1 showed the content of 2~6 ring PAHs in 20 urban agglomerations and the total content in each urban agglomeration. As can be seen from Figure 1, the comparison between 2000–2010 and 2011–2020 showed that the average content of soil Σ16PAHs in Chinese urban agglomerations declined, but the average content of soil Σ16PAHs in an increasing number of urban agglomerations reached moderate or even severe pollution levels. A comparison between the average content of soil Σ16PAHs in 2000–2010 and 2011–2020 showed that the soil PAH content in the Beijing-Tianjin-Hebei, Yangtze River Delta, Pearl River Delta, middle reaches of the Yangtze River, Guangdong and Zhejiang coastal regions, middle-southern region of Liaoning Province, and central Shanxi urban agglomerations decreased, while the soil PAH content in the Guanzhong Plain, Beibu Gulf, Harbin-Changchun, and Ningxia Yanhuang urban agglomerations increased. The PAH content decreased by approximately 2% year on year in the Yangtze River Delta and Guangdong and Zhejiang coastal urban agglomerations; by approximately 11% in the Beijing-Tianjin-Hebei urban agglomeration; by approximately 31% in the central Shanxi urban agglomeration; and by approximately 80% in the Pearl River Delta, the middle reaches of the Yangtze River, and the middle-southern region of Liaoning Province urban agglomerations. The PAH content increased by approximately 74% and 50% annually in the Guanzhong Plain and Beibu Gulf urban agglomerations, respectively, and by approximately 443% and 134% in the Harbin-Changchun and Ningxia Yanhuang urban agglomerations, respectively.
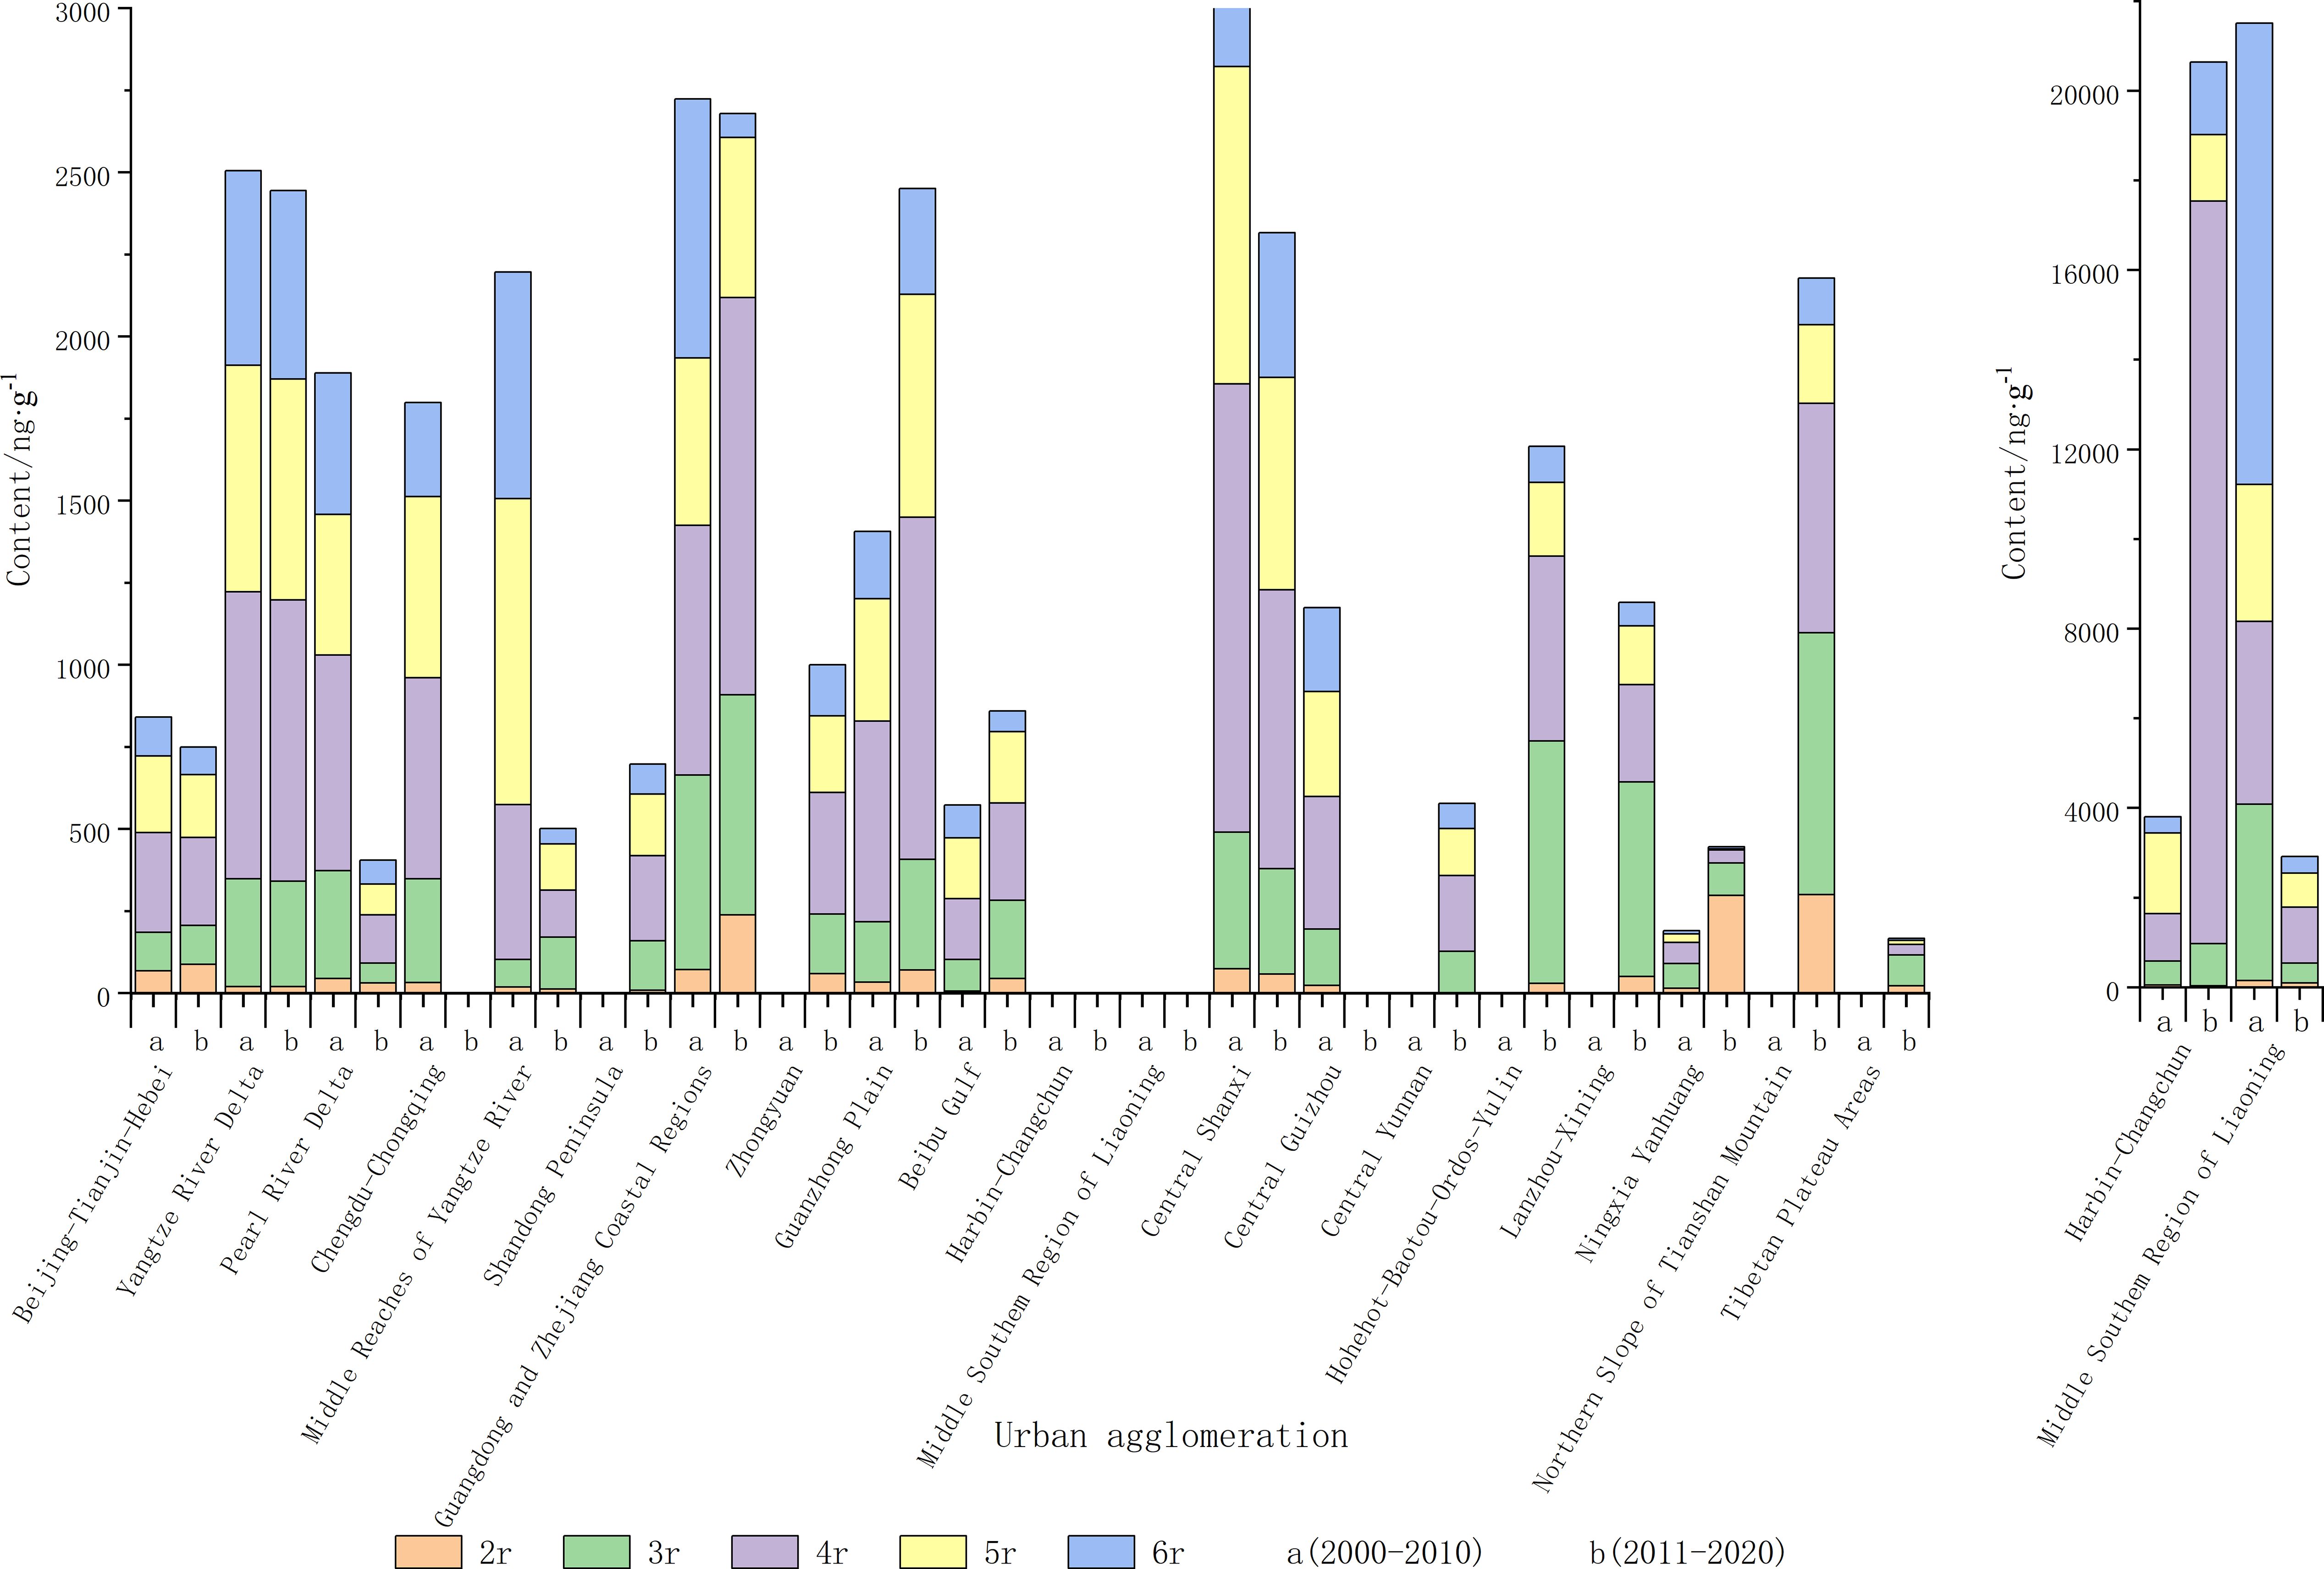
Figure 1 Content of 2~6 ring PAHs in 20 urban agglomerations.
The soil in Chinese cities, especially large cities and megacities, is seriously polluted by PAHs, which threatens the health of urban inhabitants. As shown in Table 3, urban agglomerations in old industrial bases in northeast China, represented by Harbin-Changchun and the middle-southern region of Liaoning Province, were seriously polluted by PAHs. Jilin and Changchun are core cities in the Harbin-Changchun urban agglomeration, and industrial activities in these cities produce many PAHs (20). In addition, these cities are in the northernmost region of China, which has lower temperature and more burning process than other cities. From the perspective of volatile diffusion, low temperatures are not conducive to the migration and degradation of PAHs, and fertile black soils also provide a good environment for the retention of PAHs (20). Similar to the Harbin-Chang urban agglomeration, a large volume of industrial emissions, lower temperature, and heating processes have led to severe PAH pollution in the middle-southern part of the Liaoning province urban agglomeration.
Urban agglomerations with soil PAH contamination greater than 1,000 ng·g-1 from 2011 to 2020 were mostly distributed in northern China, such as the Zhongyuan, Guanzhong, central Shanxi, Hohehot-Baotou-Ordos-Yulin, Lanzhou-Xining, and the northern slope of the Tianshan Mountains urban agglomerations. The Guanzhong Plain urban agglomeration (represented by Xi’an), the central Shanxi urban agglomeration (represented by Taiyuan), and the northern slope of the Tianshan Mountain urban agglomeration (represented by Urumqi), were all seriously polluted. Most of these urban agglomerations have industrial cities or energy cities as their centers, resulting in major soil PAH pollution. In southern China, there are many human activities in the Guangdong and Zhejiang coastal and Yangtze River Delta urban agglomerations, which were found to be severely polluted by PAHs. The reduction of PAH content in the Pearl River Delta city cluster was due to the influence of related policies. As early as 2010, the Pearl River Delta was built into a national environmental protection model city cluster (37), and the natural conditions of the adjacent sea and river also reduced the deposition of PAHs in the soil.
Two-to-three-ring PAHs are extremely unstable in the environment. They tend to volatilize into the air, migrate over long distances. Four-ring PAHs are easily converted between granular and gas forms, whereas five-to-six-ring PAHs are more stable and are mostly fixed in the soil (38). Figure 2 shows the proportions of low- (LMW), medium- (MMW), and high-molecular-weight (HMW) PAHs in 20 urban agglomerations. From 2000 to 2010, the proportions of LMW, MMW, and HMW PAHs in the soil of the 20 urban agglomerations were approximately 10–30%, 20–50%, and 40–60%, with average values of 19%, 32%, and 49%, respectively. From 2011 to 2020, the corresponding proportions were 10–60%, 40–90%, and 10–50%, with averages of 33%, 36%, and 31%, respectively. From 2000–2010 to 2011–2020, the proportion of HMW PAHs decreased by 18%, whereas the proportion of MMW and LMW PAHs increased by 4% and 14%, respectively. The decrease in the proportion of HMW PAHs may correlate with changes in China’s energy consumption patterns. Various renewable energy vehicles replaced gasoline vehicles to some extent from 2011 to 2020, while coal has been constantly heavily consumed due to the acceleration of industrialization and urbanization (including thermal power, coking, and steel industries), resulting in a relative reduction in oil consumption, eventually leading to MMW PAHs being the main PAHs in the soil between 2011 and 2020.
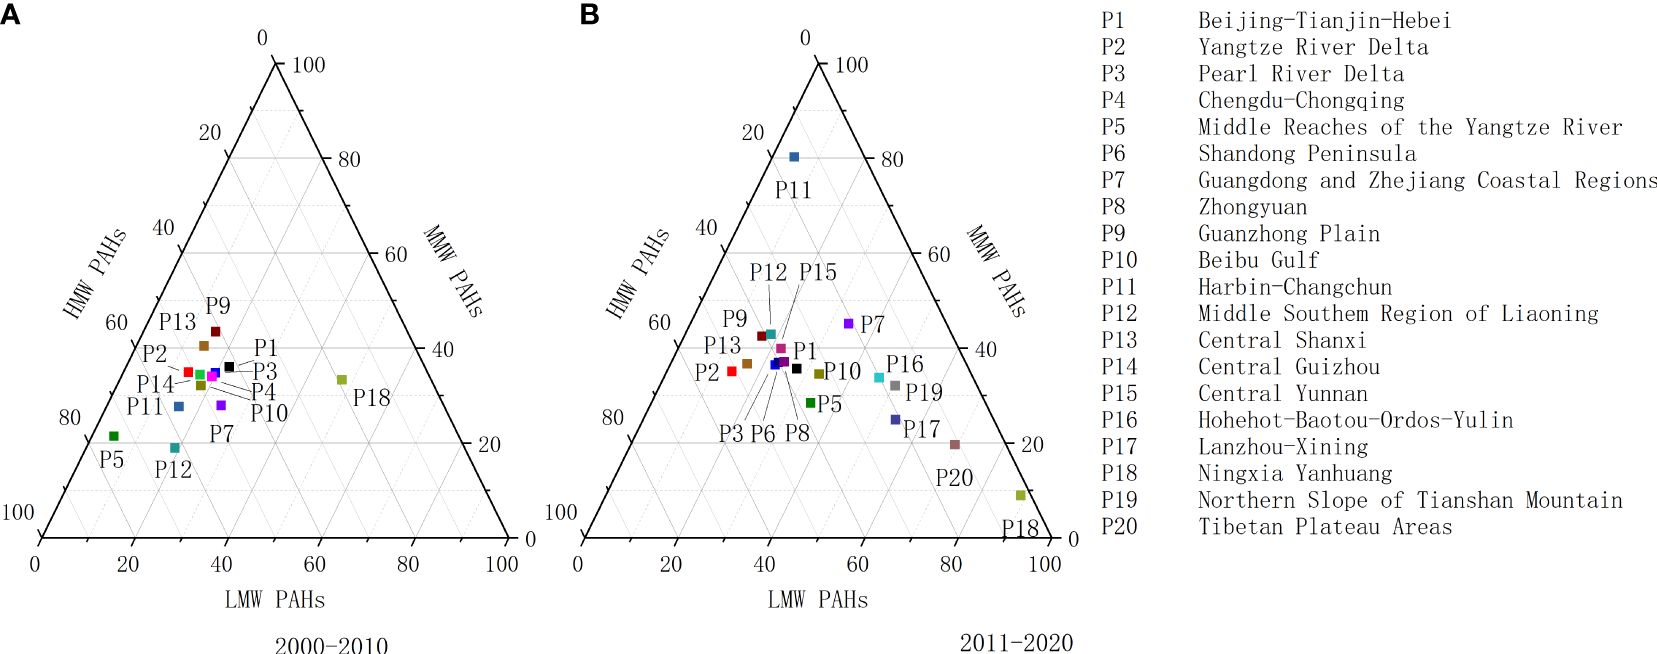
Figure 2 Proportion of LMW, MMW, and HMW PAHs in 20 urban agglomerations.
Figure 2A shows that the proportions of HMW, MMW, and LMW PAHs in the 20 urban agglomerations were similar, indicating that the energy consumption of each urban agglomeration was similar from 2000 to 2010. Figure 2B shows that the proportions of LMW PAHs were similar in P16–P20 urban agglomerations, reaching 40% or even higher. P16–P20 agglomerations are the Hohehot-Baotou-Ordos-Yulin cluster, the Lanzhou-Xining cluster, the Ningxia-Yanhuang cluster, the northern slope of Tianshan Mountain cluster, and the Qinghai-Tibet Plateau region, which have fewer emission sources, coal burning, and industrial activities, and contribute more high-ring-number PAHs in a limited area. This may be related to the trans-regional transport of LMW PAHs, which is consistent with research results (39). The proportion of PAHs with different rings in the middle reaches of the Yangtze River and Harbin-Changchun showed significant changes from 2000 to 2020, which may be related to the different sampling points used in different studies.
3.2 Source analysis of soil PAHs in urban agglomerations
3.2.1 The DRs of soil PAHs in the urban agglomerations
DRs are effective support tools that allow the qualitative analysis of the sources of PAHs in the environment (22). Most DRs use PAHs with the same molecular mass and similar physicochemical properties because they are thought to undergo similar environmental processes (30). DRs are between 0~1, and the different ranges represented different sources, as shown in Figure 3. Figure 3A shows that the main emission source of PAHs in the 20 urban agglomerations from 2000 to 2020 was combustion. The ratio of Ant/(Ant+Phe) from 2000 to 2010 indicated that the oil volatilization source was related to the possible existence of more petroleum consumption in the city and that a low temperature and other environmental factors may have affected the environmental chemistry processes of Ant and Phe in the city. Figure 3B shows that the soil of the Beibu Gulf and Hohehot-Baotou-Ordos-Yulin clusters were affected by traffic sources; the soil of Ningxia-Yanhuang was affected by volatile sources; and the soil of most urban agglomerations was mainly affected by PAHs produced by grass, wood, and coal combustion. Figure 3C shows that approximately 85% of the urban agglomerations had BaA/(BaA+Chry) values greater than 0.35 from 2000 to 2010, and it was 61% from 2011 to 2020, indicating the significant influence of combustion sources on PAHs in urban agglomerations.
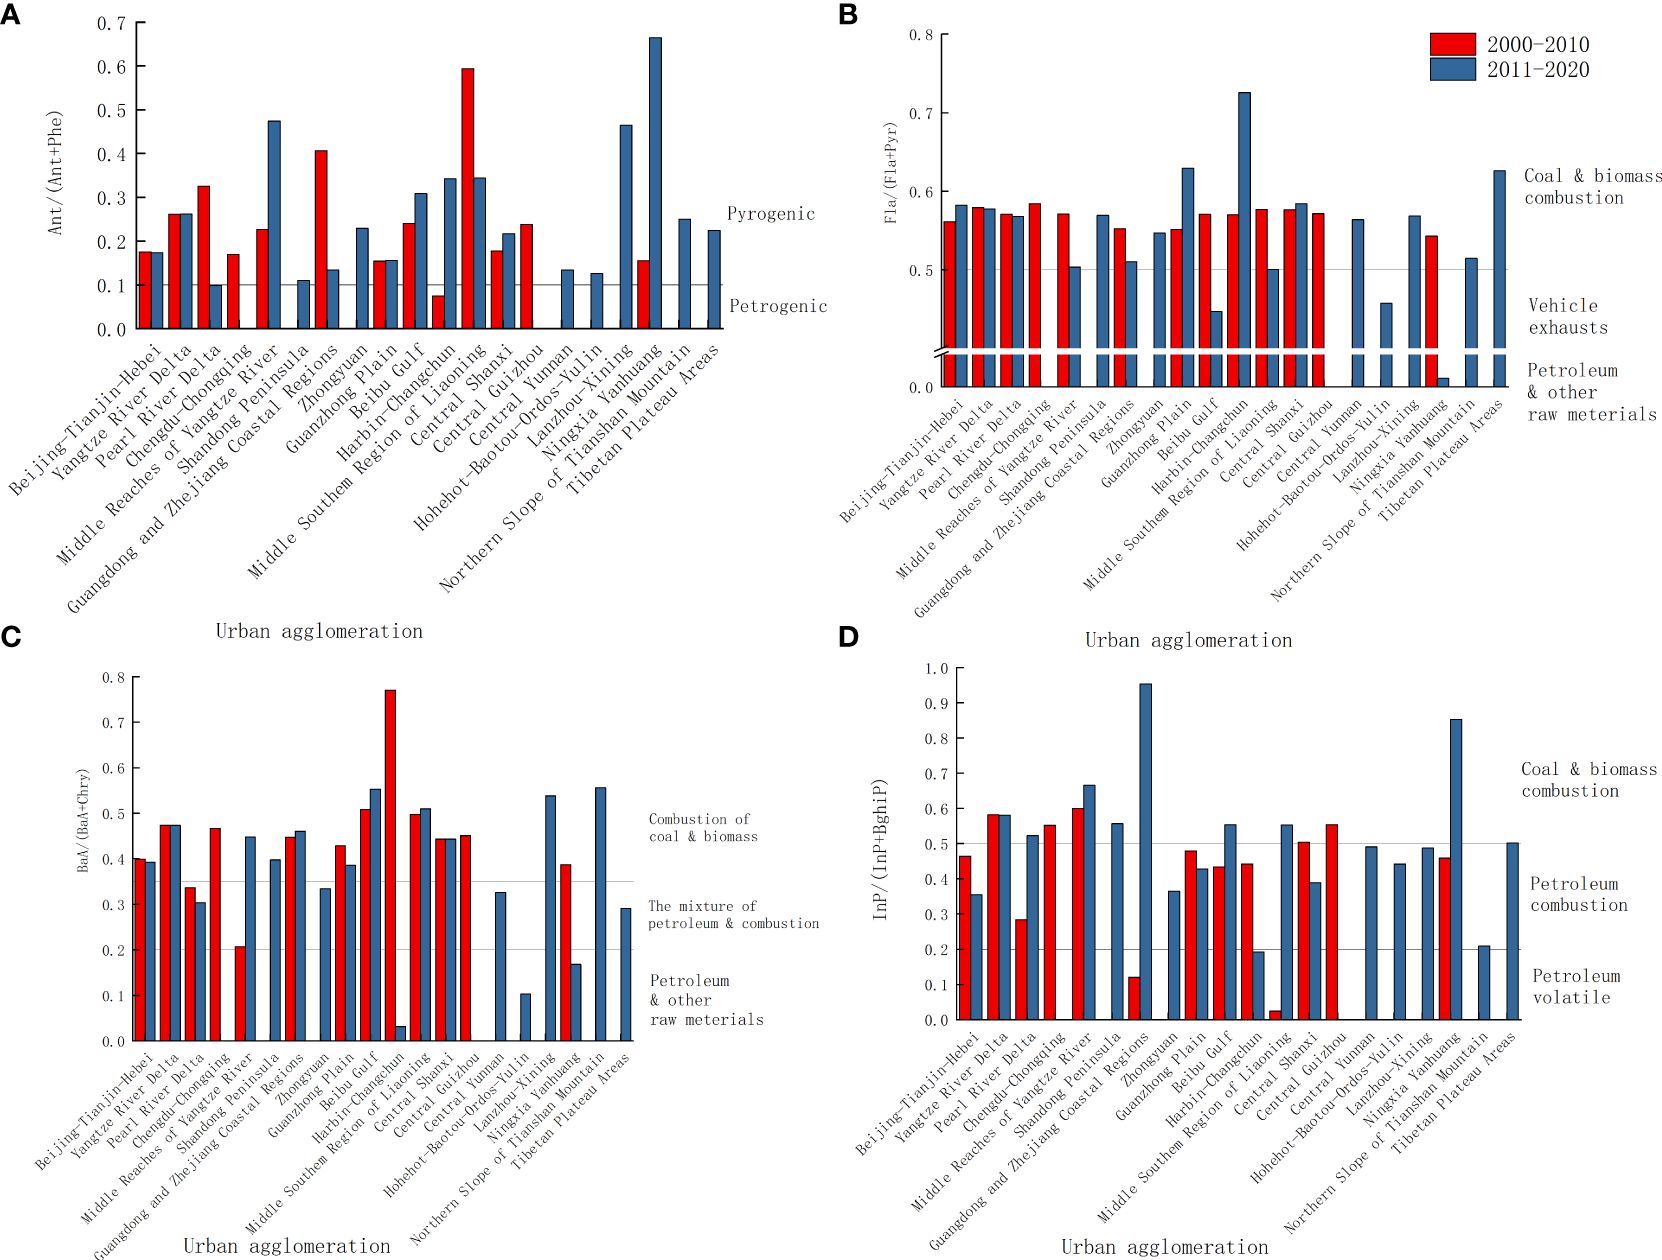
Figure 3 Diagnostic ratios of PAHs of 20 urban agglomerations.
As shown in Figure 3D, approximately 38% and 44% of urban agglomerations had InP/(InP+BghiP) values greater than 0.5 from 2000 to 2010 and 2011 to 2020, respectively, while 46% and 38% of urban agglomerations had InP/(InP+BghiP) values between 0.2 and 0.5 from 2000 to 2010 and 2011 to 2020, respectively. This indicates that the contribution of traffic sources to PHA pollution is decreasing, whereas the contributions of biomass and coal combustion sources are increasing. The Statistical Communique on National Economic and Social Development (40, 41) reports that China produced 2.19 billion tons of raw coal and 181 million tons of crude oil in 2005 and 3.75 billion tons of raw coal and 215 million tons of crude oil in 2015. Liu et al. (42) also reported that coal consumption increased significantly compared to LPG consumption from 2005 to 2018, which explains the decline in the contribution of transportation sources. The DRs of soil PAHs showed that PAHs in the soil in urban agglomerations in China from 2000 to 2020 were mainly derived from biomass, coal combustion, and traffic emission sources. From the period 2000 to 2010 to the period 2011 to 2020, the contribution of transportation sources decreased and the contribution of coal and biomass combustion sources increased.
3.2.2 PCA of soil PAHs
The principal component extraction results suggested that the top three principal components from 2000 to 2010 explained 47%, 30%, and 11% of the total variation, with a total of 88%, whereas the top four principal components from 2011 to 2020 explained 41%, 16%, 14%, and 12% of the total variation, with a total of 83%.
Table 4 shows that for the years 2000 to 2010, the first principal component included 14 PAHs. DahA, BbF, and BghiP are markers of gasoline vehicle emissions (43–45); Fla and Pyr have been widely regarded as tracers of coal burning (46); Chry and BaA are mainly from the process of coal burning (47); and Flu, Phe, and Ant are mainly from the coking process (48, 49). Thus, principal component 1 represents mixed sources of coal burning and traffic emission sources. The individual PHAs of the second principal component were mainly Fla, Pyr, BaA, Chry, BbF, Bkf, and Bap, which are considered as typical indicators of coal combustion and biomass combustion (50, 51). The second main component indicates the combustion of biomass and coal combustion sources. Nap and Ace are considered as indicators of the low-temperature diffusion of oil or other raw materials (coke oven, straw) (52, 53). Principal component 3 reflects the low-temperature combustion source of oil and other raw materials.
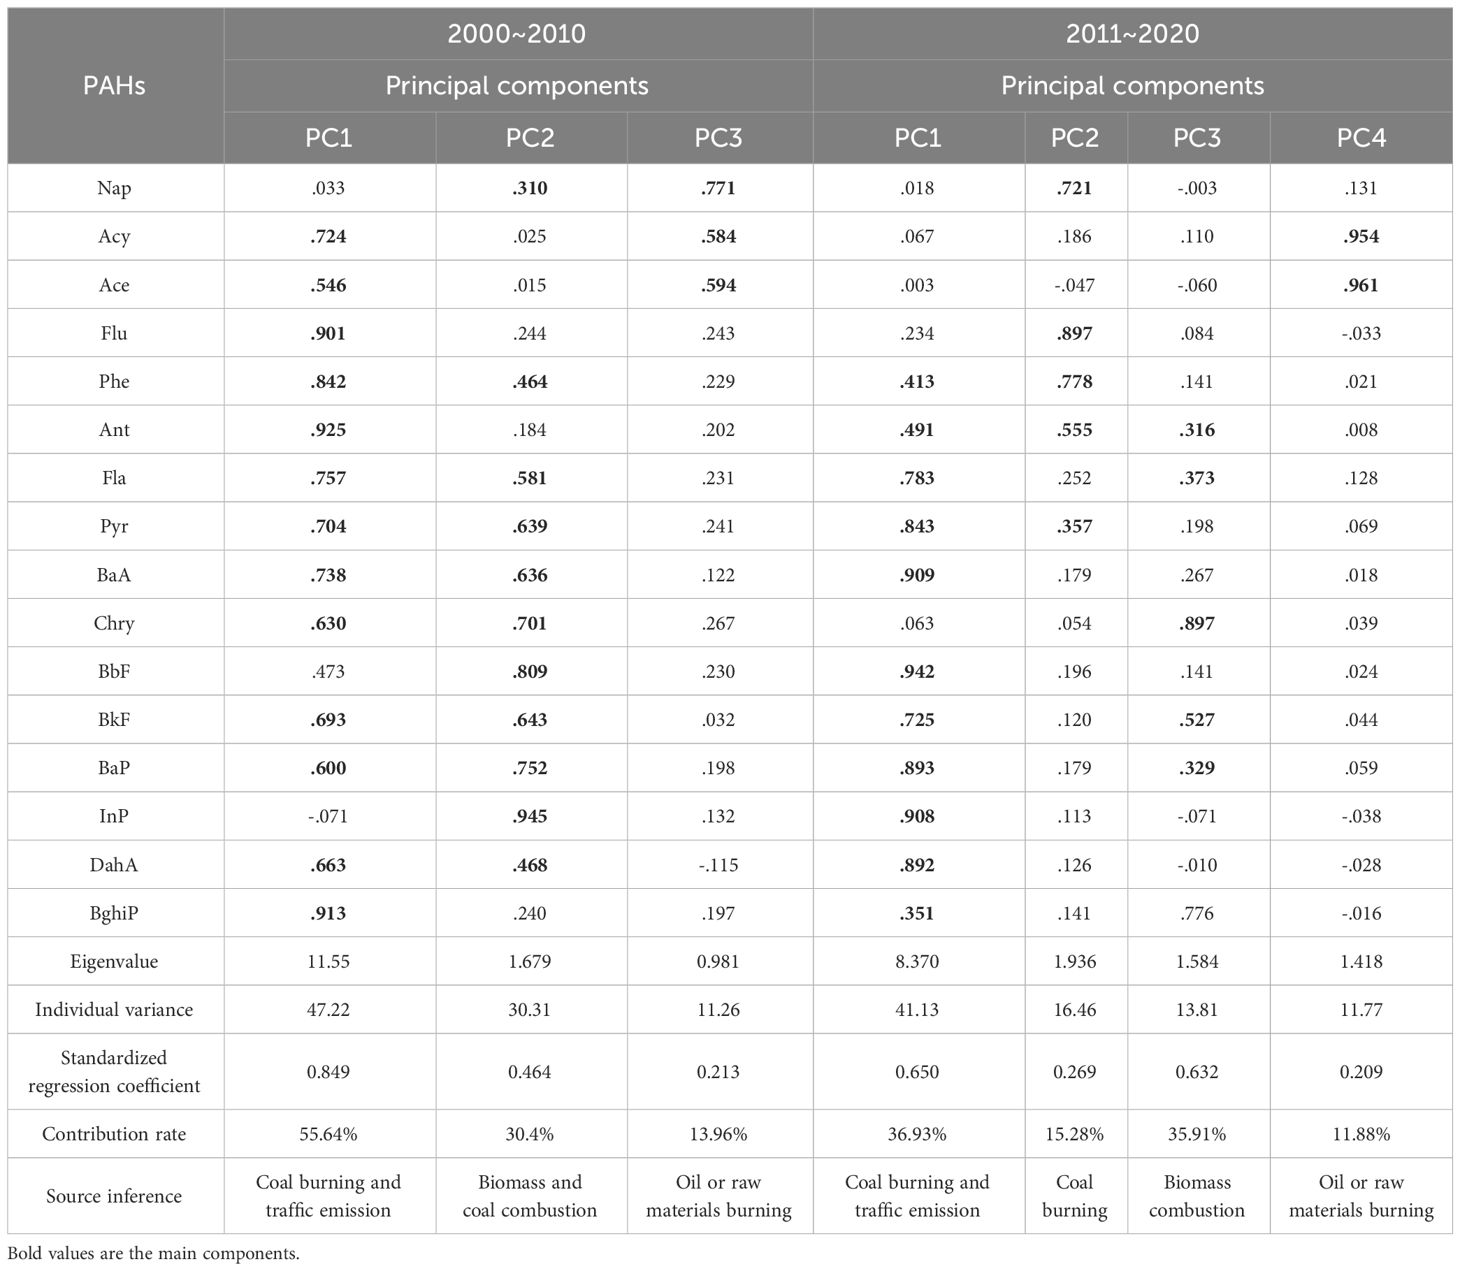
Table 4 Principal component extraction of individual PAHs from 2000 to 2020.
The first and fourth principal components from 2011 to 2020 were similar to the first and third principal components from 2000 to 2010, indicating mixed coal combustion and traffic emission sources and low-temperature combustion sources of petroleum or other raw materials. Flu, Phe, and Ant, in the 2nd principal component from 2011 to 2020, indicated the source of coal combustion. Ant, Fla, and Chry in the third principal component indicated the sources of biomass combustion sources (50, 51). The contribution rates of the PAH sources represented by the three principal components calculated according to the standardized regression coefficient were as follows: from 2000 to 2010, the sources of soil PAHs in urban agglomerations in China were mainly coal burning and traffic emission sources (56%), biomass and coal combustion sources (30%), and oil or raw materials burning at low temperatures (14%). From 2011 to 2020, the PAH sources were mainly coal burning and traffic emission sources (37%), coal burning (15%), biomass combustion (36%), and oil or raw materials burning at low temperatures (12%).
The sources of PAHs vary greatly in different cities owing to different modes of social and economic development. The sources of PAHs in the soil in Beijing were traffic source (54%) and combustion source (46%) (54). The soil PAHs sources in Nanjing were 55% from incomplete combustion of petroleum and coal and 19% from traffic (13). In Chengdu, soil PAHs sources were biomass combustion source 64%, petroleum combustion source 16%, and coking source 11% (21). Soil PAHs sources in Shenzhen were fossil fuel combustion source 60% and low-temperature diffusion source 40% (55). The PAHs sources in Lanzhou were fossil combustion source 55%, coking source 16%, and low temperature diffusion source 11% (56). Beijing was dominated by transportation sources; Nanjing, Shenzhen, and Lanzhou were dominated by fossil burning sources; and Chengdu was dominated by biomass burning sources. The proportion of transportation and industry in urban agglomerations, and differences in climate, such as the need for more coal heating in the north, led to differences in PAHs sources. In addition, differences caused by errors in sample selection and analysis should also be considered.
3.2.3 Influencing factors of soil PAHs pollution in urban agglomeration
Twenty-one indicators that may affect the accumulation of PAHs in soil were selected for this study, and the interpretation of each factor on the spatial differentiation of PAHs was studied through factor analysis using geographical detectors (q). As shown in Figure 4, the q value of each factor ranged from 0 to 1, with a higher q value indicating a stronger contribution of the factor to the spatial differentiation of the corresponding PAHs with different rings. Figure 4 shows that LPG consumption and the average elevation had a strong explanatory effect on the spatial distribution of two-ring PAHs from 2000 to 2010. Energy consumption had a strong contribution to the spatial differentiation of three-ring PAHs. Energy consumption, coal consumption, and total population had strong contributions to the spatial differentiation of five-ring PAHs. The consumption of crude oil, diesel oil, and the average annual precipitation explained the spatial differentiation of four- and six-ring PAHs. From 2011 to 2020, coal and fuel oil consumption had a strong contribution to the spatial differentiation of two-to-six-ring PAHs. Coke and crude oil consumption also significantly affected the spatial differentiation of PAHs. In addition, the consumption of gasoline and diesel oil and the proportion of clay and sand particles made strong contributions to the spatial differentiation of two-ring PAHs. The consumption of energy, electricity, and diesel oil and the proportion of clay and sand particles were strong contributors to the spatial differentiation of five-ring PAHs. The consumption of coke, crude oil, coal, and fuel oil explained the spatial differentiation of the three-to-six-ring PAHs. The findings are in line with previous studies on the sources of PAHs (26, 57). In the period from 2000 to 2010, the factors affecting the spatial distribution of PAHs were relatively complex. However, from 2011 to 2020, the factors influencing the spatial variation of PAHs became more consistent and were primarily attributed to the consumption of coke, crude oil, coal, and fuel oil. This shift may be attributed to improved urban environmental management, which has eliminated some factors that could influence the spatial variation of PAHs. The remaining impact factors pose significant challenges that require attention and resolution.
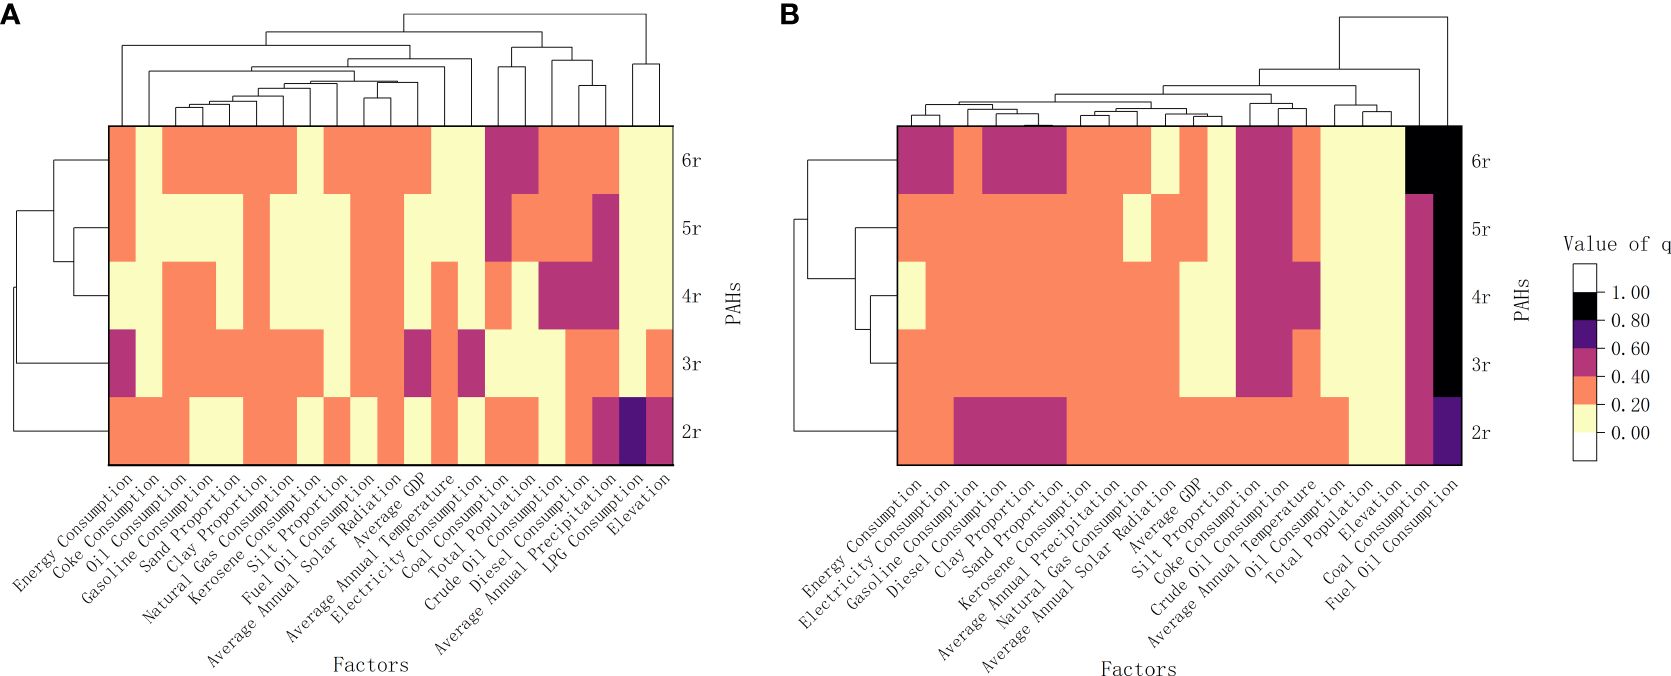
Figure 4 Interpretation of spatial differentiation of 2~6 ring PAHs by energy consumption and environmental factors.
3.3 Ecological risk assessment
Figure 5 shows the ecological risk assessment results for PAHs in the urban agglomerations. The single PAHs with a high risk were Nap, Phe, Ant, BaA, Chry, and BghiP, and these were concentrated in the coastal areas of Guangdong and Zhejiang, Harbin-Changchun, south-central Liaoning, Ningxia Yanhuang, and the northern slope of Tianshan Mountain. Phe, Ant, and BaA may be indicators of coke and coal sources (52, 53), which is consistent with the fact that the urban agglomerations of Harbin-Changchun and central and southern Liaoning are in the old industrial base of northeast China and have strong coal burning and industrial activities. NAP is considered an indicator of the low-temperature diffusion of oil or other raw materials, and the large number of oilfields in areas such as Ningxia may be one of the reasons for the high ecological risk of NAP in this region (39). Individual PAHs at moderate pollution levels are mainly four-to-five-ring PAHs, and these PAHs are mostly related to coal and biomass combustion. The ecological risk analysis of Σ16PAHs showed that approximately 80% of urban agglomerations had a medium-high ecological risk (M2) from 2000 to 2010, and approximately 72% of urban agglomerations had a medium-high ecological risk (M2) from 2011 to 2020.
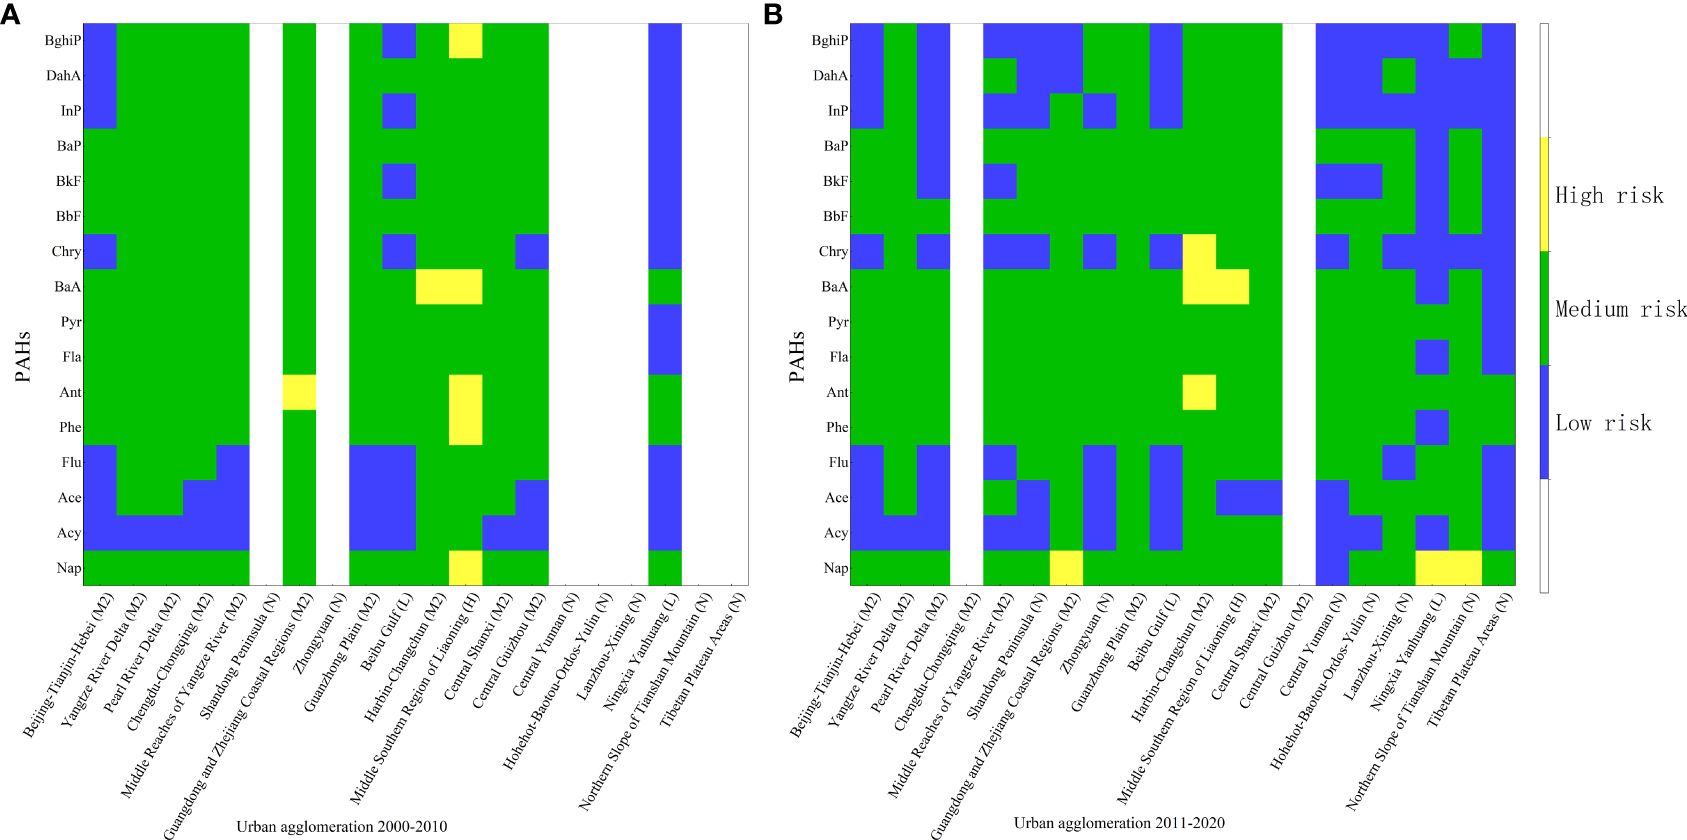
Figure 5 Ecological risk of PAHs in urban agglomerations.
4 Conclusions
The collation of PAH-related data from the literature for 20 urban agglomerations in China showed that the average content of soil Σ16PAHs was 2,439 ng·g-1 from 2011 to 2020, representing a ~28% decrease compared to 2000 to 2010. Urban agglomerations with soil PAH contamination levels greater than 1,000 ng·g-1 were distributed in both northern and southern China from 2000 to 2010, changing to a distribution in northern China from 2011 to 2020. More than 85% of the soil PAHs in urban agglomerations in China from 2000 to 2010 were at medium-to-high pollution levels, and this changed to 73% from 2011 to 2020. The soil PAHs in the 20 urban agglomerations were mainly HMW PAHs (49%) and MMW PAHs (32%) from 2000 to 2010, whereas from 2011 to 2020, LMW, MMW, and HMW PAHs were present in the soil at approximately 30% each. The DRs showed that most urban agglomerations in China were affected by PAHs produced by coal and biomass combustion. The InP/(InP + BghiP) ratio showed that the sources of soil PAHs in some urban agglomerations were mainly traffic emissions. PCA showed that coal burning and traffic sources have long been the main causes of the accumulation of soil PAHs in urban agglomerations in China. GeoDetect also found that coal and fuel oil consumption were the main factors affecting the spatial differentiation of PAHs. The PAHs at an intermediate risk were mainly four-to-five-ring PAHs, which are associated with coal and biomass combustion. The ecological risk assessment of Σ16PAHs showed that approximately 80% and 72% of urban agglomerations had a medium-high ecological risk from 2000 to 2010 and 2011 to 2020, respectively.
5 Limitations and implications
This study has expanded from previous studies on a limited number of cities to urban agglomerations in China and has expanded from a few factors affecting PAHs in the past to an analysis of 21 factors related to PAHs soil accumulation, providing new insights into PAHs accumulation in soil and contributing to the maintenance of environmental equity on a larger scale. However, this study has some limitations. Firstly, in the material process of this study, there were some uncertainties in the data collection. In this study, the article selection process only considered whether to list the monomer PAH content without further standardization of quality control. Secondly, owing to the lack of suitable research, only 122 valid studies were included in this study, and comparisons between 2000 to 2010 and 2011 to 2020 were lacking in some areas. Finally, there are differences in the extraction methods for PAHs in soil samples, which have an impact on data quality. In future studies, it is suggested that researchers list the sampling time, location, and depth in detail, which is convenient for communication and reference. In addition, the contents, and sources of PAHs in remote areas, such as Kashgar, Xinjiang, require more attention.
Data availability statement
The original contributions presented in the study are included in the article/Supplementary Material, further inquiries can be directed to the corresponding author.
Author contributions
HG: Conceptualization, Data curation, Formal analysis, Visualization, Writing – original draft, Writing – review & editing. ZW: Funding acquisition, Investigation, Methodology, Project administration, Resources, Writing – review & editing. GG: Resources, Software, Supervision, Validation, Writing – original draft. ZZ: Data curation, Resources, Software, Writing – original draft.
Funding
The author(s) declare financial support was received for the research, authorship, and/or publication of this article. This work was only supported by the Study of Assessment and Spatial Supporting Framework of Railway Green Corridor in the City Responding to Cultural Ecosystem Service: A Case Study of Beijing (No.52078026).
Conflict of interest
The authors declare that the research was conducted in the absence of any commercial or financial relationships that could be construed as a potential conflict of interest.
Publisher’s note
All claims expressed in this article are solely those of the authors and do not necessarily represent those of their affiliated organizations, or those of the publisher, the editors and the reviewers. Any product that may be evaluated in this article, or claim that may be made by its manufacturer, is not guaranteed or endorsed by the publisher.
Supplementary material
The Supplementary Material for this article can be found online at: https://www.frontiersin.org/articles/10.3389/fsoil.2024.1337656/full#supplementary-material
References
1. Prasse C, Zech W, Itanna F, Glaser B. Contamination and source assessment of metals, polychlorinated biphenyls, and polycyclic aromatic hydrocarbons in urban soils from Addis Ababa, Ethiopia. Toxicol Environ Chem. (2012) 94:1954–79. doi: 10.1080/02772248.2012.737794
2. Liang M, Liang H, Rao Z, Hong X. Characterization of polycyclic aromatic hydrocarbons in urban-rural integration area soil, North China: Spatial distribution, sources and potential human health risk assessment. Chemosphere. (2019) 234:875–84. doi: 10.1016/j.chemosphere.2019.06.119
3. Xia Z, Duan X, Tao S, Qiu W, Liu D, Wang Y, et al. Pollution level, inhalation exposure and lung cancer risk of ambient atmospheric polycyclic aromatic hydrocarbons (PAHs) in Taiyuan, China. Environ pollut. (2013) 173:150–6. doi: 10.1016/j.envpol.2012.10.009
4. Shen H, Tao S, Liu J, Huang Y, Chen H, Li W, et al. Global lung cancer risk from PAH exposure highly depends on emission sources and individual susceptibility. Sci Rep. (2014) 4:6561. doi: 10.1038/srep06561
5. Abbas I, Badran G, Verdin A, Ledoux F, Roumié M, Courcot D, et al. Polycyclic aromatic hydrocarbon derivatives in airborne particulate matter: sources, analysis and toxicity. Environ Chem Lett. (2018) 16:439–75. doi: 10.1007/s10311-017-0697-0
6. Berthiaume A, Galarneau E, Marson G. Polycyclic aromatic compounds (PACs) in the Canadian environment: Sources and emissions. Environ pollut. (2021) 269:116008. doi: 10.1016/j.envpol.2020.116008
7. Yang Y, Tao S, Zhang N, Zhang DY, Li XQ. The effect of soil organic matter on fate of polycyclic aromatic hydrocarbons in soil: A microcosm study. Environ pollut. (2010) 158:1768–74. doi: 10.1016/j.envpol.2009.11.010
8. Xia W, Liang B, Chen L, Zhu Y, Gao M, Chen J, et al. Atmospheric wet and dry depositions of polycyclic aromatic compounds in a megacity of Southwest China. Environ Res. (2022) 204:112151. doi: 10.1016/j.envres.2021.112151
9. Liu Q, Wu Y, Zhou Y, Li X, Yang S, Chen Y, et al. A novel method to analyze the spatial distribution and potential sources of pollutant combinations in the soil of Beijing urban parks. Environ pollut. (2021) 284:117191. doi: 10.1016/j.envpol.2021.117191
10. Chen R, Lv JG, Zhang W, Liu S, Feng JM. Polycyclic aromatic hydrocarbon (PAH) pollution in agricultural soil in Tianjin, China: a spatio-temporal comparison study. Environ Earth Sci. (2015) 74:2743–8. doi: 10.1007/s12665-015-4593-2
11. Wang XT, Chen L, Wang XK, Lei BL, Sun YF, Zhou J, et al. Occurrence, sources and health risk assessment of polycyclic aromatic hydrocarbons in urban (Pudong) and suburban soils from Shanghai in China. Chemosphere. (2015) 119:1224–32. doi: 10.1016/j.chemosphere.2014.10.019
12. Ma L, Li YH, Yao L, Du HM. Polycyclic aromatic hydrocarbons in soil-turfgrass systems in urban Shanghai: Contamination profiles, in situ bioconcentration and potential health risks. J Clean Prod.. (2021) 289:125833. doi: 10.1016/j.jclepro.2021.125833
13. Yang J, Yu F, Yu Y, Zhang J, Wang R, Srinivasulu M, et al. Characterization, source apportionment, and risk assessment of polycyclic aromatic hydrocarbons in urban soil of Nanjing, China. J Soils Sediments. (2016) 17:1116–25. doi: 10.1007/s11368-016-1585-0
14. Wang CH, Zhou SL, Tang JH, Li Y, Li HX, Du J, et al. Elemental carbon components and PAHs in soils from different areas of the Yangtze River Delta region, China and their relationship. Catena. (2021) 199:105086. doi: 10.1016/j.catena.2020.105086
15. Cao H, Chao S, Qiao L, Jiang Y, Zeng X, Fan X. Urbanization-related changes in soil PAHs and potential health risks of emission sources in a township in Southern Jiangsu, China. Sci Total Environ. (2017) 575:692–700. doi: 10.1016/j.scitotenv.2016.09.106
16. Yao H, Zhang SC, Liu ML, Wang J, Lu YT, Yu XH. Sources and risk assessment of Polycyclic Aromatic Hydrocarbons from the urbanization process of topsoil. Huan Jing Ke Xue. (2018) 39:889–98. doi: 10.13227/j.hjkx.201705178
17. Li Y, Liu M, Li R, Sun P, Xia H, He T. Polycyclic aromatic hydrocarbons in the soils of the Yangtze River Delta Urban Agglomeration, China: Influence of land cover types and urbanization. Sci Total Environ. (2020) 715:137011. doi: 10.1016/j.scitotenv.2020.137011
18. Idowu O, Semple KT, Ramadass K, O’connor W, Hansbro P, Thavamani P. Analysis of polycyclic aromatic hydrocarbons (PAHs) and their polar derivatives in soils of an industrial heritage city of Australia. Sci Total Environ. (2020) 699:134303. doi: 10.1016/j.scitotenv.2019.134303
19. Jia T, Guo W, Xing Y, Lei R, Wu X, Sun S, et al. Spatial distributions and sources of PAHs in soil in chemical industry parks in the Yangtze River Delta, China. Environ pollut. (2021) 283:117121. doi: 10.1016/j.envpol.2021.117121
20. Peng J, Chen Y, Xia Q, Rong G, Zhang J. Ecological risk and early warning of soil compound pollutants (HMs, PAHs, PCBs and OCPs) in an industrial city, Changchun, China. Environ pollut. (2021) 272:116038. doi: 10.1016/j.envpol.2020.116038
21. Zheng H, Xing X, Hu T, Zhang Y, Zhang J, Zhu G, et al. Biomass burning contributed most to the human cancer risk exposed to the soil-bound PAHs from Chengdu Economic Region, western China. Ecotoxicol Environ Saf. (2018) 159:63–70. doi: 10.1016/j.ecoenv.2018.04.065
22. Wu ZW, Duan YH, Liu LW, Xu LS, Yao XH, Chen XL. Characteristics of polycyclic aromatic hydrocarbons in the soils of different functional areas of a typical industrial capital city, Taiyuan, Shanxi province, China. J Soils Sediments. (2023) 23:1315–31. doi: 10.1007/s11368-022-03379-6
23. Maliszewska-Kordybach B. Polycyclic aromatic hydrocarbons in agricultural soils in Poland: preliminary proposals for criteria to evaluate the level of soil contamination. Appl Geochem.. (1996) 11:121–7. doi: 10.1016/0883-2927(95)00076-3
24. Gong P, Zhang S, Wang WZ. The evolutionary characteristics and space-temporal pattern of China urban shrinkage from the perspective of population: Based on analysis of the Seventh National Census Bulletin data. Population Economics. (2022) 1-15.
25. Guo R, Sun Y, Fan J. Policies on catogarized goverance of China Urban agglomerations in 14th Five-Year Plan. Bull Chin Acad Sci. (2020) 35:844–54. doi: 10.16418/j.issn.1000-3045.20200408001
26. Li Y, Li Y, Huang Y, He T, Jin R, Han M, et al. An improved hybrid model on source-risk of polycyclic aromatic hydrocarbon in soils of the Yangtze River Delta urban agglomeration. Sci total Environ. (2022) 857:159336–6. doi: 10.1016/j.scitotenv.2022.159336
27. Zhang Y, Guo Z, Peng C, He Y. Introducing a land use-based weight factor in regional health risk assessment of PAHs in soils of an urban agglomeration. Sci total Environ. (2023) 887:163833–3. doi: 10.1016/j.scitotenv.2023.163833
28. Abdel-Shafy HI, Mansour MSM. A review on polycyclic aromatic hydrocarbons: Source, environmental impact, effect on human health and remediation. Egyptian J Petroleum. (2016) 25:107–23. doi: 10.1016/j.ejpe.2015.03.011
29. Yin H, Xu L. Comparative study of PM10/PM2.5-bound PAHs in downtown Beijing, China: Concentrations, sources, and health risks. J Clean Prod.. (2018) 177:674–83. doi: 10.1016/j.jclepro.2017.12.263
30. Wang CH, Wu SH, Zhou SL, Sill YX, Song J. Characteristics and source identification of polycyclic aromatic hydrocarbons (PAHs) in urban soils: A review. Pedosphere. (2017) 27:17–26. doi: 10.1016/S1002-0160(17)60293-5
31. Bao H, Hou S, Niu H, Tian K, Liu X, Wu F. Status, sources, and risk assessment of polycyclic aromatic hydrocarbons in urban soils of Xi’an, China. Environ Sci pollut Res Int. (2018) 25:18947–59. doi: 10.1007/s11356-018-1928-z
32. Wang H, Wu Q, Hu W, Huang B, Dong L, Liu G. Using multi-medium factors analysis to assess heavy metal health risks along the Yangtze River in Nanjing, Southeast China. Environ pollut. (2018) 243:1047–56. doi: 10.1016/j.envpol.2018.09.036
33. Ma Y, Li Y, Fang T, He Y, Wang J, Liu X, et al. Analysis of driving factors of spatial distribution of heavy metals in soil of non-ferrous metal smelting sites: Screening the geodetector calculation results combined with correlation analysis. J Hazard Mater. (2023) 445:130614. doi: 10.1016/j.jhazmat.2022.130614
34. Xu Y, Bi R, Li Y. Effects of anthropogenic and natural environmental factors on the spatial distribution of trace elements in agricultural soils. Ecotoxicol Environ Saf. (2023) 249:114436. doi: 10.1016/j.ecoenv.2022.114436
35. Liang J, Liu Z, Tian Y, Shi H, Fei Y, Qi J, et al. Research on health risk assessment of heavy metals in soil based on multi-factor source apportionment: A case study in Guangdong Province, China. Sci Total Environ. (2023) 858:159991. doi: 10.1016/j.scitotenv.2022.159991
36. Xia X, Liu Y, Zhang Z, Xi N, Bao J, Yang Z. Soil PAH concentrations decrease in China in response to the adjustment of the energy structure during the past two decades. Engineering. (2023) 21:115–23. doi: 10.1016/j.eng.2021.11.023
37. Yin K, Wang R, Yao L, Liang J. Evaluation of ecological efficiency of China’s environmental protection model city. Acta Ecologica Sin. (2011) 31:5588–98.
38. Liu H, Yu X, Liu Z, Sun Y. Occurrence, characteristics and sources of polycyclic aromatic hydrocarbons in arable soils of Beijing, China. Ecotoxicol Environ Saf. (2018) 159:120–6. doi: 10.1016/j.ecoenv.2018.04.069
39. Li T, Li W, Yuan C, Tao S. Distribution of Polycyclic Aromatic hydraocarbons in surface soil of Yinchuan plain and surrounding areas. J Agro-Environment Sci. (2014) 33:2136–42.
40. China, N.B.O.S.O.T.P.S.R.O. Statistical bulletin of the people’s republic of China on national economic and social development in 2005. People’s Daily. (2005), 2006–03-01.
41. China, N.B.O.S.O.T.P.S.R.O. Statistical bulletin of the people’s republic of China on national economic and social development in 2015. People’s Daily. (2015), 2016–03-01.
42. Liu Z, Fan J, Wang H. Impact of evolution of China’s residents’ energy consumption structure on carbon peak. J Henan Polytechnic University(Social Science). (2022) 23:41–9. doi: 10.16698/j.hpu(social.sciences).1673-9779.2022.05.007
43. Khalili NR, Scheff PA, Holsen TM. Pah source fingerprints for coke ovens, diesel and gasoline-engines, highway tunnels, and wood combustion emissions. Atmospheric Environ. (1995) 29:533–42. doi: 10.1016/1352-2310(94)00275-P
44. Larsen RK 3rd, Baker JE. Source apportionment of polycyclic aromatic hydrocarbons in the urban atmosphere: a comparison of three methods. Environ Sci Technol. (2003) 37:1873–81. doi: 10.1021/es0206184
45. Liu GR, Peng X, Wang RK, Tian YZ, Shi GL, Wu JH, et al. A new receptor model-incremental lifetime cancer risk method to quantify the carcinogenic risks associated with sources of particle-bound polycyclic aromatic hydrocarbons from Chengdu in China. J Hazard Mater. (2015) 283:462–8. doi: 10.1016/j.jhazmat.2014.09.062
46. Aydin YM, Kara M, Dumanoglu Y, Odabasi M, Elbir T. Source apportionment of polycyclic aromatic hydrocarbons (PAHs) and polychlorinated biphenyls (PCBs) in ambient air of an industrial region in Turkey. Atmospheric Environ. (2014) 97:271–85. doi: 10.1016/j.atmosenv.2014.08.032
47. Sofowote UM, Mccarry BE, Marvin CH. Source apportionment of PAH in Hamilton Harbour suspended sediments: comparison of two factor analysis methods. Environ Sci Technol. (2008) 42:6007–14. doi: 10.1021/es800219z
48. Mu L, Peng L, Cao JJ, He QS, Li F, Zhang JQ, et al. Emissions of polycyclic aromatic hydrocarbons from coking industries in China. Particuology. (2013) 11:86–93. doi: 10.1016/j.partic.2012.04.006
49. Wang XT, Miao Y, Zhang Y, Li YC, Wu MH, Yu G. Polycyclic aromatic hydrocarbons (PAHs) in urban soils of the megacity Shanghai: occurrence, source apportionment and potential human health risk. Sci Total Environ. (2013) 447:80–9. doi: 10.1016/j.scitotenv.2012.12.086
50. Agarwal T, Khillare PS, Shridhar V, Ray S. Pattern, sources and toxic potential of PAHs in the agricultural soils of Delhi, India. J Hazard Mater. (2009) 163:1033–9. doi: 10.1016/j.jhazmat.2008.07.058
51. Cvetkovic A, Jovasevic-Stojanovic M, Markovic D, Ristovski Z. Concentration and source identification of polycyclic aromatic hydrocarbons in the metropolitan area of Belgrade, Serbia. Atmospheric Environ. (2015) 112:335–43. doi: 10.1016/j.atmosenv.2015.04.034
52. Lin C, Liu JL, Wang RM, Wang Y, Huang B, Pan XJ. Polycyclic Aromatic Hydrocarbons in surface soils of Kunming, China: Concentrations, distribution, sources, and potential risk. Soil Sediment Contamination. (2013) 22:753–66. doi: 10.1080/15320383.2013.768201
53. Lu XH, Gu AN, Zhang YW, Chu XY, Hu XF. Accumulation of PAHs of the soils and assessment of their health risks at a village with plastic manufacturing in Taizhou, Zhejiang Province, Southeast China. J Soils Sediments. (2020) 20:705–13. doi: 10.1007/s11368-019-02425-0
54. Liu S, Xia X, Yang L, Shen M, Liu R. Polycyclic aromatic hydrocarbons in urban soils of different land uses in Beijing, China: distribution, sources and their correlation with the city’s urbanization history. J Hazard Mater. (2010) 177:1085–92. doi: 10.1016/j.jhazmat.2010.01.032
55. Zhang D, Wang JJ, Zeng H. Soil polycyclic aromatic hydrocarbons across urban density zones in Shenzhen, China: occurrences, source apportionments, and spatial risk assessment. Pedosphere. (2016) 26:676–86. doi: 10.1016/S1002-0160(15)60076-5
56. Jiang Y, Yves UJ, Sun H, Hu X, Zhan H, Wu Y. Distribution, compositional pattern and sources of polycyclic aromatic hydrocarbons in urban soils of an industrial city, Lanzhou, China. Ecotoxicol Environ Saf. (2016) 126:154–62. doi: 10.1016/j.ecoenv.2015.12.037
57. Qi P, Qu C, Albanese S, Lima A, Cicchella D, Hope D, et al. Investigation of polycyclic aromatic hydrocarbons in soils from Caserta provincial territory, southern Italy: Spatial distribution, source apportionment, and risk assessment. J Hazard Mater. (2020) 383:121158. doi: 10.1016/j.jhazmat.2019.121158
Keywords: soil, PAHs, urban agglomeration, spatial and temporal distribution, ecological risk
Citation: Guo H, Wei Z, Guo G and Zhang Z (2024) Spatiotemporal distribution, sources, and ecological risk of soil polycyclic aromatic hydrocarbons in Chinese urban agglomerations from 2000 to 2020. Front. Soil Sci. 4:1337656. doi: 10.3389/fsoil.2024.1337656
Received: 15 November 2023; Accepted: 22 March 2024;
Published: 10 April 2024.
Edited by:
Jin Wang, Guangzhou University, ChinaReviewed by:
Leilei Xiang, Chinese Academy of Sciences (CAS), ChinaYazhu Wang, Chinese Academy of Sciences (CAS), China
Copyright © 2024 Guo, Wei, Guo and Zhang. This is an open-access article distributed under the terms of the Creative Commons Attribution License (CC BY). The use, distribution or reproduction in other forums is permitted, provided the original author(s) and the copyright owner(s) are credited and that the original publication in this journal is cited, in accordance with accepted academic practice. No use, distribution or reproduction is permitted which does not comply with these terms.
*Correspondence: Zesong Wei, d2VpemVzb25nYmp0dUAxMjYuY29t