 Shaima Khalifah
 Mary E. Foltz
- School of Civil and Environmental Engineering, Oklahoma State University, Stillwater, OK, United States
Nitrous oxide (N2O) is a potent greenhouse gas that contributes to stratospheric ozone depletion and global climate change. Soil denitrification has two potential end-products, N2O and dinitrogen (N2), and the ratio of these end-products (N2O:(N2O+N2) or the N2O ratio) is controlled by various factors. This study aims to quantify the influence of soil pH on the ratio of denitrification end-products in Oklahoma soils with different soil textures. Six natural grassland soils encompassing three distinct soil textures were incubated in the laboratory under natural and modified pH with an overall tested pH ranging from 2 to 10. Denitrification end-products were measured in the laboratory using the acetylene inhibition technique and further estimated using a process-based biogeochemical model. Both the laboratory and model results showed that soil pH and texture influenced the ratio of the denitrification end-products. Generally, as soil pH increased the N2O ratio decreased, although both lab and model results indicated that this relationship was not linear. Soil texture may have an indirect effect on the N2O ratio, as two soils of the same texture could have different N2O ratios. However, clay percentage of the soil did show a linear positive correlation with the N2O ratio, suggesting components of soil texture may be more influential than others. Overall, soil pH was a controlling factor in the ratio of denitrification end-products and the newly observed nonlinear relationship warrants further study, particularly when considering its effects in different soil textures.
Introduction
Nitrous oxide (N2O), methane (CH4), and carbon dioxide (CO2) are three major greenhouse gases, and their increasing atmospheric concentrations contribute to global climate change (1). N2O has the highest global warming potential, on a molecular basis, compared with CO2 and CH4 over a 100-year period (1). Aside from contributing to global warming, N2O also contributes to the depletion of the ozone layer by reacting with oxygen in the stratosphere and producing nitric oxide (NO) (2).
In natural and agricultural soils, the predominant sources of N2O emissions are microbial denitrification and nitrification, with 70% of the global N2O emissions sourced from those two processes (3, 4). Denitrification occurs by denitrifying bacteria and fungi as a reaction to the changes in the oxygen (O2) concentration in the microorganism’s immediate environment. Denitrifying bacteria use available nitrogen oxide compounds (i.e., nitrate (NO3-), nitrite (NO2-), NO, N2O) as electron acceptors to transfer from aerobic respiration to anaerobic respiration when there is a shortage of O2.
The gases produced during denitrification are NO, N2O, and N2 depending on the soil conditions and the microbial community. If N2O leaves the soil before being further reduced to N2, the denitrification process could be considered incomplete. The ratio of N2O produced to total denitrification, N2O:(N2O+N2) or the N2O ratio, indicates the completion state of denitrification where the value near zero means a more complete process (mostly N2) and the value near one is more incomplete (more N2O produced than N2) (5). A recent meta-analysis of laboratory denitrification experiments identified soil texture, soil pH, and experimental nutrient addition as the most important factors driving the N2O ratio (5).
Soil pH can have chemical, physical, and/or biological effects on the denitrification process (6). It has been shown that pH has a strong negative correlation with the N2O ratio across diverse soil conditions (5). A few studies have quantified a statistical relationship between pH and N2O ratio (7–9). Most denitrification experiments have been conducted across a narrow range of soil pH values (5–8), where denitrification activity is expected to occur (10–12). Yet, it has been demonstrated that denitrification can hold even at pH below 4 or above 10 when the environmental conditions, the availability of denitrifying microorganisms, soluble carbon, and oxidized forms of nitrogen are achieved (6, 13).
In addition to soil pH, soil texture was identified as one of the critical parameters to influence the N2O ratio in the meta-analysis (5). Soil texture plays a role in water-filled pore space and soil aeration, both of which influence nitrogen transformation processes, especially denitrification since it is related to the O2 concentration and the exchangeable gases between soil and the atmosphere. The concentration of the O2 in soils depends on the soil water content and the organic matter that is decomposed by soil microorganisms. When there is rainfall, the soil becomes temporarily anaerobic. The amplitude and duration of anaerobiosis vary between soils based on the soil type which affects the emission of N2O (14). A few studies have considered the relationship between texture and N2O flux (15), denitrification rate (16), or the NO/N2O ratio (17). However, to our knowledge, no experimental studies have specifically investigated the influence of soil texture on the N2O ratio.
Investigating the influence of environmental factors (e.g., soil pH and texture) on the N2O ratio is key to improving mitigation tools for N2O emissions. The aims of the present study are (i) to quantify the relationship between soil pH and the N2O ratio, (ii) to determine how soil texture influences denitrification and the N2O ratio, and (iii) to evaluate a biogeochemical process-based model for predictions of these relationships.
Materials and methods
Site description
Six natural grasslands from different parts of Oklahoma state were selected based on variations of soil texture and natural soil pH that were estimated using the Web Soil Survey (18). At each site, soil was collected with at least three replicate cores from depth of 0-20 cm using an auger (~7 cm diameter) and excluded from the grass layer. Sites were located in five Oklahoma counties: Payne (36.10148˚ N, 97.02154˚ W), Woods (36.48580˚ N,98.67465˚ W), Grant (36.95469˚ N, 98.0723˚ W), Creek (36.04272˚ N, 96.04131˚ W), and Canadian (35.41260˚ N, 97.75520˚ W). Soil type by county can be found in the Supplementary Material.
Soil sampling and analysis
The collected samples of each site were mixed and stored (<2 weeks) at 4°C until further analysis at the Advanced Technology Research Center (ATRC, Stillwater, OK). The natural soil pH was recorded by using pH probe (Oakton pH/Ion 700). Soil pH was measured after approximately half an hour of slurry preparation to allow the ions to release in solution. Soil moisture content was measured as the percent change in mass after oven drying at 105˚C for at least 24-hours. A portion of each soil was also tested at the Soil, Water and Forage Analytical Laboratory (SWFAL, Stillwater, OK) for soil texture, nitrate (NO3-) concentration, and soil organic matter (OM) (Table 1). Soil texture was reported using the United States Department of Agriculture (USDA) soil texture classification (texture triangle) based on the percentages clay, silt, and sand determined by SWFAL using the hydrometer method. Nitrate (as NO3–-N) was determined at SWFAL after nitrate extraction (with potassium chloride) using the cadmium reduction method on a flow-injection analyzer. OM was determined at SWFAL with a Leco carbon/nitrogen combustion analyzer and calculated based on carbon content. All SWFAL analysis were done in duplicate with values reported as the average of the analytical replicates.
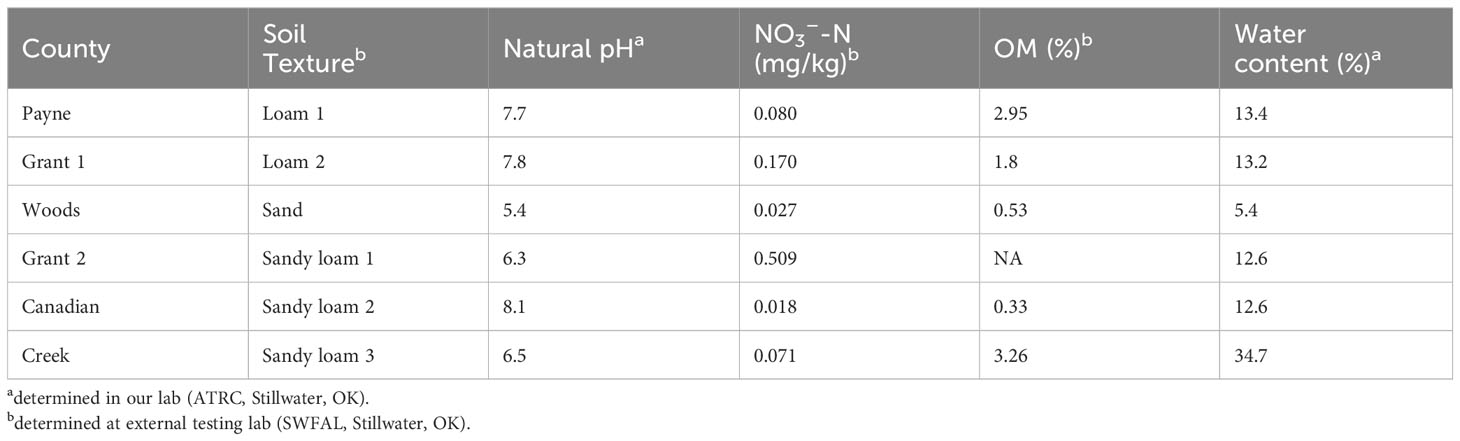
Table 1 Soil sample properties by sample location (county).
Soil pH adjustment determination
Preliminary experiments were conducted to adjust the soil pH from the natural pH value to the range of 2-10. For each soil type, 25 g of fresh soil samples are mixed with 25 mL of deionized water to prepare the soil slurry. Potassium hydroxide (KOH) was the strong base utilized to increase the soil pH, while sulfuric acid (H2SO4) was the strong acid utilized to decrease the soil pH. Different concentrations of acid/base solution were added to the soil gradually and the pH of the solution was recorded for each additive to find the exact concentration needed for each desired experimental soil pH from 2-10. These recorded additions were used in subsequent pH altered assays described below. Although pH adjustment using H2SO4 and KOH can have some effects on nutrient availability and microbial activity (19), the method has been used in similar studies for which these results are compared (7, 20).
Denitrification potential assays
The denitrifying enzyme activity (DEA) assay was applied to determine the denitrification potential and N2O production potential using variations of the acetylene inhibition technique (21), amended from (22). Triplicate samples were prepared by adding 25 g of soil into each 125 mL Wheaton glass jars sealed with cap and septa. A concentrated nutrient solution was prepared by adding 25 g D-glucose and 3.6 g potassium nitrate (KNO3) to 1000 mL of deionized water. A total of 5 mL of this nutrient solution was included in each total solution (total volume 25 mL) to be added to the soil samples. Separate solutions were prepared for each pH adjustment using the amount of acid or base calculated previously to adjust the soil pH to the appropriate value. After a short overnight incubation period to get the soil to room temperature, the assays were initiated by adding 25 mL of the combined nutrient and pH adjustment solutions to each bottle with soil. Soil pH was measured at the beginning of the assay with the pH probe. The bottles were sealed and flushed with N2 gas for two minutes. Acetylene gas (20 mL) was injected to half of the sample jars to measure the total denitrification by blocking the final step of denitrification (N2O to N2). The remaining half of sample jars were injected with 20 mL of N2 gas to measure N2O production. The initial time was recorded after shaking the sealed sample jars for 30 sec. Gas samples were collected from the headspace after 2, 3, 4, and 5 hours from the initial time. The gas samples were analyzed using a gas chromatograph (Agilent 8890) with electron capture detector (ECD) and autosampler (PAL3 Series II Autosampler Systems). Using N2O concentration change over time, the ideal gas law, and soil moisture, considering the effects of dilution and dissolved N2O, the potential denitrification and N2O production potential rates were calculated. The N2O production potential was divided by the denitrification potential to calculate the N2O ratio, consistent with the approach used previously (5).
Biogeochemical process-based modeling
The DeNitrification-DeComposition (DNDC) model (version 9.5) is a process-based model established to simulate carbon (C) and nitrogen (N) biogeochemistry in agroecosystems (23, 24). The DNDC model combines decomposition, nitrification, denitrification, crop growth, and fermentation processes to predict C and N movement and transformation in agricultural soils. The model utilizes the basic laws of physics, chemistry, and biology in addition to some empirical equations obtained from statistical analysis of experimental data. The three main input categories are climate, soil, and cropping. Outputs of interest in this study were soil N2O and N2 fluxes, which together were used to calculate the N2O ratio (N2O:(N2O+N2)) for comparison with lab estimates.
Climate data were extracted from the Mesonet network of environmental monitoring stations (25). Data included measured values of maximum and minimum air temperature, precipitation, wind speed, radiation, and relative humidity for 11 years from 2011 to 2022 for the weather stations closest to each field site. Atmospheric CO2 concentrations were obtained from the National Oceanic and Atmospheric Administration (NOAA) Global Monitoring Laboratory (26). Nitrogen concentration in rainfall was estimated as the average total nitrogen deposition divided by annual precipitation, both obtained from the National Atmospheric Deposition Program (27). Many soil input parameters were obtained directly from the laboratory measurements (Table 1) of the soil samples such as soil texture, pH, organic matter, and clay percentage. Soil parameters with direct measurements unavailable (e.g., bulk density, slope) were obtained from the Web Soil Survey (18). Published data were used for soil conductivity, wilting point, and field capacity specific to each site (28). Land management was kept constant between all systems as a continuous perennial grass crop without harvesting.
To estimate the relationship between soil pH and N2O ratio, the only variable of each site-specific model run modified was the soil pH from 2-10 to match that of the laboratory measurements. The effect of soil texture on the N2O ratio was estimated by the same technique, where all factors except soil texture were kept constant. Modifying soil texture in the model automatically modified related parameters (i.e., clay percentage, conductivity, porosity, field capacity). From each model run, the values of N2O and N2 on the specific soil sampling date were used to calculate the N2O ratio (N2O:(N2O+N2)) for comparison with lab measurements. Model performance was assessed using graphical analysis of modeled versus measured N2O ratios.
Statistical analysis
Triplicate samples were used in all experiments (except those done at SWFAL) so the mean and standard deviation could be calculated for reported data and figures. Raw data, including replicates, were used in statistical analysis in R version 4.2.2 (29). Analysis of Variance (ANOVA) was used to model variability in data, followed by mean separation with Fisher’s Least Significant Difference (LSD) test (α=0.05). Data normality was assessed visually via the histogram of ANOVA model residuals and Shapiro-Wilk normality test. The relationship between pH and the N2O ratio was assessed by first fitting linear and polynomial models in R. Then lack of fit was applied to compare full and reduced models and identify the best model fit for the data.
Results
Denitrification potential assays
The denitrification potential was measured under natural and modified pH for four of the sites (Figure 1). The highest denitrification rate was found at the natural soil pH, with values ranging from 136-640 ng N g-1 dry soil h-1. Of the four soils, the loam from Payne County had significantly higher denitrification potential than the other three soils (ANOVA & LSD, P<0.001), although the higher rate there could not be linked to pH or texture, as a similar natural pH and texture soil (Grant County) had significantly lower denitrification. Instead, the higher denitrification rate observed in the Payne County loam may be related to organic matter, as it had almost twice as much organic matter of the similar texture and pH soil from Grant County. Considering potential for N2O emissions, the N2O production rates were significantly higher from pH 5 to 7 regardless of the differences in the natural pH of each soil (ANOVA & LSD, P<0.001).
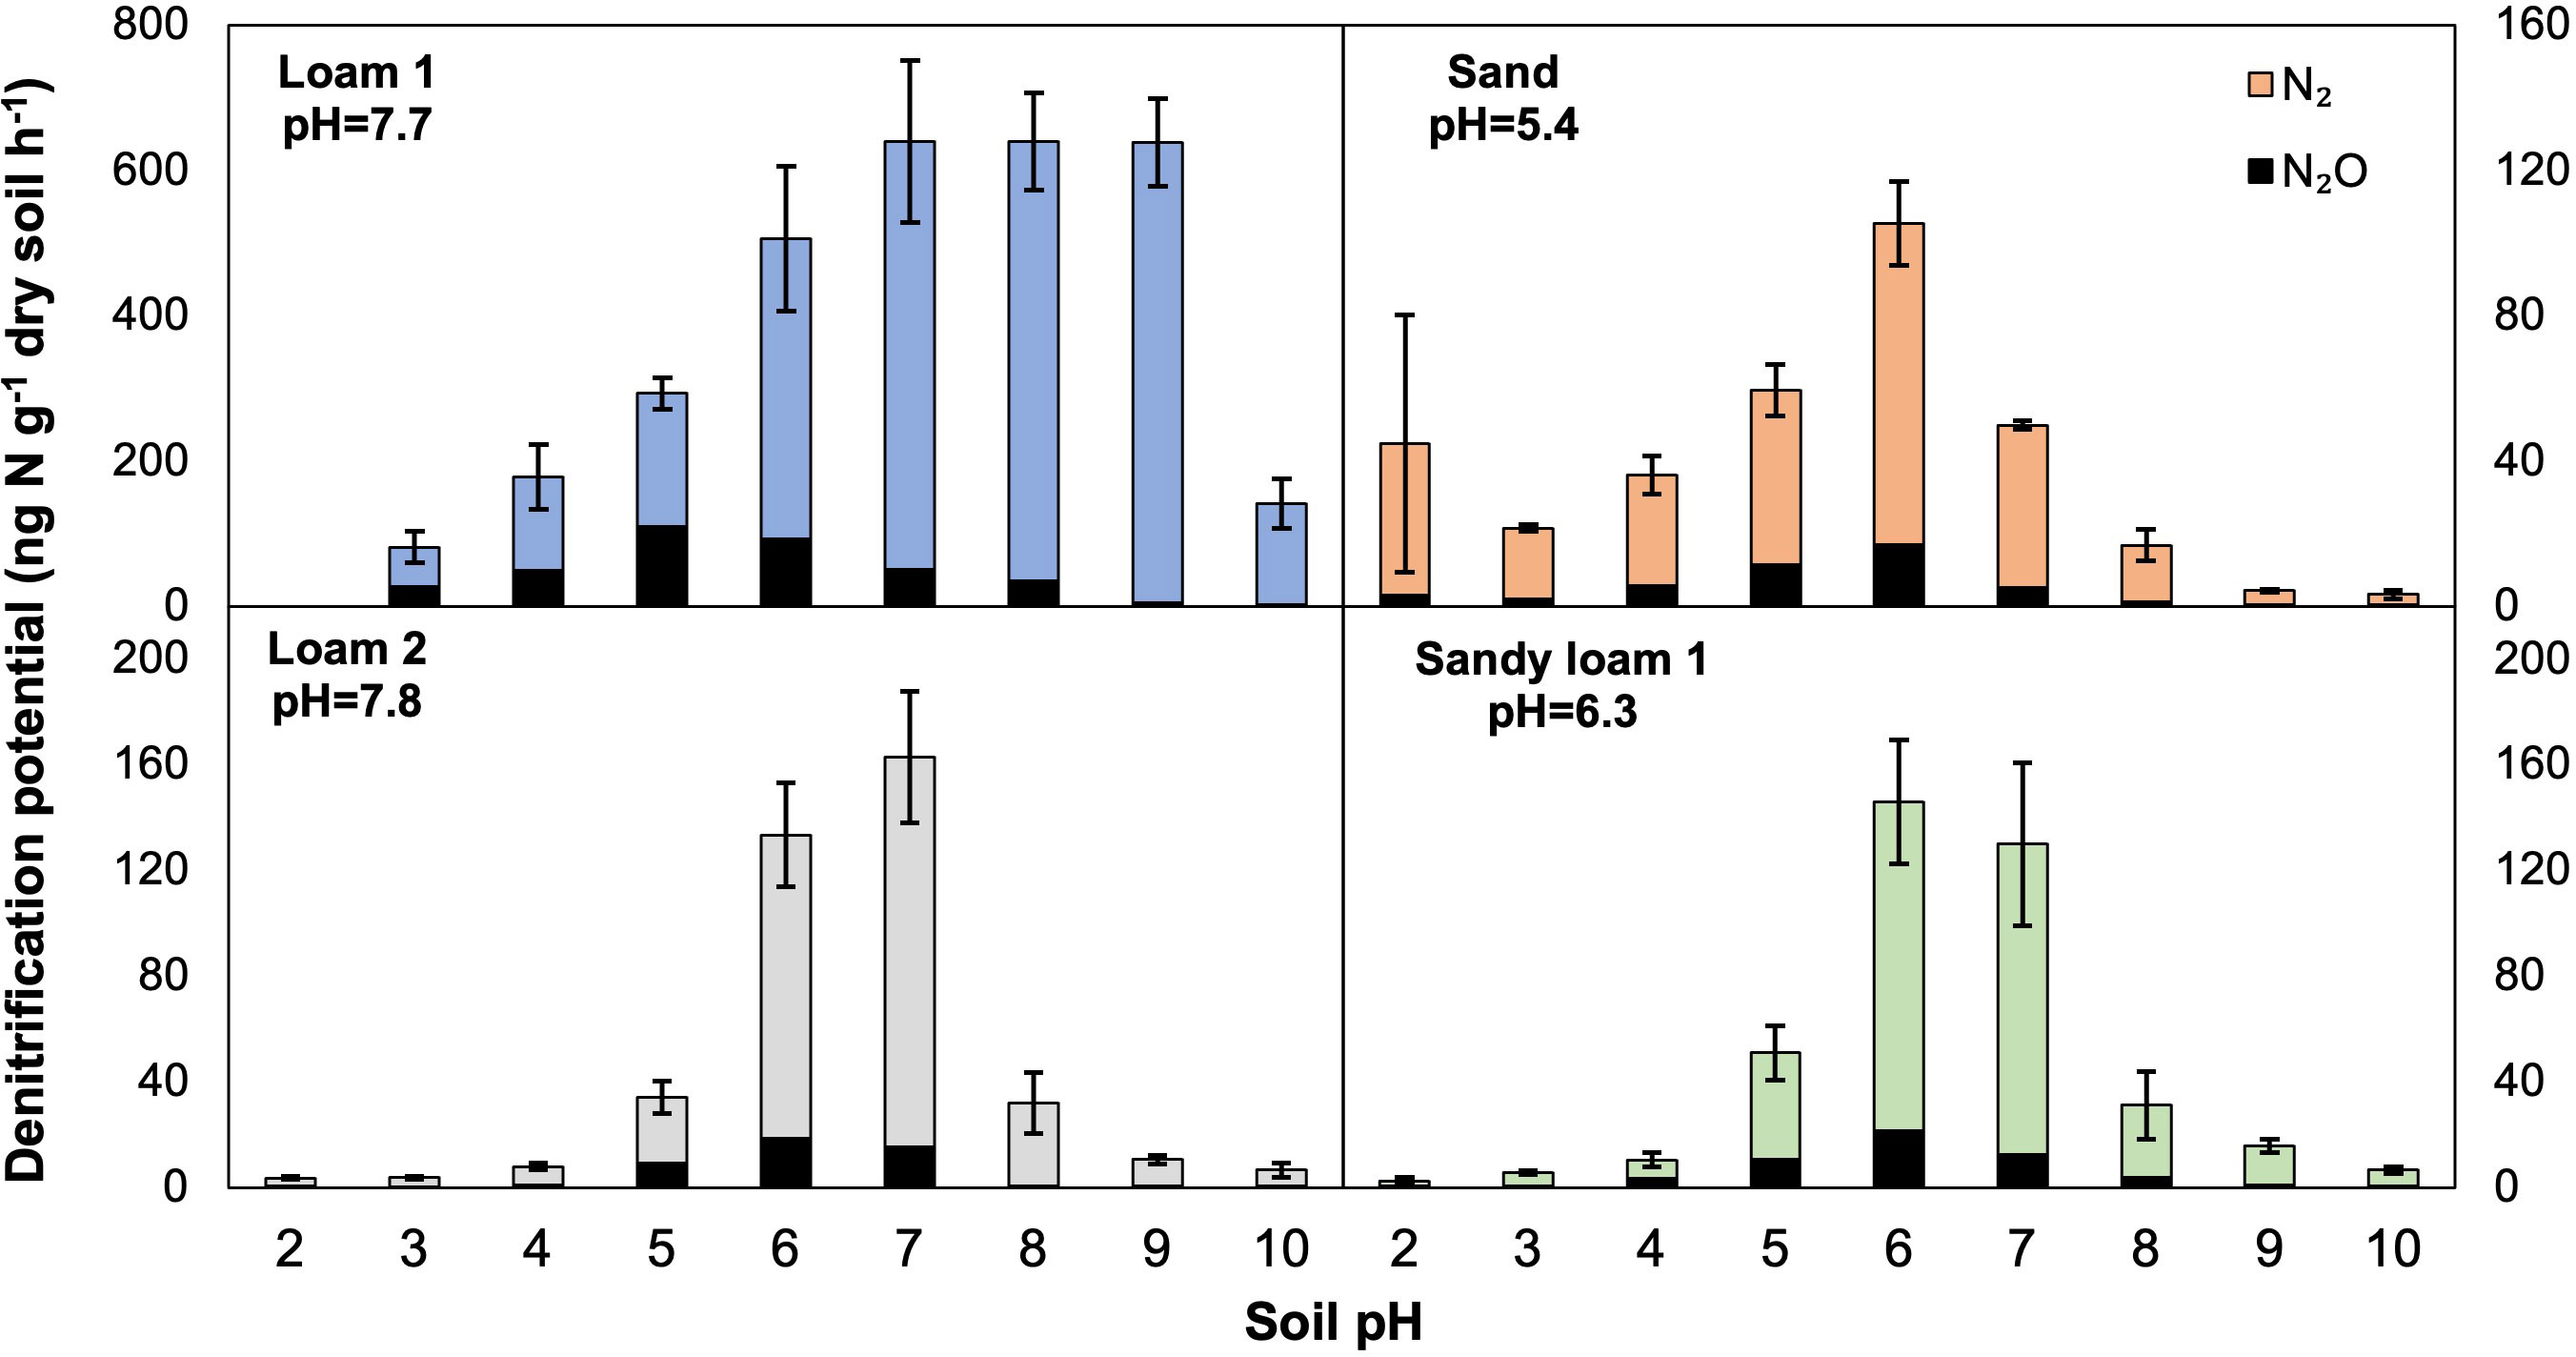
Figure 1 Mean soil denitrification potentials (expressed as N2O and N2 production) in soils at native and modified soil pH from different Oklahoma counties: Loam 1 (Payne), Sand (Woods), Loam 2 (Grant), and Sandy Loam 1 (Grant). Native soil pH is reported below the texture name. Note differences in scale for denitrification rate in Loam 1 (means are shown with error bars representing standard deviation, n=3).
To better explore the relationship between N2O production and denitrification potentials and their variability with pH, we fit regression models for the N2O ratio across the tested pH range. An overall negative relationship was found between soil pH and the N2O ratio, although the trend did not appear linear (Figure 2). The linear model was compared to polynomial models with the lack of fit test, and overall the third order polynomial model fit the data best (P<0.01, improvement from linear to polynomial; P<0.001, improvement from 2nd order to 3rd order polynomial; P=0.2, no additional improvement with 4th order polynomial). The relationship was most tightly clustered and more linear when the range of soil pH was between 4-8, such that increases in pH would linearly decrease the N2O ratio. When considering the lower (<4) and higher (>8) pH ranges, the relationship is instead positive, showing that increases in pH in these ranges would increase the N2O ratio rather than decrease it.
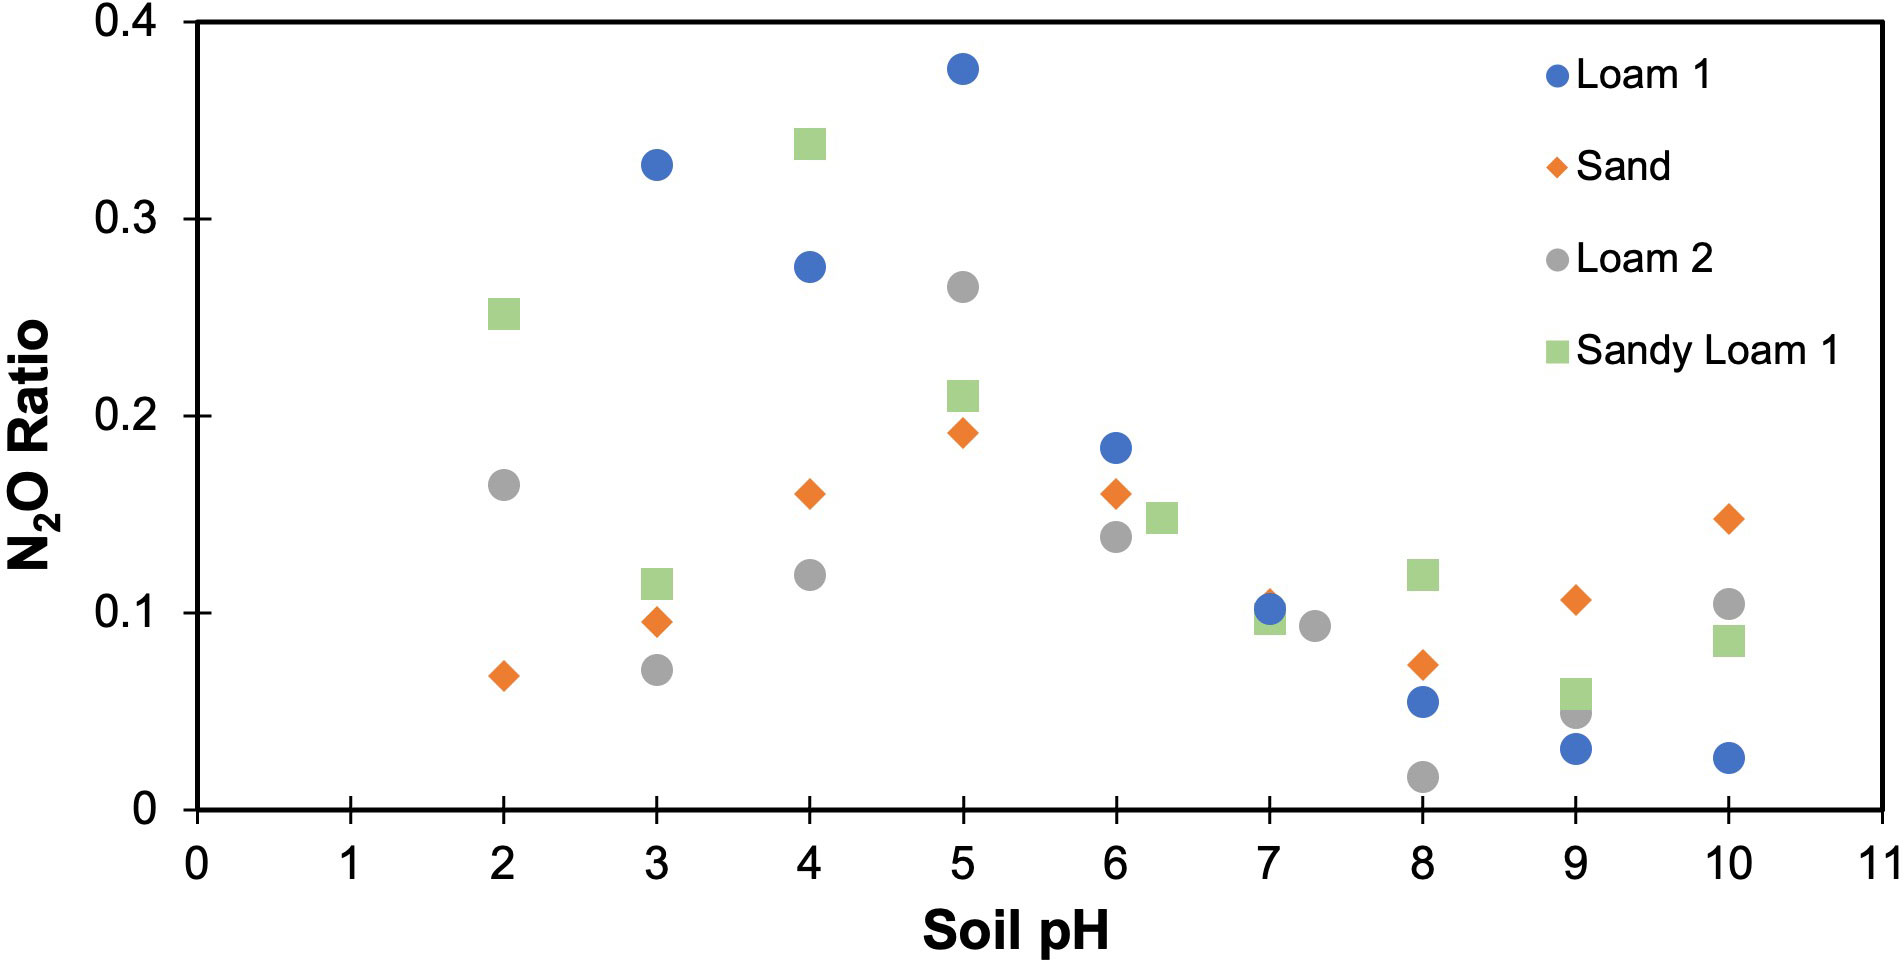
Figure 2 Relationship between soil pH and measured N2O ratio (N2O:(N2O+N2)) obtained from lab assays. A third order polynomial model fit the data significantly better than the linear or second order polynomial model (lack of fit, P<0.01).
To estimate the effect of soil texture on the N2O ratio, three different soil textures (i.e., loam, sand, sandy loam) from six different locations were considered. The N2O ratio varied for each soil, with variations found even for soils with identical textures (Figure 3). To further investigate the texture relationship, clay percentage was considered as it varied across all soils, even those with the same soil texture class. As the clay percentage increased, the laboratory measured N2O ratio also increased (Figure 4). The measured N2O ratio was highest (ANOVA & LSD, P<0.01) for the sandy loam with the highest clay percentage (17.5%).
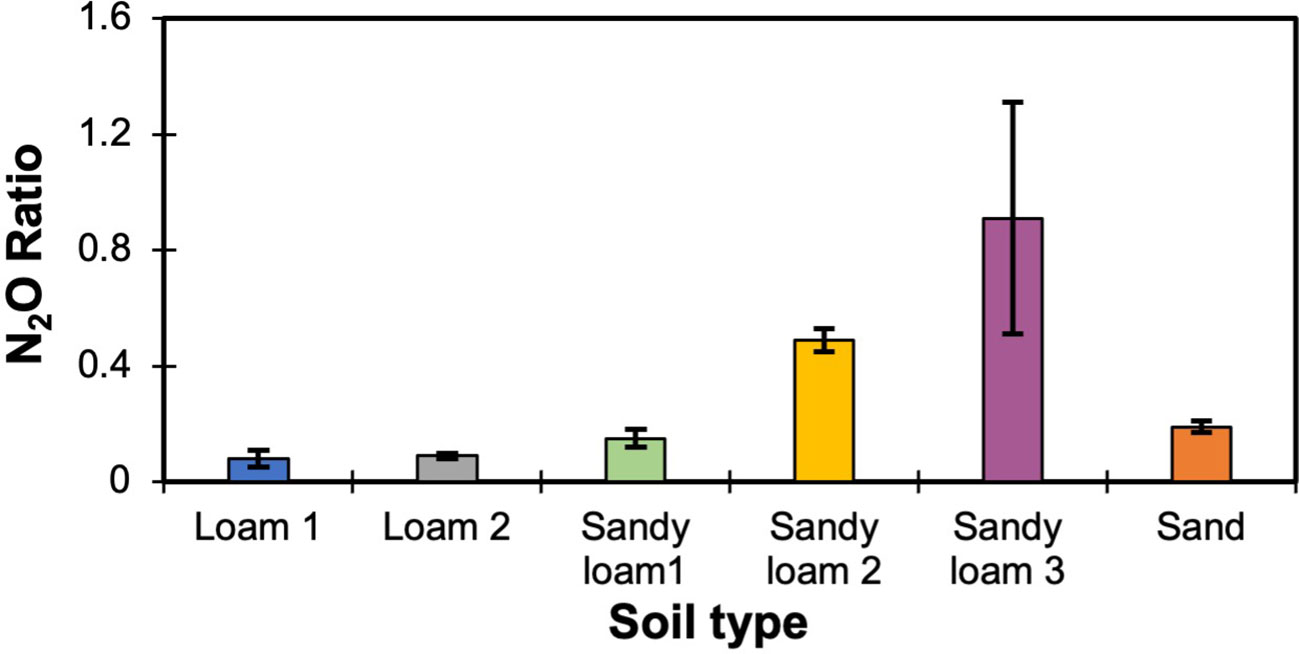
Figure 3 Measured N2O ratios (N2O:(N2O+N2)) across different soil textures (means are shown with error bars representing standard deviation, n=3). Sandy loam 3 significantly higher than Sandy loam 2, which is significantly higher than all other samples (ANOVA & LSD, P<0.001).
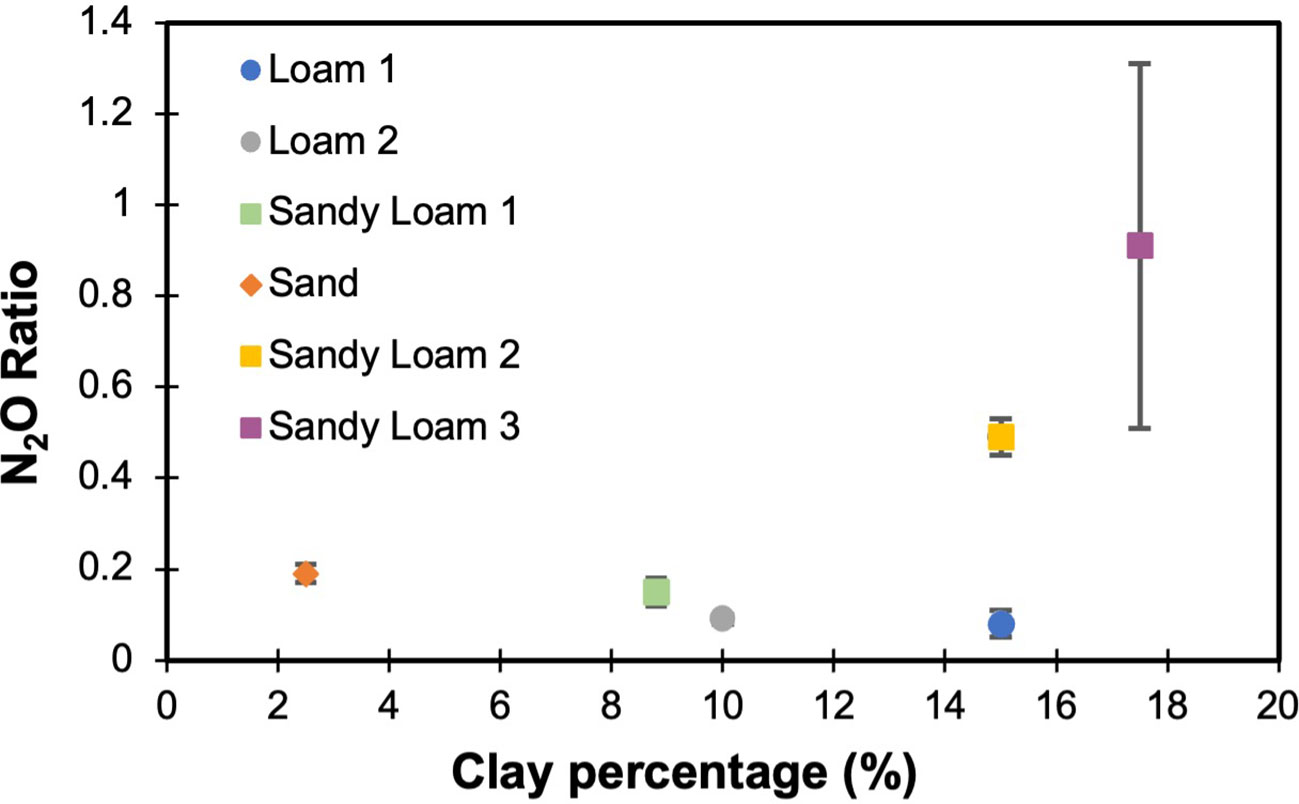
Figure 4 The relationship between clay percentage and measured N2O ratio (means are shown with error bars representing standard deviation, n=3). 17.5% clay percent was significantly higher than all other clay percentages (ANOVA & LSD, P<0.001).
Modeled relationships and evaluation
To test the DNDC model formulation under variable pH, we predicted the N2O ratio under the same varied range of pH. Similar to lab measurements, the relationship between soil pH and the N2O ratio appeared nonlinear with more closely clustered data in the pH range 5-8 (Figure 5). The linear model was compared to polynomial models with the lack of fit test, and overall the second order polynomial model fit the data best (P<0.001, improvement from linear to 1st order polynomial; P=0.97, no additional improvement with 3rd order polynomial). However, unlike measurements, acidic soils always had low N2O ratios. For the soil texture, the model results indicated distinct variations in the N2O ratio for each soil type, albeit at a much higher predicted N2O ratio for all soil types (Figure 6). Beyond their general overestimated N2O ratios, the predicted trends did not align with laboratory results. However, the model was able to replicate the laboratory measured positive relationship associated with clay content and the N2O ratio (data not shown).
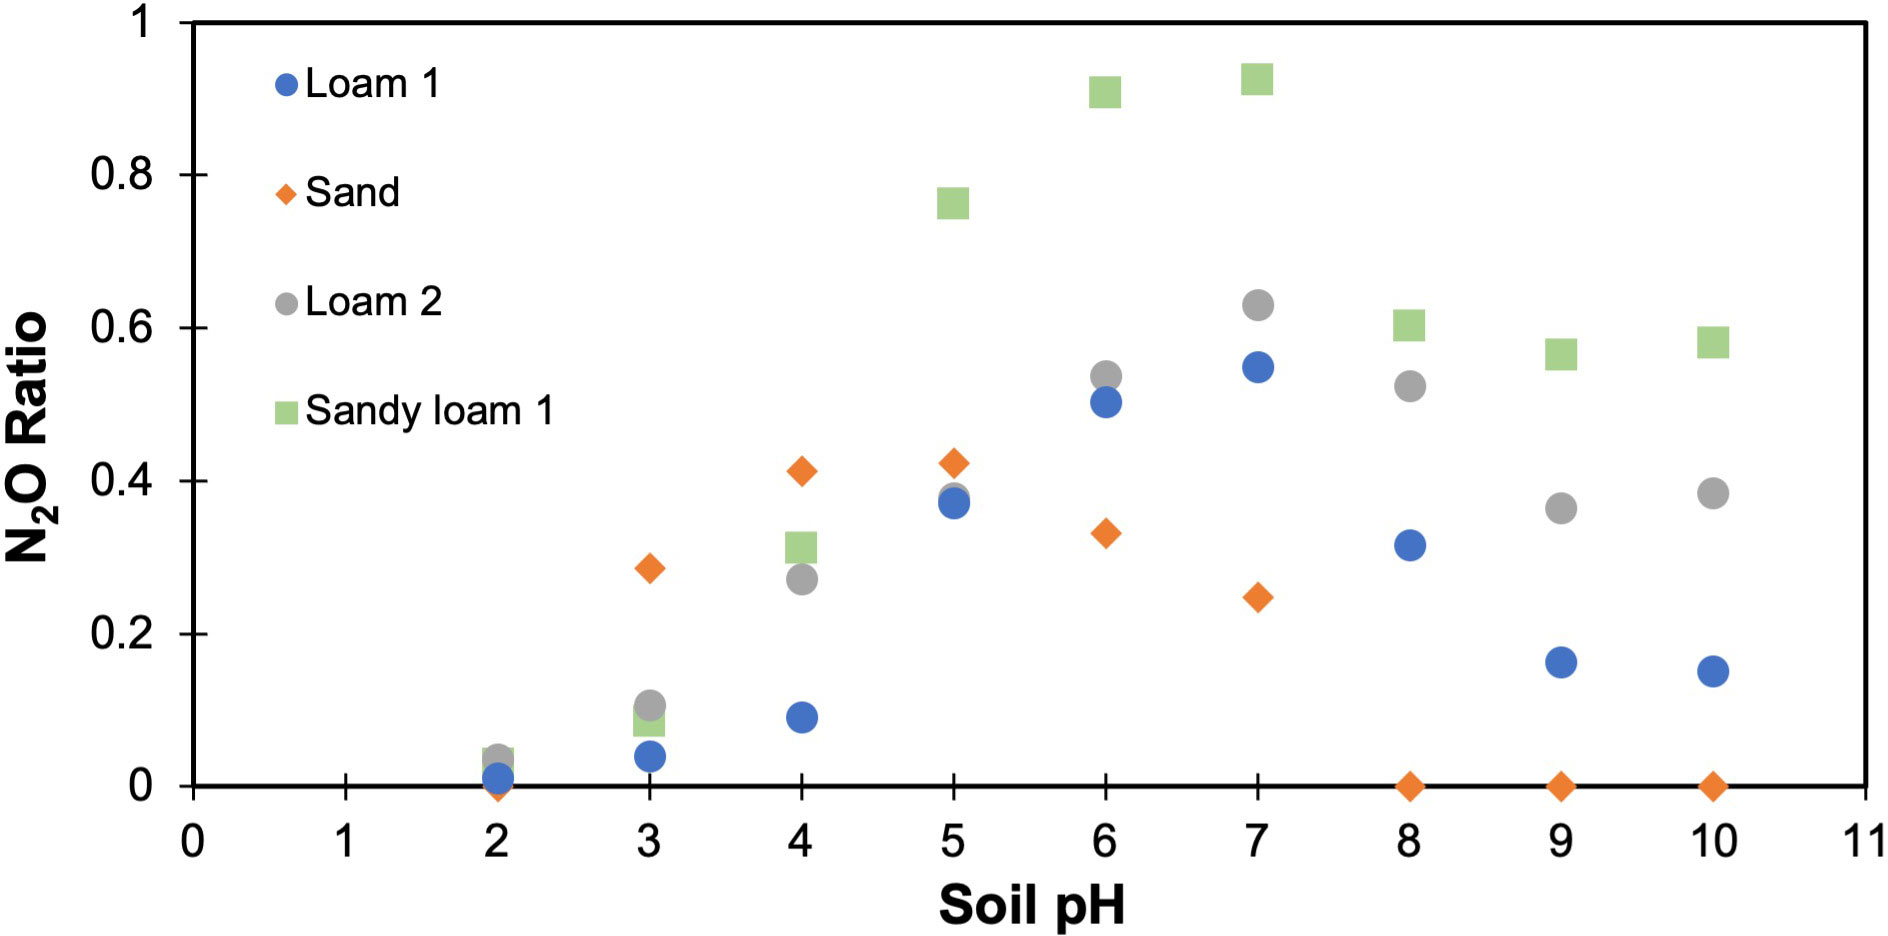
Figure 5 Statistical relationship between soil pH and predicted N2O ratio obtained from DNDC. A second order polynomial model fit the data significantly better than the linear model (lack of fit, P<0.001).
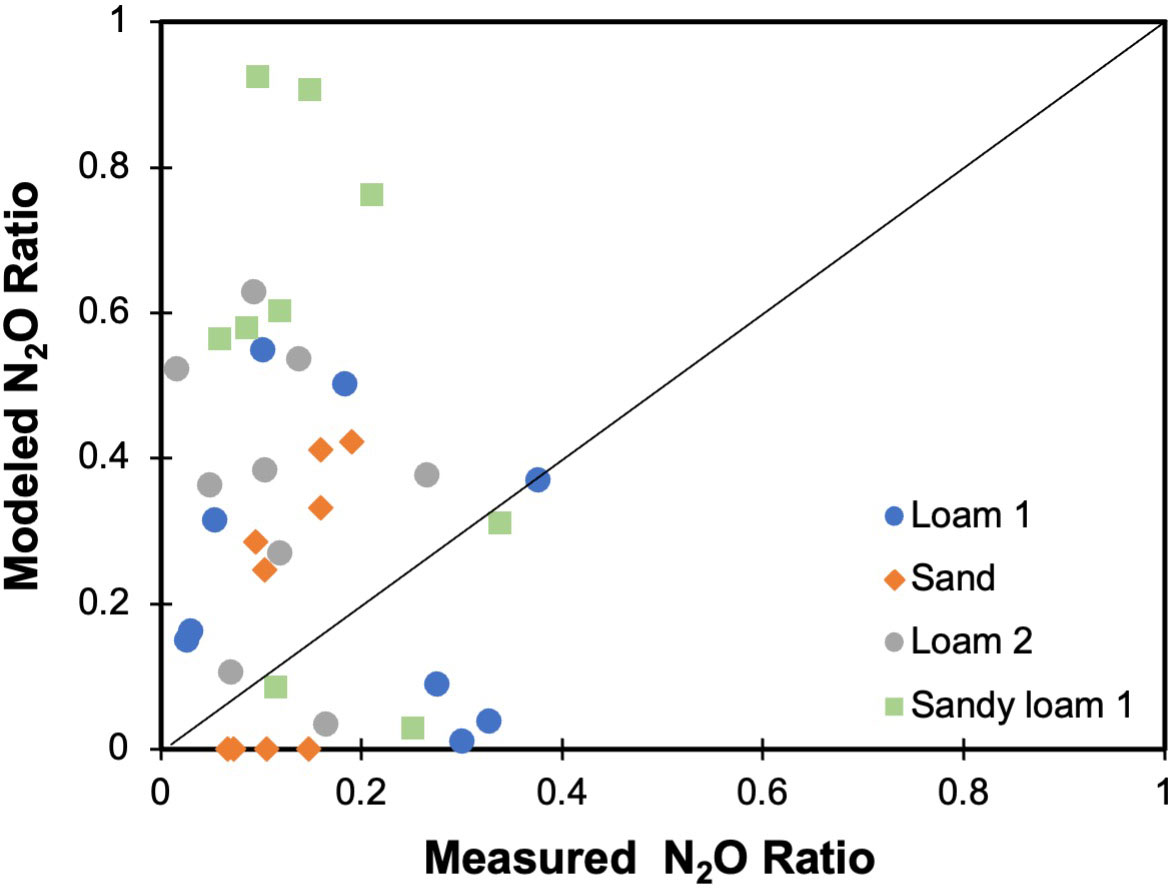
Figure 6 Model evaluation of N2O ratio from both DEA, measured data, and DNDC, modeled data, for four different soils and under pH 2-10.
The DNDC model was evaluated for its ability to predict the N2O ratio across the variable soil pH and texture considered in this study (Figure 6). Generally, the model overpredicted the N2O ratio, although in some cases it had good predictions or underestimated the ratio. The over- or under-predictions were not consistent for simulations based on soil texture or pH, so it was difficult to determine the source of this error. For instance, the highest N2O ratio in the laboratory measurement occurred at soil pH of 5, while the model provides the highest N2O ratio at soil pH of 7.
Discussion
This research stemmed from the overall conclusion of a recent meta-analysis of laboratory denitrification studies—soil texture and pH drive the N2O ratio (5). Therefore, we simultaneously considered these two soil properties across Oklahoma soils with different texture classes and natural and modified pH using laboratory and modeling methods. We found that the highest denitrification potential in all tested soils were under the natural pH of soil. Higher rates at natural soil pH has been observed in other studies, which suggested this may be tied to the adaptation of the microbial community to the natural soil pH (6, 30). Even between soils of similar texture and natural pH, there could be major differences in their overall denitrification rates, which could not be isolated to the influence of soil texture or pH alone. For example, the two loams with similar pH had significantly different denitrification potentials. Although total denitrification rates are related to the N2O ratio in its calculation (total denitrification is the denominator), the N2O production (numerator in the N2O ratio) under identical conditions is equally important. So while denitrification rates are higher at natural pH, N2O production tended to be highest at lower pH. Therefore, the N2O ratio should be higher at lower pH, where N2O production is highest and total denitrification rates are lower. However, we observed that this relationship was not as straightforward when considering a larger pH range.
Soil pH was modified over a larger range (2–10) than previously considered in laboratory assays and for soils of different texture class, allowing for a broader assessment of the relationship between pH and the N2O ratio. Overall, across all texture classes, soil pH was inversely related to the N2O ratio. This result was expected based on the similar conclusion of the recent meta-analysis (5) and the understanding of how soil pH affects the activity of the denitrifying microorganisms, potentially by modifying (i.e., inhibit, enhance) steps in the denitrification process. For example, the assembly of functional N2O reductase, necessary for N2O reduction, is prevented at low pH (31). Previous studies have also reported the importance of soil pH for microbial diversity, likely through its effect on maintaining the pH within the microbial cell or by controlling the amount of accessible nutrients in the soil (32–34). Although the general negative correlation between pH and the N2O ratio is broadly accepted, the statistical nature of that relationship (e.g., linear, non-linear) has not been as commonly reported, especially for a variety of soil textures simultaneously. Some previous studies have identified a negative linear relationship between pH and the N2O ratio (8, 9, 35), although they considered a more narrow range of pH than in this study. When considering the smaller range (4–8), this study similarly observed a strong negative linear relationship between pH and the N2O ratio. It is when considering the larger range, which had not previously been tested, that the relationship becomes complicated and nonlinear such that increasing pH only has environmental benefit (lower N2O ratio) in neutral pH soils. In highly acidic (<4) or basic (>8) soils, increasing pH may increase the N2O ratio and result in higher overall N2O emissions. Based on this newly identified relationship, soil pH effects on N2O production and denitrification may need to be revisited in process-based models like DNDC which incorporate pH in model formulation. Although the more extreme low or high pH soils be less relevant in agricultural settings most commonly modeled with DNDC, expanded use to contaminated soils (e.g., abandoned mine lands) would make the expanded pH range important to investigate further.
The recent meta-analysis also identified soil texture class as a critical factor for driving the N2O ratio in laboratory denitrification experiments, despite the disruption of some texture properties (e.g., structure) in laboratory setup (5). By testing soils with similar and different textures within the same region, we aimed to uncover the relationship between soil texture class and the N2O ratio. However, the variability in N2O ratio between soils of similar texture class suggests that there are other factors related to texture that led to observed variation in the N2O ratio. To understand the soil texture effect further, we considered the clay percentage, which varied across all soils, even those with the same texture. In both the lab and model results, there was a positive relationship observed between clay content and the N2O ratio. As the clay content relationship was not the original focus of this study, we only considered six different clay percentages in generating the data for this observed relationship, so it needs to be verified in more regions and for more soil types. To our knowledge, this is the first laboratory study to specifically identify the connection between clay percent and the N2O ratio using denitrification assays. Despite limited observations available at the lab-scale, there is some evidence from field studies that N2O emissions may be related to clay fraction. One study documented higher N2O emissions from a soil with high clay content than a freely drained soil (36). Another study similarly associated field emissions of N2O to both clay percentage and bulk density of the soil (17). Interestingly, the connection between clay content and soil moisture or drainage is controlled for in the lab by using soil slurries. So the field-observed relationship may not give the complete story as clay content had influence despite drainage conditions. Further investigation into this relationship using different clay percentages is recommended to gain a better understanding of the complex link between soil texture and the N2O ratio. Alternatively, it is recommended that more detailed soil data (i.e., percentage clay/silt/sand) is published or compiled to allow for statistical testing based on experiments from diverse soils. As the importance of soil texture, and potentially clay percentage, had not been previously highlighted in laboratory denitrification experiments, the collection and publication of these data alongside experimental setup was not commonplace. The outcomes of this study, driven largely from the findings of the recent meta-analysis (5), highlight the importance of consistent and detailed soil texture measurement and reporting.
Data availability statement
The original contributions presented in the study are included in the article/Supplementary Material. Further inquiries can be directed to the corresponding author.
Author contributions
SK: Data curation, Formal Analysis, Investigation, Supervision, Visualization, Writing – original draft, Writing – review & editing. MF: Conceptualization, Data curation, Formal Analysis, Funding acquisition, Methodology, Project administration, Supervision, Validation, Visualization, Writing – review & editing.
Funding
The author(s) declare financial support was received for the research, authorship, and/or publication of this article. This material is based on work supported by the National Science Foundation under Grant No. OIA-1946093. SK was additionally supported by departmental fellowship (Stover and Associates Endowed Fellowship) as she completed this MS work in the School of Civil and Environmental Engineering at Oklahoma State University.
Acknowledgments
We thank undergraduate researcher Madi Wilson for assisting with the laboratory assays and David Porter for building the experiment apparatus for our assays. We gratefully acknowledge Jason Warren and Reynilda Monteza for providing access and transportation to the different field sites.
Conflict of interest
The authors declare that the research was conducted in the absence of any commercial or financial relationships that could be construed as a potential conflict of interest.
Publisher’s note
All claims expressed in this article are solely those of the authors and do not necessarily represent those of their affiliated organizations, or those of the publisher, the editors and the reviewers. Any product that may be evaluated in this article, or claim that may be made by its manufacturer, is not guaranteed or endorsed by the publisher.
Supplementary material
The Supplementary Material for this article can be found online at: https://www.frontiersin.org/articles/10.3389/fsoil.2024.1342986/full#supplementary-material
References
1. EPA. Inventory of U.S. Greenhouse Gas Emissions and Sinks: 1990-2021. U.S. Environmental Protection Agency, EPA 430-R-23-002 (2023). Available at: https://www.epa.gov/ghgemissions/inventory-us-greenhouse-gas-emissions-and-sinks-1990-2021.
2. Ravishankara AR, Daniel JS, Portmann RW. Nitrous oxide (N2O): the dominant ozone-depleting substance emitted in the 21st century. Science. (2009) 326(5949):123–5. doi: 10.1126/science.1176985
3. Braker G, Conrad R. Diversity, Structure, and Size of N2O-Producing Microbial Communities in Soils—What Matters for Their Functioning? In: Advances in Applied Microbiology. Elsevier (2011). p. 33–70. Available at: https://linkinghub.elsevier.com/retrieve/pii/B9780123870469000025.
4. Syakila A, Kroeze C. The global nitrous oxide budget revisited. Greenh Gas Meas Manag (2011) 1(1):17–26. doi: 10.3763/ghgmm.2010.0007
5. Foltz ME, Alesso A, Zilles JL. Field soil properties and experimental nutrient additions drive the nitrous oxide ratio in laboratory denitrification experiments: a systematic review. Front Soil Sci (2023) 3:1194825. doi: 10.3389/fsoil.2023.1194825
6. Šimek M, Jíšová L, Hopkins DW. What is the so-called optimum pH for denitrification in soil? Soil Biol Biochem (2002) 34(9):1227–34. doi: 10.1016/S0038-0717(02)00059-7
7. Čuhel J, Šimek M. Effect of pH on the denitrifying enzyme activity in pasture soils in relation to the intrinsic differences in denitrifier communities. Folia Microbiol (Praha) (2011) 56(3):230–5. doi: 10.1007/s12223-011-0045-x
8. Mukumbuta I, Uchida Y, Hatano R. Evaluating the effect of liming on N2O fluxes from denitrification in an Andosol using the acetylene inhibition and 15N isotope tracer methods. Biol Fertil Soils (2018) 54(1):71–81. doi: 10.1007/s00374-017-1239-4
9. Samad MS, Bakken LR, Nadeem S, Clough TJ, de Klein CAM, Richards KG, et al. High-resolution denitrification kinetics in pasture soils link N2O emissions to pH, and denitrification to C mineralization. PloS One (2016) 11(3):e0151713. doi: 10.1371/journal.pone.0151713
10. Weier KL, Gilliam JW. Effect of acidity on denitrifcation and nitrous oxide evolution from atlantic coastal plain soils. Soil Sci Soc Am J (1986) 50(5):1202–5. doi: 10.2136/sssaj1986.03615995005000050022x
11. Ramos C. Effect of agricultural practices on the nitrogen losses to the environment. Fertil Res (1996) 43(1–3):183–9. doi: 10.1007/BF00747700
12. Wild, Klemisch, Pfadenhauer. Nitrous oxide and methane fluxes from organic soils under agriculture. Eur J Soil Sci (1998) 49(2):327–35. doi: 10.1046/j.1365-2389.1998.00156.x
13. Šimek M, Hopkins DW. Regulation of potential denitrification by soil pH in long-term fertilized arable soils. Biol Fertil Soils (1999) 30(1–2):41–7. doi: 10.1007/s003740050585
14. Barton L, McLay CDA, Schipper LA, Smith CT. Annual denitrification rates in agricultural and forest soils: a review. Soil Res (1999) 37(6):1073. doi: 10.1071/SR99009
15. Ball BC. Soil structure and greenhouse gas emissions: a synthesis of 20 years of experimentation. Eur J Soil Sci (2013) 64(3):357–73. doi: 10.1111/ejss.12013
16. Hu M, Peñuelas J, Sardans J, Huang J, Xu K, Tong C. Denitrification rates in tidal marsh soils: The roles of soil texture, salinity and nitrogen enrichment. Eur J Soil Sci (2021) 72(1):474–9. doi: 10.1111/ejss.12956
17. Skiba U, Ball B. The effect of soil texture and soil drainage on emissions of nitric oxide and nitrous oxide. Br Soc Soil Sci (2002) 18(1):56–60. doi: 10.1111/j.1475-2743.2002.tb00050.x
18. USDA. Soil Survey Staff, Natural Resources Conservation Service, in: Web Soil Survey (2021). United States Department of Agriculture. Available at: http://websoilsurvey.nrcs.usda.gov/ (Accessed 8/2/2021).
19. Singh P, Singh SK, Prasad SM. Plant responses to soil pollution. Singapore: Springer (2020). 248 p.
20. Čuhel J, Šimek M, Laughlin RJ, Bru D, Chèneby D, Watson CJ, et al. Insights into the Effect of Soil pH on N2O and N2 Emissions and Denitrifier Community Size and Activity. Appl Environ Microbiol (2010) 76(6):1870–8. doi: 10.1128/AEM.02484-09
21. Foltz ME, Kent AD, Koloutsou-Vakakis S, Zilles JL. Influence of rye cover cropping on denitrification potential and year-round field N2O emissions. Sci Total Environ (2021) 765:144295. doi: 10.1016/j.scitotenv.2020.144295
22. Tiedje JM, Simkins S, Groffman PM. Perspectives on measurement of denitrification in the field including recommended protocols for acetylene based methods. Plant Soil (1989) 115(2):261–84. doi: 10.1007/BF02202594
23. Li C, Frolking S, Frolking TA. A model of nitrous oxide evolution from soil driven by rainfall events: 1. Model structure and sensitivity. J Geophys Res Atmospheres (1992) 97(D9):9759–76. doi: 10.1029/92JD00509
24. Gilhespy SL, Anthony S, Cardenas L, Chadwick D, del Prado A, Li C, et al. First 20 years of DNDC (DeNitrification DeComposition): Model evolution. Ecol Model (2014) 292:51–62. doi: 10.1016/j.ecolmodel.2014.09.004
25. Fiebrich C, Illston B. Oklahoma Mesonet. Oklahoma, USA: Board of Regents of the University of Oklahoma (2007).
26. Lan X, Tans P, Thoning K, NOAA Global Monitoring Laboratory. Trends in globally-averaged CO2 determined from NOAA Global Monitoring Laboratory measurements. Colorado, USA: NOAA GML (2023). Available at: https://gml.noaa.gov/ccgg/trends/global.html?doi=10.15138/9n0h-zh07.
27. NADP. Trends in globally-averaged CO2 determined from NOAA Global Monitoring Laboratory measurementsNational Atmospheric Deposition Program (NRSP-3). Colorado, USA: National Oceanic and Atmospheric Administration (NOAA) (2022).
28. Scott BL, Ochsner TE, Illston BG, Fiebrich CA, Basara JB, Sutherland AJ. New Soil property database improves oklahoma mesonet soil moisture estimates*. J Atmospheric Ocean Technol (2013) 30(11):2585–95. doi: 10.1175/JTECH-D-13-00084.1
29. R Core Team. R: A language and environment for statistical computing. Vienna, Austria: R Foundation for Statistical Computing (2022). Available at: https://www.R-project.org/.
30. ŠImek M, Cooper JE. The influence of soil pH on denitrification: progress towards the understanding of this interaction over the last 50 years: Soil pH and denitrification. Eur J Soil Sci (2002) 53(3):345–54. doi: 10.1046/j.1365-2389.2002.00461.x
31. Liu B, Frostegård Å, Bakken LR. Impaired reduction of N2O to N2 in acid soils is due to a posttranscriptional interference with the expression of nosZ. mBio. (2014) 5(3):e01383–14. doi: 10.1128/mbio.01383-14
32. Fierer N, Jackson RB. The diversity and biogeography of soil bacterial communities. Proc Natl Acad Sci (2006) 103(3):626–31. doi: 10.1073/pnas.0507535103
33. Rousk J, Bååth E, Brookes PC, Lauber CL, Lozupone C, Caporaso JG, et al. Soil bacterial and fungal communities across a pH gradient in an arable soil. ISME J (2010) 4(10):1340–51. doi: 10.1038/ismej.2010.58
34. Zhalnina K, Dias R, de Quadros PD, Davis-Richardson A, Camargo FAO, Clark IM, et al. Soil pH determines microbial diversity and composition in the park grass experiment. Microb Ecol (2015) 69(2):395–406. doi: 10.1007/s00248-014-0530-2
35. Samad MS, Biswas A, Bakken LR, Clough TJ, de Klein CAM, Richards KG, et al. Phylogenetic and functional potential links pH and N2O emissions in pasture soils. Sci Rep (2016) 6(1):35990. doi: 10.1038/srep35990
Keywords: clay content, denitrification potential, denitrifying enzyme activity, DNDC, nitrous oxide
Citation: Khalifah S and Foltz ME (2024) The ratio of denitrification end-products were influenced by soil pH and clay content across different texture classes in Oklahoma soils. Front. Soil Sci. 4:1342986. doi: 10.3389/fsoil.2024.1342986
Received: 22 November 2023; Accepted: 18 January 2024;
Published: 01 February 2024.
Edited by:
Davey Jones, Bangor University, United KingdomReviewed by:
Jinyang Wang, Nanjing Agricultural University, ChinaTongbin Zhu, Chinese Academy of Geological Sciences, China
Copyright © 2024 Khalifah and Foltz. This is an open-access article distributed under the terms of the Creative Commons Attribution License (CC BY). The use, distribution or reproduction in other forums is permitted, provided the original author(s) and the copyright owner(s) are credited and that the original publication in this journal is cited, in accordance with accepted academic practice. No use, distribution or reproduction is permitted which does not comply with these terms.
*Correspondence: Mary E. Foltz, bWFyeS5mb2x0ekBva3N0YXRlLmVkdQ==