 Joao Arthur Antonangelo
 Steven Culman
 Hailin Zhang
- 1Department of Crop and Soil Sciences, Washington State University, Pullman, WA, United States
- 2Department of Plant and Soil Sciences, Oklahoma State University, Oklahoma, OK, United States
Introduction: Enhancing soil cation exchange capacity (CEC) is of paramount importance for sustainable agriculture and ecosystem health. This study investigated the pivotal role of biochar in altering soil CEC and challenges conventional assumptions about universal effects of biochar application.
Methods: Contrasting biochar types, one with a low ash content of 4.4% (switchgrass-derived biochar, SGB) and the other with a high ash content of 45.9% (poultry litter-derived biochar, PLB) were used. Two experiments treated with increasing biochar application rates were conducted: one without plants and the other grown with ryegrass. Effective CEC (summation method) was determined by two extraction methods: Mehlich-3 (M3) and ammonium acetate (AA).
Results and discussion: The SGB decreased CEC by 27% on average (from both experiments) from the lowest to the highest rate of biochar application, while the PLB significantly increased CEC by 91%. This highlights the critical role of biochar properties in influencing CEC dynamics. In the second experiment, ryegrass cultivation revealed the greater importance of the calcium and magnesium/potassium ratio ([Ca+Mg]/K) in the soil CEC than CEC only for plant growth in biochar-amended soils. The ratios for optimum ryegrass production ranged from 82‒86 (M3) and 69‒74 (AA), which was translated to 88:11:1 Ca:Mg:K percent base saturation ratios. Moreover, predictive models for estimation of soil CEC after biochar application were successfully developed based on initial soil and biochar CEC. However, M3 was more reliable than AA for such predictions mainly because it was more successful in predicting nutrient availability from biochar. These models offer a promising tool for informed soil management decisions.
Conclusion: This research emphasizes the importance of biochar feedstock, elucidates nutrient ratio effects on plant growth, and provides a practical means to anticipate soil CEC changes post-biochar application.
1 Introduction
Cation exchange capacity (CEC) is a critical soil property that directly influences nutrient availability and plant growth. The determination of CEC can be achieved through direct measurement or by summation methods, with the latter encompassing techniques such as the Mehlich-3 (M3) and ammonium acetate (AA) extractions (1). Direct measurement of CEC involves the displacement of exchangeable cations on soil particles with a solution containing a known concentration of an index cation, typically ammonium (NH4+), and subsequent quantification of the NH4+ adsorbed. This method offers precise results but requires specialized laboratory equipment and is time-consuming (2). In contrast, summation methods involve the extraction of cations from soils with specific reagents, with the extracted cations subsequently quantified. The M3 extraction uses a mixture of ammonium fluoride (NH4F) and nitric acid (HNO3) to release exchangeable cations, while AA is utilized to displace cations (3). Summation methods are quicker and more convenient for routine soil analysis but may overestimate CEC as they also extract non-exchangeable cations from the soil (3). Therefore, the choice between direct measurement and summation methods for CEC determination depends on the research objectives and available resources. Direct measurement is preferable when high accuracy is required, whereas summation methods like M3 and ammonium acetate extractions are suitable for rapid assessment of CEC in routine soil analyses. Moreover, determining CEC is valuable for understanding the relationship between key cations (K, Ca, and Mg) in soil and their impact on plant uptake and development.
Overall, using practical soil nutrient extraction and summation methods for CEC determination offers benefits such as cost-efficiency, accessibility, speed, ease of implementation, versatility, and the ability to assess predictive accuracy compared to more complex techniques like the direct measurement method (4). Furthermore, CEC via summation represents the soil’s capacity to hold and exchange cations and helps assess nutrient availability, cation competition, and potential imbalances in these essential nutrients.
Notwithstanding, the assumption that increasing soil CEC is always beneficial requires nuanced consideration. Particularly in the context of tropical soils, where H+Al (hydrogen and aluminum) constitutes a significant portion of the soil CEC, a sole focus on increasing CEC might not be advantageous if the nutrient balance is skewed towards detrimental elements like Al (5–7). Moreover, a global perspective underscores the fact that excessively high CEC does not necessarily guarantee optimal soil fertility (8). High CEC soils may indicate a propensity for nutrient imbalances, where certain nutrients may be overly abundant or deficient. For instance, soils with high CEC might accumulate an excess of cations such as sodium (Na), particularly in regions already high in Na or where excessive Na addition occurs (9). This surplus could potentially lead to soil sodicity and create unfavorable physical conditions for plant growth.
Calcium, Mg, and K are essential cations that interact on soil exchange sites, influencing soil structure, fertility, and plant nutrition. The soil CEC, determined by clay and organic matter composition, serves as the battleground for these competitive interactions. Calcium, due to its smaller hydrated radius relative to Mg, tends to dominate exchange sites, forming robust bonds with negatively charged sites on clay and organic matter (10). This dominance influences soil structure and can limit the availability of other cations. Magnesium, an essential nutrient for plants, competes with Ca for exchange sites, resulting in calcium-magnesium interaction (11). Potassium, another critical plant nutrient, also competes for exchange sites with Ca and Mg (12), with Ca and Mg being preferentially adsorbed (13, 14). The intricate interplay of these cations on exchange sites has implications for nutrient uptake by plants, potentially leading to imbalances and affecting overall soil fertility. Imbalances in cation ratios may result in nutrient deficiencies, emphasizing the importance of understanding these competitive interactions for sustainable soil management and agricultural practices.
In addition to the intricate cation interactions, the incorporation of biochar into soils has emerged as a noteworthy factor influencing soil CEC. The porous structure and high surface area of biochar provide abundant binding sites for cations (15), contributing to increased CEC. This augmentation in CEC not only affects the retention and availability of essential nutrients but also influences the competitive dynamics among cations. Furthermore, the introduction of biochar can alter the soil’s physicochemical properties, influencing its overall fertility and promoting sustainable agricultural practices (16). As a result, understanding the interplay between traditional cations, such as Ca, Mg, and K, and the transformative impact of biochar on CEC is crucial for developing holistic strategies to optimize soil health and fertility.
This study aimed to investigate the influence of biochar on soil CEC. Our specific objectives were:
1. Investigate the influence of switchgrass-derived biochar (SGB) and poultry litter-derived biochar (PLB) on soil CEC through experiments without and with ryegrass cultivation, assessing five biochar application rates.
2. Evaluate the role of soil extractable calcium and magnesium/potassium ratio ([Ca+Mg]/K) concerning soil CEC for plant growth, aiming to establish optimal ryegrass production thresholds.
3. Develop predictive models for post-biochar application on soil CEC changes.
This comprehensive verification process ensures at which level biochar effectively enhances soil nutrient availability (while simultaneously binding and immobilizing contaminants as demonstrated in a previous study by 17). We hypothesized that (i) biochar application will alter soil CEC, (ii) the properties of the biochar, such as ash content, will play a critical role in influencing soil CEC dynamics, (iii) the calcium and magnesium/potassium ratio ([Ca+Mg]/K) will be of greater importance than CEC alone for ryegrass growth in biochar-amended soils, and (iv) predictive models for soil CEC changes post-biochar application can be developed relying on initial soil and biochar CEC.
2 Materials and methods
2.1 Biochar production and properties
Biochar was produced via high-temperature slow pyrolysis (700°C) using two feedstocks: switchgrass (Panicum virgatum) and poultry litter, as detailed in Antonangelo and Zhang (17). The coarse biochar materials were subsequently ground evenly and gently, then sieved through 1- and 0.25-mm screens for physicochemical analyses and experimentation, as outlined by Antonangelo et al. (18). The physicochemical properties of the biochars used in this study are presented in Table 1. Further characterization of switchgrass-derived biochar (SGB) and poultry litter-derived biochar (PLB), encompassing various physicochemical properties is available in Antonangelo et al. (19).
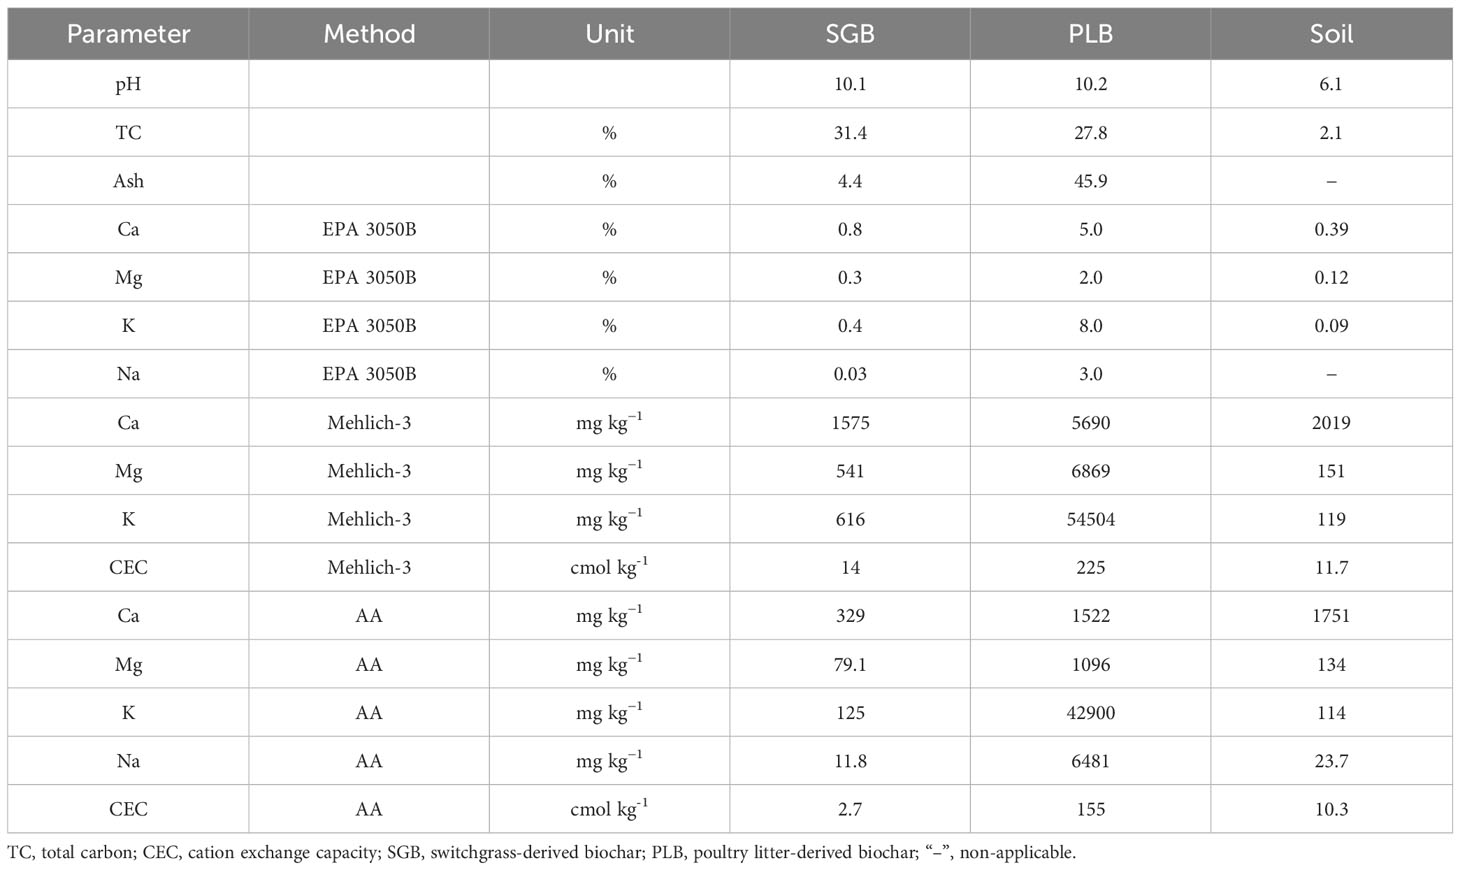
Table 1 Physicochemical properties of biochars derived from two feedstocks and the initial soil chemical attributes of the composite soil sample.
2.2 Soil sampling and potting experiments
The soil from a contaminated site was selected for our experiment. A composite sample was created by combining three individual subsamples to minimize heterogeneity. These subsamples were all collected from a depth range of 0−15 cm and were sourced from locations near chat piles (fragments of siliceous rock, limestone, and dolomite waste rejected in lead-zinc milling operations), utilized for agricultural purposes, as well as residential yards within the Tar Creek region. This area, located in Picher, Ottawa County, Oklahoma, is known for its substantial metal contamination. However, the contaminated sites have been under various remediation measures and used as feed and food production or recreation when meeting appropriate guidelines. Detailed information about the initial soil chemical attributes of the composite sample can be found in the work of Antonangelo and Zhang (17) while some of the soil analysis pertinent to this study are presented in Table 1.
In experiment 1 (without plants), plastic containers were filled with 200 g of 2 mm sieved soil, and five rates of 0.25-mm sieved SGB and PLB (0.0% as control, 1.0%, 2.0%, 4.0%, and 8.0% w/w) were added separately to the soils. Each mixture was moistened to 75% field capacity with RO water and incubated for 70 days while maintaining 75% field capacity by weighing containers once a week and adding water as necessary. Samples were kept open in a lab environment (25°C) to allow for gas exchange. This experiment followed a complete randomized design (CRD) with 3 replications.
In a subsequent trial with ryegrass (experiment 2), plastic pots were filled with 1.2 kg of dried, sieved soil, and a lower range of five SGB and PLB rates (0.0%, 0.5%, 1.0%, 2.0%, and 4.0% w/w) were applied to the soil. Using higher rates up to 8.0% as in the first experiment was unfeasible for ryegrass, as growth was compromised at 4% biochar application (17). The soil-biochar mixes were incubated for 30 days at 75% field capacity before ryegrass sowing, with each pot receiving a seeding rate of 30 kg ha−1. Ryegrass growth was observed for 75 days (following the 30 days of incubation) in a controlled growth chamber. Humidity was consistently kept between 75% and 95%. The initial two weeks maintained a temperature of 20°C, while subsequent weeks alternated between 14°C with 14 hours of simulated daylight and 10°C with 10 hours of simulated darkness until termination. This experiment also employed a CRD with 3 replications, and weekly plot rotations were implemented to minimize any influence imparted by the growth chamber.
Biochars were initially employed to sequester heavy metals. However, a subsequent experiment revealed that the growth and development of ryegrass in these soils varied depending on the type and application of biochar, coupled with its ability to immobilize metals (18). Therefore, in this study, we wanted to ascertain critical soil chemical attributes that influence ryegrass growth when biochar is applied. Thus, we targeted determining CEC and nutrient balance (Ca : Mg:K) imparted by biochar in contaminated soils to assess the impacts on plant growth, nutrient uptake, and nutrient imbalances.
2.3 Soil analyses
Soil samples in both experiments were first dried and sieved to a 2 mm size before analysis. Soil pH was determined using a 1:1 soil-to-water ratio in deionized water. Organic carbon (OC) content was measured using dry combustion with a LECO Truspec carbon and nitrogen analyzer. Plant-available nutrients such as potassium (K), calcium (Ca), and magnesium (Mg) were extracted by shaking 2 g of soil in 20 mL of Mehlich-3 (M3) solution (comprising 0.001 M EDTA, 0.015 M NH4F, 0.2 M CH3COOH, 0.25 M NH4NO3, and 0.013 M HNO3; pH buffered to 2.5) for 5 minutes, following the method developed by Mehlich (20). The quantification of these nutrients was carried out using inductively coupled plasma atomic emission spectroscopy (ICP-AES).
In the second experiment, dried and sieved soil samples underwent the same analytical procedures described above. Additionally, K, Ca, Mg, and sodium (Na) were extracted using ammonium acetate (AA) buffered at pH 7.0 (1). For this extraction, 20 mL of the buffered solution was added to 2 g of dried soil in a 50 mL container. The mixture was then slowly shaken in a reciprocating shaker for 1 hour, followed by filtration and analysis (21). All filtered extracts were quantified using ICP-AES. The (Ca+Mg)/K ratio was calculated after converting the units of each element from mg kg−1 to cmolc kg−1 from both extraction methods (same conversion used to estimate CEC via summation) to evaluate its impact on ryegrass nutrient uptake and production. The utility of assessing the (Ca+Mg)/K ratio was also investigated by Antonangelo et al. (22) in their examination of potassium (K) use efficiency for soybean cultivation. This ratio serves as a valuable tool for simultaneously evaluating the relative concentrations of calcium (Ca), magnesium (Mg), and K in soil. Despite Ca often being the predominant cation in soils, the (Ca+Mg)/K ratio provides insights into the proportional availability of these essential nutrients to plants. By considering the balance between divalent cations (Ca and Mg) and the monovalent cation (K), this ratio offers a more nuanced understanding of soil nutrient dynamics and their impact on crop productivity. Notably, an imbalance in the (Ca+Mg)/K ratio can impede the uptake of K, a key macronutrient, thereby diminishing K use efficiency and adversely affecting the yield of crops like ryegrass.
2.4 Cation exchange capacity
The chosen methods for assessing soil CEC included the utilization of M3 and AA. The rationale behind evaluating both M3 and AA lies in the context of CEC modeling, which hinges on the individual CEC values of biochar and soil. Due to uncertainty about whether M3 or AA, would yield reliable results for biochar, we evaluated both extractants in a comparative analysis.
In the case of M3, the summation of K, Ca, and Mg values was employed to calculate the effective CEC (exchangeable aluminum was excluded, as it was not detected in soils with an initial pH of ≥5.5.). For the CEC determined using AA at pH 7.0, the same nutrients (K, Ca, and Mg) plus sodium (Na) were taken into consideration. Furthermore, for the purpose of thorough comparison, CEC determined via AA was assessed both with and without the inclusion of Na data.
Mehlich-3 is not typically utilized for ascertaining exchangeable Na levels in soils from OK, primarily due to its designed purpose and common application in extracting and quantifying concentrations of essential plant nutrients and specific trace elements, such as phosphorus (P), K, Ca, Mg, and various micronutrients. The combination of robust acids, such as hydrochloric and sulfuric acids, proves highly effective in extracting those nutrients from the soil. However, it lacks selectivity to select Na ions, which explains the negligible Na contents in exchangeable sites when M3 is applied. Conversely, AA is frequently used in soil testing for determining exchangeable Na. Findings indicated that M3 demonstrated efficacy in extracting exchangeable Ca, Mg, and K, along with AA; however, M3 was not suitable for the extraction of exchangeable sodium Na (23, 24). Nevertheless, the reliability of this method in evaluating exchangeable Na content hinges on several factors. While it generally performs well across a broad spectrum of soil types, its accuracy may fluctuate based on the specific mineral composition and structure of the soil in question.
2.5 Plant mineral nutrition
After harvesting, ryegrass shoots were washed with deionized (D.I.) water, oven-dried at 105°C to a constant weight, which was recorded, and ground using a mechanical grinder. The plant materials were subsequently analyzed for K, Ca, and Mg using EPA method 3050B (25) involving nitric acid digestion with concentrated HNO3 and H2O2. To determine nutrient concentrations in plant tissues, 0.5 g of ground plant materials were pre-digested for 1 hour with 10 ml of trace metal grade HNO3 in a block digester. The digests were then heated to 115°C for 2 hours and diluted to 50 mL with D.I. water (26). Finally, the digested samples were filtered and analyzed for K, Ca, and Mg using ICP-AES.
2.6 Data analysis
The dataset was submitted to analysis of variance (ANOVA) in JMP 15 to test the effect of factors such as biochar type, rates, and their interaction with the soil attributes investigated (pH, OC, Ca, Mg, K, Na, and CEC) and ryegrass Ca, Mg, and K uptake and yield. Regressions were plotted separately for each biochar when interactions were significant (p<.05) and slopes were different for each biochar as a function of increased application rates. If one of the biochars did not show a significant fit when plotted individually, the results from soils treated with each biochar were combined where applicable.
Pearson´s correlation analysis was performed to measure the association between CEC and other soil properties, such as OC, pH, Ca, Mg, and K as well as the (Ca+Mg)/K ratio in the soil CEC with element contents in plant tissues. The relationship between methods to determine soil CEC was also evaluated for the second experiment.
Non-linear segmented regressions, power/exponential, and quadratic (polynomial) models were properly fitted and evaluated for several relationships pertinent to the study. Models were only accepted when the convergence criterion of NLIN (non-linear) procedure of SAS (version 9.4) successfully converged, and the model was significant at least at p<.05. To account for soil and biochar properties, a multiple linear regression model was performed to predict the final soil CEC: (Equation 1). This was performed using Microsoft Excel, following the model described in Domingues et al. (4). The same multiple linear regression was used separately for K, Ca, Mg, and Na final prediction as well.
Where, biochar weight is the mass fraction of the biochar addition (e.g., 1% = 0.01), soil weight is the mass fraction of soil (e.g., 99% soil = 0.99), biochar CEC and soil CEC are the values for the CEC of the individual components, respectively; a, b and c are the regression coefficients.
All analyses comprised the whole dataset of measurements, containing all replicates, and the statistical parameters of all regressions were evaluated to ensure the models’ reliability and to allow comparison between extraction methods.
3 Results and discussion
3.1 Soil pH, OC, and CEC response to biochar application rates
The relationship between pH, OC, and CEC as a function of biochar application rates from both experiments are presented in Figure 1. Slopes differed for the two biochars (Supplementary Table 1). This divergence justified the need for a distinct linear regression assessment for each type of biochar. Unquestionably, the soil OC exhibits a consistent upward trend as the biochar application rate increases, irrespective of the biochar type. It is worth noting that the pH had a more significant increase with the application of PLB, attributable to its higher ash content, whereas soil OC showed a more pronounced increase with SGB, primarily due to its higher total carbon (TC) content (Table 1; Figure 1). Further details on the statistical parameters of the regression models are in Supplementary Table 1. The disparity in pH ranges observed across experiments cannot solely be attributed to variations in the application rates of biochars. It is crucial to underscore that the absence of plants in the initial experiment resulted in the lack of root exudates, nutrient uptake, and potentially reduced microbial activity. Consequently, soils devoid of plants may manifest distinct pH levels in contrast to those with plant presence, despite maintaining uniform experimental conditions in all other aspects.
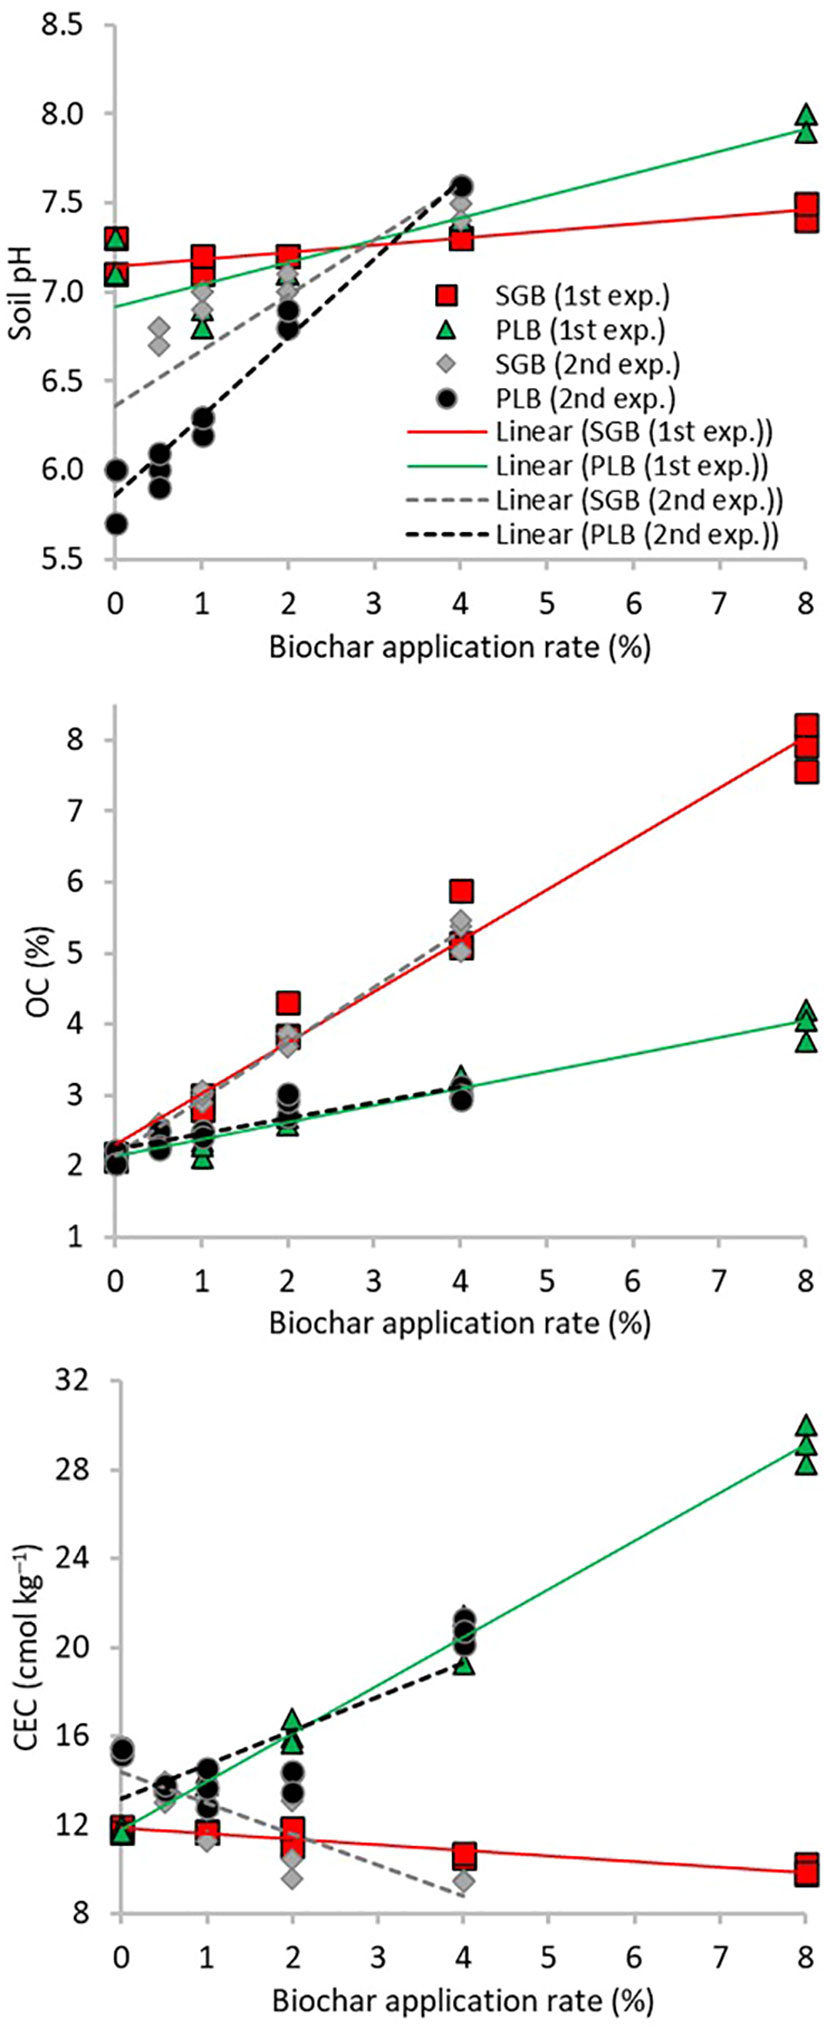
Figure 1 Linear relationships between biochar application rates and soil chemical attributes from two experiments. OC, organic carbon; CEC, cation exchange capacity; SGB, switchgrass-derived biochar; PLB, poultry litter-derived biochar. Results comprise the whole dataset of measurements for each biochar and experiment (n=15).
Given that the study involves the indirect estimation of CEC via summation, the measured cations influence the CEC values derived from the summation of soil-extractable cations, a crucial aspect to clarify for subsequent discussion since CEC itself is actually a property inherent to minerals and organic matter.
Intriguingly, CEC declined as the rates of SGB application increased, but significantly increased with PLB application. This behavior can be expected due to the considerable disparity in nutrient content, with PLB exhibiting approximately sixfold, sevenfold, and twentyfold higher content than SGB for Ca, Mg, and K, respectively (Table 1). This aligns with the findings of Domingues et al. (4), who emphasized the role of potassium (K) in achieving high CEC levels in biochar. Indeed, when applying PLB, a simple Pearson correlation analysis unveiled a robust positive correlation (r=0.94, p<.0001) between K and OC, reflecting the increase in OC content as PLB application rates escalated, albeit to a lesser extent compared to SGB. On the other hand, the pronounced negative correlations between Ca and Mg with OC provide insights into the CEC decline as SGB application rates increase (Table 2).
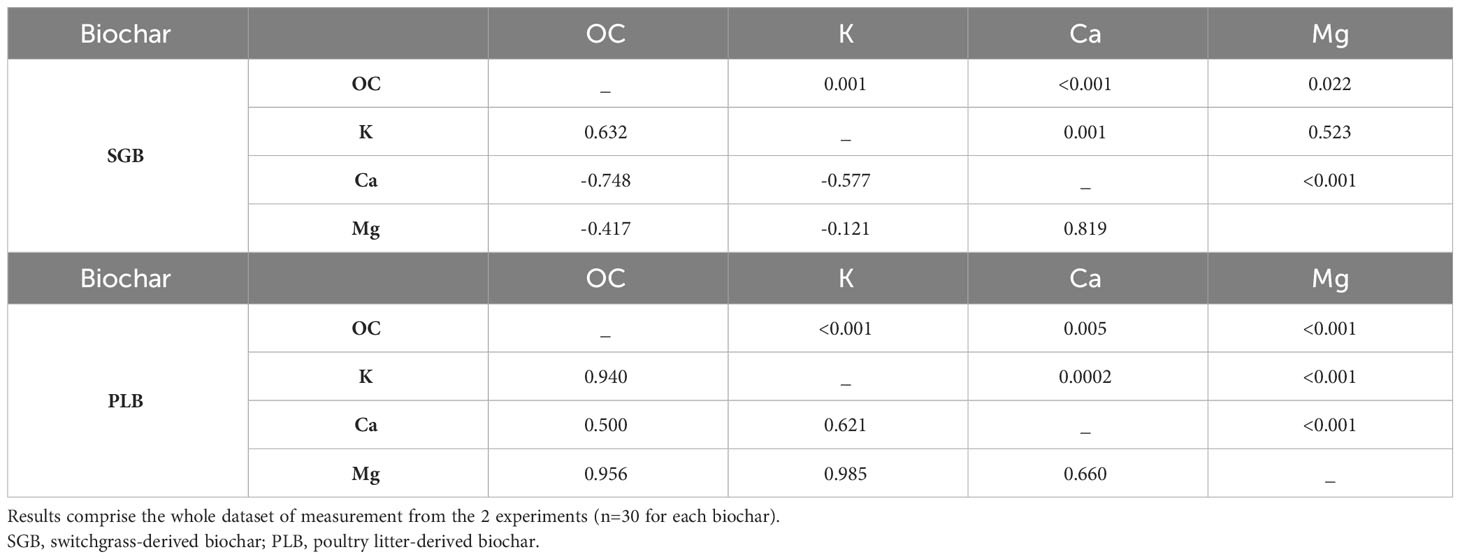
Table 2 Pearson correlation coefficients between selected soil chemical attributes (lower left triangle) and associated P-values (upper right triangle).
With high levels of OC application, Ca and Mg are likely to be chelated by dissolved organic carbon to varying degrees, more likely Ca>Mg (27, 28). There is a stronger negative correlation between Ca and OC compared to Mg and OC (Table 2), and the contents of exchangeable−Ca and −Mg were indeed reduced after increasing SGB application rates (not shown). These chelates facilitate their vertical movement into the subsoil. The organic anions formed during this process complex the cations (Ca2+ and Mg2+), promoting their leaching and mobilization (29), thereby diminishing their immediate availability and impacting soil CEC. This phenomenon is even more pronounced when Ca and Mg contents are low, and OC content is high, as evident when comparing SGB and PLB (Table 1). Our findings are corroborated by Domingues et al. (4) who demonstrated a reduction of soil CEC after application of increased rates of another green waste-derived biochar, produced from sugarcane bagasse also pyrolyzed at high temperature (750°C).
The existing data strongly indicates a consistent rise in soil CEC with biochars derived from high-ash feedstocks in contrast to those from low-ash feedstocks, as observed by Gaskin et al. (30) Mukome et al. (31), and Díaz-Terán et al. (32). Attention should be directed toward the possibility that the observed high CEC in PLB-amended soil may stem from the elevated ash content of the biochar. Oxide-based minerals, typically generated during pyrolysis, may dissolve when exposed to extractable solutions, thereby increasing the presence of dissolved cations in the soil without necessarily being adsorbed. Consequently, the summation method may inadvertently overestimate CEC by incorporating non-exchangeable cations, particularly evident when incorporating high ash-content biochar into soils.
Overall, the outcomes delineated in our investigation underscore the potential for achieving seemingly conflicting objectives through the application of both high and low ash biochars. This aligns with the conclusions drawn by Domingues et al. (4), even when evaluating soil CEC through the replacement method. Notably, this encompasses the simultaneous augmentation of soil OC, while also stressing potential fluctuations in soil CEC, contingent upon the feedstock employed for biochar production.
3.2 Calcium and magnesium to potassium ratio
The relationship between the ratio of (Ca+Mg)/K and the availability of Ca, Mg, and K in the soil is shown in Supplementary Figure 1, while the statistical parameters of the non-linear regression models can be found in Table 3. The results encompass the entire dataset of measurements derived from the second experiment, as the (Ca+Mg)/K ratio in the soil holds relevance for studies related to plant nutrient uptake. Evaluating this relationship becomes especially crucial when estimating CEC by summation. It is noteworthy that the increase in (Ca+Mg)/K has a simultaneous effect of augmenting exchangeable Ca while diminishing the levels of Mg and K (Supplementary Figure 1).
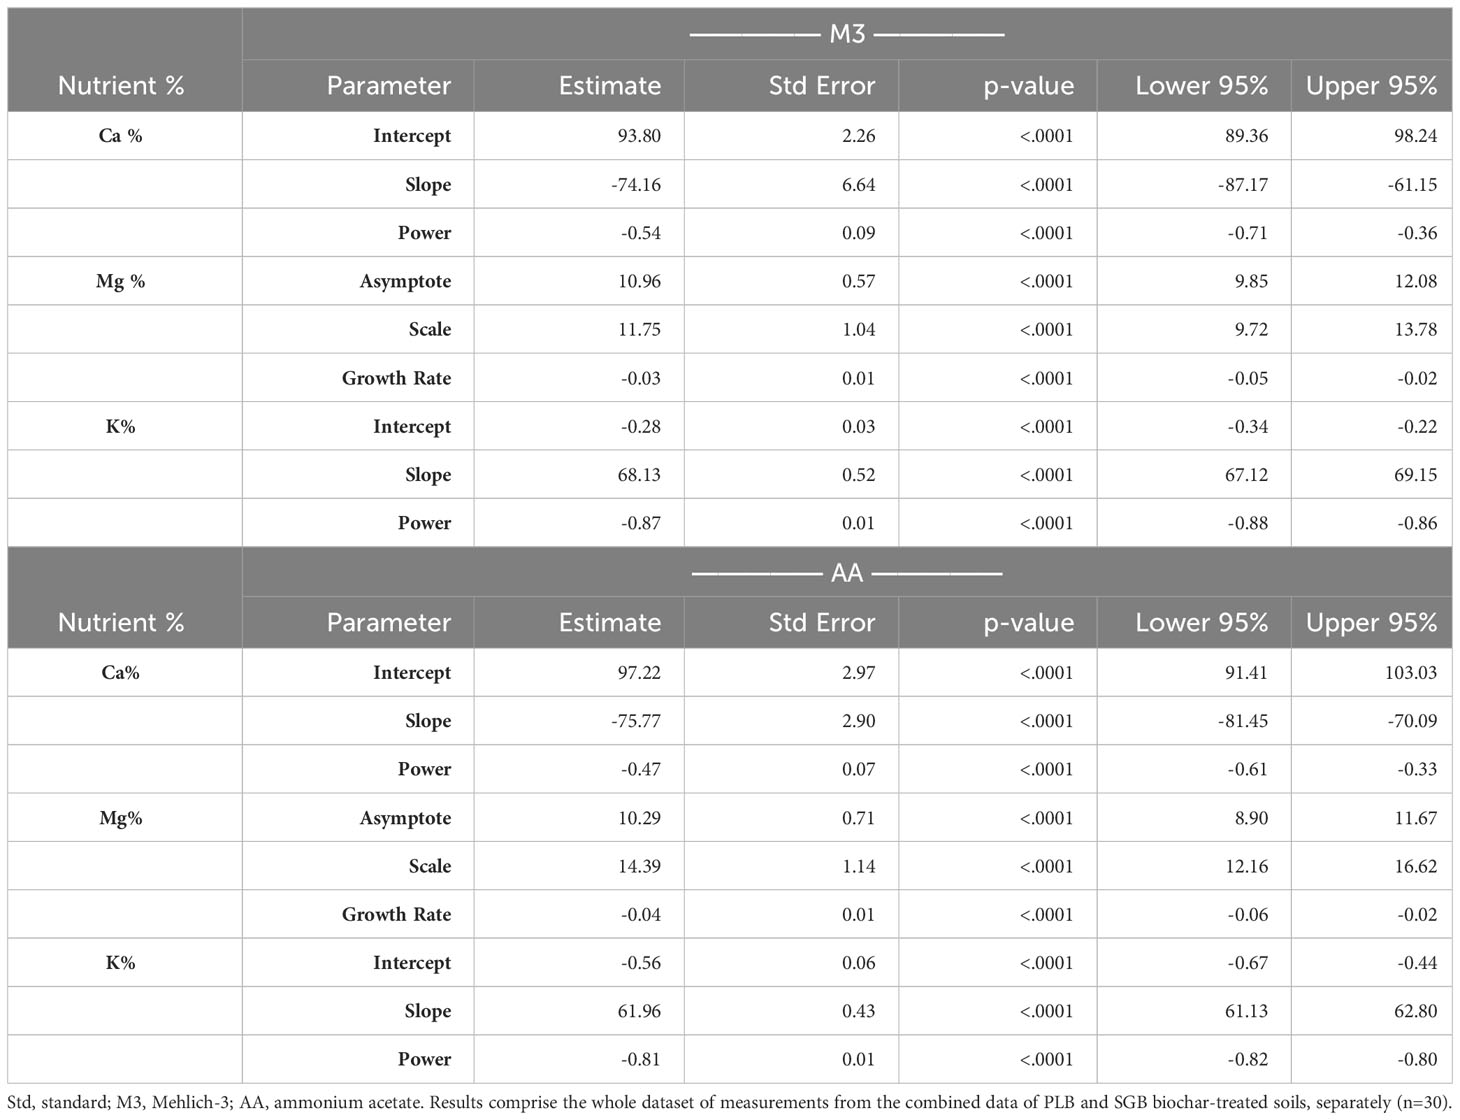
Table 3 Statistical parameters of the power/exponential regressions fitted for the selected relationships.
Remarkably, the CEC of biochar may favor the retention of Ca in the root zone, enhancing its availability for plant uptake, as suggested by Wan et al. (33). Additionally, the competitive adsorption of Ca over K on the biochar surface may be responsible for the increased Ca availability in the soil solution, even when the biochar has a higher K content. This observation was also found in the studies by Kolahchi and Jalali (34) and Doulgeris et al. (35). On the contrary, a reduction in CEC concurrent with increased Ca availability may be attributable to the phenomenon wherein biochar occludes CEC sites, thereby elevating the concentration of Ca in the soil solution. Consequently, it is plausible that biochar application may obscure mineral surfaces, thereby reducing CEC and augmenting the nutrient availability. The foundational equations (Table 3) for calculating the ideal Ca : Mg:K relationship will be explored next.
When assessing the relationship between soil extractable nutrients and corresponding elemental uptake individually, the results did not exhibit a clear trend of positive linear correlation, with many instances of non-significant or negative associations, and only a few instances showing a positive linear relationship depending on the biochar used (Supplementary Figure 2). This observation aligns well with our previous discussions. The notable positive linear uptake of K following SGB application, irrespective of the extractant used, can be rationalized by the soil’s maximum available K content, which reaches about 90 mg kg-1, falling below the 100% sufficiency threshold for optimal ryegrass production (125 mg kg-1) as reported by Zhang et al. (36). Furthermore, the lack of a discernible linear trend in Ca and Mg uptake individually possibly facilitates a more pronounced linear uptake of K when SGB is applied (Supplementary Figure 2). Conversely, with PLB, characterized by a notably higher mineral content, a decline in K and Mg uptakes is evident, while Ca uptake demonstrates a linear increase (Supplementary Figure 2).
Regarding biomass yield, an examination of soil-available K, Ca, and Mg individually reveals that maximum yield (quadratic relationship) is achieved when all three elements attain an appropriate ratio. Specifically, in the case of SGB, ryegrass yield remains unchanged with higher concentrations of Ca and Mg in the soil, while it decreases with greater plant-available K levels. Comparable results are observed with PLB, albeit with a noticeable decrease in yield as soil Mg content increases (Supplementary Figure 3).
3.3 (Ca+Mg)/K and CEC effects on ryegrass nutrients uptake and yield
Regression analyses were conducted on the concentrations of K and Ca+Mg within ryegrass tissues in relation to the (Ca+Mg)/K ratio found in the soil CEC (Figure 2) to understand how this interaction influences the plant’s uptake of each nutrient, although the combined ‘Ca+Mg’ was evaluated in the plant to be consistent with ratio studied in the soil. To accurately capture these relationships, separate linear plots were generated for each biochar, primarily due to ANOVA’s findings that indicated distinct slopes. This differentiation was attributed to the significant interaction effect between Biochar and (Ca+Mg)/K, regardless of the chosen extraction method (Supplementary Table 2). It is noteworthy that the levels of Ca, Mg, and K exhibited a strong correlation between the two extraction methods (Supplementary Figure 4). Consequently, the insights derived from Figure 2 remained consistent. For both biochars and the two extraction methods, a consistent pattern emerged: as the (Ca+Mg)/K ratio in the soil’s CEC increased, the K content in ryegrass tissues exhibited a linear decrease. Conversely, an incremental trend was observed in the Ca+Mg content within ryegrass tissues as the (Ca+Mg)/K ratio in the soil’s CEC increased; however, this increment was only significant in the case of PLB. The non-relationship with SGB can be attributed to the inverse correlation between soil exchangeable−Ca and −Mg and organic carbon (OC) associated with the increased rates of the green waste-derived biochar application (Table 2).
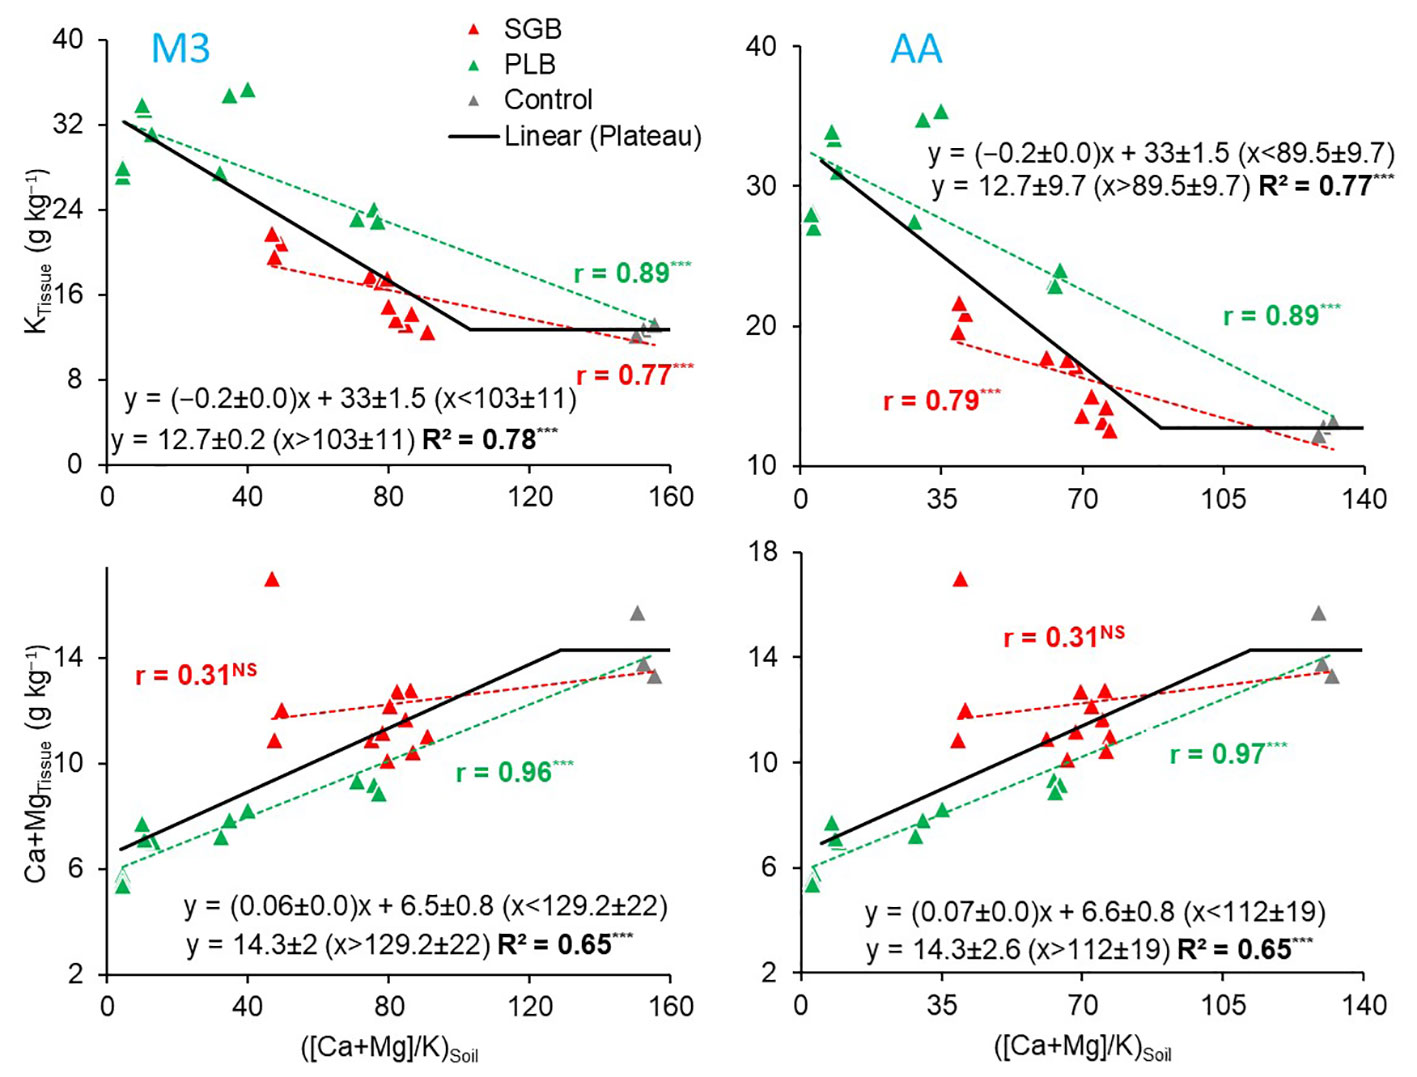
Figure 2 Pearson correlation (r-values) for the relationship between the soil available (Ca+Mg)/K with potassium (K) and Ca+Mg uptake by ryegrass as a function of either switchgrass-derived biochar (SGB) or poultry litter derived biochar (PLB) (n=15); and the linear-plateau relationship for the combined results of the two biochar treated soils separately (n=30). Results are presented for the two extraction methods, Mehlich-3 (M3) and Ammonium Acetate (AA). ***p<.0001. NS, non-significant (p>.05).
The analysis of the variables yielded a non-linear model when we combined both biochars, and a segmented linear-with-plateau model was effectively fitted (Figure 2). The combination of these two biochars introduced a wide range of (Ca+Mg)/K ratios, as well as K and Ca+Mg contents in ryegrass tissues. This allowed us to explore a broad spectrum of potential applications for these relationships. Interestingly, we observed that, for both extractants, the points at which K contents in plant tissues stopped declining due to an increase in the (Ca+Mg)/K ratio were lower than the points at which Ca+Mg contents in ryegrass shoots ceased to increase (Figure 2). This observation suggests that, at a certain point, an increment in the (Ca+Mg)/K ratio in the soil CEC no longer impacts K uptake, possibly due to the non-linear relationship (Supplementary Figure 1). To illustrate, KTissue and Ca+MgTissue exhibited a plateau effect, where the (Ca+Mg)/K ratio in soil CEC reached, respectively, a steady state at joints of 103 and 129 when M3 was employed, and 89.5 and 112 when AA was utilized. Notably, these values reflect a consistent percentage distribution of approximately 88% for Ca, 11% for Mg, and 1% for K (Table 4) when employing the model equations (Table 3). This phenomenon can be attributed to the complex non-linear relationships obtained (Supplementary Figure 1; Table 3).
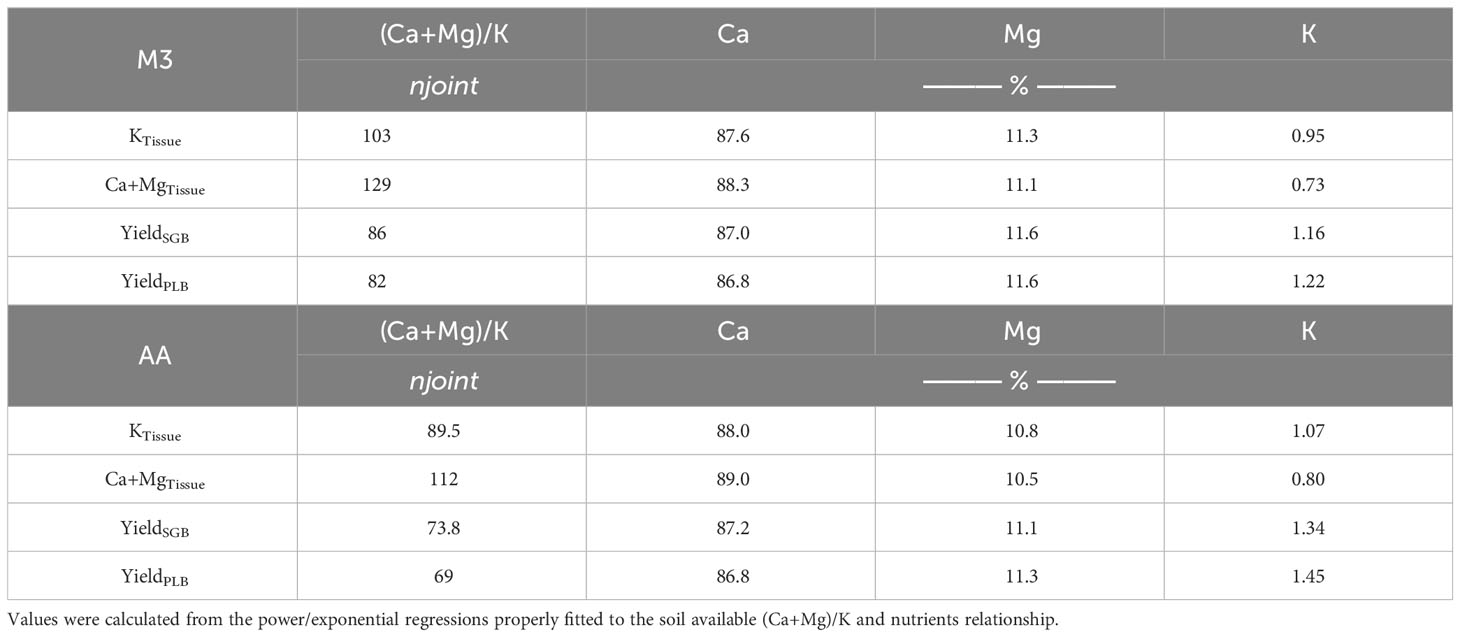
Table 4 Percentage distribution of soil exchangeable-Ca, -Mg, and -K for the joint point values (njoint) observed with the non-linear relationships.
The 88:11:1 ratio remained consistent across the two extraction methods. The 8:1 Ca : Mg ratio we identified in our study falls within the recommended range of 5:1 to 10:1 for many forage species, as suggested by Sumner and Miller (8). While it is typically deemed ideal to have a K percentage in the soil CEC of 2 to 5% for most forages, and particularly 4% for perennial ryegrass (37), our findings demonstrate that 1% K in the Ca : Mg:K relationship is sufficient for optimal ryegrass nutrient uptake and production (Table 4; Figure 3).
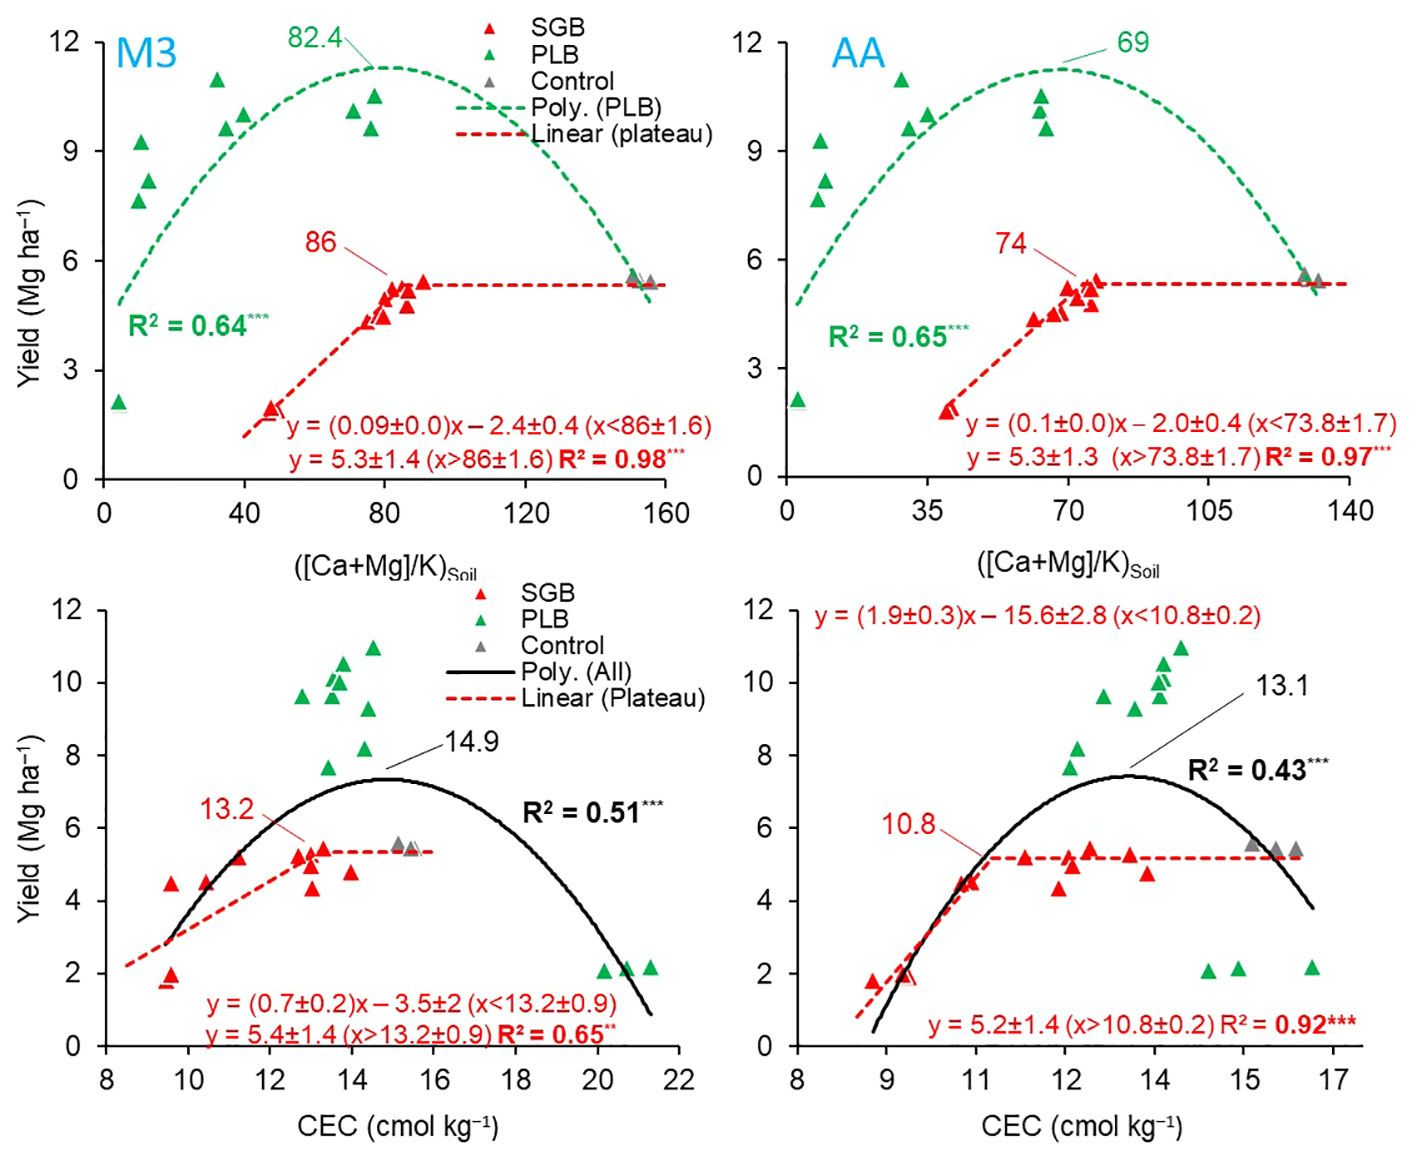
Figure 3 (Top) linear-plateau and quadratic relationships between the soil available (Ca+Mg)/K and ryegrass yield as a function of either switchgrass-derived biochar (SGB) or poultry litter derived biochar (PLB) (n=15), respectively; and (bottom) linear-plateau and quadratic relationships between cation exchange capacity (CEC) and ryegrass yield as a function of either SGB (n=15) or combined results of both biochars applied separately, respectively (n=30). Results are presented for the two extraction methods, Mehlich-3 (M3) and Ammonium Acetate (AA). **p<.01; ***p<.0001. The maximum point of a quadratic fit was calculated from the polynomial function y = ax2 + bx + c; where: maximum point = ([ ± b]/[2×a]).
The soil ratios of (Ca+Mg)/K, specifically 86 (M3) and 74 (AA) for SGB, as well as 82.4 (M3) and 69 (AA) for PLB, were identified as the optimal for maximizing ryegrass yield (Figure 3). Furthermore, the calculated percentages of Ca : Mg:K, approximated to 88:11:1, closely mirrored the observed trends in K and Ca+Mg uptake (Table 4). The ANOVA results evaluating the interaction between (Ca+Mg)/K and Biochar yielded non-significant findings for the response variable ‘yields’ (Supplementary Table 2). Nevertheless, the relationship between each biochar and yield was not linear, with a segmented model for SGB and a quadratic function for PLB (Figure 3). The statistical parameters of the quadratic functions, derived from polynomial regressions with PLB, are presented in Table 5. It is important to note that a suitable regression model could not be established when considering the combined dataset for both biochars in relation to ryegrass yield response to the (Ca+Mg)/K ratio.
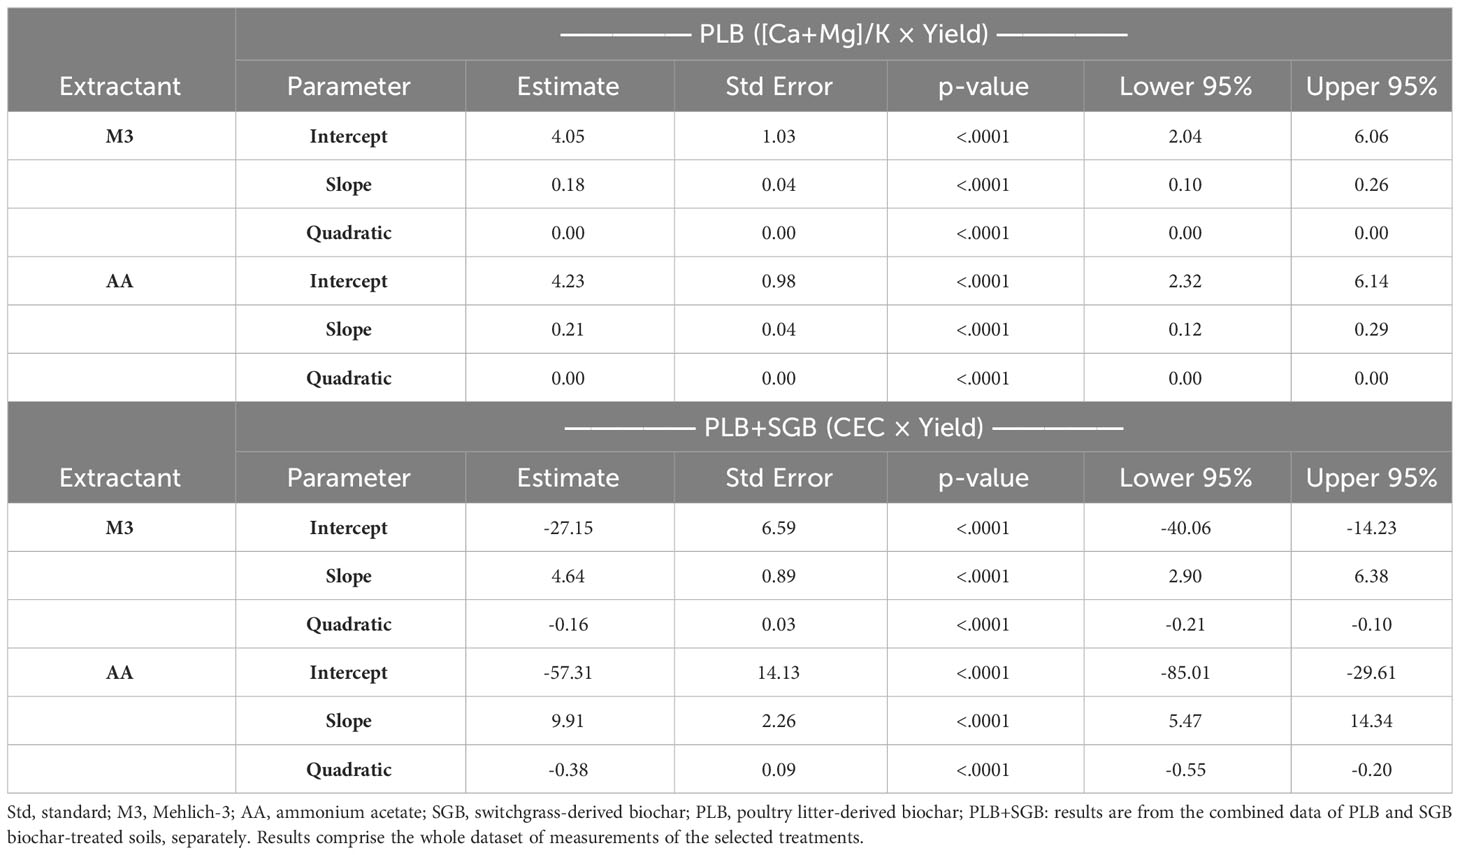
Table 5 Statistical parameters of the quadratic regressions fitted for the selected relationships.
Despite the similarity in the (Ca+Mg)/K ratio for each biochar, ryegrass yields were significantly higher after PLB application compared to SGB (Figure 3). This can be attributed to the greater availability of soil nutrients provided by PLB, owing to its higher ash content. This allowed PLB to reach exchangeable-K levels slightly above the 100% sufficiency level of 125 mg K kg−1, recommended for optimal ryegrass production (36). Notably, as the content of soil available K increased with increasing rates of both biochars, it is worth emphasizing that even at 4% SGB, K levels only reached around 80 mg K kg−1. In contrast, the 100% sufficiency K levels (125 mg kg−1) had already been attained with PLB application at rates as low as 0.5 to 1%. Inversely, the decline in yield observed as PLB rates increased beyond the (Ca+Mg)/K ratio of 82.4 (M3) and 69 (AA) can be attributed to an imbalanced nutrient relationship in the soil and elevated electrical conductivity for ryegrass production (17). Therefore, in our study, maintaining a harmonious balance of Ca : Mg:K holds paramount significance in achieving optimal crop yields. However, it must be acknowledged that other essential nutrients, influenced by biochar addition, may significantly impact biomass production (Supplementary Table 3). This holistic approach considers the nuanced interactions between nutrients and biochar-mediated soil dynamics, emphasizing the need for comprehensive nutrient management strategies to enhance crop productivity sustainably.
In tropical and humid regions with acidic soils, CEC alone does not serve as a reliable indicator for crop yield. This limitation stems from the fact that a substantial portion of the CEC tends to be composed of aluminum (Al). However, in our study, a different scenario emerged. Despite the absence of exchangeable Al due to the initial soil pH of approximately ≥5.5, we observed a decrease in crop yield beyond the optimal point of CEC, particularly following the application of PLB (Figure 3). This reduction in yield could be attributed to an imbalanced ratio of calcium and magnesium (Ca+Mg) concerning potassium (K). This proves that while a higher CEC is often associated with enhanced nutrient retention and availability, it is essential to recognize that the composition of the cations on the exchange sites plays a crucial role in determining the overall fertility and plant growth potential of the soil.
The statistical parameters for the quadratic functions, obtained through polynomial regressions using the combined dataset of SGB and PLB, are in Table 5. When examining the PLB dataset independently, it was not possible to establish a viable regression model to elucidate the relationship between ryegrass yield response and soil CEC. For our study, CEC values of 13.2 (M3) and 10.8 (AA) cmol kg−1 were established to provide the optimum Ca : Mg:K of 88:11:1 for ryegrass growth when only SGB is applied (Figure 3). When combining datasets from both biochars, those values shifted respectively to 14.9 and 13.1 cmol kg−1. Such values are very close to each other since the correlation of CEC values between the two methods was highly significant (Figure 4).
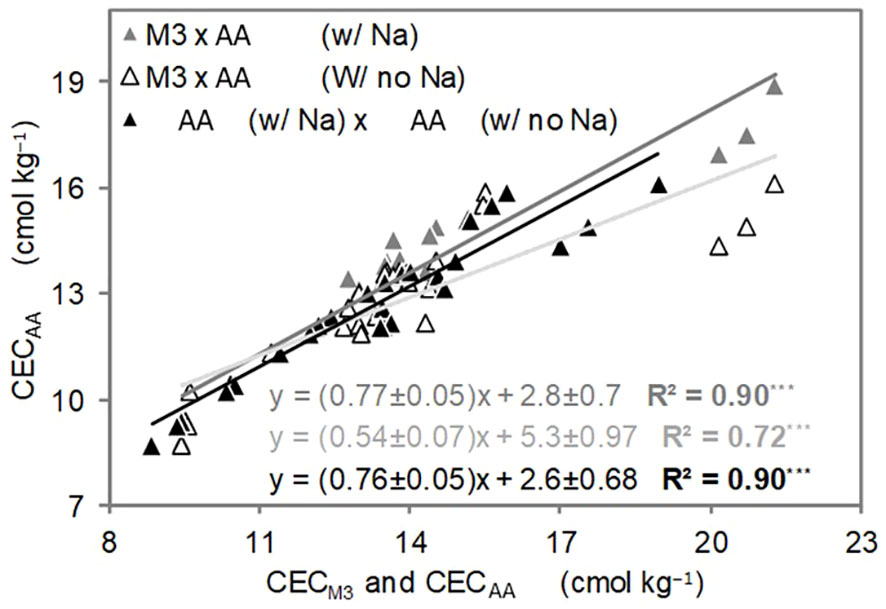
Figure 4 Linear relationship between methods of cation exchange capacity (CEC) determination in the soil (2nd experiment). Results comprise the whole dataset of measurements (n=30 each regression). ***p<.0001.
Linear correlations between CEC estimated by M3 and both AA-added and non-added sodium (Na), as well as the relationship between CEC estimated by AA with and without Na are illustrated (Figure 4). It is not surprising to find a robust linear correlation (R2 = 0.90, p<.001) when incorporating or omitting Na in the CEC summation via AA (Figure 4).
The reason Na is not included in the M3 extraction process lies in its unreliability as an indicator of exchangeable Na when compared to the dependable results obtained through AA. Unlike some alternative extraction methods, M3 lacks a standardized protocol for extracting Na from soil and has not been tested by many works (23), although the element estimation has been considered adequate by Mehlich (20), leading to potential variations in results across different laboratories and studies (24). Conversely, the AA method for Na extraction boasts a solid foundation within scientific literature, supported by extensive validation and research studies that vouch for its reliability and accuracy. The relationship between CEC via summation from the two different extraction methods reveals a more significant correlation between M3 and AA with added Na (R2 = 0.90, p<.001) than between M3 and AA without Na (R2 = 0.72, p<.001) (Figure 4). This outcome is well-justified since AA is a well-established method for determining exchangeable Na in soils, and its inclusion in our CEC estimation via summation is particularly relevant due to the substantial Na content present in the PLB (Table 1).
3.4 Biochar impact on soil CEC modeling
The results of the comparison between observed and predicted soil CEC are shown in Figure 5. Plots using M3 to estimate CEC (CECM3) via summation and to predict final soil CEC via modeling comprise the whole dataset of measurements from the two experiments carried out in this study. To emphasize, only the second experiment introduced an additional extraction method (AA) to enhance the model’s applicability, as it also considered plant factors. A high level of predictability in soil CEC, irrespective of the extraction method employed (Figure 5), is attributed to the efficacy of the models developed (Table 6). These findings emphasize that the final soil CEC can be theoretically estimated based on the original CEC of both biochar and soil. It is worth noting that the results appear to be particularly promising for the M3 approach, as evidenced by its more robust R-squared (R2) values when compared to the model prediction using the AA extraction method (Figure 5).

Figure 5 Linear relationship between actual Cation exchange capacity (CEC) and predicted CEC, as soil CEC = a + (b × [CEC × biochar weight]) + (c × [CEC × soil weight]). Methods evaluated were Mehlich-3 (M3) (top) and ammonium acetate (AA) (bottom). Results comprise the whole dataset of measurements (n=30 each biochar, except for ‘CEC-M3 all’, where n=60 from combined experiments). ***p<.0001.
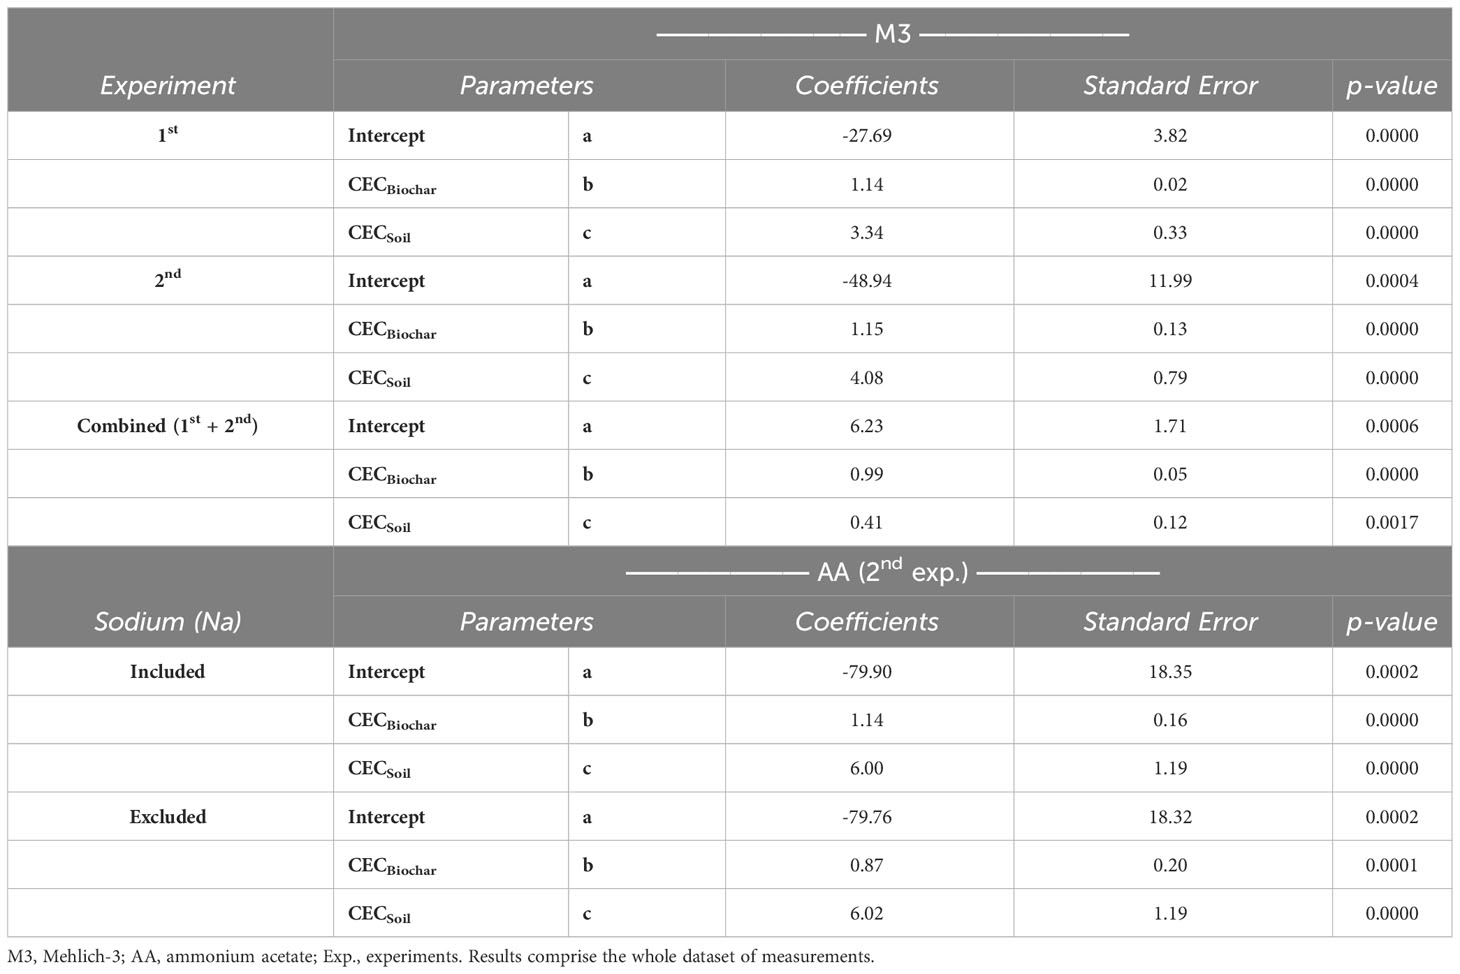
Table 6 Statistical parameters of linear regressions between the actual and predicted soil CEC from two extraction methods and two experiments.
To elucidate this discrepancy, we conducted a thorough assessment of individual nutrient predictions, each used in the calculation of CEC via summation, employing the same predictive model. While all the statistical parameters yielded high significance levels (p<.01) for nutrients extracted with M3, some fell short in providing confidence (p>.05) for predicting K and sodium (Na) when AA was employed as the extractant (Table 7). This problem was particularly pronounced for Na prediction, despite the model’s relationship appearing highly significant (Supplementary Figure 5).
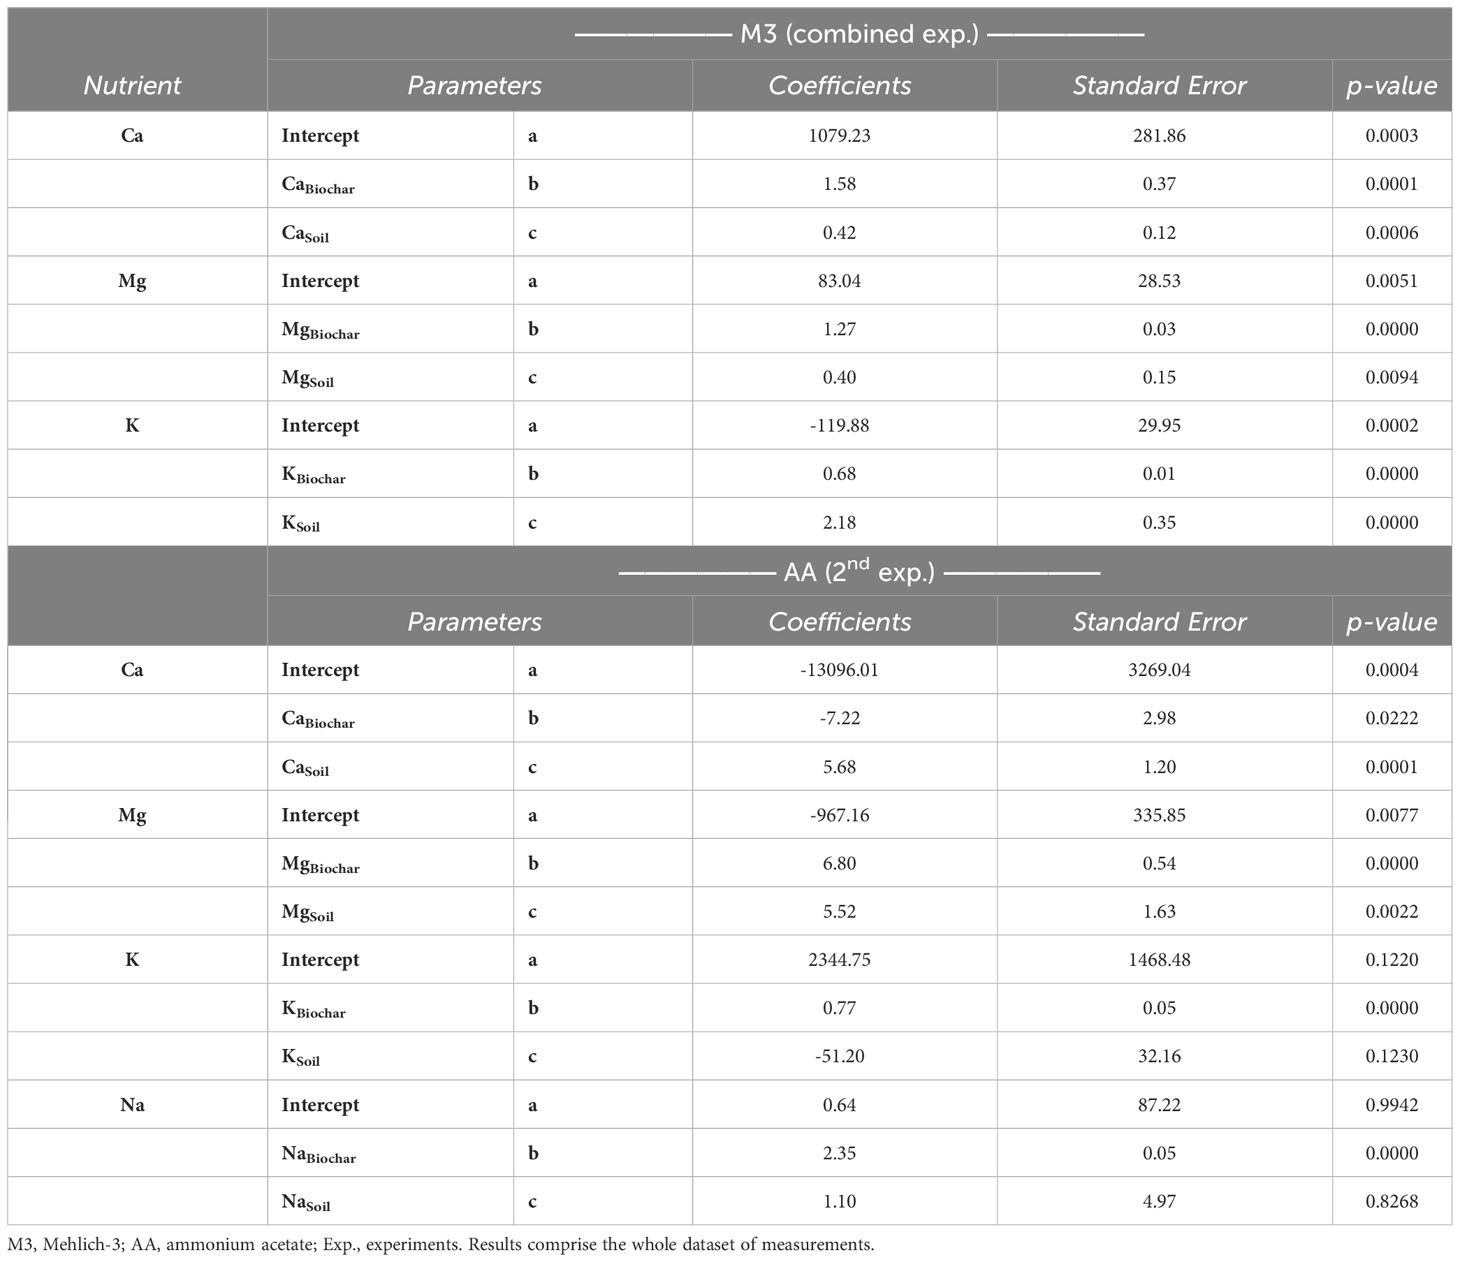
Table 7 Statistical parameters of linear regressions between the actual and predicted soil nutrients and Na from two extraction methods and two experiments.
Considering these findings, we suspect that while Na can be reliably quantified in AA extracts from the soil, it may not be accurately assessed when the same extractant is applied to biochar solely. This suggests that Na sensitivity is influenced by the differing matrix compositions of soil and biochar. Graphical representations comparing actual measurements to predicted exchangeable nutrients can be found in Supplementary Figure 6. It is noteworthy that, except for Ca, the other two nutrients (Mg and K) exhibited a more favorable alignment with M3 extracts (Supplementary Figure 6). This observation may well correspond with the more consistent modeling predictions for soil CEC when employing M3 as the extractant, in contrast to AA.
Utilizing the entire dataset, which comprises the results combination from the two biochars applied separately, resulted in an enhancement of the predictive power for CEC (specific data not presented for individual biochars). To the best of the authors’ knowledge, this marks the pioneering endeavor to construct a predictive model for soil CEC by combining estimates from two distinct methods. Moreover, it investigates how CEC evolves in response to the introduction of biochar in soils cultivated with plants.
4 Conclusion
Based on the results obtained from the two experiments, the SGB demonstrated a notable average decrease of approximately 27% in CEC across varying rates of biochar application. Conversely, the PLB exhibited a significant increase in CEC by 90.8%. These findings underscore the crucial influence of biochar properties on CEC dynamics. The second experiment further elucidated the relevance of the (calcium and magnesium)/potassium ratio ([Ca+Mg]/K) in soil CEC, particularly in the context of ryegrass cultivation. Optimal ryegrass production was associated with specific (Ca+Mg)/K ratios, ranging from 82.4−86 (M3) and 69−74 (AA), with a corresponding % Ca : Mg:K relationship of 88:11:1. Additionally, the development of predictive models for soil CEC after biochar application, based on initial soil and biochar CEC, proved successful. Notably, the M3 extraction method emerged as more reliable than AA, showcasing superior accuracy in predicting nutrient availability from biochar despite the distinct matrixes of biochar and soil. These collective findings positively confirm our hypotheses and offer valuable insights into the intricate interactions between biochar characteristics, soil properties, and plant growth dynamics, offering practical implications for sustainable soil management.
Data availability statement
The raw data supporting the conclusions of this article will be made available by the authors, without undue reservation.
Author contributions
JA: Conceptualization, Data curation, Formal analysis, Investigation, Methodology, Validation, Visualization, Writing – original draft, Writing – review & editing. SC: Conceptualization, Data curation, Formal analysis, Methodology, Validation, Visualization, Writing – original draft, Writing – review & editing. HZ: Conceptualization, Formal analysis, Funding acquisition, Methodology, Project administration, Resources, Supervision, Writing – original draft, Writing – review & editing.
Funding
The author(s) declare financial support was received for the research, authorship, and/or publication of this article. This work was supported by the Oklahoma Agricultural Experiment Station.
Conflict of interest
The authors declare that the research was conducted in the absence of any commercial or financial relationships that could be construed as a potential conflict of interest.
Publisher’s note
All claims expressed in this article are solely those of the authors and do not necessarily represent those of their affiliated organizations, or those of the publisher, the editors and the reviewers. Any product that may be evaluated in this article, or claim that may be made by its manufacturer, is not guaranteed or endorsed by the publisher.
Supplementary material
The Supplementary Material for this article can be found online at: https://www.frontiersin.org/articles/10.3389/fsoil.2024.1371777/full#supplementary-material
References
1. Chapman HD. Cation-exchange capacity. Agron Monogr. (2016), 891–901. doi: 10.2134/agronmonogr9.2.c6
2. Lemire E, Taillon KM, Hendershot WH. Using PH-dependent CEC to determine lime requirement. Can J Soil Sci. (2006) 86:133–9. doi: 10.4141/s05-002
3. Mattila TJ, Rajala J. Estimating cation exchange capacity from agronomic soil tests: Comparing Mehlich-3 and ammonium acetate sum of cations. Soil Sci Soc America J. (2021) 86:47–50. doi: 10.1002/saj2.20340
4. Domingues RR, Sánchez-Monedero MA, Spokas KA, Melo LCA, Trugilho PF, Valenciano MN, et al. Enhancing cation exchange capacity of weathered soils using biochar: Feedstock, pyrolysis conditions and addition rate. Agronomy. (2020) 10:824. doi: 10.3390/agronomy10060824
5. Das S, Chatterjee S, Rajbanshi J. Responses of soil organic carbon to conservation practices including climate-smart agriculture in tropical and subtropical regions: A meta-analysis. Sci Total Environ. (2022) 805:150428. doi: 10.1016/j.scitotenv.2021.150428
6. Baquy MA-A, Li JY, Shi RY, Kamran MA, Xu RK. Higher cation exchange capacity determined lower critical soil ph and higher al concentration for soybean. Environ Sci Pollut Res. (2018) 25:6980–9. doi: 10.1007/s11356-017-1014-y
7. Gruba P, Mulder J. Tree species affect cation exchange capacity (CEC) and cation binding properties of organic matter in acid forest soils. Sci Total Environ. (2015) 511:655–62. doi: 10.1016/j.scitotenv.2015.01.013
8. Sumner ME, Miller WP. Cation exchange capacity and exchange coefficients. SSSA Book Ser. (2018), 1201–29. doi: 10.2136/sssabookser5.3.c40
9. Kaledhonkar MJ, Keshari AK, van der Zee SEATM. ‘Relative sensitivity of ESP profile to spatial and temporal variability in cation exchange capacity and pore water velocity under simulated field conditions’. Agric Water Manage. (2006) 83:58–68. doi: 10.1016/j.agwat.2005.10.001
10. Chaganti VN, Culman SW. Historical perspective of soil balancing theory and identifying knowledge gaps: A Review. Crop Forage Turfgrass Manage. (2017) 3:1–7. doi: 10.2134/cftm2016.10.0072
11. Leiva Soto A, Culman SW, Herms C, Sprunger C, Doohan D. Managing soil acidity vs. Soil Ca:mg ratio: What is more important for crop productivity? Crop Forage Turfgrass Manage. (2023) 9. doi: 10.1002/cft2.20210
12. Goulding K, Murrell TS, Mikkelsen RL, Rosolem C, Johnston J, Wang H, et al. Outputs: potassium losses from agricultural systems. Improv Potassium Recommend Agric Crops. (2021), 75–97. doi: 10.1007/978-3-030-59197-7_3
13. Brugman SJ, Werkhoven BL, Townsend ER, Accordini P, van Roij R, Vlieg E. Monovalent – divalent cation competition at the muscovite mica surface: Experiment and theory. J Colloid Interface Sci. (2020) 559:291–303. doi: 10.1016/j.jcis.2019.10.009
14. Yu C, Geisseler DJ, Brown PH, Khalsa SDS. Distribution of potassium, calcium, and magnesium ions from potassium fertilizers in columns of Orchard Soils. Soil Sci Soc America J. (2023) 87:572–85. doi: 10.1002/saj2.20535
15. Jeffery S, Verheijen FG, van der Velde M, Bastos AC. A quantitative review of the effects of biochar application to soils on crop productivity using meta-analysis. Agric Ecosyst Environ. (2011) 144:175–87. doi: 10.1016/j.agee.2011.08.015
16. Lehmann J, Joseph S. Biochar for environmental management: an introduction. In: Biochar for environmental management: Science, technology and implementation. Routledge, Taylor & Francis Group, London, UK (2015). p. 33–46.
17. Antonangelo JA, Zhang H. Heavy Metal phytoavailability in a contaminated soil of northeastern Oklahoma as affected by Biochar Amendment. Environ Sci Pollut Res. (2019) 26:33582–93. doi: 10.1007/s11356-019-06497-w
18. Antonangelo JA, Zhang H, Sun X, Kumar A. Physicochemical properties and morphology of biochars as affected by feedstock sources and pyrolysis temperatures. Biochar. (2019) 1:325–36. doi: 10.1007/s42773-019-00028-z
19. Antonangelo JA, Souza JLB, Whitaker A, Arnall B, Zhang H. Evaluation of mehlich-3 as a multi-element extractant of micronutrients and sulfur in a soil–ryegrass system amended with varying biochar rates from two feedstocks. Land. (2022) 11:1979. doi: 10.3390/land11111979
20. Mehlich A. Mehlich 3 soil test extractant: A modification of Mehlich 2 extractant. Commun Soil Sci Plant Anal. (1984) 15:1409–16. doi: 10.1080/00103628409367568
21. Normandin V, Kotuby-Amacher J, Miller RO. Modification of the ammonium acetate extractant for the determination of exchangeable cations in calcareous soils. Commun Soil Sci Plant Anal. (1998) 29:1785–91. doi: 10.1080/00103629809370069
22. Antonangelo JA, Firmano RF, Alleoni LR, Oliveira A Jr, Zhang H. Soybean production under continuous potassium fertilization in a long-term no-till Oxisol. Agron J. (2019) 111:2462–71. doi: 10.2134/agronj2019.02.0084
23. Mamo T, Richter C, Heiligtag B. Comparison of extractants for the determination of available phosphorus, potassium, calcium, magnesium and sodium in some Ethiopian and German soils. Commun Soil Sci Plant Anal. (1996) 27:2197–212. doi: 10.1080/00103629609369697
24. Fukuda M, Nakamura S, Fonseca ADCL, Nasukawa H, Ibraimo MM, Naruo K, et al. Evaluation of the mehlich 3 reagent as an extractant for cations and available phosphorus for soils in Mozambique. Commun Soil Sci Plant Anal. (2017) 48:1462–72. doi: 10.1080/00103624.2017.1373789
25. Church C, Spargo J, Fishel S. Strong acid extraction methods for “total phosphorus” in soils: EPA method 3050B and EPA method 3051. Agric Environ Lett. (2017) 2. doi: 10.2134/ael2016.09.0037
26. Jones JB, Case VW. Sampling, handling, and analyzing plant tissue samples. SSSA Book Ser. (2018) 3:389–427. doi: 10.2136/sssabookser3.3ed.c15
27. Zambrosi FC, Alleoni LR, Caires EF. Liming and ionic speciation of an Oxisol under no-till system. Scientia Agricola. (2008) 65:190–203. doi: 10.1590/s0103-90162008000200013
28. Antonangelo JA, Ferrari J, Crusciol CAC, Alleoni LRF. Lime and calcium-magnesium silicate in the ionic speciation of an Oxisol. Scientia Agricola. (2017) 74:317–33. doi: 10.1590/1678-992x-2016-0372
29. Cassiolato ME, Meda AR, Pavan MA, Miyazawa M, Oliveira JCD. Evaluation of oat extracts on the efficiency of lime in soil. Braz Arch Biol Technol. (2000) 43:533–6. doi: 10.1590/s1516-89132000000500014
30. Gaskin JW, Steiner C, Harris K, Das KC, Bibens B. Effect of low-temperature pyrolysis conditions on biochar for agricultural use. Trans ASABE. (2008) 51:2061–9. doi: 10.13031/2013.25409
31. Mukome FN, Zhang X, Silva LC, Six J, Parikh SJ. Use of chemical and physical characteristics to investigate trends in biochar feedstocks. J Agric Food Chem. (2013) 61:2196–204. doi: 10.1021/jf3049142
32. Díaz-Terán J, Nevskaia DM, Fierro JLG, López-Peinado AJ, Jerez A. Study of chemical activation process of a lignocellulosic material with Koh by XPS and Xrd. Microporous Mesoporous Mater. (2003) 60:173–81. doi: 10.1016/S1387-1811(03)00338-X
33. Wan H, Liu X, Jiang M, Wei Z, Hossain MA, Liu F, et al. Biochar amendment alters root morphology of maize plant: Its implications in enhancing nutrient uptake and shoot growth under reduced irrigation regimes. Front Plant Sci. (2023) 14:1122742. doi: 10.3389/fpls.2023.1122742
34. Kolahchi Z, Jalali M. Simulating leaching of potassium in a sandy soil using simple and complex models. Agric Water Manage. (2006) 85:85–94. doi: 10.1016/j.agwat.2006.03.011
35. Doulgeris C, Kypritidou Z, Kinigopoulou V, Hatzigiannakis E. Simulation of potassium availability in the application of biochar in Agricultural Soil. Agronomy. (2023) 13:784. doi: 10.3390/agronomy13030784
36. Zhang H, Raun B, Arnall B. OSU soil test interpretations - Oklahoma State University, OSU Soil Test Interpretations (2017). Oklahoma State University. Available online at: https://extension.okstate.edu/fact-sheets/osu-soil-test-interpretations.html (Accessed 08 February 2024).
Keywords: cation exchange capacity, summation, biochar feedstock, cations relationship, ryegrass
Citation: Antonangelo JA, Culman S and Zhang H (2024) Comparative analysis and prediction of cation exchange capacity via summation: influence of biochar type and nutrient ratios. Front. Soil Sci. 4:1371777. doi: 10.3389/fsoil.2024.1371777
Received: 17 January 2024; Accepted: 18 March 2024;
Published: 27 March 2024.
Edited by:
Anna De Marco, University of Naples Federico II, ItalyReviewed by:
Paulo Pagliari, University of Minnesota Twin Cities, United StatesVijayasatya Chaganti, Virginia Tech, United States
Copyright © 2024 Antonangelo, Culman and Zhang. This is an open-access article distributed under the terms of the Creative Commons Attribution License (CC BY). The use, distribution or reproduction in other forums is permitted, provided the original author(s) and the copyright owner(s) are credited and that the original publication in this journal is cited, in accordance with accepted academic practice. No use, distribution or reproduction is permitted which does not comply with these terms.
*Correspondence: Joao Arthur Antonangelo, am9hby5hbnRvbmFuZ2Vsb0B3c3UuZWR1