 Yangyang Wu1,2,†
 Kaikai Lv1,2,†
 Xiaowei Hao1,2
 Chao Lv1,2Wenhui Lai3Xinze Xia4Aibo Pang2
 Qing Yuan1,2*
 Tao Song1,2*
- 1Department of Urology, The Third Medical Centre, Chinese People's Liberation Army (PLA) General Hospital, Beijing, China
- 2Graduate School, Medical School of Chinese People's Liberation Army (PLA), Beijing, China
- 3Graduate School, Hebei North University, Zhangjiakou, China
- 4Graduate School, Shanxi Medical University, Taiyuan, China
Background: Racial/ethnic disparity in waiting-list mortality among candidates listed for kidney transplantation (KT) in the United States remains unclear. We aimed to assess racial/ethnic disparity in waiting-list prognosis among patients listed for KT in the United States in the current era.
Methods: We compared waiting-list and early posttransplant in-hospital mortality or primary nonfunction (PNF) among adult (age ≥18 years) white, black, Hispanic, and Asian patients listed for only KT in the United States between July 1, 2004 and March 31, 2020.
Results: Of the 516,451 participants, 45.6%, 29.8%, 17.5%, and 7.1% were white, black, Hispanic, and Asian, respectively. Mortality on the 3-year waiting list (including patients who were removed for deterioration) was 23.2%, 16.6%, 16.2%, and 13.8% in white, black, Hispanic, and Asian patients, respectively. The cumulative incidence of posttransplant in-hospital death or PNF after KT was 3.3%, 2.5%, 2.4%, and 2.2% in black, white, Hispanic, and Asian patients,respectively. White candidates had the highest mortality risk on the waiting list or of becoming too sick for a transplant, while black (adjusted hazard ratio, [95% confidence interval, CI], 0.67 [0.66–0.68]), Hispanic (0.59 [0.58–0.60]), and Asian (0.54 [0.52–0.55]) candidates had a lower risk. Black KT recipients (odds ratio, [95% CI] 1.29 [1.21–1.38]) had a higher risk of PNF or death before discharge than white patients. After controlling confounders, black recipients (0.99 [0.92–1.07]) had a similar higher risk of posttransplant in-hospital mortality or PNF as white patients than Hispanic and Asian counterparts.
Conclusions: Despite having a better socioeconomic status and being allocated better kidneys, white patients had the worst prognosis during the waiting periods. Black recipients and white recipients have higher posttransplant in-hospital mortality or PNF.
Introduction
Kidney transplantation (KT) is the best therapeutic option for the majority of patients with end-stage renal disease (ESRD) as it offers better quality of life and longer survival than other therapies (1, 2). Racial disparities are associated with lower socioeconomic status and longer transplant-waiting time (3, 4), which may affect the survival of patients on the waiting list and eventually contribute to worse graft and recipient survival in KT recipients (5, 6).
Previous studies have mainly focused on the racial disparities between whites and blacks in the long-term survival after transplantation of KT recipients; however, there is limited information on the racial disparities in the mortality rates of candidates awaiting KT. In the past 10 years, the proportion of Asian and Hispanic candidates in the United States has gradually increased, together with a decline in the proportion of white candidates (7). In the United States, the proportion of Asian and Hispanic patients on the waiting list increased from 7.5% and 17.7% in 2009 to 9.7% and 20.7% in 2019, respectively (7). However, only a few ethnoracially related KT studies have previously included Hispanic and Asian patients. Analysis of early posttransplant in-hospital mortality or primary nonfunction (PNF) may provide additional information on the prognosis of the waiting list, because sicker candidates tend to have a worse prognosis after KT. PNF, defined as failed function of the transplanted kidney, which necessitated continued maintenance dialysis (8) that occurred within 90 days post-KT, was included in the analysis.
The new Kidney Allocation System (KAS) implemented in 2014 increased the transplantation rates of highly sensitised individuals and reduced the known disparities in access to transplantation to some degree (9–11) whereas the relationship between KAS and waiting-list prognosis or early posttransplant prognosis remains unclear.
Kidney quality can be assessed using the Kidney Donor Profile Index (KDPI). Among kidney transplant recipients, a lower and higher KDPI are associated with longer and shorter predicted graft survival, respectively (12). Since the quality of the donated kidney can affect early posttransplant prognosis (12) we compared the differences in the changes in KDPI before and after KAS modification among races/ethnicities. The objectives of this study were to (a) compare baseline characteristics between white, black, Hispanic, and Asian patients listed for KT in the United States; (b) compare the waiting-list mortality* between these racial/ethnic groups; (c) compare early posttransplant in-hospital mortality or PNF between KT recipients across four groups; and (d) determine the role of KAS in the waiting list and early posttransplant prognoses.
Materials and methods
Study population
All adult patients (age ≥18 years) listed for only KT and no other organ transplants in the United States between July 1, 2004 and March 31, 2020 were identified in the Organ Procurement and Transplantation Network (OPTN) database, which includes data on all candidates awaiting KT in the United States. Individuals listed for multiorgan transplantation or removed on the day of enrollment (zero wait time) were excluded. The OPTN adult KT registration forms, which are completed by the transplantation centre clinicians, include details of the race/ethnicity of all recipients designated as white, black, Hispanic, or Asian. Due to their small number, patients belonging to other minorities were excluded from the study. The data reported here have been supplied by the UNOS as the contractor for OPTN. As the data was sourced from a public database, and study participants could not be identified directly or through linked identifiers, the study was exempted from ethics review.
Study design and definitions
Demographic and clinical variables were recorded at the time of listing, determining the waiting-list prognosis, or at the time of transplant for ascertaining early posttransplant prognosis. Baseline characteristics and prognosis were compared between white, black, Hispanic, and Asian patients who were listed for KT during the study period. The primary endpoint (denoted as waiting-list death*) was a composite of death while on the waiting list or becoming too ill to undergo transplantation (removal from the waiting list owing to clinical deterioration). The cumulative incidence of these two events is denoted as cumulative waiting-list mortality*. Patients who underwent KT or were removed from the waiting list (for recovery or other reasons) were censored. The secondary endpoint (denoted as PNF#) was early posttransplant in-hospital death or PNF in patients who underwent KT. For analysis of waiting-list prognosis, patients were followed-up from the time of listing until death, KT, removal from the list, or the day of the last observation (March 31,2021). Patients who received KT were followed-up either until discharge, in-hospital death, posttransplant failure for up to 90 days, or the last day of the study period(March 31, 2021), whichever was earlier. To assess whether the relationship between race/ethnicity and patients' prognosis was related to centre volume, we divided the listing centres into three categories according to the distribution of patients enrolled at each centre during the study period as follows: low-volume (<50th percentile), medium-volume (50th–90th percentile), and high-volume (>90th percentile) centres (13). None of the participants had missing data for the following variables: age, sex, race/ethnicity, body mass index (BMI), blood type, dialysis, and dates of listing, transplant, death, or removal from the waiting list. Candidates with missing data for other variables were excluded from the multivariate analysis.
Statistical analysis
Summary data are presented as the mean (standard deviation) or number (percentage). The differences between groups in baseline characteristics between ethnoracial groups were compared using the chi-square test or Student's t-test for categorical or continuous variables, respectively. The waiting list mortality* and PNF# of participants are presented in the Kaplan–Meier curve and further compared using the log-rank test. A univariate Cox proportional hazards model was developed first. Subsequently, a multivariate Cox proportional hazards model was developed using backward stepwise selection, and all the variables in Table 1 were considered. A univariate logistic regression model was developed first, and a multivariate logistic regression model was then developed to evaluate racial/ethnic differences in PNF#. Segmental linear regression was used to ascertain the trend of waiting-list death* and PNF# before and after KAS. The KDPI of kidneys allocated to patients before and after KAS implementation was compared using the t-test. The distribution of the causes of death among waiting-listed candidates and recipients were compared using the chi-square test.
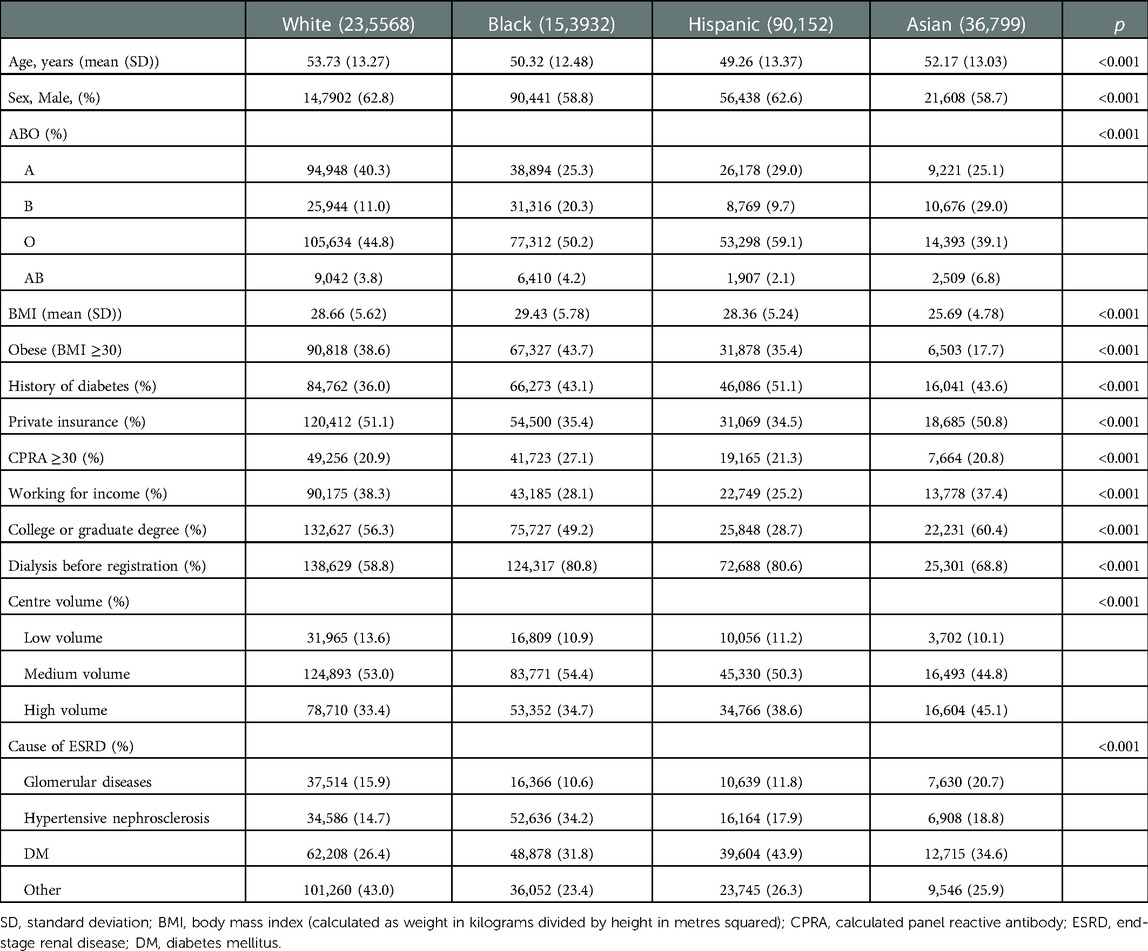
Table 1. Baseline characteristics of white, black, Hispanic and Asian patients listed for a kidney transplantation.
Data were analysed using R (version 3.6.2). All statistical tests were two-sided, and P < 0.05 was used to define statistical significance.
Results
During the study period, 553,369 patients in the United States were referred to transplant centres for only KT. Of these, 36,918 patients (6.7%) were excluded based on the predefined exclusion criteria (Figure 1). The remaining 516,451 patients were included in this analysis. Of these, 235,568 (45.6%) were white, 153,932 (29.8%) were black, 90,152 (17.5%) were Hispanic, and 36,799 (7.1%) were Asian (Figure 1).
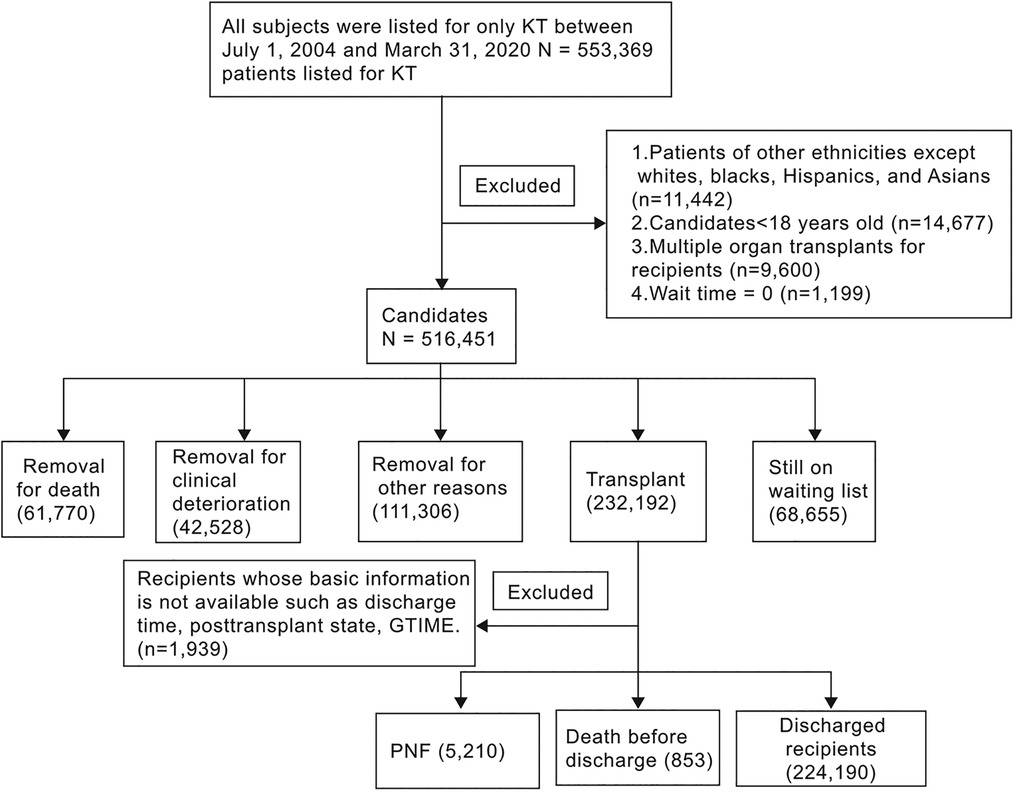
Figure 1. Flow diagram of the study participants. KT: kidney transplant; PNF: Primary nonfunction. Note: 1. GTIME, a variable derived from UNOS, indicates graft lifespan-kidney-days from transplant to failure/death/last follow-up; 2. Of the 853 deaths, 836 were simultaneously diagnosed with PNF.
Significantly (P < 0.001 for all), white patients were older than black, Hispanic, and Asian patients; were more likely to have type A blood (white 40.3% vs. black 25.3%, Hispanic 29.0%, and Asian 25.1%); have private insurance (51.1% vs. 35.4%, 34.5%, and 50.8%), and to work for income (38.3% vs. 28.1%, 25.2%, and 37.4%). Compared with black, Hispanic, and Asian patients, white patients were significantly (P < 0.001 for all) less likely to have a history of diabetes (white 36.0% vs. black 43.1%, Hispanic 51.1%, and Asian 43.6%) and dialysis before registration (58.8% vs. 80.8%, 80.6%, and 68.8%) or to register at a high-volume centre (33.4% vs. 34.7%, 38.6%, and 45.1%). White and Asian patients were less likely to have calculated panel-reactive antibody (CPRA) ≥ 30% than black and Hispanic patients (20.9% and 20.8% vs. 27.1% and 21.3%, respectively, P < 0.001). Black patients were more likely to be obese (43.7% vs. white 38.6%, Hispanic 35.4%, and Asian 17.7%) and were less likely to be diagnosed with glomerular diseases (10.6% vs. 15.9%, 11.8%, and 20.7%, P < 0.001), which is a cause of ESRD. Asian patients were more likely to have a college or graduate degree (60.4% vs. white 56.3%, black 49.2%, and Hispanic 28.7%, P < 0.001; Table 1).
The same trend was observed in transplant recipients, except for centre volume and CPRA. Black recipients were significantly less likely (P < 0.001) to receive the transplant at a high-volume centre (32.2% vs. white 34.5%, Hispanic 37.0%, and Asian 41.7%), and white recipients were significantly less likely (P < 0.001) to have CPRA ≥30% (21.0% vs. black 26.4%, Hispanic 23.3%, and Asian 22.3%). The donor age for white recipients was higher than that of black, Hispanic, and Asian recipients. White recipients were significantly less likely (P < 0.001) to have race/ethnicity-mismatched KT (14.6% vs. black 70.8%, Hispanic 56.2%, and Asian 77.7%), cold ischaemic time ≥12 h (41.2% vs. 61.9%, 53.1%, and 52.0%), human leukocyte antigen (HLA) mismatch ≥3 (41.2% vs. 91.0%, 80.5%, and 88.2%). White recipients were significantly more likely to access kidneys donated by living donors (43.9% vs. black 16.8%, Hispanic 30.4%, and Asian 27.6%, P < 0.001; Table 2).
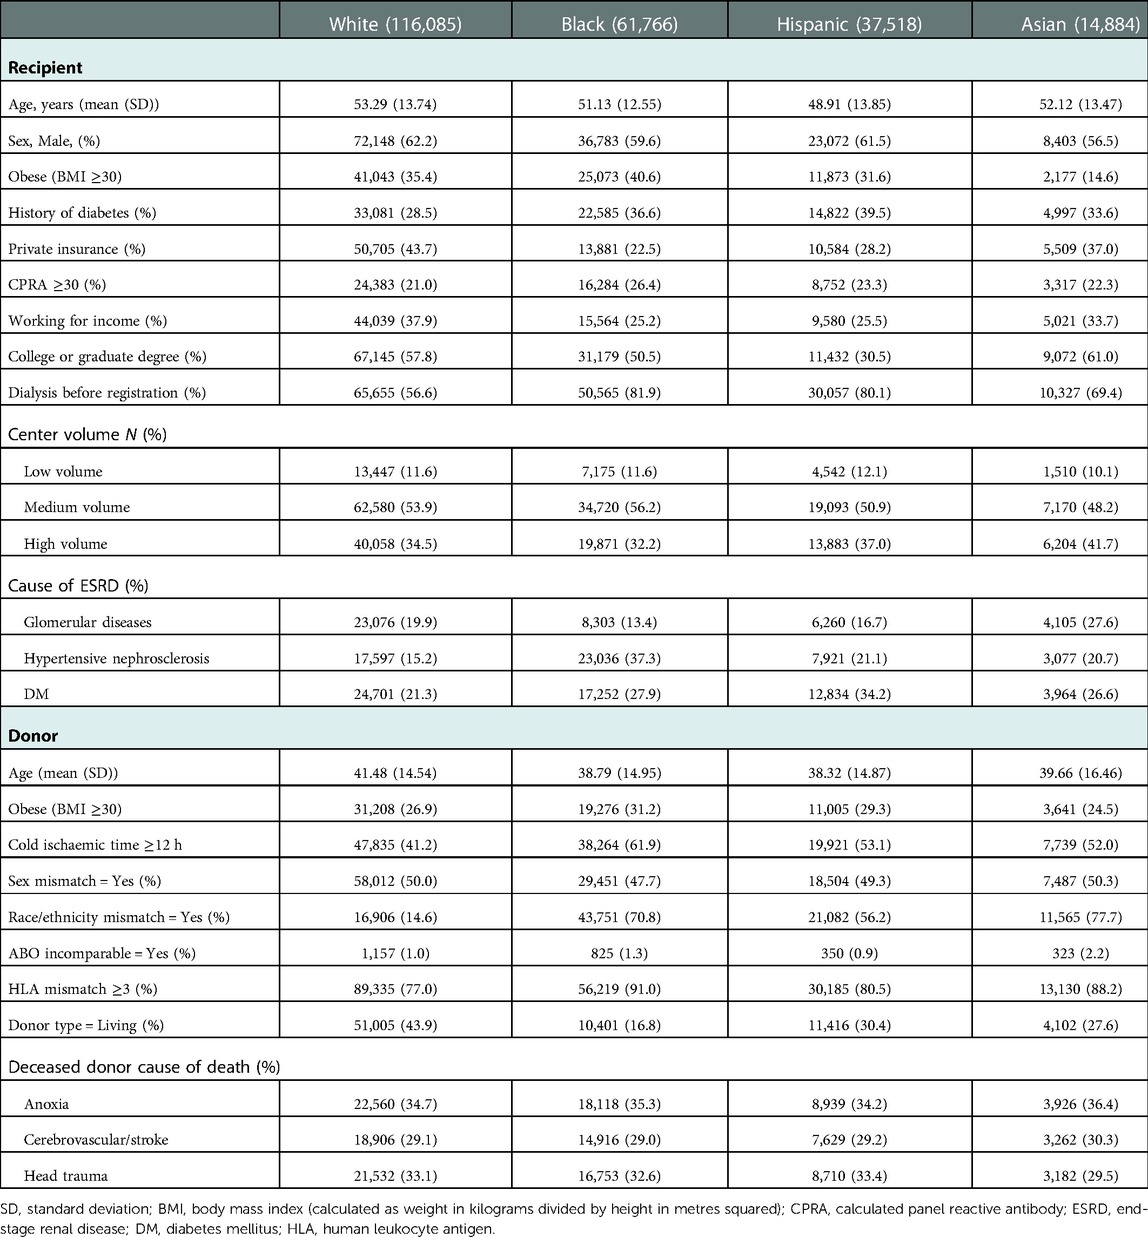
Table 2. Clinical characteristics at time of transplantation in kidney transplant recipients and donors, by race/ethnicity.
Waiting-List mortality
Overall, 104,298 (20.2%) patients reached the primary end point (61,770 [12.0%] died on the waiting list and 42,528 [8.2%] were removed due to clinical deterioration) during the study period. Ultimately, 20.0%, 21.1%, 20.2%, and 17.7% of white, black, Hispanic, and Asian candidates, respectively, on the KT waiting list died or were removed due to clinical deterioration. Moreover, 49.6%, 40.5%, 42.0%, and 40.8% of white, black, Hispanic, and Asian candidates, respectively, received KT (Figure 2). The median [IQR] waiting time for a KT was 11.5 [4.4–26.7], 19.7 [6.4–40.8], 16.6 [5.4–38.4], and 19.8 [7.2–41.9] months for white, black, Hispanic, and Asian candidates, respectively.
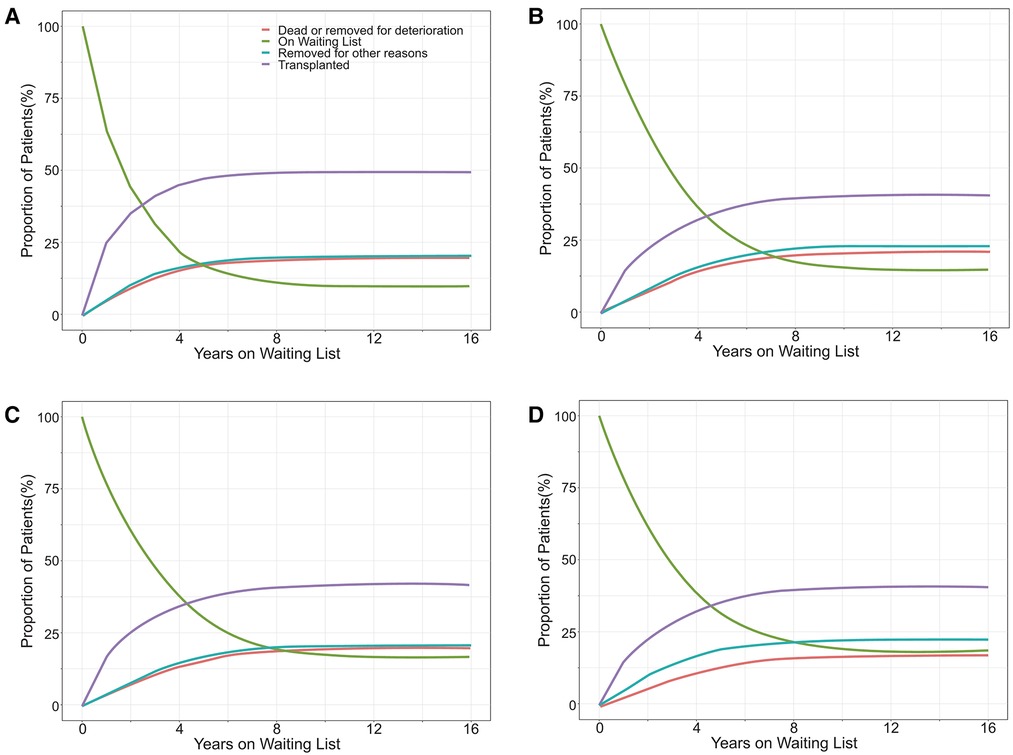
Figure 2. The proportion of outcomes for white (A), black (B), Hispanic (C), and Asian (D) patients listed for a kidney transplant in the United States.
There was a significant difference in the cumulative waiting-list mortality* among the four groups. White patients had the highest risk of waiting-list mortality*, followed by black and Hispanic patients, while Asian patients had the lowest risk. The 3-year waiting-list mortality* of white, black, Hispanic, and Asian patients were 23.2%, 16.6%, 16.2%, and 13.8%, respectively (Figure 3).
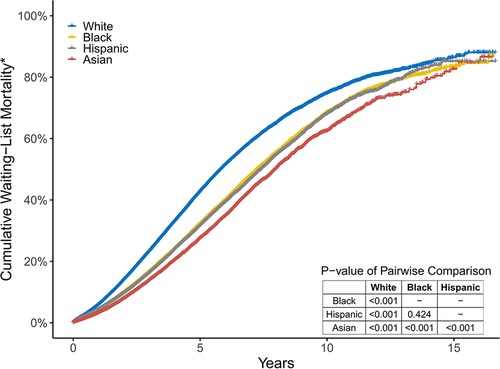
Figure 3. The cumulative percentage of those who died or became too sick for a transplant in the four groups. These two endpoints are simply referred to as Wait-List mortality*.
In univariate Cox proportional hazards analysis, white candidates were at the highest risk of dying on the waiting list or becoming too sick for KT. After controlling for candidates' age, sex, blood type, BMI, history of diabetes, primary insurance, level of education, work state, dialysis time, CPRA, centre volume, causes of ESRD, and the implementation of KAS, white candidates still had the worst waiting-list prognosis, whereas black, Hispanic, and Asian candidates had a lower risk of poor prognosis (aHR [95% CI] 0.67 [0.66–0.68], 0.59 [0.58–0.60], and 0.54 [0.52–0.55]).
Moreover, the implementation of KAS, BMI ≥30, possessing private insurance, and registration in a higher volume centre were associated with lower probability of waiting-list death*(aHR [95% CI] 0.93 [0.92–0.95], 0.87 [0.85–0.88], 0.85 [0.84–0.86], and 0.90 [0.88–0.92], respectively), whereas older age (patients ≥60 years), diabetes, and dialysis before KT registration were associated with higher probability of waiting-list death* (aHR [95% CI] 2.94 [2.86–3.02], 1.74 [1.70–1.77], and 1.69 [1.66–1.72], respectively). Employed patients were 29% less likely to die on the waiting list compared with unemployed patients (95% CI 0.70–0.72) (Figure 4).
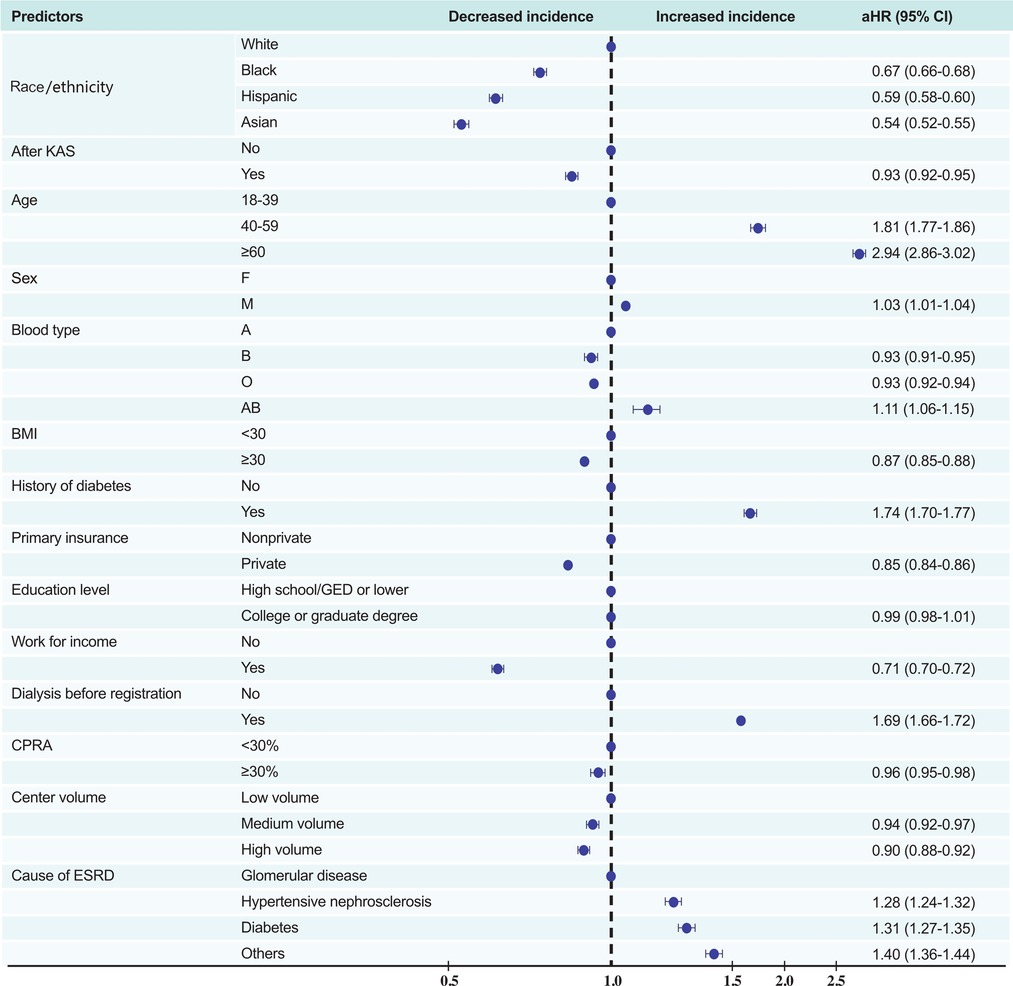
Figure 4. Multivariate predictors of waiting-list death or removal from the list owing to clinical deterioration. KAS, Kidney Allocation System BMI, body mass index (calculated as weight in kilograms divided by height in metres squared); CPRA, calculated panel reactive antibody; ESRD, end-stage renal disease; DM, diabetes mellitus.
Posttransplant in-hospital mortality or PNF
Among 230,253 participants who received a KT and whose discharge status was known, 224,190 (97.4%) were discharged from the hospital without PNF; 5,210 (2.3%) recipients suffered from PNF before hospital discharge; and 853 (0.4%) died (including 836 recipients who were diagnosed with PNF before death) in the hospital. The cumulative incidence of PNF# after KT was 3.3%, 2.5%, 2.4%, and 2.2% in black, white, Hispanic, and Asian recipients, respectively (P < 0.001; Figure 5).
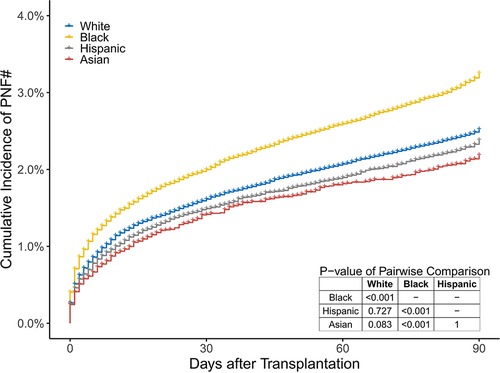
Figure 5. The cumulative percentage of recipients who died or suffered from PNF before discharge in the 4 groups. These two endpoints are simply referred to as PNF#.
In univariate logistic regression analysis, compared to white recipients, black recipients (OR [95% CI] 1.29 [1.21–1.38]) had the highest risk of PNF#, whereas Hispanic, and Asian patients had similar risks (OR [95% CI] 0.95 [0.88–1.03], and 0.90 [0.79–1.02], respectively). After controlling for recipients' age, BMI, history of diabetes, primary insurance, education level, work state, dialysis time, CPRA, centre volume, the implementation of KAS, and causes of ESRD, donors' age, cold ischaemic time, BMI, cause of death, race/ethnicity mismatch, and sex mismatch between recipients and donors, the risk in black recipients was similar to that of white recipients (aOR 0.99, 95% CI 0.92–1.07), that is, the worst overall posttransplant prognosis. With regard to the recipients' characteristics, most variables had a similar relationship with PNF# as did the characteristics of candidates on the waiting-list death*, although some factors, such as obesity (BMI ≥30) and higher education level (college or graduate degree), had the opposite relationship (associated with higher probability of PNF# aOR [95% CI] 1.19 [1.12–1.26] and 1.07 [1.01–1.13], respectively). Notably, CPRA was not associated with PNF# (1.06 [0.99–1.13]). With regard to donor characteristics, older age (age ≥60 years), obesity, cold ischaemic time ≥12 h, race/ethnicity mismatch, and ABO mismatch were associated with higher probability of PNF# (1.51 [1.37–1.66], 1.16 [1.09–1.23], 1.30 [1.21–1.40], 1.11 [1.04–1.19], and 1.62 [1.29–2.01], respectively; Figure 6).
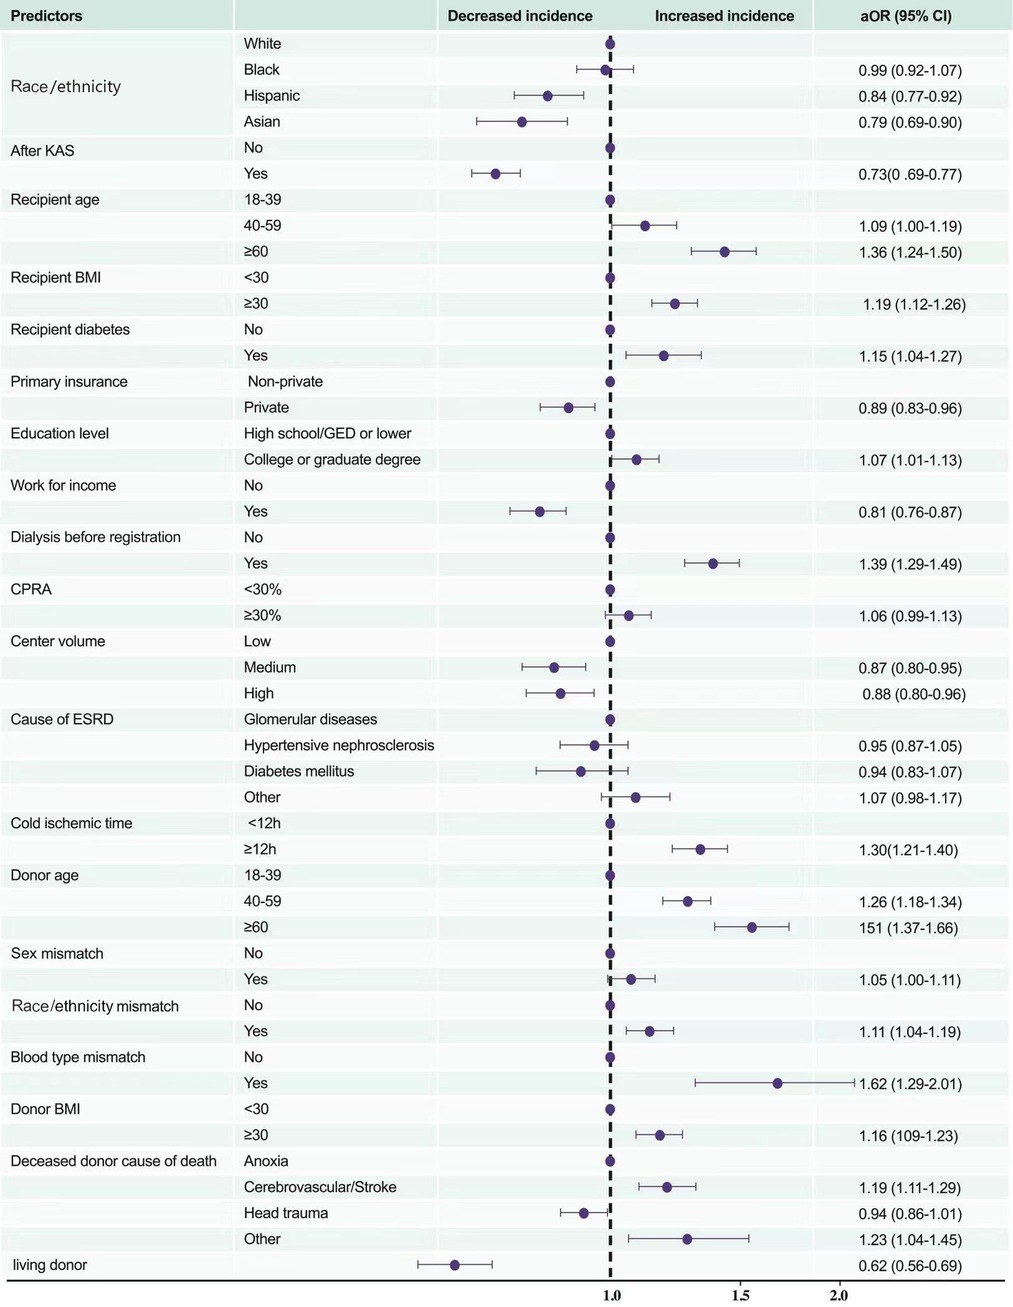
Figure 6. Multivariate predictors of posttransplant in-hospital death or PNF. KAS, Kidney Allocation System BMI, body mass index (calculated as weight in kilograms divided by height in metres squared); CPRA, calculated panel reactive antibody; ESRD, end-stage renal disease; DM, diabetes mellitus; PNF, primary nonfunction.
Role of KAS
The number of deaths (including patients who were removed for deterioration) among white, black, Hispanic, and Asian patients increased yearly between 2005 and 2010, but slowed down thereafter until 2015. After the implementation of KAS in December 2014, the number of deaths per year for white, black, Hispanic, and Asian patients on the waiting list decreased (Figure 7B). The number of PNF# in KT recipients increased yearly between 2005 and 2010 in white, black, Hispanic, and Asian patients; and, between 2010 and 2015, was moderate in Hispanic and Asian patients, but showed a downward trend in white and black patients. After the implementation of KAS in December 2014, the number of PNF# in white and black patients showed an upward trend again, which further slowed in Hispanic patients, whereas it maintained the original upward trend in Asian patients (Figure 7D).
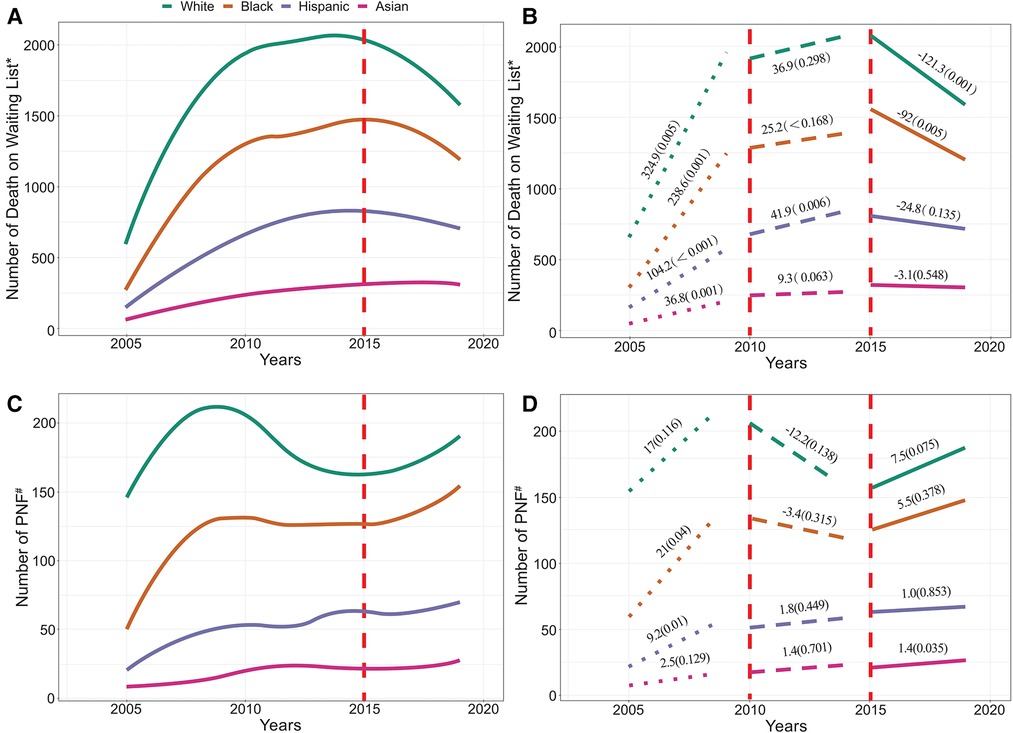
Figure 7. (A) illustrates the number of patients who died on the waiting list, and (B) depict its trend. (C) illustrates the number of recipients with PNF or who died posttransplant, and (D) depict its trend. *Includes patients who were removed from the list due to deterioration. #Includes patients who died posttransplant. The vertical line in the figure indicates the start time of KAS.
The mean KDPI of kidneys allocated to white (0.43 ± 0.27 vs. 0.45 ± 0.26) and Hispanic patients (0.42 ± 0.27 vs. 0.44 ± 0.26) increased significantly after KAS implementation but decreased significantly for black (0.46 ± 0.27 vs. 0.45 ± 0.25) and Asian (0.49 ± 0.27 vs. 0.47 ± 0.27) patients (P < 0.001 for all, Table 3).
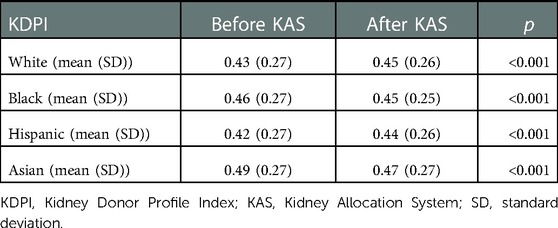
Table 3. KDPI of kidneys allocated to patients of different races/ethnicities before and after KAS implementation.
Causes of waiting-list and posttransplant in-hospital deaths
The primary causes of death among these four groups are summarised in Table 4. Deaths due to cardiovascular or cerebrovascular causes (14.2%), infection (4.3%), others/unknown (40.8%), and clinical deterioration (41.1%) were the four major contributors for removal from the waiting list. Death due to other reasons includes miscellaneous causes, cancer, renal failure, haemorrhage, trauma, and other factors. Cardiovascular or cerebrovascular disease is the leading cause of death, and it appears to be a more frequent cause of waiting-list death* among Asians (16.7%) compared with white (13.3%), black (14.0%), or Hispanic (16.0%) patients (P < 0.001). Among recipients who died before discharge, cardiovascular or cerebrovascular death (40.3%), infection (16.4%), and other reasons/unknown (43.3%) were the main causes. As the leading cause of death, cardiovascular or cerebrovascular death occurred less frequently among Hispanic (34.4%) than in white (40.6%), black (42.6%), or Asian (40.3%) KT recipients. Infection was a more frequent cause among Asian (19.4%) than in white (19.0%), black (12.5%), or Hispanic (15.2%) KT recipients, but the differences in distribution of cause of death did not reach statistical significance (P = 0.202, Table 4).
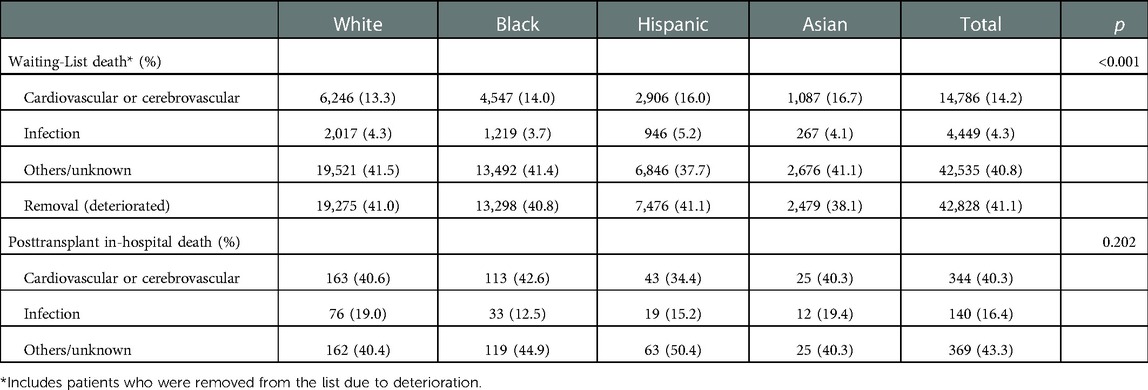
Table 4. Distribution of causes of waiting-list death* and posttransplant in-hospital death.
Discussion
We investigated the relationship between race/ethnicity (white, Hispanic, black, and Asian) and the prognosis of candidates and recipients in this study, which included 516,451 patients waiting for KT between July 1, 2004 and March 31, 2020, whose data were recorded in the OPTN database. Furthermore, we explored the relationship between KAS and the prognosis of candidates and recipients. This study had four major findings. First white patients with KT were older, more likely to have private insurance, and less likely to have a history of diabetes. Second, white patients were at the highest risk of dying on the waiting list or becoming too sick for KT, whereas Asian patients had the lowest risk. Third, black recipients had the highest risk of PNF#; however, after controlling for some confounding factors, black recipients had a similar risk as white recipients but with a higher risk of PNF# than their Hispanic and Asian counterparts. Finally, the implementation of KAS were associated with lower risk of waiting-list mortality* but were associated with higher risk of PNF# in white and black KT recipients.
Our study found that despite the higher prevalence of comorbidities, barriers to private healthcare, and lower socioeconomic status, racial minorities have a survival advantage compared to white KT candidates. This finding supports previous studies on the effects of racial differences in survival among patients undergoing dialysis (14–19), which showed that black or Hispanic patients survive longer than their white counterparts, indicating a survival paradox (20, 21). Our findings are consistent with the results of these studies, probably because approximately 76.3% of the candidates listed for KT in our study were also on dialysis.
Possible explanations include the higher rates of discontinuation of dialysis therapy, which may account for the lower survival rates of white candidates. Agunbiade et al. (22) found that white patients tended to have an earlier desire to quit dialysis, which may account for their higher mortality. Our findings also indicate that advanced age is a critical risk factor for waiting-list death*, and white candidates were significantly older than candidates of other races/ethnicities (Table 1). Moreover, this survival paradox may partly be subjected to referral bias. Severely ill minority patients with ESRD may be less likely to be offered, elect to initiate dialysis (15), or be referred for KT (4) than their white counterparts. For example, in the United States, the black population accounts for 12%, but represents 36% of the ESRD population. In this analysis, however, they made up only 29% of the OPTN database (23).
In addition to the survival paradox that may be caused by racial differences, the obesity paradox was detected in our study: that is, obesity is a protective factor for waiting-list death*. In the general population, obesity is associated with an increased cardiovascular risk and decreased survival (24). In patients with ESRD, however, an ‘obesity paradox’ has been consistently reported (24–26), namely, a higher BMI is paradoxically associated with better survival (24). The relatively better nutritional status of ESRD patients with high BMI may be responsible for the reduced mortality. Notably, the improved survival associated with obesity was in the adjusted analysis, and that the covariates included diabetes, which is typically associated with obesity in adults.
Given that sicker patients on the KT waiting list may also have a poor perioperative prognosis, we analysed PNF# for additional insights into waiting-list prognosis. We found that black recipients had the highest risk of PNF#. However, after controlling for confounding factors, both black and white recipients had the worst early postoperative prognosis compared with their Hispanic and Asian counterparts. This finding is similar to the prognosis of candidates; that is, although white patients are significantly better off than racial minority patients in terms of medical and socioeconomic factors, the early posttransplant prognosis is still the worst. However, unlike the candidates' prognosis, the early posttransplant prognosis of black recipients was significantly worse than that of their white counterparts before adjusting for confounders. Presumably, despite the similar baseline characteristics of recipients and candidates, white patients were allocated better kidneys than black patients. For example, kidneys allocated to racial minority patients tend to have characteristics such as longer ischaemia times and higher racial mismatch rates, which are detrimental to the early posttransplant prognosis of KT recipients.
Our study demonstrates that the implementation of KAS was associated with the number of deaths among candidates on the waiting list. Taber et al. (27) reported that KAS implementation led to significant changes in recipient demographics, increasing the proportion of African Americans, Hispanics, and those with more comorbid conditions. Furthermore, although sensitisation status is associated with higher death (28, 29), KAS has increased the likelihood that highly sensitised recipients (CPRA 99%–100%) would receive transplants (30). Therefore, the proportion of patients on the waiting list with high mortality will be reduced. The results of these studies support our findings.
However, few studies have reported the relationship between KAS implementation and PNF in recipients. Our study found that KAS was associated with increasing number of early posttransplant deaths or PNF in white and black recipients, but not in Hispanic and Asian recipients (Figure 7). However, the reasons for the different relationship between KAS and posttransplant PNF or death in recipients of different race/ethnicity require further investigation.
The strength of this study lies in its large sample size of 516,451 participants. In addition, the study included a diverse racial/ethnic group of patients, including whites, blacks, Hispanics, and Asians. However, this study had some limitations. First, as the database had only limited patient-level information, we could not control for unmeasured confounders, which could be residual confounding factors. For instance, the methods and drugs used to treat terminally ill patients on waiting lists among different races/ethnicities may vary, but data are not available. Second, we were limited in our ability to exclude candidates who were multi-registered, which may have contributed to a potential bias. However, given that this phenomenon occurs across all racial/ethnic groups, it should not have a substantial effect on the results. Third, smaller racial/ethnic groups were excluded as the number of patients was substantially small and heterogeneous to make meaningful conclusions. Fourth, the OPTN database classifies patients as white, black, Hispanic, Asian, American Indian/Alaska Native and others, however, Hispanic/Latino refers to ethnicity only. Thus the “Hispanic” category in the current study may include patients of white race and black race, which means that any conclusions about the Hispanic category are not independent of race differences. Finally, the analysis used United States data and the background provided is United States-centric and does not encompass the broader issues of racial/ethnic intersection in transplantation globally.
In conclusion, race/ethnicity was associated with the prognosis of candidates listed for KT and the early posttransplant prognosis of KT recipients. Despite having better socioeconomic status and allocated better kidneys, white patients have the worst prognosis during the waiting period. Black recipients and white recipients have higher posttransplant in-hospital mortality or PNF. KAS implementation was associated with improved waiting-list survival across all four races/ethnicities but impaired early posttransplant prognosis for white and black recipients.
Data availability statement
Publicly available datasets were analyzed in this study. This data can be found here: https://optn.transplant.hrsa.gov/data/request-data/.
Author contributions
TS and QY participated in the research design, drafted the first draft of the paper, and oversaw data analysis and performance of the study. YYW and KKL participated in the research design, writing of the paper, and revised all drafts of the paper. CL, XWH and WHL participated in the research design and data analysis. XZX and ABP participated in revising the article and supervising data analysis. All authors contributed to the article and approved the submitted version.
Funding
This research was supported by The National Key Research and Development Program of China (2021YFC2009300, 2021YFC2009304).
Acknowledgments
We gratefully acknowledge the research support from OPTN/UNOS and guidance in data analysis by NE at the Center for Transplantation Sciences and the Division of Transplant Surgery, Department of Surgery, Massachusetts General Hospital, Boston, Massachusetts, United States.
Conflict of interest
The authors declare that the research was conducted in the absence of any commercial or financial relationships that could be construed as a potential conflict of interest.
Publisher's note
All claims expressed in this article are solely those of the authors and do not necessarily represent those of their affiliated organizations, or those of the publisher, the editors and the reviewers. Any product that may be evaluated in this article, or claim that may be made by its manufacturer, is not guaranteed or endorsed by the publisher.
Abbreviations
aHR, adjusted hazard ratio; aOR, adjusted odds ratio; BMI, body mass index; CI, confidence interval; CPRA, calculated panel-reactive antibody; ESRD, end-stage renal disease; KAS, Kidney Allocation System; KDPI, Kidney Donor Profile Index; KT, kidney transplantation; OPTN, Organ Procurement and Transplantation Network; PNF, primary nonfunction; HLA, human leukocyte antigen.
References
1. Abecassis M, Bartlett ST, Collins AJ, Davis CL, Delmonico FL, Friedewald JJ, et al. Kidney transplantation as primary therapy for end-stage renal disease: a national kidney foundation/kidney disease outcomes quality initiative (NKF/KDOQITM) conference. Clin J Am Soc Nephrol. (2008) 3:471–80. doi: 10.2215/CJN.05021107
2. Oniscu GC, Brown H, Forsythe JL. How great is the survival advantage of transplantation over dialysis in elderly patients? Nephrol Dial Transplant. (2004) 19:945–51. doi: 10.1093/ndt/gfh022
3. Joshi S, Gaynor JJ, Bayers S, Guerra G, Eldefrawy A, Chediak Z, et al. Disparities among blacks, hispanics, and whites in time from starting dialysis to kidney transplant waitlisting. Transplantation. (2013) 95:309–18. doi: 10.1097/TP.0b013e31827191d4
4. Ku E, McCulloch CE, Adey DB, Li L, Johansen KL. Racial disparities in eligibility for preemptive waitlisting for kidney transplantation and modification of eGFR thresholds to equalize waitlist time. J Am Soc Nephrol. (2021) 32:677–85. doi: 10.1681/ASN.2020081144
5. Patzer RE, Pearson TC. Racial disparities in kidney graft survival: does donor quality explain the difference? Am J Transplant. (2012) 12:1670–1. doi: 10.1111/j.1600-6143.2012.04093.x
6. Fan PY, Ashby VB, Fuller DS, Boulware LE, Kao A, Norman SP, et al. Access and outcomes among minority transplant patients, 1999-2008, with a focus on determinants of kidney graft survival. Am J Transplant. (2010) 10:1090–107. doi: 10.1111/j.1600-6143.2009.03009.x
7. Hart A, Lentine KL, Smith JM, Miller JM, Skeans MA, Prentice M, et al. OPTN/SRTR 2019 annual data report: kidney. Am J Transplant. (2021) 21:21–137. doi: 10.1111/ajt.16502
8. Tomita Y, Iwadoh K, Hoshino A, Ogawa Y, Sannomiya A, Nakajima I, et al. Primary nonfunction on kidney transplant recipients from donation after circulatory death donors. Transplant Proc. (2019) 51:2523–6. doi: 10.1016/j.transproceed.2019.01.201
9. Friedewald JJ, Samana CJ, Kasiske BL, Israni AK, Stewart D, Cherikh W, et al. The kidney allocation system. Surg Clin North Am. (2013) 93:1395–406. doi: 10.1016/j.suc.2013.08.007
10. Israni AK, Salkowski N, Gustafson S, Snyder JJ, Friedewald JJ, Formica RN, et al. New national allocation policy for deceased donor kidneys in the United States and possible effect on patient outcomes. J Am Soc Nephrol. (2014) 25:1842–8. doi: 10.1681/ASN.2013070784
11. Kulkarni S, Ladin K, Haakinson D, Greene E, Li L, Deng Y. Association of racial disparities with access to kidney transplant after the implementation of the new kidney allocation system. JAMA Surg. (2019) 154:618–25. doi: 10.1001/jamasurg.2019.0512
12. Glorioso JM. Kidney allocation policy: past, present, and future. Adv Chronic Kidney Dis. (2021) 28:511–6. doi: 10.1053/j.ackd.2022.01.006
13. Singh TP, Almond CS, Taylor DO, Milliren CE, Graham DA. Racial and ethnic differences in wait-list outcomes in patients listed for heart transplantation in the United States. Circulation. (2012) 125:3022–30. doi: 10.1161/CIRCULATIONAHA.112.092643
14. Crews DC, Liu Y, Boulware LE. Disparities in the burden, outcomes, and care of chronic kidney disease. Curr Opin Nephrol Hypertens. (2014) 23:298–305. doi: 10.1097/01.mnh.0000444822.25991.f6
15. Crews DC, Sozio SM, Liu Y, Coresh J, Powe NR. Inflammation and the paradox of racial differences in dialysis survival. J Am Soc Nephrol. (2011) 22:2279–86. doi: 10.1681/ASN.2011030305
16. Ku E, McCulloch CE, Grimes BA, Johansen KL. Racial and ethnic disparities in survival of children with ESRD. J Am Soc Nephrol. (2017) 28:1584–91. doi: 10.1681/ASN.2016060706
17. Kucirka LM, Grams ME, Lessler J, Hall EC, James N, Massie AB, et al. Association of race and age with survival among patients undergoing dialysis. JAMA. (2011) 306:620–6. doi: 10.1001/jama.2011.1127
18. Norris K, Nissenson AR. Race, gender, and socioeconomic disparities in CKD in the United States. J Am Soc Nephrol. (2008) 19:1261–70. doi: 10.1681/ASN.2008030276
19. Yan G, Norris KC, Yu AJ, Ma JZ, Greene T, Yu W, et al. The relationship of age, race, and ethnicity with survival in dialysis patients. Clin J Am Soc Nephrol. (2013) 8:953–61. doi: 10.2215/CJN.09180912
20. Ruiz JM, Steffen P, Smith TB. Hispanic mortality paradox: a systematic review and meta-analysis of the longitudinal literature. Am J Public Health. (2013) 103:e52–60. doi: 10.2105/AJPH.2012.301103
21. Efird JT, O'Neal WT, Kennedy WL, Kypson AP. Grand challenge: understanding survival paradoxes in epidemiology. Front Public Health. (2013) 1:3. doi: 10.3389/fpubh.2013.00003
22. Agunbiade A, Dasgupta A, Ward MM. Racial/ethnic differences in dialysis discontinuation and survival after hospitalization for serious conditions among patients on maintenance dialysis. J Am Soc Nephrol. (2020) 31:149–60. doi: 10.1681/ASN.2019020122
23. Foster CE 3rd, Philosophe B, Schweitzer EJ, Colonna JO, Farney AC, Jarrell B, et al. A decade of experience with renal transplantation in African-Americans. Ann Surg. (2002) 236:794–804. discussion 804-5. doi: 10.1097/00000658-200212000-00012
24. Park J, Ahmadi SF, Streja E, Molnar MZ, Flegal KM, Gillen D, et al. Obesity paradox in end-stage kidney disease patients. Prog Cardiovasc Dis. (2014) 56:415–25. doi: 10.1016/j.pcad.2013.10.005
25. Kalantar-Zadeh K, Kopple JD. Obesity paradox in patients on maintenance dialysis. Contrib Nephrol. (2006) 151:57–69. doi: 10.1159/000095319
26. Kalantar-Zadeh K, Abbott KC, Salahudeen AK, Kilpatrick RD, Horwich TB. Survival advantages of obesity in dialysis patients. Am J Clin Nutr. (2005) 81:543–54. doi: 10.1093/ajcn/81.3.543
27. Sanchez D, Dubay D, Prabhakar B, Taber DJ. Evolving trends in racial disparities for peri-operative outcomes with the new kidney allocation system (KAS) implementation. J Racial Ethn Health Disparities. (2018) 5:1171–9. doi: 10.1007/s40615-018-0464-3
28. Kulkarni S, Hall I, Formica R, Thiessen C, Stewart D, Gan G, et al. Transition probabilities between changing sensitization levels, waitlist activity status and competing-risk kidney transplant outcomes using multi-state modeling. PLoS One. (2017) 12:e0190277. doi: 10.1371/journal.pone.0190277 eCollection 2017.29287087
29. Jackson KR, Covarrubias K, Holscher CM, Luo X, Chen J, Massie AB, et al. The national landscape of deceased donor kidney transplantation for the highly sensitized: transplant rates, waitlist mortality, and posttransplant survival under KAS. Am J Transplant. (2019) 19:1129–38. doi: 10.1111/ajt.15149
Keywords: kidney transplantation, waiting-list mortality, early posttransplant in-hospital mortality, kidney allocation system, primary nonfunction, racial/ethnic disparities
Citation: Wu Y, Lv K, Hao X, Lv C, Lai W, Xia X, Pang A, Yuan Q and Song T (2023) Waiting-List and early posttransplant prognosis among ethnoracial groups: Data from the organ procurement and transplantation network. Front. Surg. 10:1045363. doi: 10.3389/fsurg.2023.1045363
Received: 15 September 2022; Accepted: 3 January 2023;
Published: 30 January 2023.
Edited by:
Muhammed Elhadi, University of Tripoli, LibyaReviewed by:
Daniel Joseph Tancredi, University of California, United StatesFrancesc J. Moreso, Vall d'Hebron University Hospital, Spain
© 2023 Wu, Lv, Hao, Lv, Lai, Xia, Pang, Yuan and Song. This is an open-access article distributed under the terms of the Creative Commons Attribution License (CC BY). The use, distribution or reproduction in other forums is permitted, provided the original author(s) and the copyright owner(s) are credited and that the original publication in this journal is cited, in accordance with accepted academic practice. No use, distribution or reproduction is permitted which does not comply with these terms.
*Correspondence: Tao Song c29uZ3RhbzY2NjlAMTYzLmNvbQ== Qing Yuan cXl1YW5tZEBvdXRsb29rLmNvbQ==
†These authors have contributed equally to this work and share first authorship
Specialty Section: This article was submitted to Visceral Surgery, a section of the journal Frontiers in Surgery