 Dennis Coombe1*
 Vahid Rezania
 Jack Adam Tuszynski
- 1Computer Modelling Group Ltd., Calgary, Alberta, Canada
- 2Department of Physical Sciences, MacEwan University, Edmonton, Alberta, Canada
- 3Department of Physics, University of Alberta, Edmonton, Alberta, Canada
The liver is the body’s primary metabolic organ and its functions operate at multiple time and spatial scales. Here we employ multiscale modelling techniques to describe these functions consistently, based on methods originally developed to describe reactive fluid flow processes in naturally-fractured geological sediments. Using a fully discretized idealized lobule model for flow and metabolism, a dual continuum approach is developed in two steps: 1) Two interacting continua models for tissue and sinusoids properties, followed by 2) further upscaled dual continua models leading to an averaged lobule representation. Results (flows, pressures, concentrations, and reactions) from these two approaches are compared with our original model, indicating the equivalences and approximations obtained from this upscaling for flow, diffusion, and reaction parameters. Next, we have generated a gridded dual continuum model of the full liver utilizing an innovative technique, based on published liver outline and vasculature employing a vasculature generation algorithm. The inlet and outlet vasculature systems were grouped into five generations each based on radius size. With a chosen grid size of 1 mm3, our resulting discretized model contains 3,291,430 active grid cells. Of these cells, a fraction is occupied vasculature, while the dominant remaining fraction of grid cells approximates liver lobules. Here the largest generations of vasculature occupy multiple grid cells in cross section and length. The lobule grid cells are represented as a dual continuum of sinusoid vasculature and tissue. This represents the simplest gridded dual continuum representation of the full liver organ. With this basic model, numerous full liver drug metabolism simulations were run. A non-reactive PAC (paclitaxel) injection case including only convective transfer between vasculature and tissue was compared with including an additional diffusive transfer mechanism. These two cases were then rerun with tissue reaction, converting injected PAC to PAC-OH (6-hydroxypaclitaxel). There was little transfer of PAC from vasculature to tissue without the addition of diffusive transfer, and this had a significant observable effect on internal PAC distribution in the absence of reaction, and also on the distribution of PAC-OH for the reactive cases.
1 Introduction
The liver is the body’s primary metabolic organ and its functions operate at multiple time and spatial scales. From the most general anatomical point of view, the liver can be viewed as comprising three vascular trees: two supply trees that originate from the portal vein and hepatic artery and one collecting tree that drains into the portal artery. These blood vessels undergo several steps of bifurcation down to the terminal arterioles and venules, which are organized into portal tracts along with a terminal bile duct. Liver cells, called hepatocytes, radiate outward from the terminal vessels. These plates of hepatocytes are interspersed by sinusoids, which play the role of the capillary in the liver, and the spaces of Disse, which represent the extravascular spaces of the liver. Finally, the blood is collected and removed by the hepatic venules.
At the microscopic level of its functioning, the liver is the major site of biotransformation of xenobiotic substances, including drugs, participating in their removal from the body. Its main role is to prevent accumulation of various chemical compounds circulating in the bloodstream by converting them into a form suitable for elimination. Such vital processes, however, can potentially damage liver tissue and hence liver functionality. Studies of hepatic clearance demonstrated that substance extraction can not only be limited by damaged hepatocytes, but also by the intrinsic (enzymatic) ability to eliminate the drug, by the resistance to drug transport from blood to eliminating tissue cells, and by the hepatic blood flow itself. Indeed, perturbations in the hepatic flow patterns (e.g., due to diseases such as cirrhosis or as a result of aging) can significantly alter the systemic clearance of these harmful substances. Consequently, a quantitative understanding of the relationship between liver structure and its function, which can be achieved by computational model development, is of great value. In silico modeling of liver performance and its structural integrity can assist, for example in the prediction of the hepatoxicity of drug candidates. Due to its complex architecture, model development for blood flows in the liver is not a trivial task and requires the use of multi-scale approaches.
Fluid flow effects range from input/output large vasculature conduits (portal vein-hepatic artery to hepatic vein) to small sinusoidal capillary networks. Temporal process variations range from milliseconds for metabolic process changes (O2 and glucose) to drug metabolism and enzyme changes over minutes to hours, to liver structural changes (fibrosis, steatosis, and hepatitis) over days and months. In silico techniques offer the promise to quantify such processes and rationally connect them over these multiple scales in a seamless manner.
This work is motivated by issues presented in our earlier full-liver scale simulation model, White et al. (2016) for the dog liver in a pseudo-2D approximation, now applied to a 3D model of the human liver. Here, we employ multiscale modelling techniques to describe these functions consistently, based on well-established methods originally developed to describe reactive fluid flow processes in naturally-fractured geological sediments. Other researchers who have attempted upscaling concepts when modeling the liver include (Xie et al., 2015; Schwen et al., 2015; Schwen et al., 2016; Schwen et al., 2017; Berndt et al., 2018; Sluka et al., 2018; Lorente et al., 2020; Lorente et al., 2020).
Most often, researchers use averaged single continuum models for upscaled fluid flow or mechanics simulations. Here, a single continuum or single porosity (SP) region is defined as one discretized grid cell for a selected region of space. However, often a given region of space is microscopically (sub-grid size) heterogeneous. In such cases, the use of SP models is appropriate only at later timescales after a change of conditions when mass transfer between sub-regions have come to pseudo equilibrium.
In contrast, here we will utilize a computationally efficient algorithm to upscale these results to the tissue and full organ scales. This algorithm is termed dual continuum modeling, such that each averaged spatial location property is represented by both one averaged tissue property value, and one averaged vasculature property value. This holds for both static properties such as porosity, permeability as well as dynamic properties such as component concentrations. These two continua are dynamically linked within and between each averaged region, and this algorithm is often termed a dual permeability (DK) method, as permeability provides the dominant coupling mechanism. A simpler computational version of dual continuum modelling has been termed dual porosity (DP), which ignores some permeability coupling.
The algorithm was originally developed to model fluid production from fine-scaled fractures in geological heterogeneous media (Oballa et al., 1993). Subsequent extensions and improvements of this method have been developed, and this approach has been continuously employed to model realistic field reservoirs (e.g., Cipolla et al., 2009), and complex recovery processes (Herbas et al., 2009). This latter application (reactive gel placement in fractured reservoirs) can be viewed as a potential analogue of fibrosis formation modelling. In our application, we apply an equivalence of the terms “fracture” and “matrix” to represent “sinusoids (or upscaled vasculature)” and “tissue (or upscaled effective tissue)”. As in our previous work, we utilize the term “hydraulic permeability” or “permeability” to characterize the convective (Darcy) flow parameters, following standard engineering terminology. Permeability in mD is approximately equivalent to 1.0e–15 m2.
Similar dual continuum concepts have been utilized by other authors to represent dynamic processes occurring in the lung (Erbertseder et al., 2012), the heart (Michler et al., 2012) or the brain (Cassot et al., 2006; Peyrounette et al., 2018 and in tumours Shipley and Chapman, (2008), Shipley and Chapman, (2010).
2 Materials and methods
The form of the dual continuum flow equations solved in our method are outlined in Supplementary Material, Supplementary Appendix SA. SB gives details of the dual continuum representation of the ideal lobule. Computational details on the conversion of constrained constructive optimization (CCO) data to grid-based structures are presented in Supplementary Appendix SC, which has been applied to the Schwen et al. (2015) vasculature in the main body of this paper.
Convection-diffusion-reaction flow calculations are performed utilizing the STARS advanced process simulator, CMG Ltd, (2021), as described in our earlier papers.
3 Results
During the last few years, we have developed and studied several basic computational models to understand transport and metabolism of drugs in the liver lobule. We use basic physics laws for liver transport and enzymatic reactions (Poiseuille’s law and Darcy flow, Carmen-Kozeny permeability estimates, Stokes-Einstein diffusion, and Michaelis-Menten kinetics) to provide useful fundamental insight to all the processes of interest. Spatial effects are dominated by standard physics vasculature network characterization and modification by disease (ideal-space filling versus fractals, diffusion-limited aggregation (DLA), tortuosity and percolation).
3.1 Lobule scale—Mechanistic flow and metabolism
3.1.1 Basic lobule scale reactive-flow models
We began with a simple idealized-lattice model for the lobule (Rezania et al., 2013a; Rezania et al., 2013b), which is the smallest structural unit that can independently serve all of the organ’s functions. This idealized model was extended to consider structural and spatial variability of the lobule in two and three dimensions (Rezania et al., 2016; Rezania et al., 2020). Here, a hexagonal-based model with supplying and draining structures to represent a typical liver lobule was developed. To capture even more realistic structures, we implemented a novel sequential diffusion-limited aggregation (DLA) method to construct a morphological sinusoid network in the lobule. A 3D model of the lobule constructed with stacks of multiple 2D sinusoid realizations was explored to study the effects of 3D structural variations. The role of liver zonation on drug metabolism in the lobule was also addressed, based on flow-based predicted steady-state O2 profiles used as a zonation indicator.
Figure 1 shows the basic conceptual unit adopted in our model. This consists of a single cell unit surrounded by ECM, and a local portion of an idealized sinusoid network surrounding this. Volumes are calculated using a 3-μm grid size for the sinusoid and a 24-μm grid size for liver tissue. Basic physics concepts are used to estimate physical properties for this unit. The sinusoid porosity and permeability are estimated via a circular tube with a radius fitted inside a square cross section of side dimension 2R (Poiseuille’s law, Bird et al., 2000). The tissue permeability uses a Carmen-Kozeny correlation as a function of porosity. This was originally developed for packed beads (Dullien, 1992), but has been found appropriate for soft fibrous media as well (Zhu et al., 2017). It is noted that diffusion in sinusoids is assumed to be free diffusion (based on particle size and the Stokes-Einstein equation) while diffusion in tissue grid cells is less, due to restricted motion around collagen fibers (e.g., Ogston et al., 1973; Ho and Strieder, 1981; Gu et al., 2004). Metabolic reactions are assumed to follow Michaelis-Menten kinetics formulation (Michaelis et al., 2011).
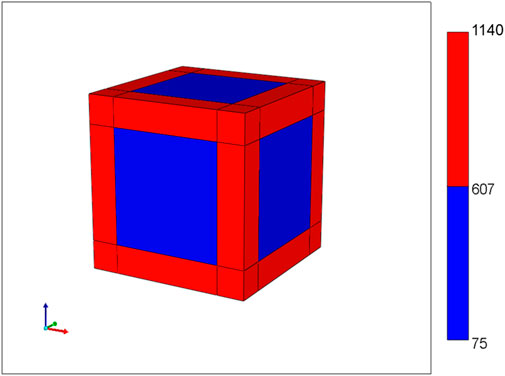
FIGURE 1. Base case flow element: sinusoid local network (with flow properties) surrounding cell + extracellular matrix cube (with different flow properties).
Basic flow properties of this unit are summarized in Table 1 and form the basis of all our upscaling procedures. This element is a 27-grid cell model and allows the possibility of 27 grid cell values for any dynamic property such as pressures or concentrations. Later upscaling will assume average values for the tissue and vasculature subsystems.
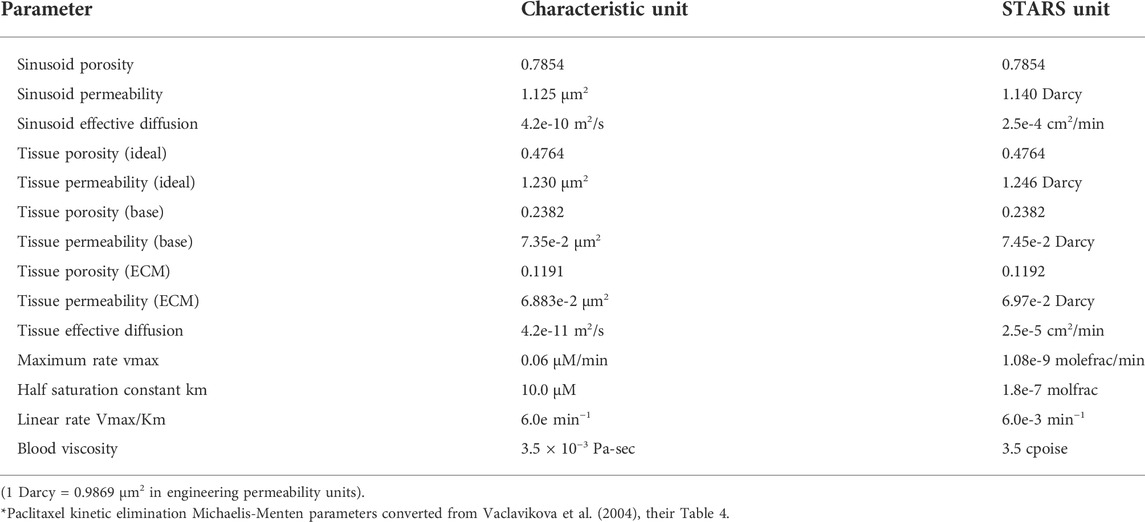
TABLE 1. Base case flow and metabolism parameters.
Next, we construct an idealized lobule by combining 50 × 50 × 50 units from our basic element, the result of which is shown in Figure 2. Note that, because the sinusoids and tissue regions are separately discretized, the fully discretized idealized lobule model consists of (101 × 101 × 101) grid cells. Such an approach was first outlined in our earlier papers (Rezania et al., 2013a; Rezania et al., 2013b), but for a ¼ element in 2D. Here, there are 4 inlet (portal) ports and one per-central outlet port, as illustrated in Figure 2. As numerical run times typically scale with the number of grid cells (and not necessarily with grid size), we will emphasize the change/reduction in the number of grid cells throughout this paper, achieved via upscaling methods.
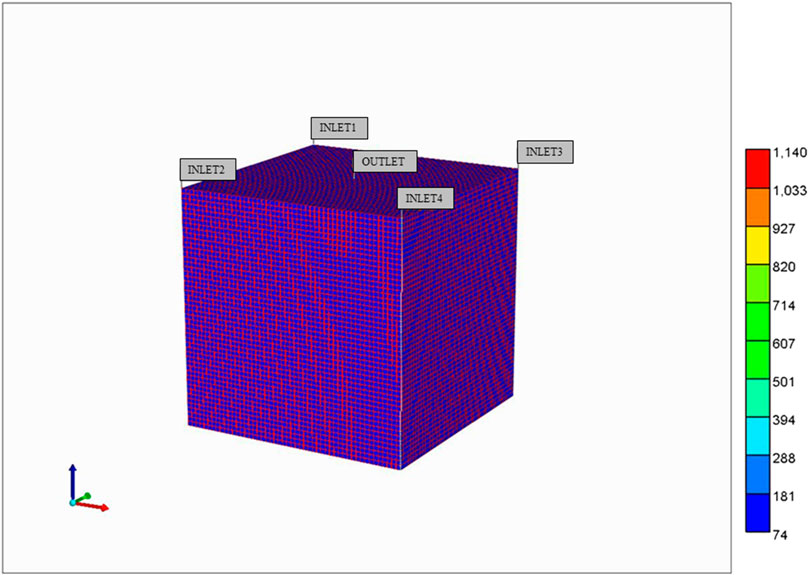
FIGURE 2. Base case idealized 3D flow network structure: Lobule lattice with individual sinusoid and tissue grids.
With this model, we develop computer simulations of O2 utilization and paclitaxel drug metabolism, utilizing Michaelis-Menten kinetics. Our earlier two papers discuss this in greater detail (but for 2D models). All simulations are conducted at a fixed pressure drop between periportal and pericentral inlet/outlet.
Figure 3 illustrates the predicted lobule flow responses at a selected periportal inlet (this is essentially identical at all inlet ports) and pericentral outlet for this idealized model, which are the characteristics we wish to preserve with any upscaling method. Figure 3A illustrates the very short timeframe required to attain steady flow behaviour, which is dominated by convective mass transfer and estimates of sinusoid and tissue permeabilities. This will be the first property required for upscaling, as discussed below. Non-reacted paclitaxel (PAC) profiles determined by convective-diffusive flows can then be predicted. Once upscaled convection properties are matched, this profile can be used to adjust upscaled diffusion parameters (case run but not shown). Finally, predicted reactive PAC and its metabolite 6-hydroxypaclitaxel (PAC-OH) profiles are calculated (Figure 3B) which are a consequence of convection-diffusion-reaction processes. Once upscaled convection and diffusion properties are matched, these profiles will be used to adjust upscaled reaction rates (see below) in principle. The example given here shows a very rapid reaction, such that almost all injected PAC reacts to form PAC-OH, which is then produced. Because of this limit, the equivalent non-reacted PAC profile case mentioned above essentially follows the reacted PAC-OH profile shown in this figure.
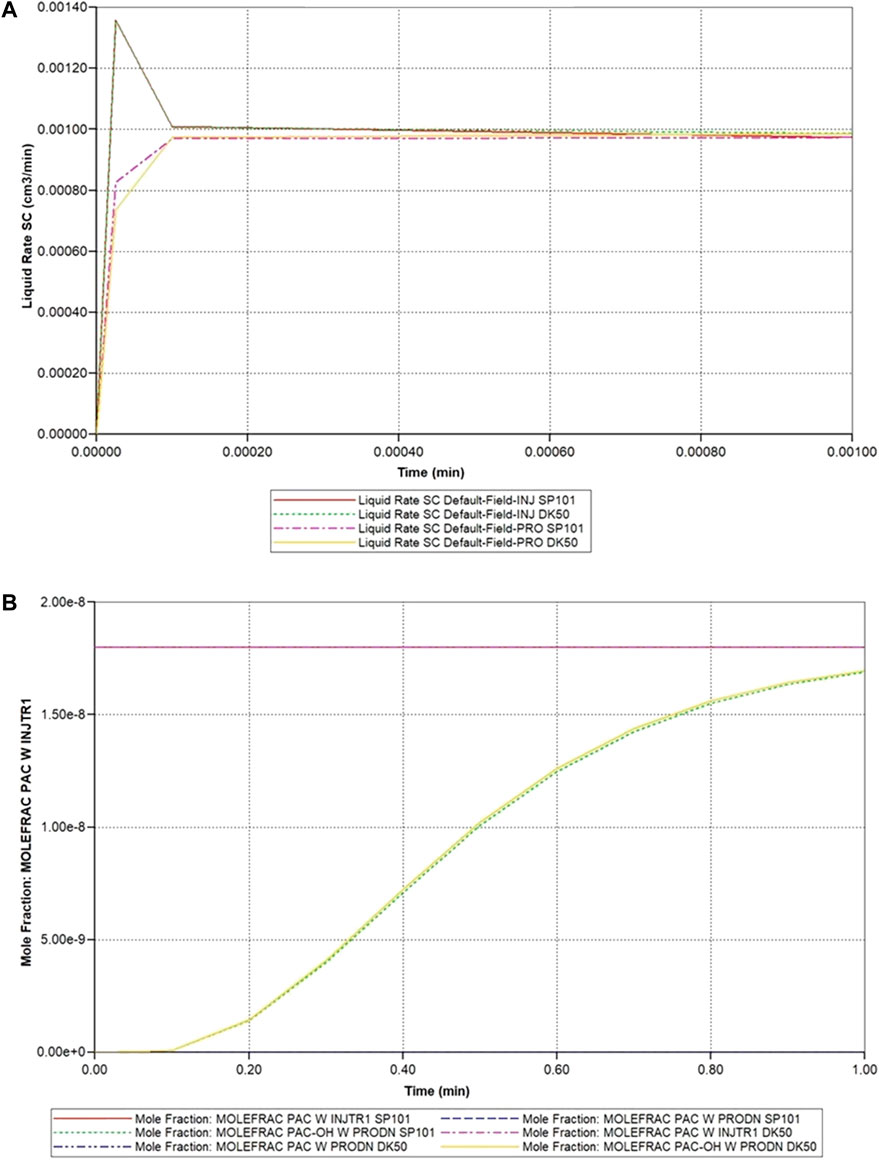
FIGURE 3. Idealized lobule flow characteristics compared with dual continuum modelling. (A) Injection/production flow rates approach to steady flow. (B) Injected/Produced PAC and PAC-OH (reactive case) up to 1 min.
For completeness, Figure 4 illustrates the spatial distribution of reactive PAC and PAC-OH at 1 min and the evolution of PAC-OH spatially over time.
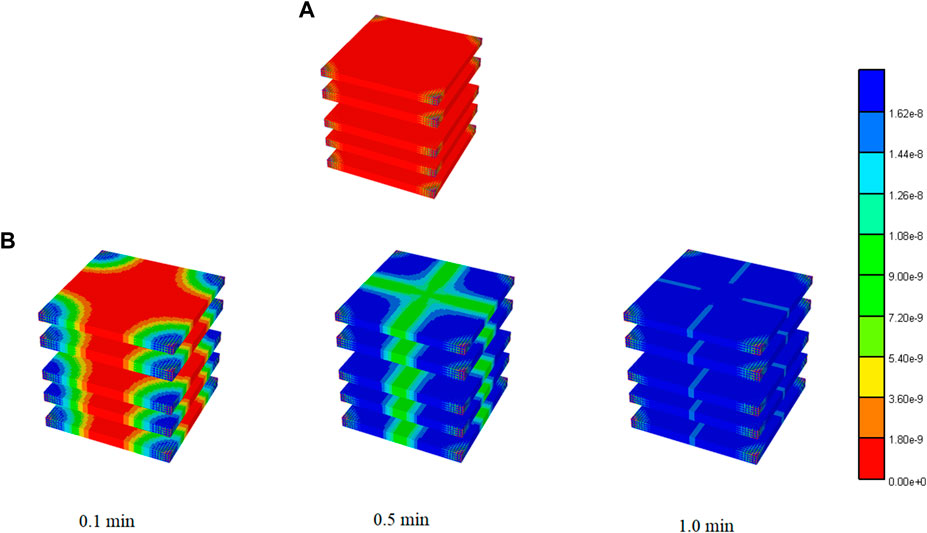
FIGURE 4. 3D PAC and PAC-OH distribution levels for Basic case idealized lobule model. (A) PAC distribution for Basic lobule model at 1 min (B) PAC-OH distribution for Basic lobule model at various times.
Lobule zonation is a further aspect of reactive lobule modelling that needs to be considered. We have previously shown predicted reactive O2 flow behaviour with the idealized lobule. As the resulting oxygen distribution is believed to affect the zonal expression of cytochrome C (CYP) enzymes, we utilize the steady state O2 distributions to estimate drug-metabolizing (paclitaxel) enzymes across the lobule (Rezania et al., 2016; Rezania et al., 2020) to calculate these zonal distributions. Fibrosis modifications of flow can be expected to further effect zonation. The treatment of zonation and its upscaling will be left to future work.
Using similar techniques, we have generalized our ideal lobule model to a more realistic hexagonally-shaped lobule with distorted sinusoidal flow paths generated via a diffusion -limited aggregation (DLA) algorithm (Rezania et al., 2016). Figure 5 shows an example of this model, indicating 6 bounding portal vein inflow ports and one central hepatic vein outlet port. Both modelling approaches generate flow volumes, patterns, and reactivities consistent with natural individual human lobule variability. In particular, the 4 inlet ideal model inflows can be adjusted to match the 6 inlet hexagonal inflow rates and volumes, and both lobule volumes and reactivities can also be adjusted to equivalence (our non-published results). Lorente et al. (2020) have established such equivalence in their ideal versus realistic models of liver tissue.
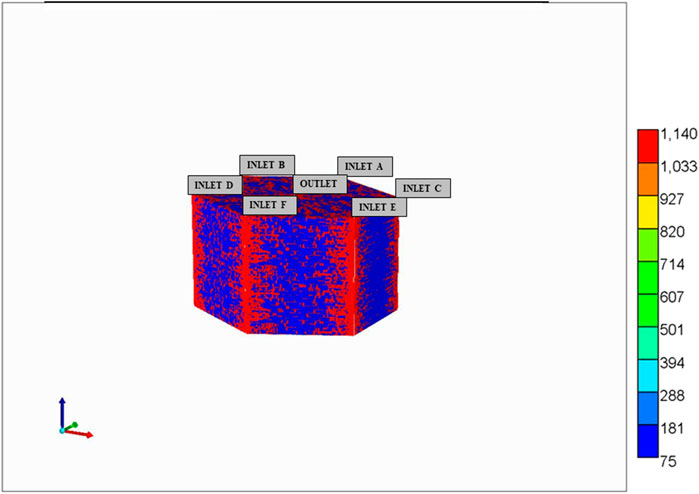
FIGURE 5. Hexagonal DLA-patterned lobule model with 6 portal (PV) inlet flows and one central (HV) outlet flows.
The paper of Rezania et al. (2016) also demonstrates the DLA-lobule equivalent metabolic process couplings just described above for the ideal lobule. This includes a treatment of zonation.
The overall idea of this section is to present the coupled nature of flow and various metabolisms at the lobule scale, and indicate factors (e.g., disease), which can further impact this coupling. We then explore if/how upscaling methods can capture aspects of these couplings.
3.1.2 Dual continuum representation of lobule flow at the same scale (upscaling 1)
This section describes an equivalent dual continuum representation of the idealized liver lobule. Here, the dual continuum model chosen is termed “dual permeability” and follows the approach of reference of Oballa et al. (1993) which developed such a technique for naturally-fractured geological materials. In this previous application, the fractured system was idealized as a “sugar cube” system such that intersecting planes of fractures surrounded the matrix material. As illustrated in Figure 1, the present application has a somewhat different “fracture” (i.e., sinusoid) structure, which impacts on the exact numerical conversion formulae utilized, as discussed below.
The equivalent dual continuum model is a 50 × 50 × 50 grid with uniform block sizes of 0.0030 cm (= 0.0003 + 0.0024 + 0.0003) comprising the full matrix (tissue) block and half of each surrounding fracture (sinusoid) block. Figure 1 also shows that the fracture (or sinusoid) spacing is 0.0006 cm in each dimension. This upscaling reduces the total number of grid cells to 1.25e+5 (from the original 1.03e+6) but doubles the number of unknowns (tissue and vascular property) per grid cell.
As discussed in Oballa et al. (1993) and summarized in the Supplementary Appendix SA, each dual continuum grid block is separated into effective sinusoidal and tissue properties and so flow equations and flow variables are solved for each continuum. Here, we must distinguish between the true fracture and matrix properties (i.e., those assigned to the separate regions in the fine grid single continuum model discussed previously) and the averaged effective properties, which govern the flow in the dual continuum model. For porosity, these are related via straight volume averaging as follows
where f and m represent fractured and matrix components and ∗ denotes effective quantities. For the permeabilities (in mD), these effective properties are area weighted averages, namely
where Ae and Ve are the total element area and volume, respectively. In principle, these permeability weightings could be different in different directions if the fracture spacing differs in the orthogonal directions.
Furthermore, these two continua interact (i.e., fluid can be transferred between each continuum) and this local, inter-continua transfer term (in mD-cm) is governed by the local fracture spacing and a harmonic averaging of the matrix and fracture permeabilities
Here Afm,x and kmf,x are the area for matrix-fracture transfer and the harmonic average of the matrix and fracture permeabilities, respectively. Also
Table 2 summarizes the parameters of the equivalent dual continuum model at the lobule scale.
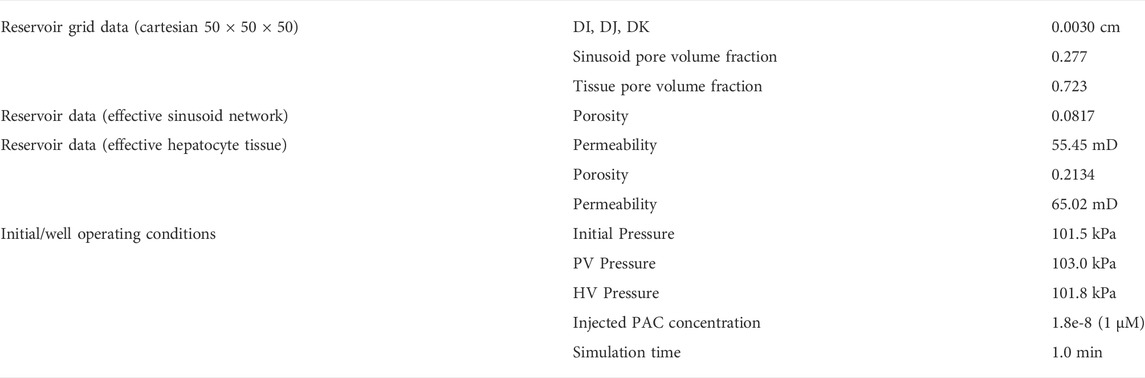
TABLE 2. Dual continuum data. (a) Idealized Liver Lobule Model.
The spatial visualization of dual continuum models requires some comment. We provide two visualization options (the actual calculations are unchanged). Figure 6A shows one possible visualization option with the fracture continuum superimposed on the matrix grid. Note this does not represent the individual sinusoid (fracture) paths (see Figure 2) but rather provides a way to visualize static and dynamic properties simultaneously on one plot. Alternatively, the static and dynamic properties of each continuum can be presented as separate plots, as will be illustrated below. We note the spatial distribution of zonation is better represented using the 6 inlet (DLA) lobule model rather than the 4 inlet (ideal) lobule model.
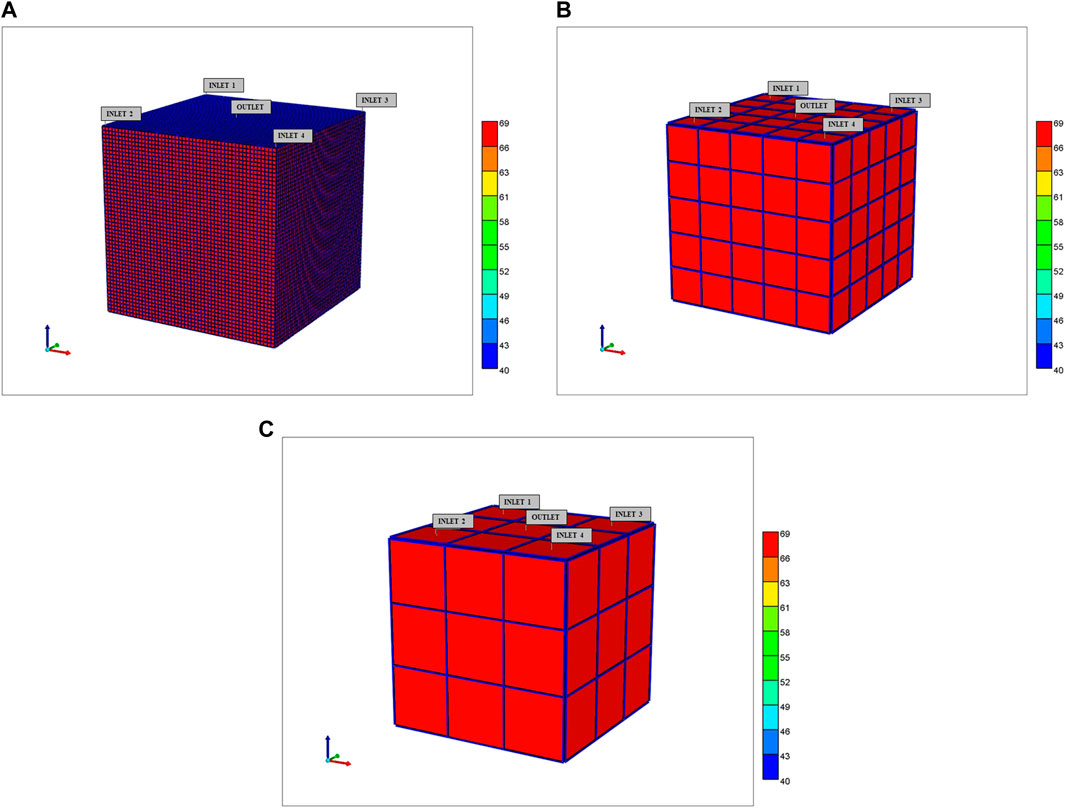
FIGURE 6. 3D Upscaled dual continuum idealized lobule models showing tissue effective properties surrounded by sinusoid effective properties (A) 50 × 50 × 50, (B) 5 × 5 × 5, and (C) 3 × 3 × 3 grids.
With this representation of the liver lobule, the dynamic simulations of the base case model can be re-run and examined. Figure 3 shown above compares the single continuum and dual continuum injection/production behaviours, and illustrates their consistency. A comparison of the dimensions of the gridded models (101 × 101 × 101 single continuum versus 50 × 50 × 50 dual continuum) demonstrates that the dual continuum models run approximately 8 times faster. Further upscaling will result in even faster run times.
3.1.3 Single block representation of lobule flow (upscaling 2)
Once the dual continuum model parameters have been established for the (50 × 50 × 50) dual continuum lobule model, it is a relatively straight-forward task to generate further upscaling of the same 1 mm3 lobule volume of interest. Conceptually several upscaling steps could be considered, although issues of preserving zonation need consideration. These are:
(a) A “next stage” upscaling creating a (5 × 5 × 5) grid for the complete lobule.
(b) A “zoned lobule” model based on a (3 × 3 × 3) grid for the complete lobule.
(c) A “pseudo-1D” lobule based on a (1 × 1 × 1) grid for the complete lobule.
The first two are illustrated in Figures 6B,C while the third (ultimate) case is discussed in detail in what follows. These visualizations show the tissue property values per grid cell, with the sinusoid properties shown as surrounding each tissue grid cell value—these dual continuum visualizations are different than the basic similar continuum representations with only one value for each surrounding sinusoid property, rather than 9 independent values.
Note all the upscaling here represents a significant reduction in resolution of the lobule and its metabolic processes [125 grid cells, 27 grid cells, 1 grid cell, respectively, but with double the number of unknowns (tissue and vascular property per grid cell)]. The first two reductions still should capture zonation in a discretized sense, with some grid cells representing near portal and some near central properties. However, it is the third upscaling, a one dual continuum grid block representation a 1 mm3 lobule which is of interest in this work, as we wish to incorporate this into a full organ scale model. It is emphasized that any dual continuum representation (even a single block model) provides a clear separation of tissue metabolism and sinusoid flow processes.
Figure 7 illustrates the predicted dual continuum lobule flow responses at a periportal inlet and pericentral outlet for this idealized model, for various upscaling levels. Figure 7A illustrates the very short timeframe required to attain steady flow behaviour for various grids, which is dominated by convective mass transfer and estimates of sinusoid and tissue permeabilities. This will be the first property required for upscaling, as discussed below. Figure 7B shows predicted reactive (PAC-OH) profiles for the same grid cases, which are a consequence of convection-diffusion-reaction processes. The example given here shows a very rapid reaction, such that almost all injected PAC reacts to form PAC-OH which is then produced. The use of effective diffusion and effective reaction rates to match production profiles is seen to be warranted, but not explored further here.
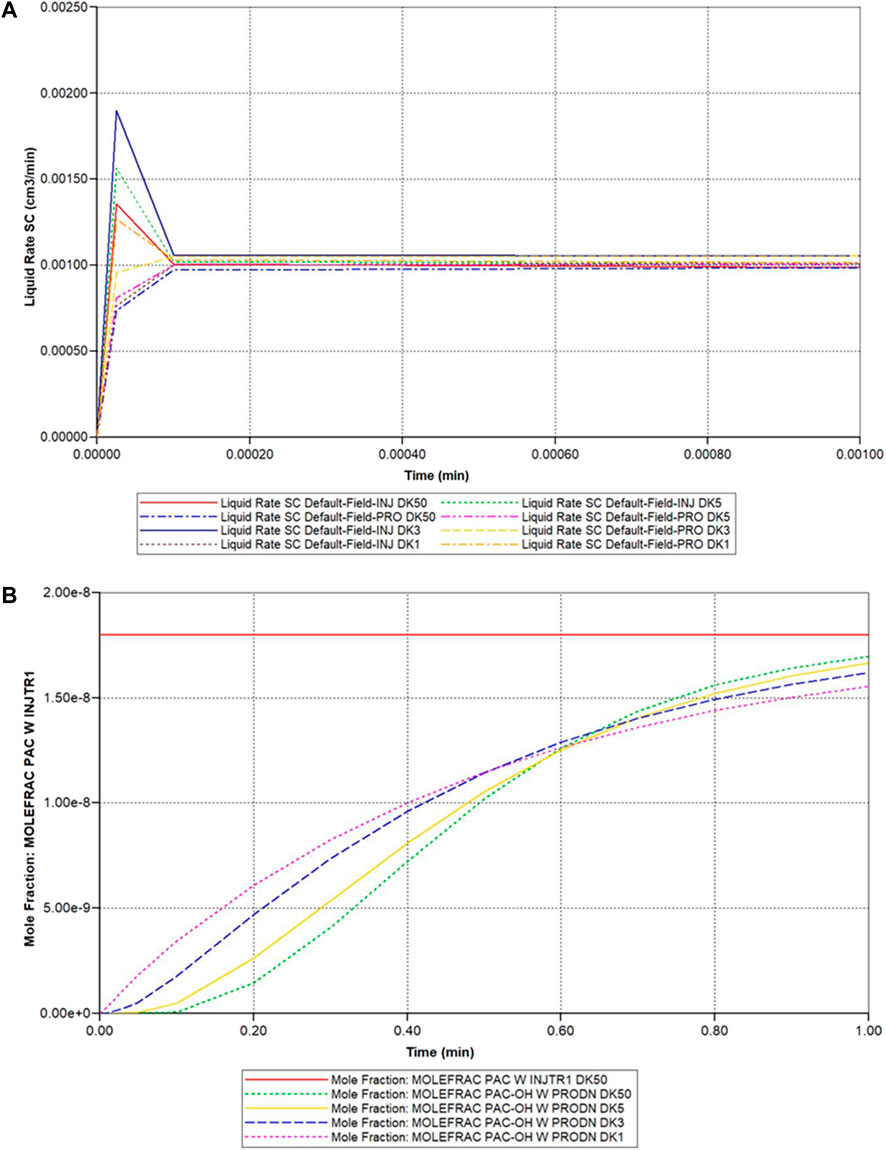
FIGURE 7. Idealized dual continuum lobule flow characteristics—(A) Injection/production flow rates approach to steady flow (DK models 50 vs. 5 vs. 3 vs. 1 blk). (B) Injected/Produced PAC and PAC-OH (reactive case) up to 1 min (DK models 50 vs. 5 vs. 3 vs. 1 blk).
The spatial property distributions (spatial resolution) are increasingly averaged with each increased level of upscaling. This has important implications for zonation modelling. Most particularly, the issue of capturing zonation within a single cell lobule model might be addressed analytically via a radial averaging. Alternatively, a 3-layer hybrid grid option (also available in our software) might be considered with a central portion for the pericentral port. Such an approach would involve increasing the total number of grid cells by a factor of three. These issues are left for future work.
3.1.4 Representation of DLA lobule flow (upscaling 2)
We turn now to some comments on upscaling of the DLA lobule. Although the above idealized model has allowed an “analytic” dual continuum upscaling protocol, a more direct practical lobule upscaling can be determined for any fine-scale model. This should be addressed via a stage-wise fitting process in a stepwise fashion, using the fine-scale results as a basis for the upscaled constants.
The first criterion is that involving equal volumes—the volumes of sinusoid and tissue are summed to define effective porosities for each continuum. The second criterion concerns overall fluid flow, which involves setting effective permeabilities. Short-term initial fluid flow is determined solely by vasculature permeability while later steady fluid flow is determined by a combination of vasculature and tissue permeabilities. Normally this latter is only of concern to liver process models, except perhaps when flow is interrupted by surgical procedures and a short-time flow change is of concern. Non-reactive component production profiles can be used to set effective diffusion constants, where typically standard free diffusion constants may be assumed for vasculature, and effective tissue diffusion is used fit profiles. Reactive flow processes (e.g., drug metabolism) leading to metabolite production profiles can be used to fit effective reaction constants. Here, the fact that metabolism occurs only in tissue implies only one effective parameter is of concern per reaction. Multiple species coupled reactions require more complex fitting algorithms.
The result is an upscaled DLA model, which is entirely equivalent to an upscaled ideal lobule, as both base cases reduce to the same upscaled description, but with different effective parameter choices), Lorente et al. (2020) have also described the equivalence of cubic and hexagonal models of liver lobules quantitatively.
The upscaling steps just outlined also illustrate issues on visualization of capillary networks and their corresponding dual continuum representations. We have presented two explicit and different representations of these networks at a fine scale, but visualization at the dual continuum scale just presents (for any property) one average result for each continuum, and would be visualized in the same way (but with different property values). There are exact parallels in the visualization of naturally fractured reservoirs at the fine scale versus dual continuum upscaling.
3.1.5 Inclusion of missing intermediate scale vasculature (upscaling 3)
Finally, we consider the effects of the missing higher generation vasculature not generated by Schwen’s protocol. Here, we invoke some analytic assessments of their contribution to overall flow surrounding a capillary bed as developed by other authors (Herman et al., 2011; Lorente et al., 2020). This procedure essentially rescales the sinusoid contribution to the average lobule flow. Using their assumed scaling of tube radii and lengths based on data from Debbaut et al. (2011), we have estimated this rescaling to be approximately a factor of 3. The impact of this missing contribution to the full liver organ simulations is assessed further below.
A future investigation should address this issue via a discretized upscaling approach similar to what we have just outlined for a single lobule upscaling. Here, we would consider a tissue scale model consisting of an array of coupled lobules connected by the intermediate scale vasculature generated by an CCO algorithm. Using a selected grid size similar to our individual lobule-based case model, we would then upscale this base case result to an adjusted average 1 mm3 lobule, whose flows quantify the effects of the missing higher generation vasculature.
3.2 Full organ scale–vasculature algorithms
In a previous study (White et al., 2016), the portal and hepatic vasculatures were generated via a CCO algorithm in both 2D and pseudo-3D to represent vasculatures for the full liver organ (We will call this paper’s method pseudo-2D.) The method is an iterative multi-scale approach to constructing physiologically-driven 3D arterial tree models that are optimized based on specific metabolic and morphology constraints of the embedding tissue. In a true 3D model, portal and hepatic vasculatures have to be created simultaneously without crossing each other. This is not possible in the 2-dimensional model. As an extension, we wrote a global optimization program (Global Constructive Optimization, GCO) that uses our 2D code output as the input (unpublished ongoing work).
For this paper, we have generated a gridded dual continuum model of the full liver, based on the liver outline and vasculature generated by Schwen et al. (2015), who employed a CCO vasculature generation algorithm. The PV and HV vasculature provided by Schwen was grouped into 5 generations each based on radius size (Their original 7 generations were grouped into 5 generations for ease of interpretation of individual generation contributions in a 1 mm sized grid block). The root radius for PV is 3.2 mm while the root radius for HV is 2.8 mm. It is emphasized that Schwen et al. did not extend their algorithm to further generations of smaller radii. For reference, the ultimate expected sinusoid radius is approximately 3 μm (3e-3 mm), see our lobule description above.
Supplementary Appendix SC Outlines the method we employed to convert the CCO schwen et al. Data to our grid-based model.
3.2.1 Visualization of generation and overlap occupancy for combined PV and HV vasculatures
In principle, the grid-based structures can be generated for any chosen grid scale. Once a grid size is selected, vasculature of varying radii must be incorporated into these grids. Two limits occur: 1) Radii of dimensions greater than the chosen grid size, and 2) radii of dimensions smaller than the chosen grid size. The treatment of the first limit is obvious, with several continuous grid blocks representing the large vasculature. The treatment of the second limit is more complicated, as multiple vasculatures of multiple radii can occur within a single grid block. This will be treated via dual continuum modeling. Here we must specify: 1) The location of grid blocks having vasculature of a given size, as well as 2) the density of each vasculature in each grid block.
Here, we propose an innovative method to characterize and summarize the first issue, utilizing a binary-to-decimal conversion of vasculature sizes occurring within all grid cells of the full liver. This allows specifying which vasculature sizes occur in which grid cell and the overlap of varying vasculature sizes in a given grid block. To illustrate this method, we utilize the data generated for both portal vein (PV) vasculature and hepatic vein (HV) vasculature, starting from root radii “Rmax” of 3.6840 mm (PV) and 2.8035 mm (HV). From scaling arguments based on expected lobule size, we have selected a grid size of 1 mm3. Using a method developed here, we first subdivide the vasculature into 5 generations defined as:
Gen1: r > ½ Rmax;
Gen2: ¼ Rmax < r < ½ Rmax;
Gen3: 1/8 Rmax < r < ¼ Rmax;
Gen4: 1/16 Rmax < r < 1/8 Rmax;
Gen5: r < 1/16 Rmax
As indicated above, this provides a convenient method to subdivide data. We next populate our full liver grid (227 × 170 × 175 = 6,753,250 grid blocks) with grid size 1 mm3 for each generation of PV and HV vasculature. (Note that not all grid cells are “active” due to the boundary shape of the full liver model—1,645,715 active grid blocks). The result is 10 indicator arrays (5 arrays for PV generations and 5 arrays for HV generations) which represent the input information for our method. Note each array consists of values [0, 1] indicating which grid cells contain vasculature of a given generation.
Supplementary Table SC1 summarizes the vasculature statistics for all generations of both PV and HV vasculature. It is worth noting that the total of all such vasculature blocks is 210,677 blocks, implying that the vasculature fraction of active blocks is 0.128. The remaining number of active blocks is 1,435,038 which can be viewed as lobule blocks. Both the vasculature fraction (0.13) and lobule number (1.4e+6) are within accepted ranges for human liver characterization.
In general, representation of full liver vasculature within a grid-based model of fixed grid size has scaling issues. Figure 8 summarizes views of the generated vasculatures discretized on a grid of size 1 mm3. Here we use a colour coding spatial visualization technique with colours 1-5 representing the 5 PV generations (Figure 8A shows the first 4 generations), and colours 6–10 representing the 5 HV generations (Figure 8B shows the first 4 generations). Figure 9C shows visually the complete combined generations, using a colour coding 1–10.
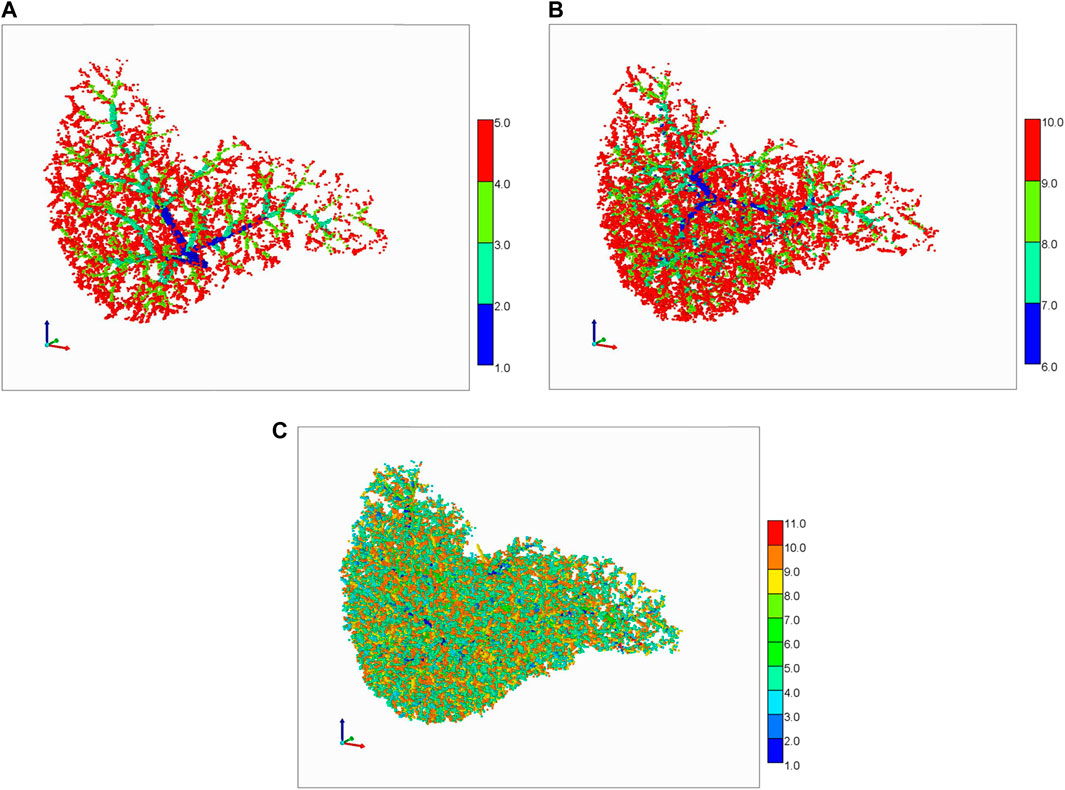
FIGURE 8. Schwen vasculature discretized on a cubic grid. (A) PV vasculature (first 4 generations), (B) HV vasculature (first 4 generations), (C) Complete PV and HV vasculatures (5 generations each).
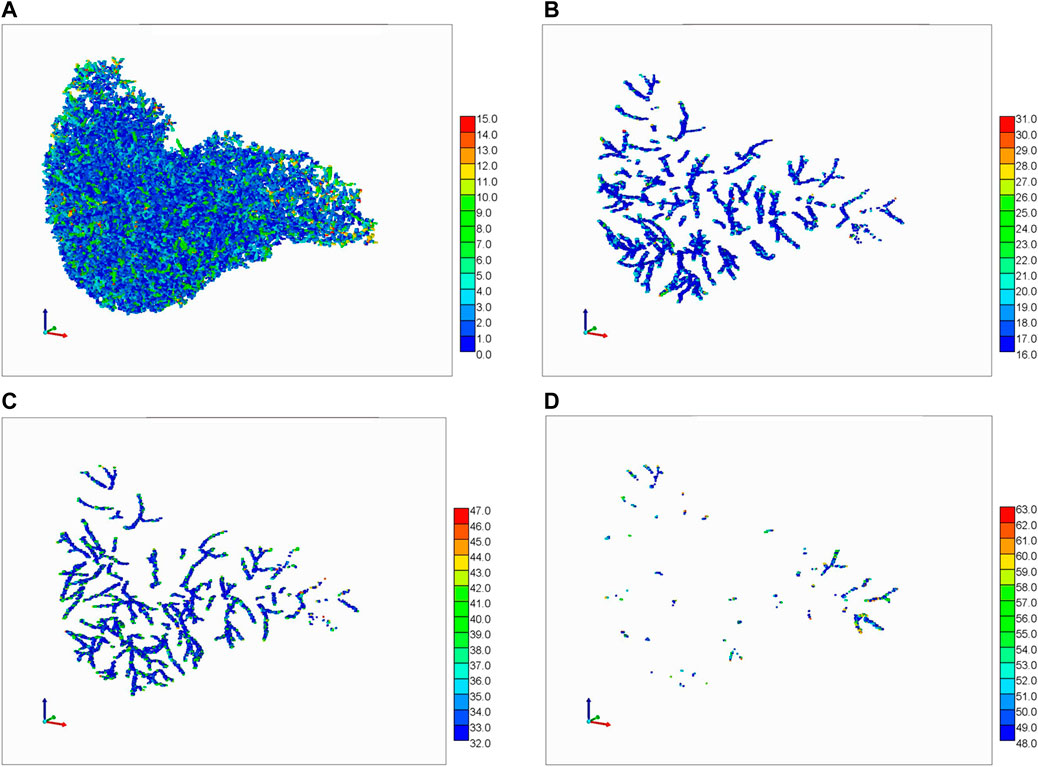
FIGURE 9. Portal Vasc. + Hepatic Vasc. + overlap from generations 3, 4, and 5. The color bar represents the number of vasculatures occupying one grid cell. (A) 0–15, (B) 16–31, (C) 32–47, and (D) 48–63.
This colour coding concept can be extended to illustrate vasculature overlaps within the 1 mm3 grid blocks. Figure 9 shows a summary 3D plot of 0–63 binary overlap states of the PV + HV vasculature from generations 3, 4, and 5. Figure 9A shows a summary 3D plot of the first 15 binary states of the PV + HV vasculature described in Supplementary Table SC1. This is equivalent to gen5p, gen5h, gen4p, and gen4h plus their overlaps. Figure 9B shows an equivalent plot of gen3p vasculature plus its overlaps, while the combination of Figures 9C,D shows gen3h vasculature plus its overlaps. Although the files also contain information on generations 1 and 2 of portal and hepatic vasculatures and their overlaps, this would be difficult to visualize and hence these figures are not shown. The values on the color bar indicate the number of vasculatures that go through a grid cell.
This information is later on converted to a volume fraction occupancy data that provides the fraction of volume occupied by a vasculature branch for all grid cells, see for example Supplementary Table SC1 that shows the volume fractions for the Rmax hepatic vasculature branch for different grid cells. A similar calculation has been done for the total of branches for both portal and hepatic vasculatures. (x, y, z) are coordinates information for a grid cell.
3.3 Full organ scale–dual continuum flow simulations
3.3.1 Full organ dual continuum flow model—concepts
With a chosen grid size of 1 mm3, our resulting discretized model is 227 × 170 × 175 = 7,653,250 cubic grid cells, but with only 3,291,430 active grid cells. Of these cells, a fraction is occupied by the Schwen vasculature, while the dominant remaining fraction of grid cells approximates liver lobules. With our chosen grid size of 1 mm, the largest generations of Schwen vasculature occupy multiple grid cells in cross section and length. The lobule grid cells are represented as a dual continuum of sinusoid vasculature and tissue. This represents the simplest gridded dual continuum representation of the full liver organ. Further improvements to this basic model include 1) upscaling liver lobule properties to account for the impact of missing fine scale vasculature; 2) adjusting the gridded Schwen vasculature to for partial occupancy of a 1 mm3 grid cell. A first attempt at assessing 1) has also been attempted here. The observation that liver vasculature is fractal (see Hahn et al., 2003; Hahn et al., 2005; Debbaut et al., 2011; Hermann et al., 2011) will be an important consideration in this future development.
Physical properties such as porosity, permeability, water saturation, diffusion coefficients can be established for each grid type. The upscaled dual continuum single grid block lobule properties have been discussed in detail above. For vasculature containing grid blocks (of 1 mm3 size), the porosity and permeability are set as a tube model (equivalent to that employed for ideal sinusoid blocks) but recognizing the grid block size difference (1 mm versus 6 μm). The porosity, ϕ, water saturation, Sw, diffusion coefficients, D, are set the same as sinusoid properties (ϕ = 0.7854, Sw = 1.0, D = D0). The permeability, however, is dramatically different, based on kb = Rb2/8 = 3.125e+4 μm2 = 3.166e+7 mD for Rb = 0.5 mm tube inside a 1 mm3 block (from Table 1, 1 mD = 0.987e-3 μm2 = 0.987e-3 mm2). Note vasculatures greater than a 0.5 mm radius are represented by multiple grid blocks. As an example, for a tube radius of Rt = 3 mm, the expected permeability is kt = Rt2/8 = 1.125e+9 μm2 = 1.1.4e+9 mD. This is represented by a 6 × 6 array of 1 mm3 blocks, yielding a permeability of kt = 36 × kb = 1.140e+9 mD, establishing an approximate equivalence.
Because these high permeabilities result in extremely high flows relative to those in lobule blocks, timing for pressure equilibration and component delivery to tissue is only shifted by an extremely small degree (microseconds) by any. We have further chosen to rescale our basic vasculature permeability somewhat (0.7 factor: 2.235e+7 mD instead of 3.166e+7 mD) to allow the small pressure drop effects to be better quantified and visualized.
Vasculature blocks are represented as pure vasculature (no tissue) versus lobule blocks which are dual continuum. Figure 10 shows a cross-sectional view of organ permeability, illustrating these points. Table 3 summarizes the organ dual continuum properties.
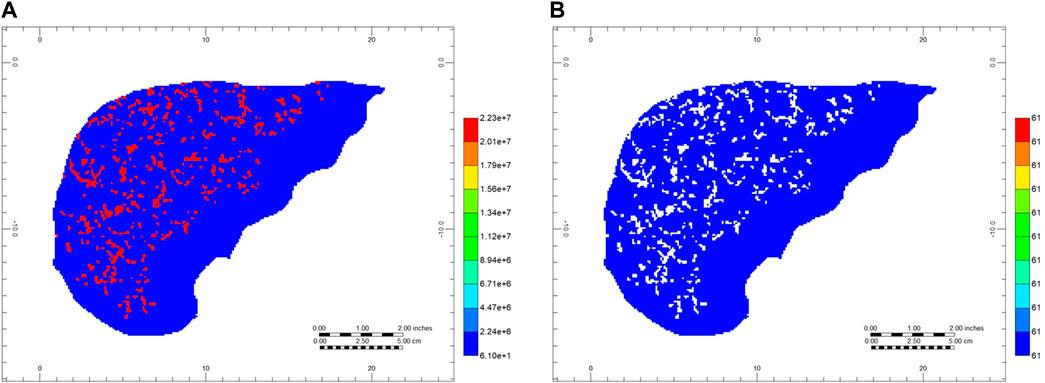
FIGURE 10. Full organ dual continuum permeabilities—cross sectional view (A) Gridded vasculature permeabilities (areal view, layer 80) and (B) Gridded effective tissue permeabilities (areal view, layer 80).
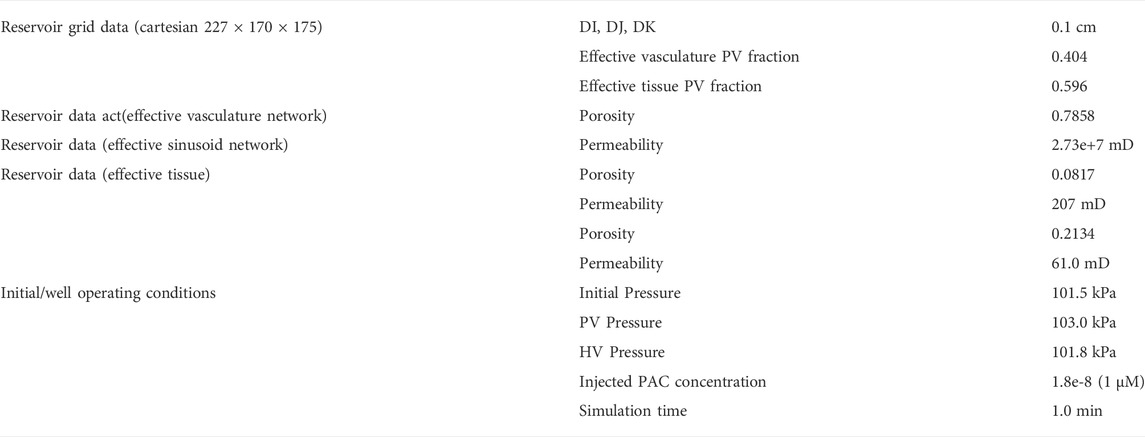
TABLE 3. Dual continuum data. (b) Full Liver Organ Model.
3.3.2 Full organ dual continuum flow model—results
With this basic model, several first-pass drug perfusion flow simulations were performed. These flows with the generated vasculature-DK lobular system and a flow rate of 980 cm3/min generates an organ scale pressure distribution, as shown in Figure 11A. The predicted pressure gradient is from the PV inlet to HV outlet. Figures 11B,C rescale this pressure profile to illustrate the near inlet upstream and near outlet downstream profiles. These plots are shown for the fracture (i.e., vasculature) pressures. The matrix (effective tissue) pressure profiles are essentially identical after a very short time pressure equilibration period, except for a small shift in maximum inlet and minimum outlet pressures, which ensures flows go from inlet vasculature to tissue to outlet vasculature. It is emphasized that non-reactive and reactive cases discussed here will produce the same pressure drops and pressure profiles, as the reactions of interest do not generate porosity/permeability changes. (This would contrast with reaction models simulating fibrosis, for example.)
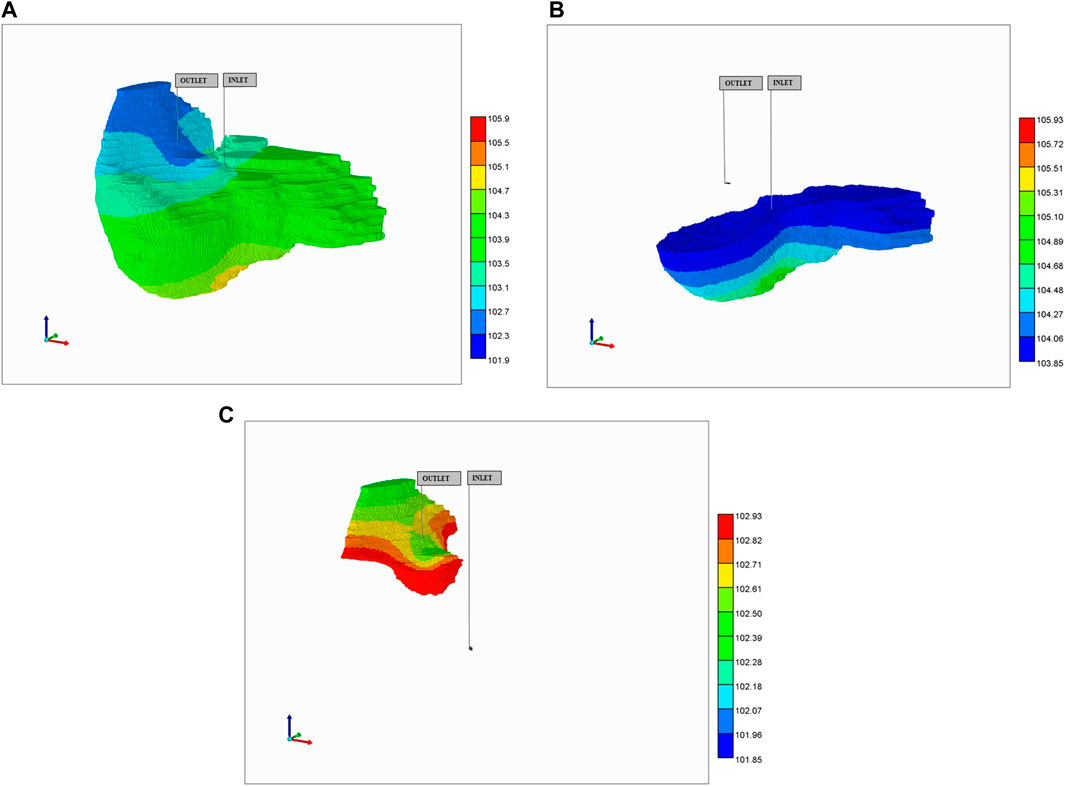
FIGURE 11. Steady-state pressure distribution in vasculature after 10 min: (A) full pressure range, (B) rescaled inlet pressure range, (C) rescaled outlet pressure range.
A non-reactive PAC injection case including only convective transfer between vasculature and tissue was compared with a case including an additional diffusive transfer mechanism. These can be viewed as representative limiting cases of large nanoparticle drug injection versus molecular drug injection strategies. These two cases were then rerun with tissue reaction, converting injected PAC to PAC-OH. Note that no consideration was paid to possible upscaling of the diffusive and reactive terms used in these models. The parameters from our lobule-scale models were used directly. Re-assessing this is an important area of future work (see Baish et al., 2011; Ben-Avraham and Havlin, 2011)
There was little observed difference in produced PAC dynamics with the non-reactive runs (produced PAC reached injected levels after 2 min, and no produced PAC-OH was observed in the reactive cases up to 10 min. There was little transfer of PAC from vasculature to tissue without the addition of diffusive transfer, and this had a significant observable effect on internal PAC distribution in the absence of reaction, and also on the distribution of PAC-OH for the reactive cases. An interesting result of the reaction-plus-diffusion case is that PAC is found 100% in the vasculature (none in tissue) while PAC-OH concentrations are almost identical in vasculature and tissue continua locally.
More particularly, for the no diffusion case, Figure 12A shows unreacted PAC in the vasculature after 10 min while 12b shows reacted PAC-OH in the tissue at the same time. Because both the large vasculature and the lobule’s vasculature contribute to the vasculature dual continuum, we can see two distinct distributions of PAC in the vasculature (i.e., a high concentration distribution and a low concentration distribution, found in the large vasculature and sinusoidal vasculature, respectively). Figure 12B shows minimally-reacted PAC-OH in the tissue at the same time point. Not shown are reacted PAC-OH in the vasculature and unreacted PAC in tissue, but both concentrations are essentially zero.
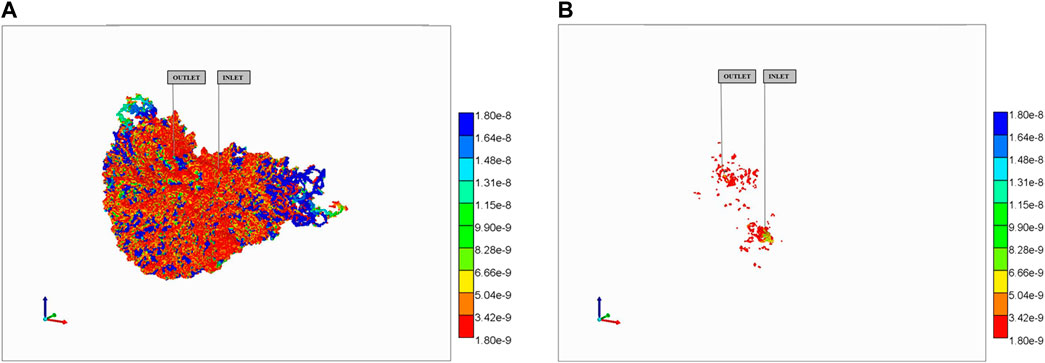
FIGURE 12. Reactive PAC and PAC-OH distributions in dual continuum model (no diffusion). (A) Reactive PAC distributions in fracture after 10 min. (B) Reactive PAC-OH distributions in matrix after 10 min.
This behavior is dramatically altered in the reaction with diffusive transfer case, as shown in Figure 13. The additional (i.e., dominant) diffusive transfer to tissue results in the lower PAC concentrations being completely removed from the vasculature (Figure 13A) resulting in large conversion to PAC-OH in tissue (Figure 13B). Not shown are the negligible amount of PAC in the tissue continua, and the almost identical concentration of PAC-OH in vasculature to that in tissue for this highly reactive case (as mentioned above).
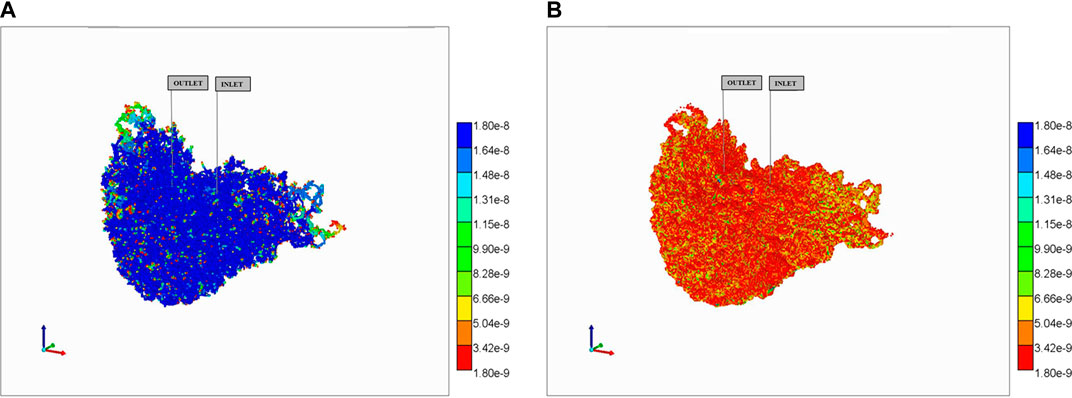
FIGURE 13. Reactive PAC and PAC-OH distributions in dual continuum model (no diffusion). (A) Reactive PAC distributions in fracture after 10 min. (B) Reactive PAC-OH distributions in matrix after 10 min.
We then considered “upscaling” lobule dynamics trying to account for the missing higher order vasculature generations. This was done by increasing the assumed sinusoid radius from 3 μm to 5 μm, resulting in porosity and permeability changes for the lobule grid cells, which gives the expected order of magnitude convection change caused by the missing vasculature. However, repeating the same four cases did not significantly change observed differences in spatial distribution and production behavior. For example, the total reacted PAC values for the reaction cases were found as:
NoScale_rx: 1.42e–12 mol (factor 1.00).
NoScale_rxdisp: 1.15e–08 mol (factor 8100).
Scaled_rx: 3.26e–12 mol (factor 3.26).
Scaled_rxdisp: 6.22e–08 mol (factor 43,803)Where ‘rx’ and ‘rxdisp’ denote “reaction without dispersion” and “reaction with dispersion” cases, respectively. It is clear that dispersion levels have a dramatic effect on the amount reacted at a fixed time point, while inclusion of missing vasculature leads to further increased reaction levels. Detailed exploration of the effects of missing vasculature is warranted.
4 Discussion
This paper has presented details of a computationally efficient algorithm to upscale liver metabolic processes and flows from the lobule scale to the full organ scale, and substantially extends our previous work. Here, we have emphasized the applicability of dual continuum techniques (separate upscaled elements for effective tissue and multi-level effective vasculature) when applying this upscaling. We have indicated specific issues associated with this upscaling—which mechanisms are retained and which are averaged by upscaling.
Indeed, future issues include refinements of vasculature representation in grid-cell-based models including partial vasculature occupancy of grid cells, and rigorous representation of sub-grid scale vasculature as well as reaction upscaling and lobule zonation. Efficient analytic methods to address upscaling issues can be considered. Alternatively, numerical methods for fitting effective properties can always be employed to connect one gridded scale to the next level in a stepwise fashion. As mentioned above, our choice of reaction parameters led to fast rates and imply one upscaling limit. A more extensive examination of slower reaction processes (e.g., some drug metabolism reactions) and varying Damkohler numbers appears warranted. This will have upscaling implications as the ratio of convective, diffusive, and reaction flows changes.
The resulting full organ computational model size (approximately one million grid size) allows extensive investigations of liver full organ processes with reasonable/practical simulation run times (<½ day for current standard workstation computing power or faster with parallel processing options). Note a dual continuum approach essentially doubles the number of grid cells used for property calculations (one for fracture/one for matrix) while accounting for the effects of non-equilibrium inter-continuum transfer. An equivalent average single continuum approach ignores these non-equilibrium effects, while explicitly representing all microvasculature would increase the number of grid cells by possibly 1 million times (based on capillary network density). As the total number of grid cells is an approximate estimate of comparative run times, it is clear that a dual continuum approach represents an attractive tradeoff to preserve modelling the process physics. Liver processes of interest at multiple scales include: 1) Disease (e.g., steatosis, fibrosis, cirrhosis): and 2) Drug metabolism in heathy tissue and tumors. In particular, fibrosis as a result of liver disease will be our focus for further modelling using the above techniques. Fibrosis affects or is affected by the disease states of steatosis, cirrhosis, and cancer and furthermore impacts the ability and feasibility of drug treatments. Fibrosis can be expected to delay and change effective metabolic/drug rate processes. At the full organ scale, contrasting regions of healthy liver and fibrotic liver can be examined and evaluated, and a critical fibrotic fraction for liver failure can be determined mechanistically.
In summary, efficient computational modelling allows process experiments conducted at multiple scales to be put into a consistent theoretical framework (from single cell to lobule; from lobule to full liver), using rigorous upscaling (or multi-scaling) techniques in time and space. Indeed, this is a fruitful way to combine points of view from any multi-disciplinary approach. This paper presents a practical tool to accomplish these goals.
Data availability statement
The original contributions presented in the study are included in the article/Supplementary Material, further inquiries can be directed to the corresponding author.
Author contributions
JT: conceptualization, editing the manuscript. DC and VR: Modelling, performing simulations, writing, and editing the manuscript.
Funding
This study was funded by the MacEwan University strategic grant (# 02105) awarded to VR and research funding received from NSERC (Canada) to support the research of JAT.
Acknowledgments
VR wishes to thank MacEwan University strategic grant. JT gratefully acknowledges research funding received from NSERC (Canada).
Conflict of interest
DC is employed by the company Computer Modelling Group Ltd.
The remaining authors declare that the research was conducted in the absence of any commercial or financial relationships that could be construed as a potential conflict of interest.
Publisher’s note
All claims expressed in this article are solely those of the authors and do not necessarily represent those of their affiliated organizations, or those of the publisher, the editors and the reviewers. Any product that may be evaluated in this article, or claim that may be made by its manufacturer, is not guaranteed or endorsed by the publisher.
Supplementary material
The Supplementary Material for this article can be found online at: https://www.frontiersin.org/articles/10.3389/fsysb.2022.926923/full#supplementary-material
References
Baish, J., Stylianopoulos, T., Lanning, R., Kamoun, W., Fukumura, D., Munn, L., et al. (2011). Scaling rules for diffusive drug delivery in tumor and normal tissues. Proc. Natl. Acad. Sci. U. S. A. v108 (5), p1799–p1803. doi:10.1073/pnas.1018154108
Ben-Avraham, D., and Havlin, S. (2011). Diffusion and reaction in fractals and disordered systems. Cambridge: Cambridge University Press.
Berndt, N., Horger, M., Bulik, S., and Holzhutter, H. (2018). A multiscale modelling approach to assess the impact of metabolic zonation and microperfusion on the hepatic carbohydrate metabolism. PLoS Comput. Biol. 14, e1006005. doi:10.1371/journal.pcbi.1006005
Cassot, F., Lauwers, F., Fouard, C., Prohaska, S., and Lauwers-Cances, V. (2006). A novel three-dimensional computer-assisted method for a quantitative study of microvascular networks of the human cerebral cortex. Microcirculation 13, 1–18. doi:10.1080/10739680500383407
Cipolla, C., Lolon, E., Erdle, J., and Rubin, B. (2009). “Reservoir modeling in shale-gas reservoirs,” in Paper SPE 125530, presented at the 2009 eastern regional meeting (Charleston, West Virginia: Paper number).
CMG Ltd (2021). STARS user’s guide: Advanced process and thermal reservoir simulator. Calgary, AB: Computer Modelling Group Ltd.
Debbaut, C., Monbalin, D., Casteleyn, C., Cornille, P., VanLoo, D., Masschaele, B., et al. (2011). From vascular corrosion cast to electrical analog model for the study of human liver hemodynamics and perfusion. IEEE Trans. Biomed. Eng. v58 (1), p25–p35. doi:10.1109/TBME.2010.2065229
Dullien, F. (1992). Porous media: Fluid transport and pore structure, v2. San Diego, California: Academic Press.
Erbertseder, K., Reichold, J., Flemisch, B., Jenny, P., and Helmig, R. (2012). A coupled discrete/continuum model for describing cancer-therapeutic transport in the lung. Plos One 7 (3), e31966. doi:10.1371/journal.pone.0031966
Gu, W., Yao, H., Vega, A., and Flagler, D. (2004). Diffusivity of ions in agarose gels and intervertebral disc: Effect of porosity. Ann. Biomed. Eng. 32 (12), 1710–1717. doi:10.1007/s10439-004-7823-4
Hahn, H., Evertsz, C., Fasel, J., and Peitgen, H. (2003). Fractal properties, segment anatomy, and interdependence of the human portal vein and the hepatic vein in 3D. Fractals 11, 53–62. doi:10.1142/s0218348x03001422
Hahn, H., Georg, M., and Peitgen, H. (2005). Fractal aspects of three-dimensional vascular constructive Optimization. Fractals Biol. Med. 4, 55–66. doi:10.1007/3-7643-7412-8_5
Herbas, J., Moreno, R., Marin, A., Romero, M., and Coombe, D. (2009). Reservoir simulation of non-selective placement of a poymer gel treatment to improve water injection profiles and sweep efficiency in the Lagomar field western Venezuela. Mexico: Pueblo. paper SPE 92025, presented at the 2009 Eastern Regional Meeting.
Herman, A., Savage, V., and West, G. (2011). A quantitative theory of solid tumor growth, metabolic rate and vascularization. Plos One 6 (9), e22973. doi:10.1371/journal.pone.0022973
Ho, F., and Strieder, W. (1981). A variational calculation of the effective surface diffusion coefficient and tortuosity. Chem. Eng. Sci. 36, 253–258. doi:10.1016/0009-2509(81)85003-8
Lorente, S., Hautefeuille, M., and Sanchez-Cedillo, A. (2020). The liver, a functionalized vascular structure. Sci. Rep. 10, 16194. doi:10.1038/s41598-020-73208-8
Michaelis, L., Menten, M., Johnson, K., and Goody, R. (2011). The original Michaelis constant: Translation of the 1913 michaelis-menten paper. Biochem. (Mosc) 50, 8264–8269. doi:10.1021/bi201284u
Michler, C., Cookson, A., Chabiniok, R., Hyde, E., Lee, J., Sinclair, M., et al. (2012). A computationally efficient framework for the simulation of cardiac perfusion using a multi-compartment Darcy porous-media flow model. Int. J. Numer. Method. Biomed. Eng. 29, 217–232. doi:10.1002/cnm.2520
Oballa, V., Coombe, D., and Buchanan, W. L. (1993). Factors affecting the thermal response of naturally fractured reservoirs. J. Can. Pet. Tech. 32, 31–42. doi:10.2118/93-08-04
Ogston, A., Preston, B., and Wells, J. (1973). On the transport of compact particles through solutions of chain polymers. Proc. R. Soc. Lond. A 333, 297–316. doi:10.1098/rspa.1973.0064
Peyrounette, M., Davit, Y., Quintard, M., and Lorthois, S. (2018). Multiscale modelling of blood flow in cerebral microcirculation: Details at capillary scale control accuracy at the level of the cortex. Plos One 13, e0189474. doi:10.1371/journal.pone.0189474
Rezania, V., Coombe, D., and Tuszynski, J. (2016). A physiologically-based flow network model for hepatic drug elimination III: 2D/3D DLA lobule models. Theor. Biol. Med. Model. v13 (9). doi:10.1186/s12976-016-0034-5
Rezania, V., Coombe, D., and Tuszynski, J. (2020). Liver bioreactor design issues of fluid flow and zonation, fibrosis and mechanics: A computational perspective. J. Funct. Biomater. 11 (1), 13. doi:10.3390/jfb11010013
Rezania, V., Marsh, R. E., Coombe, D., and Tuszynski, J. A. (2013a). A physiologically-based flow network model for hepatic drug elimination I: Regular lattice lobule model. Theor. Biol. Med. Model. 10, 52. doi:10.1186/1742-4682-10-52
Rezania, V., Marsh, R. E., Coombe, D., and Tuszynski, J. A. (2013b). A physiologically-based flow network model for hepatic drug elimination II: Variable lattice lobule models. Theor. Biol. Med. Model. 10, 53. doi:10.1186/1742-4682-10-53
Schwen, L., Homeyer, A., Schwier, M., Dahmen, D., Dirsch, O., Schenk, A., et al. (2016). Zonated quantification of steatosis in an entire mouse liver. Comput. Biol. Med. v73, 108–118. doi:10.1016/j.compbiomed.2016.04.004
Schwen, L., Kuepfer, L., and Preusser, T. (2017). Modeling approaches for hepatic spatial heterogeneity in pharmacokinetic simulations. Drug Discov. Today Dis. Models 22, 35–43. doi:10.1016/j.ddmod.2017.09.002
Schwen, L., Schenk, A., Kreutz, C., Timmer, J., Bartolomé Rodríguez, M., Kuepfer, L., et al. (2015). Representative sinusoids for hepatic four-scale pharmacokinetics simulations. Plos One 10 (7), e0133653. doi:10.1371/journal.pone.0133653
Shipley, R., Chapman, S., and Jawad, R. (2008). Multiscale modeling of fluid transport in tumors. Bull. Math. Biol. 70, 2334–2357. doi:10.1007/s11538-008-9349-7
Shipley, R., and Chapman, S. (2010). Multiscale modelling of fluid and drug transport in vascular tumours. Bull. Math. Biol. 72, 1464–1491. doi:10.1007/s11538-010-9504-9
Sluka, J., Fu, X., Swat, M., Belemonte, J., Cosmanescu, A., Clendenon, S., et al. (2018). A liver-centric multiscale modeling framework for xenophobics. Plos One 6 (4), pone0198060. doi:10.1371/journal.pone.0162428
Vaclavikova, R., Soucek, P., Svobodova, L., Anzenbacher, P., Simek, P., Guengerich, F., et al. (2004). Different in vitro metabolism of paclitaxel and docetaxel in humans, rats, pigs, and minipigs. Drug Metab. Dispos. 32 (6), 666–674. doi:10.1124/dmd.32.6.666
White, D., Rezania, V., Coombe, D., and Tuszynski, J. (2016). Building a 3D virtual liver: Methods for simulating blood flow and hepatic clearance on 3D structures. Plos One 11 (9), e0162215. doi:10.1371/journa.lpone.0162215
Xie, C., Schwen, L., Wei, W., Schenk, A., Zafarnia, S., Gremse, F., et al. (2015). Quantification of hepatic vascular and parenchymal regeneration in mice. PLoS One 11, 0160581. doi:10.1371/journal.pone.0160581
Keywords: computational fluid dynamics, dual continuum model, liver organ, liver vasculatures, drug distribution and reaction, diffusion
Citation: Coombe D, Rezania V and Tuszynski JA (2022) Dual continuum upscaling of liver lobule flow and metabolism to the full organ scale. Front. Syst. Biol. 2:926923. doi: 10.3389/fsysb.2022.926923
Received: 23 April 2022; Accepted: 26 September 2022;
Published: 02 November 2022.
Edited by:
Luis Mendoza, National Autonomous University of Mexico, MexicoReviewed by:
Muhammad Sahimi, University of Southern California, United StatesEhsan Taghizadeh, University of California, Los Angeles, United States
Copyright © 2022 Coombe, Rezania and Tuszynski. This is an open-access article distributed under the terms of the Creative Commons Attribution License (CC BY). The use, distribution or reproduction in other forums is permitted, provided the original author(s) and the copyright owner(s) are credited and that the original publication in this journal is cited, in accordance with accepted academic practice. No use, distribution or reproduction is permitted which does not comply with these terms.
*Correspondence: Dennis Coombe, ZGVubmlzLmNvb21iZUBjbWdsLmNh