División de Neurociencias, Universidad Pablo de Olavide, Sevilla, Spain
The hippocampal CA3-CA1 synapse is an excellent experimental model for studying the interactions between short- and long-term plastic changes taking place following high-frequency stimulation (HFS) of Schaffer collaterals and during the acquisition and extinction of a classical eyeblink conditioning in behaving mice. Input/output curves and a full-range paired-pulse study enabled determining the optimal intensities and inter-stimulus intervals for evoking paired-pulse facilitation (PPF) or depression (PPD) at the CA3-CA1 synapse. Long-term potentiation (LTP) induced by HFS lasted 10 days. HFS-induced LTP evoked an initial depression of basal PPF. Recovery of PPF baseline values was a steady and progressive process lasting �20 days, i.e., longer than the total duration of the LTP. In a subsequent series of experiments, we checked whether PPF was affected similarly during activity-dependent synaptic changes. Animals were conditioned using a trace paradigm, with a tone as a conditioned stimulus (CS) and an electrical shock to the trigeminal nerve as an unconditioned stimulus (US). A pair of pulses (40 ms interval) was presented to the Schaffer collateral-commissural pathway to evoke fi eld EPSPs (fEPSPs) during the CS-US interval. Basal PPF decreased steadily across conditioning sessions (i.e., in the opposite direction to that during LTP), reaching a minimum value during the 10th conditioning session. Thus, LTP and classical eyeblink conditioning share some presynaptic mechanisms, but with an opposite evolution. Furthermore, PPF and PPD might play a homeostatic role during long-term plastic changes at the CA3-CA1 synapse.
Experimentally evoked LTP is a form of synaptic potentiation that shares many properties with activity-dependent changes in synaptic strength induced during learning tasks (Bliss and Collingridge, 1993
; Whitlock et al., 2006
). Thus, both processes evoke significant changes in synaptic weights, and exhibit common properties such as input specificity, associability, and other forms of cooperative interactions (Abraham, 2003
; McNaughton et al., 1978
; Morris et al., 2003
). Both the electrophysiological properties and the subcellular and molecular events associated either with LTP or with learning and memory processes have been characterized in detail, mostly during in vitro studies (Bliss and Collingridge, 1993
; Lynch, 2004
; Malenka and Bear, 2004
). Nevertheless, there is not very much information on actual changes in synaptic properties taking place in hippocampal networks during the acquisition of new motor and cognitive abilities, or on the possible interactions between HFS-evoked LTP and learning-dependent changes in synaptic plasticity (Neves et al., 2008
). Recently, it has been shown that trace eyeblink conditioning, a form of associative learning, evokes a concomitant change in strength at the hippocampal CA3-CA1 synapse in behaving mice (Gruart et al., 2006
). Moreover, both eyeblink conditioning and the associated change in CA3-CA1 synaptic strength are prevented by HFS of the ipsilateral Schaffer collateral-commissural pathway, indicating that the evoked LTP is able to occlude any further learning (Gruart et al., 2006
), even for ≈10 days after LTP disappearance (Madroñal et al., 2007
).
It has been reported that LTP interferes with (or is part of) some short-term forms of synaptic plasticity (PPF and PPD) evoked by paired-pulse stimulation, and that it is expressed preferentially, although not exclusively, at presynaptic sites (Lauri et al., 2007
; Markram and Tsodyks, 1996
; Sokolov et al., 1998
; Thompson, 1988
; Volianskis and Jensen, 2003
; Zucker and Regehr, 2002
). If these contentions are true, we should be able to determine the evolution of presynaptic LTP components in a more precise way in chronic behaving animals. We should also be able to determine the presynaptic components of use-dependent synaptic changes in strength activated during associative learning.
We studied here the effects of HFS-evoked LTP at the CA3-CA1 synapse of behaving mice on PPF induced at the same synapse by pairs of pulses of selected intensities and time-intervals. LTP and PPF interactions were followed for >30 days. We also determined putative interactions between PPF and changes in CA3-CA1 synaptic strength induced during classical eyeblink conditioning. For this, we used a trace paradigm, presenting a tone as CS and an electrical shock to the supraorbital nerve as US. Conditioned responses (CRs) were determined from the electromyographic (EMG) activity of the orbicularis oculi muscle ipsilateral to the US presentation. Animals were implanted with chronic stimulating electrodes in the Schaffer collateral-commissural pathway and with a recording electrode in the hippocampal CA1 area. The aim was to record the fEPSP evoked at the CA3-CA1 synapse during the CS-US interval across conditioning sessions and during the paired-pulse test. Present results provide in vivo evidence that LTP evokes an initial depression of PPF that recovers at a slow, steady rate in the following days. In contrast, synaptic potentiation evoked by the classical conditioning test induced an increasing depression of PPF across conditioning, whilst PPF evolution across extinction sessions presented a pattern similar to that evoked during LTP.
Animals
Experiments were carried out in 170 successful C57Bl/6 male adult mice (3–5 months old; 25–35 g) obtained from an official supplier (University of Granada Animal House, Granada, Spain). We considered successful animals those that finished the selected experimental protocol presenting fEPSPs and EMG recordings that did not deteriorate over time. Additional animals were used in a preliminary study of the stability of the recording and stimulating systems. Upon arrival, animals were housed in shared cages (n = 8 per cage), but they were switched to individual cages after surgery. Mice were kept on a 12 h light/dark cycle with constant ambient temperature (21.5 ± 1°C) and humidity (55 ± 8%). Food and water were available ad libitum. Experiments were carried out in accordance with the guidelines of the European Union (2003/65/CE) and recent Spanish regulations (BOE 252/34367-91, 2005) for the use of laboratory animals in chronic studies. All experimental protocols were also approved by the local Ethical Committee of the Pablo de Olavide University (Seville, Spain).
Surgery
Animals were anesthetized with 0.8–1.5% isoflurane, supplied from a calibrated Fluotec 5 (Fluotec-Ohmeda, Tewksbury, MA, USA) vaporizer, at a flow rate of 1–4 L/min oxygen (AstraZeneca, Madrid, Spain) and delivered by a mouse anesthesia mask (David Kopf Instruments, Tujunga, CA). Animals were implanted with bipolar recording electrodes in the left orbicularis oculi muscle and with bipolar stimulating electrodes on the supraorbitary branch of the ipsilateral trigeminal nerve (Figure 1
A). Electrodes were made of 50 μm, Teflon-coated, annealed stainless steel wire (A-M Systems, Carlsborg, WA). Electrode tips were bared of their isolating cover for 0.5 mm and bent as a hook to allow a stable insertion in the upper eyelid.
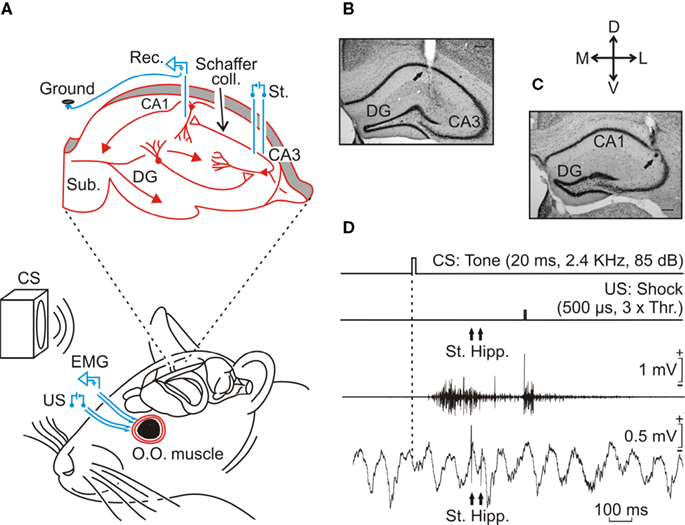
Figure 1. Experimental design. (A) Animals were implanted with EMG recording electrodes in the orbicularis oculi (O.O.) muscle of the upper eyelid and with stimulating electrodes on the supraorbital nerve. The latter was used for presentation of unconditioned stimulus (US). For classical eyeblink conditioning, we used a tone (20 ms, 2.4 kHz, 85 dB) as a conditioned stimulus (CS). The loudspeaker was located 30 cm in front of the animal’s head. Animals were also implanted with stimulating (St.) electrodes at the Schaffer collaterals (coll.) and with a recording (Rec.) electrode in the CA1 area (see inset at the top). (B, C) Two photomicrographs illustrating the location of hippocampal recording (B) and stimulating (C) sites. Scale bars: 200 μm. DG, dentate gyrus, Sub., subiculum; D, L, M, V, dorsal, lateral, medial, and ventral. (D) Schematic representation of the conditioning paradigm, including CS and US stimuli, and the moment at which a paired pulse was presented to Schaffer collaterals (St. Hipp.). The two lower traces illustrate an EMG recording and an extracellular recording of hippocampal activity. Both traces were collected from the 9th conditioning session of a representative animal. Calibrations as indicated.
During the same surgical session, animals were also implanted with bipolar stimulating electrodes in the right (contralateral) Schaffer collateral pathway of the dorsal hippocampus (2 mm lateral and 1.5 mm posterior to Bregma, and 1–1.5 mm from the brain surface; Paxinos and Franklin, 2001
) and with a recording electrode aimed towards the ipsilateral CA1 stratum radiatum (1.2 mm lateral and 2.2 mm posterior to Bregma, and 1–1.5 from the brain surface; Figure 1
A). These electrodes were made of 50 μm, Teflon-coated tungsten wire (Advent Research, Eynsham, UK). The final location of the recording electrode in the CA1 area was determined according to the field potential depth profile evoked by single pulses presented to the Schaffer collateral pathway (Gruart et al., 2006
). A bare silver wire was affixed to the skull as ground. All the implanted wires were soldered to two four-pin sockets (RS Amidata, Madrid, Spain) which were then fixed to the skull with acrylic cement. After surgery, a minimum of a week was allowed before starting the experimental recording sessions. Further details of this chronic preparation can be found elsewhere (Gruart et al., 2006
; Madroñal et al., 2007
).
Recording and Stimulation Procedures
Recording sessions were carried out with three to six animals at a time. Animals were placed in separate small (5 cm × 5 cm × 10 cm) plastic chambers located inside a larger Faraday box (30 cm × 30 cm × 20 cm). The EMG activity of the orbicularis oculi muscle was recorded with Grass P511 differential amplifiers (Grass-Telefactor, West Warwick, RI, USA) at a bandwidth of 0.1 Hz–10 kHz. Field EPSP recordings were also made with Grass P511 differential amplifiers through a high-impedance probe (2 × 10¹² Ω, 10 pF).
Paired-Pulse Stimulation
For input/output curves (Figure 2
), animals (n = 10) were stimulated at the Schaffer collaterals with paired pulses (40 ms of inter-stimulus interval) at increasing intensities (0.02–0.3 mA). We also checked the effects of paired pulses at different (10, 20, 40, 100, 200, and 500 ms) inter-stimulus intervals when using intensities corresponding to 40 and 60% of the amount necessary to evoke a saturating response (Figure 3
; n = 5 animals). A complete study of the mixed effects of increasing intensities (0.02–03 mA) within a range of inter-stimulus intervals (5, 10, 20, 40, 80, 160, 320, and 640 ms) was carried out in six selected animals (Figure 4
). In all the cases, the pair of pulses of a given intensity was repeated ≥5 times with time intervals ≥30 s, to avoid as much as possible interferences with slower short-term potentiation (augmentation) or depression processes (Zucker and Regehr, 2002
). Moreover, to avoid any cumulative effects, intensities and intervals were presented at random. At the range of intensities used here, no population spikes were observed in the collected recordings.
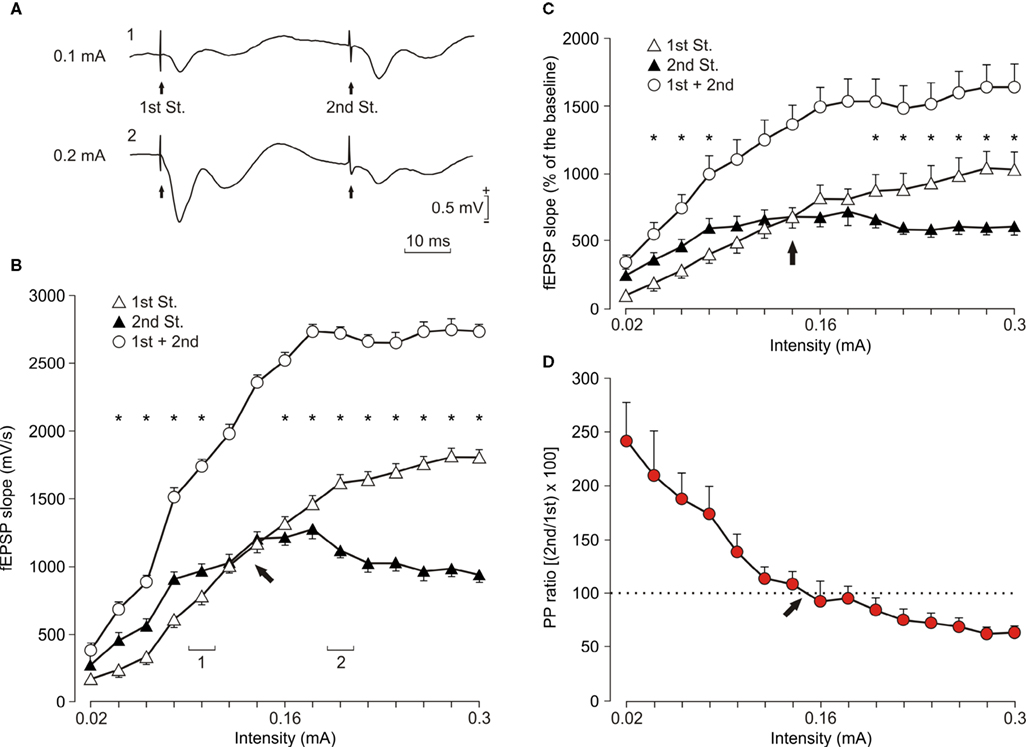
Figure 2. Input/output curves of the CA3-CA1 synapse using paired-pulse stimulation. (A) Representative averaged (n = 3) records of fEPSPs recorded in the CA1 area following paired (1st and 2nd St., at 40 ms inter-stimulus interval) stimulation of the ipsilateral Schaffer collaterals at two different (1: 0.1 mA and 2: 0.2 mA) intensities. (B) Relationships between the intensity (in mA) of pairs of stimuli (40 ms inter-stimulus interval) presented to Schaffer collaterals and the slope of the field EPSPs evoked at the CA1 layer, corresponding to the 1st (white triangles) and the 2nd (black triangles) pulses. Values for the 1st + 2nd fEPSPs (white circles) are also indicated. These data (illustrated as mean ± SEM) were collected from a representative animal; *P < 0.001 [F(14,56) = 857.19]. 1 and 2 indicate intensity values for the representative records illustrated in (A). (C) The same as for (B), but representing data averaged from 10 animals; *P < 0.001 [F(14,126) = 38.667]. (D) Evolution of the paired-pulse ratio [(2nd/1st) × 100; red circles] with increasing stimulus intensity for the data illustrated in (C). Arrows in (B–D) indicate the intensity at which the PPF was reversed into PPD.
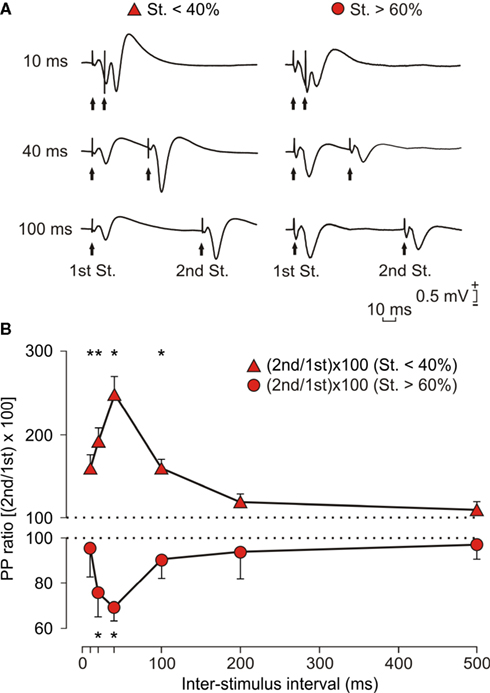
Figure 3. Effects of paired-pulse stimulation of the CA3-CA1 synapse at two different intensities. (A) Representative records (average of three records) of fEPSPs evoked by paired-pulse stimulation at three different (10, 40, 100 ms) time intervals, and using intensities (mA) <40% (red triangle and left set of records) and >60% (red circle and right set of records) of the asymptotic value. (B) PPF (red triangles) and PPD (red circles) of fEPSPs recorded in the CA1 area following stimulation of the ipsilateral Schaffer collaterals (n = 10 animals). PPF (red triangles) was evoked by stimulating Schaffer collaterals at intensities <40% of the asymptotic values, whilst PPD (red circles) was evoked by intensities >60% of asymptotic values. Field EPSPs paired traces were collected at inter-pulse intervals of 10, 20, 40, 100, 200, and 500 ms. The data shown are mean ± SEM slopes of the second field EPSP expressed as a percentage of the first [(2nd/1st) × 100] for the six inter-stimulus intervals used in this study. [F(10,90) = 6.213]; *P < 0.01 for PPF and P < 0.05 for PPD.
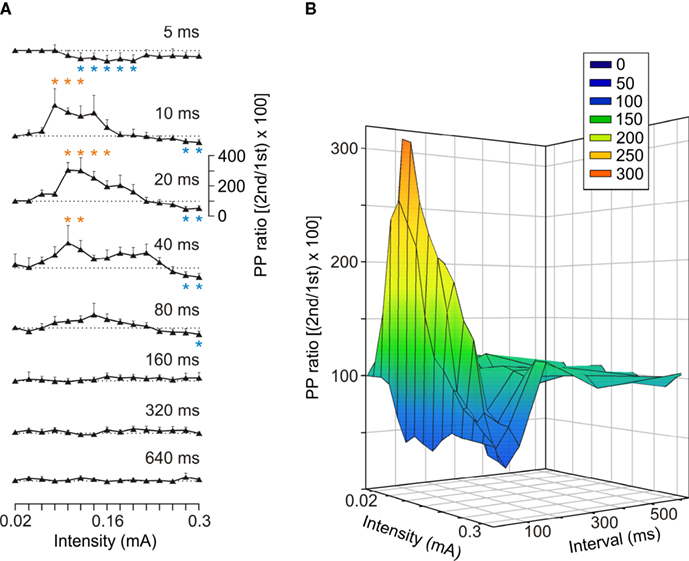
Figure 4. Facilitation and depression evoked by paired-pulse stimulation of the CA3-CA1 synapse at different intensities and inter-pulse intervals. (A) Facilitation or depression of fEPSPs in the pyramidal CA1 area was evoked by pairs of pulses presented at the Schaffer collaterals, at the indicated intensities and inter-stimulus intervals. The paired-pulse ratio was calculated as [(2nd/1st) × 100]. Data were collected from six animals, and each pair of pulses of a given intensity was repeated ≥5 times/animal. The dotted line indicates a ratio equal to 100, corresponding to fEPSPs of exactly the same slope. *P ≤ 0.05 for PPF (red asterisks) and PPD (blue asterisks). (B) A three-dimensional representation of data included in (A).
Long-Term Potentiation
Field EPSP baseline values (Figure 5
) were collected 15 min prior to LTP induction using paired (40 ms inter-stimulus interval) 100 μs, square, biphasic pulses. Pulse intensity was set at 35–45% of the amount necessary to evoke a maximum fEPSP response (0.05–0.15 mA) – that is, well below the threshold for evoking a population spike (Gruart et al., 2006
; Gureviciene et al., 2004
). An additional criterion for selecting stimulus intensity was that the second stimulus evoked a larger (>20%) synaptic field potential than the first (Bliss and Gardner-Medwin, 1973
). For LTP induction, each animal was presented with an HFS session consisting of five 200 Hz, 100 ms trains of pulses at a rate of 1/s. This protocol was presented six times, at intervals of 1 min. Thus, a total of 600 pulses were presented during an HFS session. In order to avoid evoking large population spikes and/or the appearance of EEG seizures, the stimulus intensity during HFS was set at the same as that used for generating baseline recordings. None of the animals used in this study presented any after-discharge or motor seizure following the HFS protocol, as checked by on-line EEG recordings and visual observation of the stimulated mouse. After each HFS session, the same paired-pulse stimuli (40 ms inter-stimulus interval) were presented every 20 s for 30 min during the first LTP session and for 15 min the following days (Figure 5
). Since short-term potentiation seems to be dependent on the number of stimuli delivered (Volianskis and Jensen, 2003
), paired-pulse evolution after HFS was followed here using a minimum number of paired stimuli per recording session (i.e., a total of 45 paired-pulses per recording day). The number of mice used in these experiments was 80. In 60 mice, LTP was followed for 24 h; those animals received only one HFS session. In another 10 animals, LTP was followed for 12 days, and in 10 additional animals, the effects of HFS trains were checked for up to 33 days. In these two latter cases, animals received two HFS sessions (see Figure 5
).
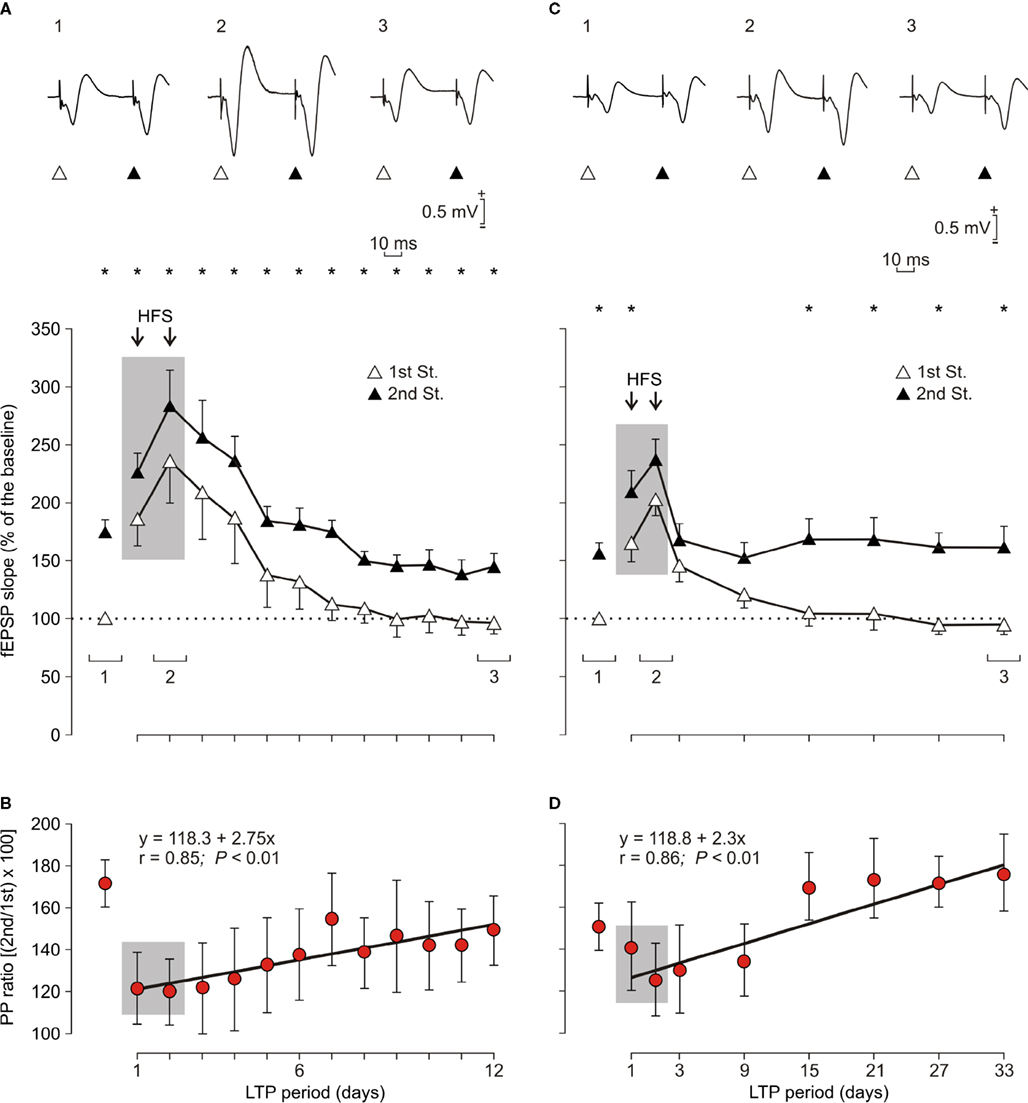
Figure 5. Evolution of fEPSPs evoked in the CA1 area by paired-pulse stimulation of Schaffer collaterals before and after two HFS sessions. (A, C) For LTP induction, each animal was presented with two HFS sessions (see arrows and shaded area) each consisting of five 200 Hz, 100 ms trains of pulses at a rate of 1/s. This protocol was presented six times, at intervals of 1 min. The 100 μs, square, biphasic pulses used to evoke LTP were applied at the same intensity used for the single pulse presented following HFS presentation. The evolution of LTP was checked using a pair of pulses (1st, white triangles; 2nd, black triangles) with an inter-stimulus interval of 40 ms. Recordings was carried out for 12 days (A, n = 10 animals) and 33 days (C, n = 10 animals). At the top are illustrated some representative examples (averaged three times) of fEPSPs evoked at the CA3-CA1 synapse by paired-pulse stimulation (40 ms interval) collected prior to HFS (1), during the 2nd HFS session (2) and 10 (3, left) and 31 (3, right) days after it. Illustrated data correspond to mean ± SEM. *P < 0.001, for differences between the 1st and 2nd pulses, corresponding to data illustrated in (A) [F(12,108) = 13.463] and (C) [F(8,72) = 25.94]. (B, D) Note that fEPSP slopes decreased across recording days for both 1st and 2nd, but that their relationship, i.e., the paired pulse (PP) ratio [(2nd/1st) × 100; red circles and regression lines] increased steadily across time. Equations corresponding to the linear regression analyses of PP ratios are also indicated for the two sets of data.
Classical Eyeblink Conditioning
Classical conditioning was achieved using a trace paradigm (Figure 1
D). For this, a tone (20 ms, 2.4 kHz, 85 dB) was presented as a CS. The US consisted of a 500 μs, 3 × threshold, square, cathodal pulse applied to the supraorbital nerve. The US started 500 ms after the end of the CS. A total of two habituation, 10 conditioning, and five extinction sessions were carried out for each animal. A conditioning session consisted of 60 CS-US presentations, and lasted ≈30 min. For a proper analysis of the CR, the CS was presented alone in 10% of the cases. CS-US presentations were separated at random by 30 ± 5 s. Animals received just one training session per day. For habituation and extinction sessions, only the CS was presented, also for 60 times per session, at intervals of 30 ± 5 s. For pseudoconditioning, unpaired CS and US presentations were carried out for 10 sessions (60 times/session). Pseudoconditioned animals (n = 10) also received two habituation and five extinction sessions as indicated above (Gruart et al., 2006
).
As criteria, we considered a “conditioned response” the presence, during the CS-US interval, of EMG activity lasting >10 ms and initiated >50 ms after CS onset. In addition, the integrated EMG activity recorded during the CS-US interval had to be at least 2.5 times greater than the averaged activity recorded immediately before CS presentation (Porras-García et al., 2005
).
Synaptic field potentials in the CA1 area were evoked during habituation, conditioning, and extinction sessions by a single 100 μs, square, biphasic (negative–positive) pulse applied to Schaffer collaterals 300 ms after CS presentation. Stimulus intensities ranged from 0.05 to 0.35 mA. A total of 60 successful animals were used in this series of experiments.
Histology
At the end of the recording sessions, mice were deeply re-anesthetized (sodium pentobarbital, 50 mg/kg), and perfused transcardially with saline and 4% phosphate-buffered paraformaldehyde. Brains were dissected out, postfixed overnight at 4°C, and cryoprotected in 30% sucrose in PBS. Sections were obtained in a microtome (Leica, Wetzlar, Germany) at 50 μm. Selected sections including the dorsal hippocampus were mounted on gelatinized glass slides and stained using the Nissl technique with 0.1% toluidine blue, to determine the location of stimulating and recording electrodes (Figures 1
B,C).
Data Collection and Analysis
EMG and extracellular hippocampal activity, and 1-volt rectangular pulses corresponding to CS and US presentations, were stored digitally on a computer through an analog/digital converter (CED 1401 Plus, Cambridge, England), at a sampling frequency of 11–22 kHz and with an amplitude resolution of 12 bits. Data were analyzed off-line for quantification of conditioned responses and fEPSP slopes with the help of commercial (Spike 2 and SIGAVG from CED) and home-made (Gruart et al., 2006
; Porras-García et al., 2005
) representation programs. The slope of evoked fEPSPs was computed as the first derivative (volts/s) of fEPSP recordings (volts). For this, five successive fEPSPs were averaged, and the mean value of the slope during the rise time period (i.e., the period of the slope between the initial 10% and the final 10% of the fEPSP) was determined. Computed results were processed for statistical analysis using the Sigma Stat for Windows package. Regression analyses were used to study the relationship between LTP and paired-pulse variables (Student’s t test). The power spectrum of the hippocampal field activity during individual recording sessions was computed, using the fast Fourier transform with a Hanning window, expressed as relative power and averaged for each session. This average was analyzed and compared using the wide-band model, considering the theta band between 3.1 and 9 Hz (Múnera et al., 2000
). Unless otherwise indicated, data are represented as the mean ± SEM. Acquired data were analyzed using a two-way ANOVA, with days as repeated measure. Contrast analysis was added for a further study of significant differences.
Stability of fEPSPs and EMG Recordings in Chronically-Implanted Alert Behaving Mice
As described in detail in previous reports from our group (Gruart et al., 2006
; Madroñal et al., 2007
), the chronic implantation of stimulating and recording electrodes in the hippocampus of behaving mice enabled the evolution of fEPSPs evoked in the CA1 area by the electrical stimulation of the ipsilateral Schaffer collateral/commissural pathway to be followed for >30 days (Figures 1
A,D). Recording electrodes were preferentially aimed at the apical dendrites of pyramidal CA1 cells (Figures 2 and 3
; Gruart et al., 2006
; Schwartzkroin, 1986
). The final location of recording and stimulating electrodes was checked histologically at the end of the experiments (Figures 1
B,C). With this chronic preparation, single and/or paired stimulation of Schaffer collaterals disrupted the ongoing theta rhythm for a brief (≈200 ms) period of time (Figure 1
D). The slope of fEPSPs evoked at the CA3-CA1 synapse by single or paired pulses presented up to 100 times per day with intervals >30 ms remained stable (<12.5% of variability, n = 10 animals) across time (up to 35 days), with no statistical tendency toward a sustained increase or decrease (P = 0.67; de Jonge and Racine, 1985
; Madroñal et al., 2007
).
In parallel with recording the acquisition of hippocampal fEPSPs, we recorded the EMG activity of the upper lid. Implanted stimulating and recording electrodes did not disturb eyelid kinematics, and allowed the normal generation of spontaneous, reflexively evoked and classically conditioned eyelid responses. As illustrated in Figure 1
D, eyelid CRs were easily distinguished from the background noise in EMG records, and were quantified following criteria described previously (Gruart et al., 2006
; Porras-García et al., 2005
).
To avoid any possible interference with the animal’s state of alertness (Bramham and Srebro, 1989
), habituation, conditioning, and extinction sessions lasted for ≈25 min and were carried out at the same hour every day for the same animal. No particular change in the behavioral state of experimental animals was observed across the successive sessions. A fast Fourier analysis of hippocampal field recordings across the successive conditioning and LTP-recording sessions did not indicate any significant (P ≥ 0.13; variability ≤13%) change in the relative spectral power of the theta band. Power spectra were computed from samples not including any stimulation to Schaffer collaterals. Múnera et al. (2001)
have reported in behaving cats a switch in spectral power from the theta to the beta bands during the CS-US interval. Unfortunately, the EEG period could not be analyzed here because of the presence of paired-pulse artefacts.
Input/Output Relationships at the CA3-CA1 Synapse
In a first series of experiments, we studied the changes in the slope of fEPSPs evoked at the CA1 area by paired-pulse (40 ms inter-stimulus interval) stimulation of Schaffer collaterals. As illustrated in Figure 2
B for a representative animal, the slope of fEPSPs (in mV/s) evoked in the CA1 area by the 1st pulse increased steadily with current strength until reaching asymptotic values. In contrast, fEPSPs evoked by the 2nd pulse increased more-or-less in parallel with the fEPSPs evoked by the 1st pulse (but with larger values) until a certain stimulus intensity, after which the fEPSP slopes evoked by the 2nd pulse were significantly smaller than those evoked by the 1st [F(14,56) = 857.195; P < 0.001 for asterisks illustrated in Figure 2
B]. Interestingly, the added value of fEPSP slopes evoked by the 1st and 2nd pulses (1st + 2nd, white circles, Figure 2
B) still presented a sigmoid-like shape. Similar displays were obtained for data collected from 10 animals (Figure 2
C) – namely, the PPF evoked at low stimulus intensities (<0.15 mA) was transformed into a PPD in response to higher stimulus intensities (>0.15 mA). Even after averaging data collected from different animals (n = 10), it was still possible to detect significant differences [F(14,126) = 38.667; P < 0.001 for asterisks illustrated in Figure 2
C] for the responses collected at lower (i.e., PPF) or higher (i.e., PPD) intensities. In fact, the 2nd/1st paired-pulse ratio decreased progressively from facilitation to depression with an inflexion point at ≈0.15 mA (see red circles and arrow in Figure 2
D). These data suggested that, at a given time interval, the facilitation evoked by paired-pulse stimulation can be easily transformed into depression by an increase in stimulus intensity.
PPF and PPD at the CA3-CA1 Synapse
In Figure 3
is illustrated the result of checking the effect of two sets of stimulus intensities (<40 or >60% of the intensity necessary for evoking a maximum fEPSP response). As shown in Figure 3
B, stimulus <40% evoked PPF at different inter-stimulus intervals [10, 20, 40, and 100 ms; F(10,90) = 6.213; P < 0.001]. Peak facilitation (>250%) was observed at an inter-stimulus interval of 40 ms. In contrast, stimulus at >60% evoked PPD at 20 and 40 ms inter-stimulus intervals (P < 0.05); in this case, peak depression (<50%) was also observed at an inter-stimulus interval of 40 ms.
In a second series of experiments, we checked the effects of paired-pulse stimulation at increasing intensities (0.02–0.3 mA) for a wide range of inter-stimulus intervals (5, 10, 20, 40, 80, 160, 320, and 640 ms). As illustrated in Figure 4
, the CA3-CA1 synapse presented a definite pattern of facilitation and depression to paired-pulse stimulation. Thus, PPF was generated by low-intensity stimulus (0.08–0.16 mA) and at 10–40 ms inter-stimulus intervals (Friedman ANOVA on ranks, P ≤ 0.05). In contrast, PPD was evoked by stimuli of short inter-pulse intervals (10 ms) at middle range intensities (0.12–0.2 mA; P ≤ 0.05) and at higher intensities (>0.26 mA) for a wider range of inter-stimulus intervals (10–100 ms; P ≤ 0.05). These results suggest that in relation to neurotransmitter release at the CA3-CA1 synapse, the putative interactions of action potentials arriving at CA3 axon terminals have to be determined using a wide range of inter-stimulus intervals and of stimulus intensities. Furthermore, paired-pulse facilitation is just one facet of a more general homeostatic phenomenon determining the synaptic response to a second afferent volley dependent on the characteristics of a first, both in time interval and in strength.
Interactions Between PPF and LTP Evoked at the CA3-CA1 Synapse in Behaving Mice
Paired-pulse stimulation is a form of short-term synaptic modulation frequently used as an indirect measurement of changes in the probability of release of neurotransmitter at the presynaptic terminal (Fernández de Sevilla et al., 2002
; Lauri et al., 2007
; Thomson, 2000
; Zucker, 1989
; Zucker and Regehr, 2002
). In this regard, the presynaptic component of long-term plasticity could modify the PPF (or PPD) ratio because both processes affect the mechanism of transmitter release (Andreescu et al., 2007
). Hence, any change in the response evoked by the 2nd stimulus in relation to the 1st will be indicative of a presynaptic action (Thomson, 2000
). In contrast, the post-synaptic form of the LTP will not affect the PPF ratio, because those changes are assumed to take place at the post-synaptic site (Andreescu et al., 2007
; Thomson, 2000
; Zucker and Regehr, 2002
). Therefore, we decided to perform a series of experiments to follow the evolution of LTP potentiation evoked at the CA3-CA1 synapse by HFS of presynaptic Schaffer collaterals, but presenting a double pulse at a fixed interval of 40 ms. In this situation, the intensity of the pairs of pulses was set to allow a significant facilitation of the fEPSP slope evoked by the 2nd pulse in relation to the 1st (Figure 5
). The PPF ratio was determined by the equation (2nd/1st) × 100. This ratio was computed across LTP evolution for 12 days (Figure 5
B) or 33 days (Figure 5
D).
As shown in Figure 5
A, HFS trains were presented for two successive days in 10 successful animals. Stimulus intensity was set at 35% of the intensity necessary for evoking a maximum fEPSP response. In this situation we were able to evoke a noticeable PPF during baseline records (172.9%, Figure 5
A). The first HFS session produced an increase (180% measured 15 min after HFS) in the fEPSP evoked by the 1st pulse that was further increased by the second HFS session (230% 15 min after HFS). On the whole, the LTP evoked by the two HFS sessions was significantly larger than fEPSP baseline values for up to 6 days [F(12,108) = 0.359, P ≤ 0.01]. In contrast, the fEPSP evoked by the 2nd pulse was slightly shorter (154% after the first HFS and 202% after the second). Moreover, the LTP evoked by the 2nd pulse was significantly larger than baseline values for 4 days only (P ≤ 0.01).
Although the slope of fEPSPs evoked by the 2nd pulse with respect to the 1st was significantly larger across the 12 days of recordings [F(12,108) = 13.463, P ≤ 0.001], there were noticeable changes in PPF after the presentation of the two HFS sessions (Figure 5
A). Giving a value of 100% to fEPSPs evoked by the 1st pulse (white triangle, Figure 5
A), the PPF evoked by the 2nd pulse (black triangle, Figure 5
A) during baseline records was 172.9% (red circle, Figure 5
B). This facilitation was reduced from 172.3 to 118.9% when measured 15 min after the first HFS session. Following HFS sessions, the PPF ratio increased steadily across the 12 days of recordings with a low slope (≈2.75%/recording day; r = 0.85; P < 0.01; red circles and regression line; Figure 5
B). Thus, the paired-pulse facilitation recorded during the last session (151.3%) was still significantly smaller (P < 0.05) than the facilitation observed during baseline records (172.9%).
In Figure 5
C is illustrated an experiment similar to that shown in Figure 5
A, but with the stimulus intensity set at 45% of the amount necessary for reaching an asymptotic value. To avoid an over-stimulation (Volianskis and Jensen, 2003
; Zucker and Regehr, 2002
) of the experimental animals included in this group (n = 10), recording tests after the two HFS sessions were repeated every 6 days. This stimulus intensity evoked a smaller PPF (156.7%) than that evoked by paired-pulses set at 35% of peak fEPSP values (Figure 5
A). We also recorded in this case the evolution of the LTP evoked by two HFS sessions for up to 33 days. As a consequence of using a higher intensity, the LTP evoked by the 1st pulse lasted longer [up to 9 days; F(8,72) = 1.009; P ≤ 0.01; Figure 5
C] than in the previous experiment (6 days, Figure 5
A). As already described for the experiment illustrated in Figure 5
A, the LTP evoked by the 2nd stimulus was of a shorter duration (<9 days) than that evoked by the 1st [F(8,72) = 1.009; P < 0.01 when the 3rd recording day was computed; Figure 5
C].
In this case, the two HFS sessions reduced the PPF evoked during baseline records (Figure 5
D, red circles and regression line). The PPF was further reduced following the second HFS session (to 76.9% of values collected for baseline records). Following HFS sessions, the PPF ratio increased steadily across the 33 days of recordings with a lower slope (2.3%/recording day; r = 0.86; P < 0.01) than data illustrated in Figure 5
B, an effect that was ascribed to the stronger intensities used in this case for the two HFS sessions. However, the paired-pulse facilitation recorded during the last session was slightly larger than (167.6%), but not significantly different (P = 0.456) from, that observed during baseline recordings (156.8%).
Changes in PPF as a Function of LTP Evoked at CA1 Pyramidal Cells by HFS Stimulation of Schaffer Collaterals
We decided to further analyze the changes in PPF as a function of LTP evoked by a single HFS session applied to Schaffer collaterals ipsilateral to pyramidal CA1 cells. In this case, LTP magnitude (expressed as fEPSP increase as compared with baseline values) was determined 30 min after the end of the HFS session. As illustrated in Figure 6
, there was an inverse relationship (slope = −0.34; r = 0.72; P < 0.001) between LTP magnitude and the decrease of the PPF evoked by the HFS session. This result suggests that LTP magnitude interferes with PPF evoked at the CA3-CA1 synapse in alert behaving mice (n = 60 animals for this experiment).
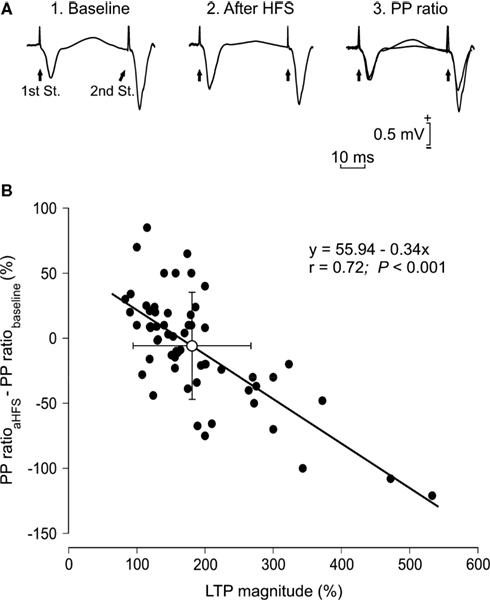
Figure 6. Changes in PPF as a function of LTP evoked in CA1 pyramidal cells by HFS stimulation of Schaffer collaterals. (A) Representative examples (averaged three times) of fEPSPs evoked at the CA3-CA1 synapse by paired-pulse stimulation (40 ms interval) prior to (1. Baseline) and after (2. After HFS) HFS of Schaffer collaterals. The different facilitation evoked before and after HFS is noticed adjusting the fEPSP evoked by the 1st pulse (3. PP ratio). (B) A plot of LTP magnitude [determined as the increase (in percentage) of the 1st pulse after the HFS session with respect to baseline value] against the difference between PPF after HFS minus PPF during baseline recordings (PPaHFS − PPbaseline, in %). PPaHFS values were collected 15 min after HFS trains. Each black circle corresponds to a different animal (n = 60). The white circle indicates the mean value ± SD of the illustrated data for the two (x, y) axes. The presence of negative values on the Y axis indicates that the PPF after HFS reached values lower than for baseline records.
At variance with what has been described previously (Schulz et al., 1994
), no significant relationship (r = 0.14; P = 0.231; n = 60 animals) could be established between the magnitude of the PPF evoked in baseline records and the decrease in facilitation (i.e., the difference between PPF after HFS minus PPF during baseline recordings) observed after HFS sessions (not illustrated). This negative result further reinforced the assumption that changes (i.e., the decrease) in PPF observed after HFS were related exclusively to the amount of evoked LTP.
Evolution of CA3-CA1 Synaptic Field Potentials Across Associative Learning
In an additional set of experiments, we did the classical conditioning of eyelid responses in alert behaving mice (n = 10 animals; Figure 7
C). Animals were classically conditioned using a trace (CS, tone; US, shock) paradigm (Figure 1
D). The time interval between the end of the CS and the beginning of the US was 500 ms. The experimental design included the presentation of a pair of pulses (40 ms interval) to Schaffer collaterals 300 ms after CS presentation. Stimulus intensity was set at 40% of the amount necessary to evoke a maximum fEPSP response (Figure 7
A). As a control, we also carried out a similar experiment with pseudoconditioned (n = 10) animals (Figures 7
D,E).
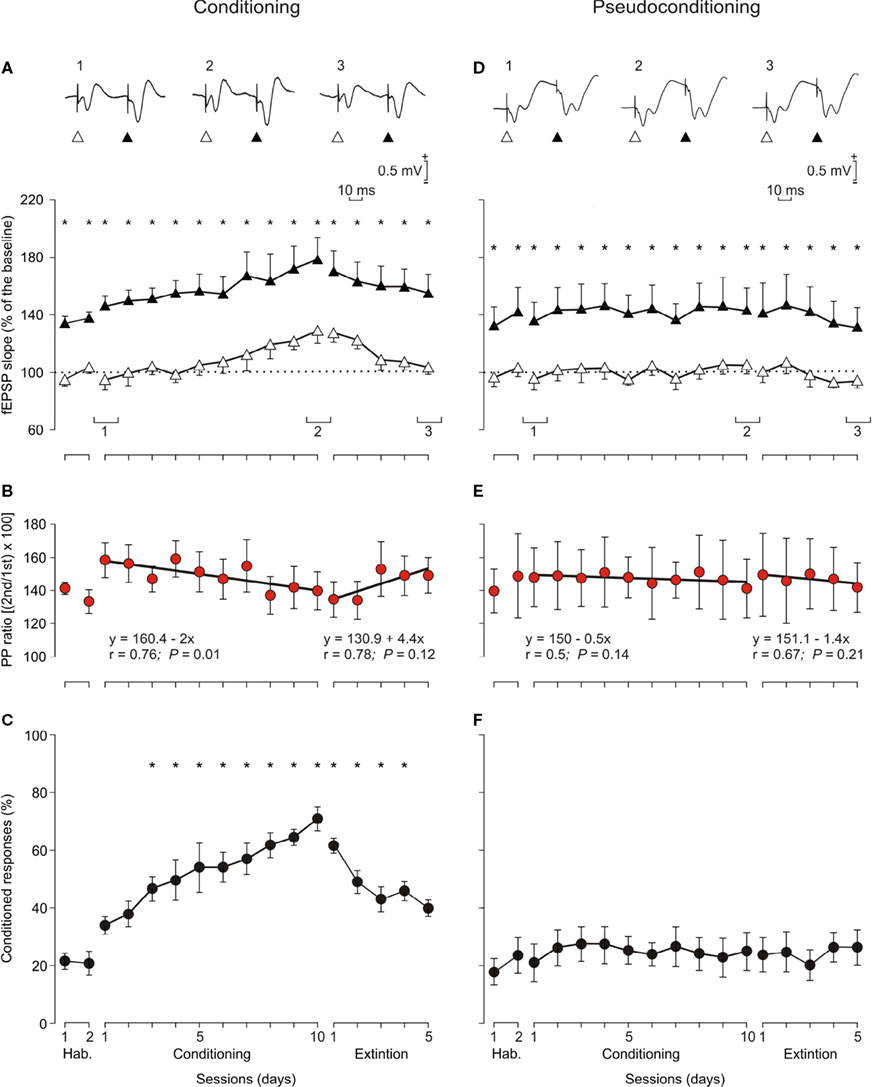
Figure 7. Learning curves and evolution of fEPSPs evoked by paired-pulse stimulation across the classical conditioning of eyelid responses. (A) Evolution of fEPSPs evoked in the CA1 area by a pair of pulses (1st, white triangles; 2nd, black triangles) at 40 ms interval presented to Schaffer collaterals 300 ms after CS presentation. Illustrated data correspond to mean ± SEM. *P < 0.001, [F(16,144) = 41.443] for significant differences between the 1st and the 2nd pulses. At the top are illustrated some representative examples (averaged three times) of fEPSPs evoked at the CA3-CA1 synapse by paired-pulse stimulation (40 ms interval) collected during the 1st (1) and 10th (2) conditioning sessions and during the 5th (3) extinction session from a conditioned animal. (B) Note that although fEPSPs slopes increased across conditioning and decreased across extinction for both 1st and 2nd pulses (A), their relationship [PP ratio (2nd/1st) × 100; red circles] decreased steadily across training and increased (although not significantly) during extinction sessions. Linear regression analyses of PP ratios are indicated for the two sets of data. (C) Learning curves collected from the same set of animals (n = 10). *P < 0.001, [F(16,144) = 12.46] for significant differences between habituation and conditioning and extinction sessions. (D–F) Similar sets of data collected from pseudoconditioned animals (n = 10). No significant changes where observed for fEPSP slopes (D) [F(16,144) = 0.52; P = 0.93*] and percentage of conditioned responses (F); [F(16,144) = 0.37, P = 0.99] across the successive pseudoconditioning trials.
In Figure 1
D are illustrated single records of the EMG activity of the orbicularis oculi muscle and of the fEPSP evoked in a well-trained animal during the 9th conditioning session. All of the animals presented normal eyelid reflex responses to US presentations. As quantified in Figure 7
C, the learning curve presented by the 10 conditioned animals was similar to that in previous descriptions in mice, using trace conditioning procedures (Domínguez-del-Toro et al., 2004
; Gruart et al., 2006
; Takatsuki et al., 2003
). Mice presented a mean of 36.3 ± 4% CRs during the 1st conditioning session, and reached asymptotic values (>60% of CRs) from the 7th session onward. The number of CRs evoked during conditioning was significantly larger than during the two habituation sessions from the 3rd to the 10th conditioning sessions, as well as during the 1st to the 4th extinction sessions [F(16,144) = 12.460; P ≤ 0.01; Figure 7
C]. The mean percentage of CRs collected for control animals was significantly larger [F(16,144) = 5.34; P < 0.001] for the 10 conditioning sessions compared with values reached by the pseudoconditioned group (n = 10, Figures 7
C,F).
The two (1st and 2nd) fEPSPs evoked in the pyramidal CA1 area by the paired-stimulation of the ipsilateral Schaffer collaterals increased progressively in slope (taking the slope of fEPSPs collected during the two habituation sessions as 100% for the 1st pulse and 140% for the 2nd) across conditioning sessions, to a maximum of ≈125% for the 1st pulse and ≈175% for the 2nd during the 10th session (Figure 7
A). During extinction, the fEPSP slopes decreased to a minimum of 102% for the 1st pulse and 145% for the 2nd pulse during the 5th extinction session (Figure 7
A).
Although changes in the slopes of fEPSPs evoked by the 1st and the 2nd pulses presented to the Schaffer collaterals during habituation, conditioning, and extinction sessions seemed to run in parallel at significantly different values [F(16,144) = 41.443; P < 0.001; see asterisks in Figure 7
A], the PPF ratio decreased during conditioning sessions and increased during extinction ones (Figure 7
B). Thus, the PPF ratio during the 1st conditioning session was 150% (i.e., some 10% larger than during habituation sessions), but decreased to 135% during the 10th conditioning session (2%/recording day; r = 0.76; P = 0.01), while it increased from 130% during the 1st extinction session to 146.6% during the 5th extinction session (4.4%/recording session; r = 0.78; P = 0.12). In contrast, no significant changes (r ≥ 0.67; P ≤ 0.14) were observed in fEPSPs evoked by the 1st and the 2nd pulses presented to the Schaffer collaterals across conditioning sessions in pseudoconditioned animals (see Figures 7
D,E).
In accordance to the above results, the progressive facilitation of the fEPSPs evoked by the 1st pulse across conditioning (Gruart et al., 2006
; Madroñal et al., 2007
; Whitlock et al., 2006
) is balanced by a disfacilitation or slight depression of fEPSPs evoked by the 2nd pulse. As a whole, the PPF ratio decreased steadily across conditioning sessions at a rate of 2%/conditioning day (Figure 7
B). Those values were surprisingly similar to the rates of increase of the paired-pulse ratio following HFS sessions (2.75%/recording day for data illustrated in Figure 5
A and 2.3%/recording day for data illustrated in Figure 5
C), suggesting that a similar presynaptic mechanism is involved in both processes, but running in opposite directions: decreasing during classical conditioning and increasing during LTP decay. Although changes in PPF ratio during extinction sessions were not significant (linear regression analysis; r = 0.78; P ≤ 0.12), it can be suggested that the increase in paired-pulse ratio across extinction (4.4%/extinction session) is probably due to the progressive disfacilitation of fEPSPs evoked by the 1st pulse, compensated by a slight increase in the slope of the fEPSPs evoked by the 2nd pulse, as already reported for LTP evoked by HFS.
Following analytical procedures developed in a previous study (Gruart et al., 2006
), we confirmed that the CA3-CA1 synapses studied here were indeed involved in the associative learning task. For this, we checked the presence of linear relationships between fEPSP slopes and the percentage of CRs across training sessions. The slope of fEPSPs evoked at the CA3-CA1 synapse was linearly related (r ≥ 0.67; P ≤ 0.01) to the percentage of CRs during conditioning (slope = 0.61) and extinction (slope = 0.58) sessions, but not for habituation sessions.
Relationships Between PPF at the Beginning and end of LTP, Conditioning, and Extinction Sessions
Another way to address the above contentions was to represent values collected for PPF ratios [(2nd/1st) × 100] at the beginning of the LTP (i.e., just 15 min after the HFS session) against the corresponding values recorded 24 h later. As illustrated in Figure 8
A, data collected from 60 animals indicated that paired-pulse ratios were larger (49/60; i.e., 81.7%) 24 h after HFS than immediately (15 min) after it. Values collected for PPF ratios during conditioning sessions presented the opposite trend – PPF ratios were larger for the 1st conditioning session than during the 9th (50/60; i.e., 83.3%; Figure 8
B). Finally, results collected for PPF ratios during extinction were similar to those collected during LTP. In fact, PPF ratios were larger (52/60; i.e., 86.7%) during the 4th extinction session than the corresponding values collected during the 9th conditioning session (Figure 8
C). These data clearly indicate the similarity between LTP and the extinction process, and the different pattern followed during conditioning, as determined by the evolution of the PPF ratio.
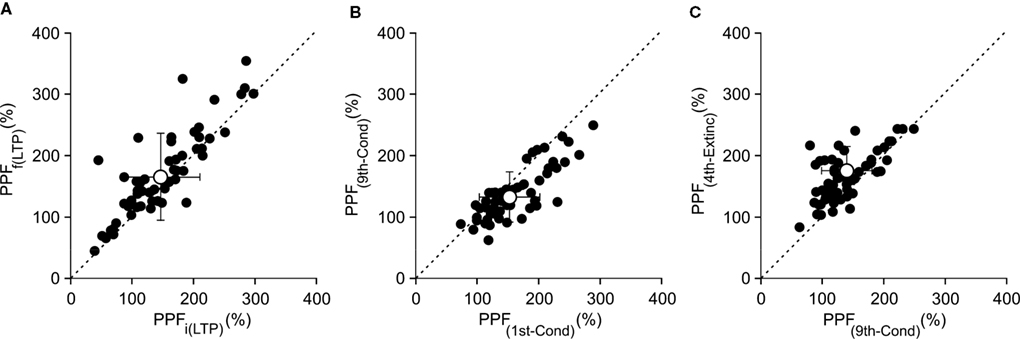
Figure 8. Relationships between PPF at the beginning and end of LTP, conditioning and extinction sessions. (A) A plot of PPF, computed 15 min after the HFS session [PPFi(LTP)], against PPF, computed 24 h following HFS trains [PPFf(LTP)]. Note that most PPFf(LTP) values were larger than those collected for PPFi(LTP). (B) A similar plot relating PPF computed during the 1st conditioning session [PPF(1st-Cond)] against that during the 9th [PPF(9th-Cond)]. Note that in this case most PPF(1st-Cond) values were smaller than those from the 9th conditioning session [PPF(9th-Cond)]. (C) A plot relating PPF quantified during the 9th conditioning session [PPF(9th-Cond)] versus the same set of data collected from the 4th extinction session [PPF(4th-Extinc)]. Note that values collected for extinction sessions were similar to those collected during LTP sessions. For data included in (A–C), each black circle corresponds to a different animal (n = 60). The white circles indicate mean values ± SD of the illustrated data for the two (x, y) axes. Note that mean values are located to the right of the dotted lines (slope = 1) for (A) and (C), and to the left for (B).
We have shown here that both LTP evoked in pyramidal CA1 cells by HFS of Schaffer collaterals, and synaptic changes taking place at the CA3-CA1 synapse during associative learning, are able to modify the short-term modulation evoked by paired-pulse stimulation of the same synaptic site. Importantly, there were some differences in the way LTP and learning-dependent synaptic changes affected paired-pulse modulation. Thus, LTP evoked an early decrease in PPF, which recovered very slowly (at a rate of 2.3–2.7%/recording day) afterwards; in fact, full recovery of the initial PPF was not observed until >20 days after HFS. In contrast, the PPF ratio was increased at the beginning of conditioning, and decreased slowly (at a rate of 2%/training day) across the successive sessions. Our interpretation of these results is that LTP evoked an initial (both pre- and post-synaptic) facilitation of the CA3-CA1 synapse to a first afferent volley that was compensated by a smaller response to a subsequent arrival of action potentials. This balancing mechanism decreased PPF initially, and it was followed by a slow recovering process. The opposite phenomenon took place during conditioning – namely, the arrival of a first set of inputs was facilitated during the learning process, being compensated by a minor response to a second afferent volley. According to this balancing or homeostatic mechanism, LTP was more similar to the process of extinction than to that of acquisition. Nevertheless, the latter suggestion was not supported by the experimental results, since PPF evolution during the extinction process did not reach significant values. On the other hand, interaction of LTP and of activity-dependent synaptic changes in strength during associative learning with PPF suggests a homeostatic role of this form of short-term plasticity.
Interaction Between LTP and PPF and PPD
Early in vitro studies carried out on hippocampal slices have reported that HFS is able to modify short-term potentiation processes, including PPF, suggesting a definite involvement of presynaptic mechanisms in the generation and maintenance of early (<1 h) and late (>1 h) LTP (Sokolov et al., 1998
), a proposal that has been confirmed (Isaki et al., 2003
; Lauri et al., 2007
; Volianskis and Jensen, 2003
) or refuted (Manabe et al., 1993
; McNaughton, 1982
; Schulz and Fitzgibbons, 1997
) in previous and/or subsequent studies. Apparently, PPF can also be modified by post-synaptic changes evoked by HFS (Moult et al., 2006
). In most of these studies, alterations in paired-pulse ratio were monitored up to a few hours after HFS, and no information could be provided by later changes. In the present study, we have followed the evolution of paired-pulse modulation up to 33 days after tetanic stimulation of Schaffer collaterals, providing a complete picture of changes in short-term potentiation and depression evoked by HFS sessions. According to our results, HFS evoked an initial decrease in PPF that was slowly recovered in successive days. The fact that short-term plasticity in hippocampal synapses is temperature-dependent (Klyachko and Stevens, 2006a
) stresses the need for carrying out these types of study in alert behaving animals.
A Putative Reinterpretation of the Roles of PPF and/or PPD
As shown here in alert behaving mice, paired-pulse modulation of the CA3-CA1 synapse checked at different intensities and inter-stimulus intervals offers a unique pattern of short-term facilitation or depression responses. In this regard, it would be very interesting to test the same three-dimensional study of the different synapses involved in the hippocampal circuit to determine the specific modulation of pairs of stimuli arriving at each synaptic relay, depending on their strength and inter-pulse interval. Classically, it has been assumed that PPF is a form of short-term synaptic plasticity (Markram and Tsodyks, 1996
; Thomson, 2000
; Zucker, 1989
; Zucker and Regehr, 2002
). However, the presence of paired-pulse depression at selected intensities and time intervals and the opposite effects of paired-pulse stimulation during the acquisition of an associative learning task on the one hand, and during LTP and the extinction process of the same associative learning on the other, allow suggesting a different (i.e., homeostatic) role for this type of short-term modulation of synaptic strength (Turrigiano and Nelson, 2004
). Thus, this short-term synaptic plasticity will help to determine the firing properties of hippocampal networks in relation to the number of afferent axons firing simultaneously in a given moment and to their firing rate (Turrigiano and Nelson, 2004
), and will act as a filter on the trains of spikes arriving at the presynaptic terminal (Fortune and Rose, 2001
; Klyachko and Stevens, 2006b
). Indeed, the filtering properties of a given synapse can be modified by modulating the probability of neurotransmitter release (Abbot and Regehr, 2004
; Citri and Malenka, 2008
). In this regard, short-term synaptic plasticity can play a balancing, homeostatic role (Turrigiano and Nelson, 2004
). Examples of postsynaptic mechanisms regulating synaptic excitability have also been reported recently (Fan et al., 2005
).
It should be kept in mind that understanding the many different types of synaptic dynamics when interpreting fEPSPs recorded in behaving animals is extremely difficult, and many other interpretations are still possible (Citri and Malenka, 2008
; Melamed et al., 2004
, 2008
). For example, different di- and poly-synaptic effects, evoked by the direct stimulation of Schaffer collaterals, could be involved in the modulation of presynaptic mechanisms. For these reasons, our interpretations of collected results are as parsimonious as possible, and are open to new experimental approaches in behaving animals.
Different Mechanisms involved in the Presynaptic Modulation of the CA3-CA1 Synapse
The involvement of PPF and PPD in homeostatic processes related to synaptic balance and stabilization of cell firing requires the presence of presynaptic regulatory mechanisms (Becker et al., 2008
). According to the residual calcium hypothesis (Katz and Miledi, 1968
), calcium entry during the first spike causes facilitation whether or not transmitter is released (Thomson, 2000
). In contrast, paired-pulse depression seems to be due to a reduction in the number of available transmitter quanta at presynaptic sites (Del Castillo and Katz, 1954
; Thomson, 2000
). Other presynaptic mechanisms interfering with vesicle release are changes in action potential duration, modulation of presynaptic calcium channels, inactivation of calcium currents, etc. (Saviane et al., 2002
; Zucker and Regehr, 2002
). Moreover, different types of presynaptic receptors (adenosine A1 and A2A, cannabinoid CB1, muscarinic and nicotinic cholinergic, GABAA and GABAB, metabotropic glutamate, TrkB, etc.) are able to exert specific excitatory or inhibitory effects on transmitter release (Chevaleyre et al., 2007
; Diogenes et al., 2004
; Fernández de Sevilla et al., 2002
; Lagostena et al., 2008
; Zakharenko et al., 2002
; Zucker and Regehr, 2002
). The elaborate organization of interneuronal circuits acting presynaptically on the CA3-CA1 synapse can surely support the complex regulation of this form of short-term modulation of synaptic strength, making possible its homeostatic role in synaptic stability (Fortune and Rose, 2001
; Klyachko and Stevens, 2006b
; Turrigiano and Nelson, 2004
).
Differences Between LTP Evoked by HFS and Activity-Dependent Synaptic Changes in Strength During Associative Learning
The generation of eyelid CRs is a slow process requiring a large number (<500) of paired CS-US presentations, as already described for mice, rats, rabbits, and cats (Domínguez-del-Toro et al., 2004
; Gruart et al., 1995
, 2000
, 2006
; Takatsuki et al., 2003
; Thompson, 1988
; Valenzuela-Harrington et al., 2007
; Woody, 1986
). Moreover, CRs present a characteristic ramp-like pattern for eyelid downward displacement and a long latency (>50 ms) from CS onset, as well as a quantum-by-quantum increase in amplitude and duration (Domingo et al., 1997
). All these procedural and kinetic characteristics suggest that the neural processes underlying the generation of CRs are not directly related to LTP (or to long-term depression) mechanisms, by which an almost immediate acquisition of the learned response is expected (Bliss and Collingridge, 1993
; Ito, 1989
). Indeed, the motor output expected from associative learning is not a sharp, sustained increase in neuronal firing of a pool of related neural centers, but a distributed and limited increase in the number of neurons recruited to respond to an initially irrelevant sensory stimulus – i.e., the CS (Woody, 1986
).
Experimental in vitro and in vivo procedures to evoke LTP assume a strong activation of involved synaptic contacts (Bliss and Gardner-Medwin, 1973
; Bliss and Lømo, 1973
), but LTP has the property of associability, indicating that a weak input can still be potentiated if activated simultaneously to (or within a given time window of) a strong stimulus evoked through a separate but convergent input (Bliss and Collingridge, 1993
; McNaughton et al., 1978
). It is feasible to suggest that the potentiation process observed at the CA1-CA3 synapse during classical conditioning of eyelid responses is a physiological resemblance of the LTP mechanism evoked experimentally both in vitro and in vivo with cruder procedures – but with important differences. It has been shown recently that the experimental induction of LTP at different stages of conditioning disturbs the acquisition (or extinction) process (Gruart et al., 2006
; Madroñal et al., 2007
). Moreover, changes in synaptic strength evoked by the learning process are able to interfere with LTP induced subsequently by HFS of the involved neural circuits (Whitlock et al., 2006
). The present results offer a new conceptual approach to the understanding of the similarity and differences between LTP and activity-dependent synaptic modifications in strength. Thus, during LTP there is a steady decrease in the synaptic effects of a first volley arriving at the CA3-CA1 synapse which is progressively compensated by an increase in the response to a second pulse arriving in an optimal time interval. Significantly, this slow adaptive process takes place in an opposite way during the acquisition of associative learning – i.e., the CA3-CA1 synaptic response to a first afferent volley increases progressively with training, with a compensatory decrease in the response to a second set of action potentials. As shown here, the short-term modulation of synaptic processes during LTP is more similar to that taking place during extinction than to that characterizing the acquisition process.
It has been reported recently (Madroñal et al., 2007
) that when LTP is evoked prior to conditioning, animals are unable to acquire eyelid CRs if the training starts <8 days after LTP disappearance – that is, the LTP test is insensitive to some HFS effects remaining after LTP disappearance. In this regard, changes in paired-pulse modulation are more indicative of synaptic adaptation following HFS. Apparently, associative learning is not possible in behaving mice until there is a complete recovery of synaptic homeostasis after single or repeated HFS sessions. Consequently, paired-pulse modulation could be used as an index of use-dependent synaptic changes taking place at selected hippocampal synapses.
The authors have declared that no competing interests exist.
Work supported by grants from the Spanish Ministry of Education and Research (BFU2005-01024 and BFU2005-02512), Spanish Junta de Andalucía (BIO-122 and CVI-02487), and the Fundación Conocimiento y Cultura of the Pablo de Olavide University (Seville, Spain). The funders had no role in study design, data collection and analysis, decision to publish, or preparation of the manuscript. We thank Ms María Esteban for her contribution to data acquisition and analysis and Mr Roger Churchill for his editorial help.
Domínguez-del-Toro, E., Rodríguez-Moreno, A., Porras-García, E., Sánchez-Campusano, R., Blanchard, V., Lavilla, M., Böhme, G. A., Benavides, J., and Delgado-García, J. M. (2004). An in vitro and in vivo study of early deficits in associative learning in transgenic mice that over-express a mutant form of human APP associated with Alzheimer’s disease. Eur. J. Neurosci. 20, 1945–1952.