 Christian E. Vazquez
 Bethany Wood
 Swasati Handique1
 Zenong Yin
- 1School of Social Work, The University of Texas at Arlington, Arlington, TX, United States
- 2Department of Epidemiology and Public Health, School of Medicine, University of Maryland, Baltimore, MD, United States
- 3Department of Public Health, The University of Texas at San Antonio, San Antonio, TX, United States
- 4Center for Health Equity, University of Colorado Anschutz Medical Campus, Aurora, CO, United States
Background: The Childhood Opportunity Index (COI) is a relatively new measure for assessing opportunity across education, health and environment, and socio-economic context. Research indicates that higher COI is associated with lower obesity risk; however, existing research offers no evidence for differences, or lack thereof, across racial/ethnic groups. The larger body of research on the relationship between neighborhood environments and obesity risk among Hispanic children with low-income between 5 and 11-year-olds is limited. The study aims to further explore the relationship between neighborhood opportunities, measured by the COI, and children's body mass index z-scores (BMIz), adjusted for age and sex.
Materials and methods: The data are from a sample of Hispanic child-parent dyads (n = 253) who participated in a 1-year family lifestyle intervention. A linear mixed-effects model was fitted, with BMIz as the dependent variable, COI categorized into four levels, time, parent BMI, family income, adult education, child age, child sex, calories, language spoken in the household, physical activity, group condition, and a time*group condition interaction. Predicted probabilities were also produced.
Results: After adjusting for covariates, children in the second (β = −.15, 95% CI = −0.27, −0.03), third (β = −.19, 95% CI = −0.31, −0.06), and fourth (β = −.15, 95% CI = −0.28, −0.02) quartiles of the COI quartiles had significantly lower BMIz compared to those in the first (lowest) COI quartile. Predicted probabilities show the different predictive margins of BMIz at each time point for each quartile compared to the first quartile.
Conclusions: All the higher COI levels were linked to healthier weight status compared to the lowest COI level, though the pattern was not linear for any of the observed associations. Further investigation into the impact of different COI levels may be warranted to assess each quartile's impact against each other, which was outside the scope of the current study. Results also provide evidence for potentially strengthening intervention supports for those at the lowest COI level, respective to those from all other COI levels.
Introduction
Childhood obesity remains a significant public health challenge in the United States (U.S.). Hispanic youth aged 2–19 years exhibit a higher obesity prevalence (26.2%) compared to non-Hispanic White (16.6%), non-Hispanic Black (24.8%), and non-Hispanic Asian youth (9.0%) (1). These rates underscore the disparities in obesity prevalent among different racial/ethnic groups, with Hispanic and Black children bearing a disproportionate burden. Hispanic and Black families are more likely to live in disadvantaged obesogenic neighborhoods with increased risk for early onset of obesity compared to their White peers (2, 3). Hispanic children in south Texas have the highest rates of childhood obesity among all their peers and greatly exceed national averages (4). Prior studies have found household characteristics and social environment factors significantly influence the body mass index (BMI) of Hispanic children (5); though, the research on the relationship between neighborhood environments and obesity risk among low-income Hispanic children between 5 and 11-years-old is limited (6). The combination of this evidence, or lack thereof, warrants further study on the relationship between neighborhood opportunities for healthy development and childhood obesity among Hispanic children. The current study focuses on further understanding how neighborhood opportunities, via the Child Opportunity Index (COI), are related to childhood BMI among Hispanic children who participated in a family lifestyle intervention over 1 year.
In the U.S., several factors are generally associated with obesity in youth. For example, school-aged boys have a higher obesity rate (20.4%) than girls (16.3%) (7). Dietary habits (8), sedentary behavior (9, 10), parental education level (11), and low socioeconomic status (SES) (7) are all also related to the higher prevalence of obesity among Hispanic children. Parental weight status is also related to childhood obesity (12). Along with this, cultural factors too play a role, such as Hispanic parents underestimating their child's weight status, not believing it is a problem, or being adverse to healthy behaviors including physical activity (13–16).
Existing literature on childhood obesity primarily relies on cross-sectional individual level data to establish associations between sociodemographic factors and behaviors (17). The sparse literature using neighborhood level data provides some insights for the current study. Studies have shown that residing in high-poverty or high-crime neighborhoods is associated with an increased risk of high BMI or childhood obesity (18). Another study by Theall et al. (19) identified an association between neighborhood violent crime and negative outcomes for obesity-related outcomes like BMI, overweight/obesity, and waist circumference. Research has also found that broader factors such as higher average SES of a child's school is linked to lower BMIz, among pre-kindergarten students (20). Similarly, research shows that children from low-income communities exhibit lower levels of physical activity, poor dietary habits, with increased consumption of fried food and sugary beverages along with spending more time in sedentary activities (21). Finally, a meta-analysis of 58 randomized controlled trials (RCTs) in the US showed that interventions with a higher number of young children of racial/ethnic minority or lower socioeconomic status were less effective in lowering obesity measures signifying the influence of community context on the uptake of evidence-based obesity prevention strategies (22). All these factors are associated with higher BMI and obesity. The literature highlights the importance of assessing neighborhood factors that influence the level of protection against childhood obesity.
The COI is a publicly available cumulative indicator of the many positive and negative attributes of neighborhood conditions and resources that greatly influence healthy child development (23). The COI index is built using 44 indicators that span over three domains: education, health and environment, and socio-economic context and 14 sub-domains (24). The indicators are associated with children's health and economic outcomes. The COI is a multidimensional measure which incorporates data from the US Census Bureau's American Community Survey and other sources capturing inequities in distribution of opportunity across neighborhoods (23). The COI is unique from other census tract-based opportunity indices as it utilizes a wide range of novel negative factors such as exposure to toxic waste, school poverty, and supportive factors such as access to nutritious food and green spaces. Studies have linked high COI scores with decreased risk of acute care visits (25), asthma-related hospitalizations (26), and improved preventive care metrics in pediatric primary care (23). Additionally, research suggests associations between higher COI and lower risk of obesity and cardiometabolic risk in children (17). Aris et al. (17) found that exposure to a high COI score at birth significantly affects mean BMI and obesity risk compared to exposure at later life stages. The COI is a relatively newer index and evidence suggests it can be a valuable tool for identifying children at risk of progressing towards a trajectory of high BMI as it incorporates various neighborhood characteristics relevant to children's health. The current study focuses on the relationship between baseline COI and obesity over a 1-year period. Based on existing literature, it is expected that lower COI scores will be related to higher BMI; however, previous studies have not examined this with BMI over time and with an all-Hispanic sample of 5- to 11-year-olds. An additional justification for this study is that it is not clear if COI is related to BMI for Hispanic children in the same way as children in samples from other studies above. It may be the case that Hispanic children, particularly those in south Texas, who live in a neighborhood with others that share contextual factors (i.e., similar COI) may be protected against adverse effects on weight status (27, 28). This would result in no differences by COI. In addition to adding to the limited literature on COI, the current study adds rigor with the rich individual- and family-level control variables to more effectively isolate the community effect.
Materials and methods
Data
The current study is a secondary analysis of data extracted from a family-based obesity management study, "Health4Kids" (H4K), in Hispanic children ages 5–11 years and their parents (N = 253 dyads). Considering the strong cultural value of familism within Hispanic communities, where family takes central importance, family-focused obesity prevention strategies may be particularly effective (29). This randomized controlled trial aimed to examine the efficacy of “Health4Kids” (H4K), a family-focused intervention promoting healthy eating and physical activity for Hispanic children aged 5–11 years with overweight/obesity. The program utilized family-centered behavioral counseling, text messages, and newsletters to encourage healthier eating habits and increased physical activity among participants. The study was conducted in south-central Texas. The families were randomized into the standard care group (n = 128) or the H4K treatment group (n = 125). The participants completed assessments at baseline (n = 253), 1-month (n = 179), 6-month (n = 184), and 12-month (n = 153). Activities and assessments were available in Spanish and English both oral and written. More information about the design, data, IRB approval, and materials can be found elsewhere (NCT02343367).
Variables
In this paper, the dependent variable was child BMI z-score for age and sex (BMIz), a continuous variable measured at four time points (baseline, 1-month, 6-month, and 12-month). The primary independent variable was the COI measured at baseline. We use baseline COI because COI would not change over a 1-year period unless a family moved, and COI is only calculated by external researchers every 5 or so years. The COI ranges from 1 to 100 and is used as an indicator of the amount of opportunity that children have in their neighborhoods in their social and economic domains (30). The COI has been used in other studies as a predictor or covariate of child BMI (17). In the current study, the COI national adjusted z-score (COIz) is used. COIz, as a continuous variable, did not have a strong linear relationship with BMIz. The path was more of an upside-down checkmark as opposed to a straight line so it was divided into quartiles for the analyses to address the non-linearity problem. The four quartiles represent very low, low, high, and very high as has been used in previous studies (17). The study data and COI variable were linked via geocoding. The families represented 14 census tracts.
The following section provides a brief explanation for the inclusion of some of the control variables. Variables for child age, sex, physical activity, diet, and parent BMI, income, education were included as they are consistently associated with BMI differences in childhood (28, 31). Additionally, language spoken in the home was relevant given the sample are south Texan Hispanics where this is a high prevalence of Spanish speakers. Language spoken in the home has been included in several childhood obesity studies with mixed findings as language can be tied to acculturation, and can be both a protective or risk factor for healthy behaviors (32–34).
Other covariates considered in the analysis included time, a categorical variable representing the wave of data collection [0 = baseline, 1 = 1 month, 6 = 6 months, 12 = 12 months] and child age ranging from 5 to 11 years old, held fixed at baseline to avoid multicollinearity with time. Child demographics also included binary child sex [0 = female (reference), 1 = male], child time spent in moderate-to-vigorous physical activity (MVPA; minutes/day), a continuous variable using an ActiGraph triaxial accelerometer (GX3). Each participant wore the monitor for 7 days and 6 days of data were collected, accelerometer counts were recorded in 60-s time increments (35). Ranges were 0–5,725+, with inactivity (0–99 counts/min), light (100–759 counts/min), moderate-intensity lifestyle activities (760–5,724 counts/min), moderate-intensity walking activities (1,952–5,724 counts/min), and vigorous intensities (5,725 or more counts/min) (35). Additionally, the average daily calories for each child were measured using the Block Food Screeners for Ages 2–17, which included the average daily calories for each child as a continuous covariate (36). The validated screener was designed to be self-administered by children with the assistance of parent or caregiver, as needed.
Parental factors included parent BMI, a continuous variable, parent education, a categorical variable [0 = high school education or less (reference), 1 = some college, and 2 = four-year college degree or higher], and parent income, a categorical variable of income levels [0 = <$10,000 (reference), 1 = $10,001–$15,000, 2 = $15,001–$20,000, 3 = $20,001–$25,000, 4 = $25,001–$35,000, 5 = $35,001–$50,000, 6 = ≥$50,001, and 7 = Missing]. Spanish spoken at home was coded as a binary variable [0 = households speaking only English (reference), 1 = households where Spanish is spoken, either mixed with English or exclusively]. Finally, treatment group was coded as a binary variable [0 = standard care (reference), 1 = group condition].
Analyses
Data was cleaned, prepared, and analyzed using STATA/SE version 17 (37). For each wave, we examined sample size and descriptive statistics across the total sample and for COI quartiles. To assess baseline characteristics differences across COI quartiles groups, ANOVA, Chi-square test or Fisher's exact were used. Full information maximum likelihood (FIML) method was used to handle missing data in the outcome variable, BMIz. This approach was chosen because the amount of missing data was relatively low. Specifically, all covariates had less than 10% missing data, with the exception of parent income. For parent income, a missing category was added as the final category in the nominal variable. To test for changes in children's BMIz, we used linear growth curve models constructed in a sequential bottom-up approach: An unconditional growth model, followed by a combined fixed effects model, random slopes testing, interaction testing, and evaluation of different within-subject covariance matrices.
The unconditional growth model was first estimated using time as a continuous variable with a quadratic term, but due to non-significance and worsened model fit, it was ultimately used as a categorical variable. Time points and child ID were treated as random effects to obtain random intercepts for child participants and estimate the random slope of time for each child ID. For the next two steps, COI quartiles and covariates were incorporated into the model as fixed effect individual-level predictors. To avoid multicollinearity with the time variable, child age at baseline was used as a fixed effect. Additionally, MVPA scale, calories, and adult BMI were also grand mean centered.
Several interactions were tested, including COI*Group condition, COI*MVPA scale, and COI*Time, but were excluded from the final model due to non-significance and worsened fit. The Time*Group condition interaction, although non-significant, was retained on a theoretical basis.
This process culminated in two final models: an unconditional growth model and a linear mixed-effects model with a random slope. The latter included the Time*Group condition interaction term, a random slope for time within child participants, and an independent covariance structure. Except for the unconditional growth model, all covariates were included in the models.
Model fit was assessed by comparing improvements in -2LL, AIC, and BIC indices relative to previously nested models, ensuring a comprehensive evaluation of the model's performance and appropriateness for the data. Models were fitted using Stata's mixed command with default REML estimation.
Results
The final sample was n = 253 children. Child baseline BMI ranged from 16.52 to 34.25 (between the 73rd and 99th percentile), and baseline BMIz ranged from 0.62 to 2.68. The mean BMIz ranged from 1.74 to 1.80 across waves. The mean child BMI in each wave ranged from 22.73 to 23.86 (the 95.00th and 95.50th percentiles, respectively), with a 39.5% attrition reduction in child BMI in the final wave of data collection. Just over half of both the treatment and control groups were comprised of female children. The most common family income bracket was $10,001–$15,000. Over 60% of the sample had a Spanish speaking household or a mixed Spanish and English-speaking household. As far as parental education level, approximately 40% of the children's parents had some college/technical school, 30% had a high school or less education, and 13% had a four-year degree or more. Just over 49% of the sample were in the H4K treatment group. The mean average daily calories for children were 1,145 kcal (SD = 458.03) and the mean MVPA score was 252.60 (SD = 153.73). The COIz ranged from −0.08 to 0.027. This represented families with very low to very high COI. All sample demographics by COI quartile are reported in Table 1. Only parent education level was significantly different χ2 (6, N = 224) = 15.92, p = 0.014 at baseline across the COI quartiles. There were more parents with a four-year degree or more in the 3rd and 4th quartiles.
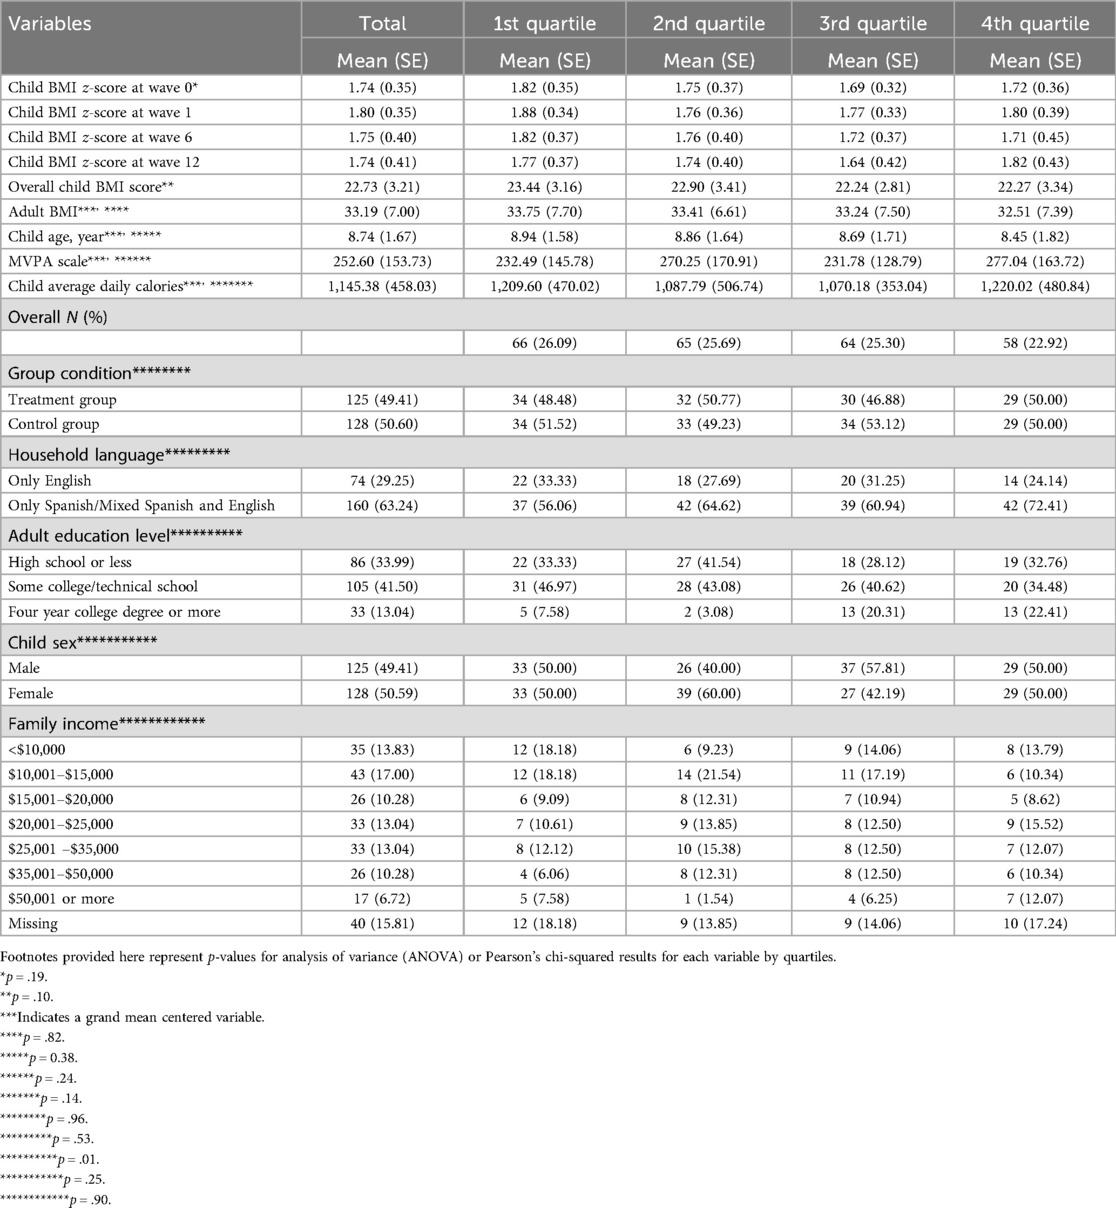
Table 1. Sample means, frequencies, and characteristics by child opportunity index (COI) quartiles (n = 253).
Unconditional model
The unconditional model (Table 2) showed that, on average, BMIz was significantly higher at 1-month compared to baseline (β = .05, 95% CI = 0.03, 0.07). No significant differences were observed between baseline and the other time points. This model also revealed a high intraclass correlation of 0.89, as expected.
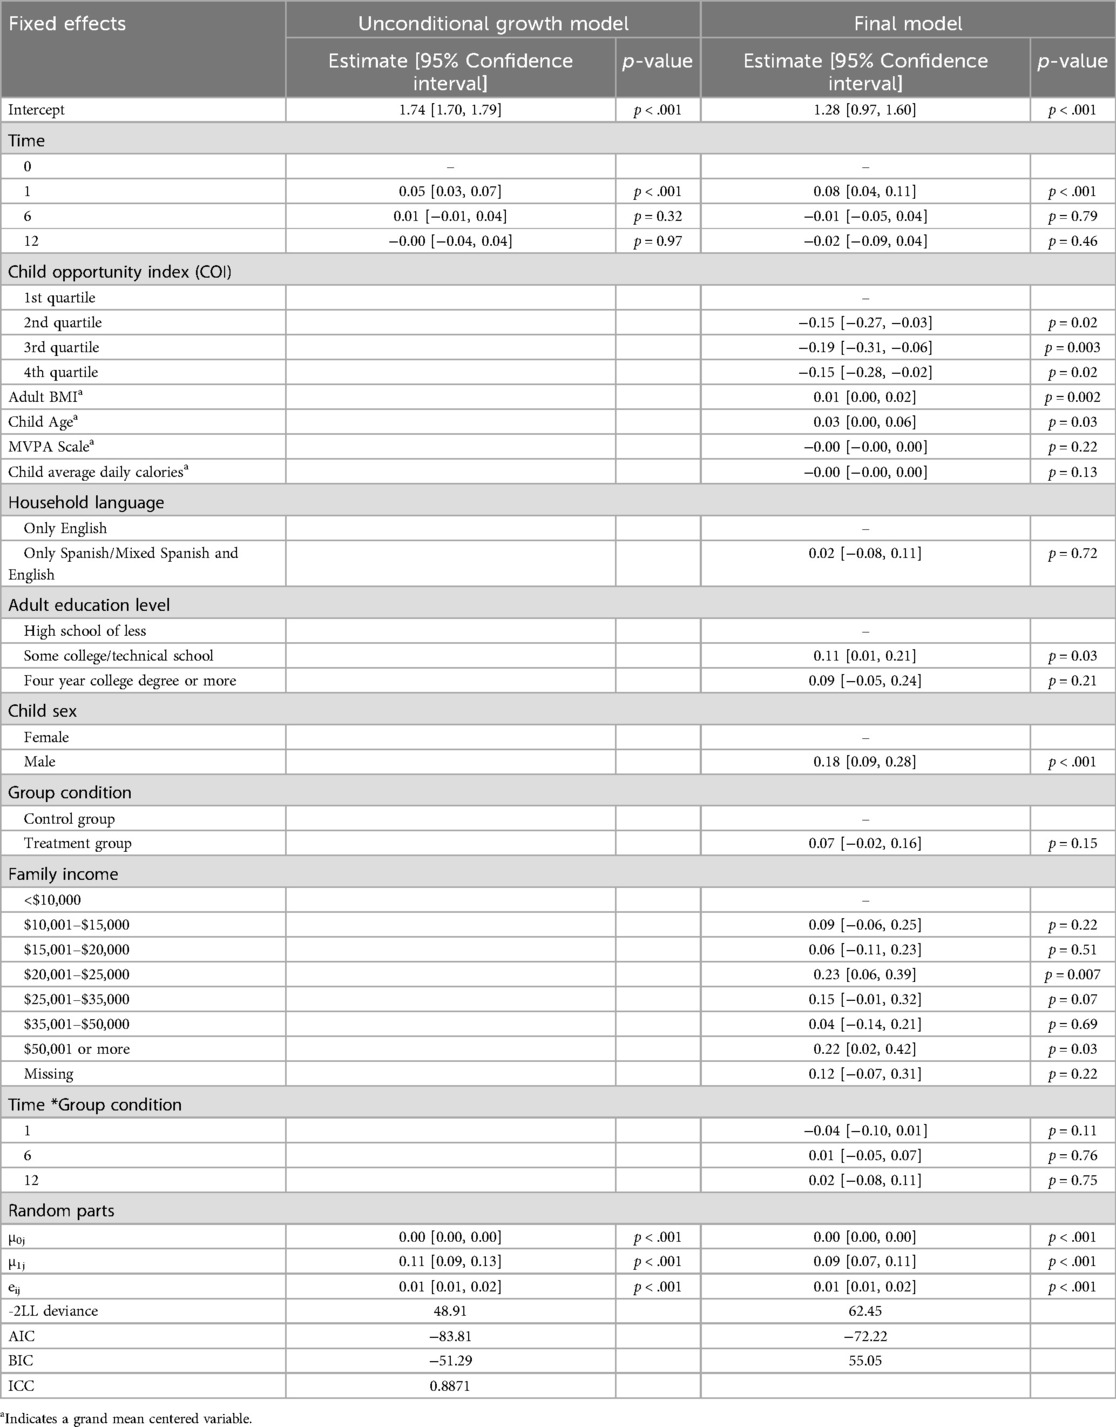
Table 2. Growth curve models with fixed effects, random effects, and interaction effects on child BMI z-score (n = 253).
Final model
The final model included the following variables: categorical time, COI (in quartiles), parent BMI, family income, adult education, child age, child sex, average daily calories, language spoken in the household, MVPA, group condition, and Time*Group condition (Table 2). Among children in the control group, wave 1 BMIz differed significantly compared to baseline in that wave 1 BMIz was higher at wave 1 compared to baseline (β = .08, 95% CI = 0.04, 0.11). The coefficient for the intervention group was β = .04 and this was statistically significant compared to the control group (95% CI = −0.10, 0.01). The other waves were not significantly different from baseline. Compared to children in the first (lowest) COI quartile, being in the second (β = −.15, 95% CI = −0.27, −0.03), the third (β = −.19, 95% CI = −0.31, −0.06), and the fourth (β = −.15, 95% CI = −0.28, −0.02) quartiles were associated with lower BMIz. Generally, each higher neighborhood opportunity level was associated with lower BMIz values when compared to the lowest opportunity level. Figure 1 shows the model-based estimated margins of BMIz at each time point by COI quartiles. Being male was significantly associated with a higher BMIz in children (β = .18, 95% CI = 0.09, 0.28). An increase in child age was significantly associated with an increase in BMIz (β = .03, 95% CI = 0.00, 0.06). Additionally, higher adult BMI was positively associated with an increase in child BMIz (β = .01, 95% CI = 0.00, 0.02). Parents with some college education had a higher BMIz compared to those with a high school or less level of education (β = .11, 95% CI = 0.01, 0.21). Regarding income, only the “$20,001–$25,000” (β = 0.23, 95% CI = 0.06, 0.39) and “≥$50,001” (β = .22, 95% CI = 0.02, 0.42) brackets were significantly associated with increased BMIz in children compared to the reference group of less than $10,000. No significant effects were found for the MVPA scale, average daily calories, or language spoken in household.
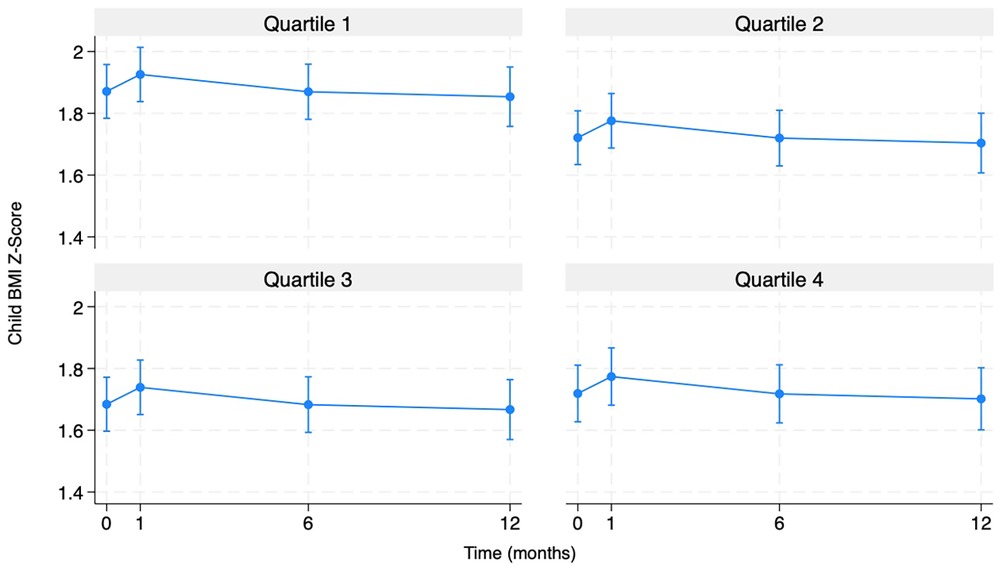
Figure 1. Predicted child BMI z-scores by child opportunity index (COI) quartiles over time (n = 253).
Discussion
The current study focused on further understanding how neighborhood opportunities, via the COI, are related to childhood weight status among Hispanic children in south-central Texas who participated in a family lifestyle intervention over 1 year. Notably, though not all individual children fell into this category, the mean BMIz for this sample ranged in the obese category across the waves, which was expected due to criteria and focus of the larger study. This sample also represented a diverse range of COI levels. The current study findings appear to align with COI and BMI studies with non-Hispanic samples that do not necessarily represent a high-risk and diverse COI population (17). Compared to children in the lowest COI quartile, being in the second, third, or fourth quartile was associated with lower BMIz. Though these findings are not novel, Figure 1 shows the nuance of this finding as the predictive margins for BMIz at each time point follow different patterns for each quartile relationship observed. Follow up studies can further investigate what about each level of opportunity [i.e., what value(s) of COI] may be associated with risk or protection against poorer weight status.
The main effects align with some existing literature on global patterns, suggesting that being male (38) and higher parent BMI are associated with increased BMIz (12). Age as a predictor of increased BMI is not always conclusive, though the significant finding from the current study aligns with the literature for children of this age and developmental period (38). The literature typically finds higher parent education and higher income to be associated with lower BMI; however, the inverse was found here. This is not surprising when one considers the overall average level of education and income for this group, which was low, and the overall relationship between socioeconomic status and childhood obesity. Evidence exists to support that when comparing groups of similar SES, slight differences appear such that those at lower levels of what might be considered poverty fare better than those at the higher end or those in higher SES neighborhoods who are at the higher end of wealth fare better than those at lower end of what is considered to be wealthy even though they are in the same neighborhood (27, 28). This maps on to the findings from Figure 1. For example, if a household is significantly economically disadvantaged, they may benefit from safety net programs that provide needed resources but if the household is just over the eligibility threshold, then they may not benefit from extra support though there may be a clear need for it. However, the data does not have the information to capture and compare varying levels and if they match eligibility levels. Further, there may be a protective factor of feeling like you belong in your neighborhood, though that was not measured in the current study. No statistically significant effects were found for other factors that have been found in the literature such as physical activity, child calorie intake, and language spoken in household.
The current study also did not find any BMIz differences between treatment groups. It should be acknowledged that this is not uncommon with an intervention sample of this size. Further, the descriptive statistics did indicate substantial variability in BMIz at the baseline across different groups so any potential differences may have been attributed to other statistically significant factors above. Additionally, Wave 1 BMIz differed significantly compared to baseline in that wave 1 BMIz was higher at wave 1 compared to baseline but there was no difference throughout the rest of the time points. It could be the case that the sample gained weight for any number of reasons but looking at the trends of the data, the intervention may have been working for certain groups though perhaps a longer follow up or intervention period would have produced significant results. The analysis also did not detect interaction effects for COI*Group condition, COI*physical activity, and Time*Group condition. This may be attributed to power, but further investigation is warranted given what is seen in Figure 1.
The lack of a treatment effect finding is consistent with the findings of Yin et al. (39), which emphasized the need for multi-level and multi-behavioral approaches to effectively address obesity among young children from low-income families. Though the current study addressed various factors, the results may indicate the importance of considering even broader social determinants of health (SDOH) in obesity-based interventions (40, 41). Still, the current study findings suggest that intervening on the areas measured by the COI could be an effective strategy for reducing obesity risk among Hispanic children, thereby supporting the call for multi-level interventions and changes in SDOH.
Limitations
As with any study using BMI as an outcome measure there are limitations in what the real-life implications are given the known challenges with this measure (42). However, the use of standardized measurement and use of z-score help strengthen the rigor of the variable. Though the findings align with other published studies (17), the current findings may only hold true among Hispanic 5- to 11-year-olds in south-central Texas. As noted above, there might not have been enough power in this study to detect certain difference at the p < .05 level. This was a diverse but relatively low COI sample and including another group with starker differences could elucidate more information about varying levels of COI, though that was outside the scope of the parent study. Notably, while not all children in the sample had baseline BMIz scores within the range or overweight or obese, all children participated in a family lifestyle intervention aimed at improving health lifestyle behaviors such as physical activity and dietary habits. Still, the analysis controlled for treatment and time to account for participation in the intervention.
Conclusions
The research on the relationship between neighborhood environments and obesity risk among low-income Hispanic children between 5 and 11-years-old continues to be limited. The current study suggests that there are potential healthy weight differences across levels of child opportunity, using a robust measure of the environmental context, though further research is needed to understand causal relationships. Understanding which indicators within the COI to intervene on for the largest impact would be helpful to further refine family and multi-level interventions. Finally, though the patterns of low opportunity remain linked to unhealthy weight status, there are nuances to be examined to further understand what protective factors can be drawn out of each COI group to utilize a strengths-based approach to good health.
Data availability statement
The datasets presented in this study can be found in online repositories. The names of the repository/repositories and accession number(s) can be found below: The University of Texas at Austin Latino Research Institute Data Repository—https://liberalarts.utexas.edu/lri/research/completed-studies/health4kids.html. Further data can be requested from the PI of the parent study, D. Parra-Medina at ZGVib3JhaC5wYXJyYS1tZWRpbmEmI3gwMDQwO2N1YW5zY2h1dHouZWR1.
Ethics statement
The studies involving humans were approved by The University of Texas at Austin IRB. The studies were conducted in accordance with the local legislation and institutional requirements. Written informed consent for participation in this study was provided by the participants' legal guardians/next of kin.
Author contributions
CV: Conceptualization, Methodology, Software, Writing – original draft, Writing – review & editing. BW: Methodology, Software, Writing – original draft, Writing – review & editing. SH: Writing – original draft, Writing – review & editing. YL: Formal analysis, Methodology, Supervision, Writing – review & editing. ZY: Supervision, Writing – review & editing. DP-M: Data curation, Funding acquisition, Resources, Supervision, Writing – review & editing.
Funding
The author(s) declare that financial support was received for the research and/or publication of this article. This research was supported by R01HD075936, awarded to D.P-M by the National Institutes of Health. This research was also supported by K01AG081455 & L60AG084095, awarded to C.E.V. by the National Institutes of Health. The content is solely the responsibility of the authors and does not necessarily represent the official views of the National Institutes of Health.
Acknowledgments
We would like to thank Jaime Fuentes and Minyu Zhang for their assistance with manuscript and data preparation as well as statistical consult. More information about the study can be found at https://liberalarts.utexas.edu/lri/research/completed-studies/health4kids.html and NCT02343367. Data can be requested from the PI of the parent study through the contact information provided at the links above. We would like to thank the Latino Research Institute at The University of Texas at Austin for their support through their Publication Initiative Support award.
Conflict of interest
The authors declare that the research was conducted in the absence of any commercial or financial relationships that could be construed as a potential conflict of interest.
Generative AI statement
The author(s) declare that no Generative AI was used in the creation of this manuscript.
Publisher's note
All claims expressed in this article are solely those of the authors and do not necessarily represent those of their affiliated organizations, or those of the publisher, the editors and the reviewers. Any product that may be evaluated in this article, or claim that may be made by its manufacturer, is not guaranteed or endorsed by the publisher.
References
1. Centers for Disease Control and Prevention. Prevalence of Childhood Obesity in the United States. Atlanta, GA: U.S Centers for Disease Control and Prevention (2022). Available at: https://www.cdc.gov/obesity/data/childhood.html
2. Jargowsky PA. Concentration of Poverty in the New Millennium: Changes in Prevalence, Composition, and Location of High Poverty Neighborhoods. New York, NY: Century Foundation (2004).
3. Voigt K, Nicholls GS, Williams G. Childhood Obesity and the “Obesogenic Environment”, Childhood Obesity: Ethical and Policy Issues. New York, NY: Oxford University Press (2014).
4. Foster BA, Maness TM, Aquino CA. Trends and disparities in the prevalence of childhood obesity in south Texas between 2009 and 2015. J Obes. (2017):1424968. doi: 10.1155/2017/1424968
5. Low EV, Lee M, Bauer C, Fisher-Hoch SP, McCormick JB, Rowan PJ, et al. Risk factors for overweight and obesity in Mexican American children and adolescents living on the Texas–Mexico border. Front Adolesc Med. (2024) 2:1297391. doi: 10.3389/fradm.2024.1297391
6. Johnson KA, Showell NN, Flessa S, Janssen M, Reid N, Cheskin LJ, et al. Do neighborhoods matter? A systematic review of modifiable risk factors for obesity among low socio-economic status Black and Hispanic children. Child Obes. (2019) 15(2):71–86. doi: 10.1089/chi.2018.0044
7. Hales CM, Carroll MD, Fryar CD, Ogden CL. Prevalence of obesity and severe obesity among adults: United States, 2017–2018. NCHS Data Brief. (2020) (360):1–8.32487284
8. Arandia G, Sotres-Alvarez D, Siega-Riz AM, Arredondo EM, Carnethon MR, Delamater AM, et al. Associations between acculturation, ethnic identity, and diet quality among U.S. Hispanic/Latino youth: findings from the HCHS/SOL youth study. Appetite. (2018) 129:25–36. doi: 10.1016/j.appet.2018.06.017
9. Bai Y, Chen S, Laurson KR, Kim Y, Saint-Maurice PF, Welk GJ. The associations of youth physical activity and screen time with fatness and fitness: the 2012 NHANES national youth fitness survey. PLoS One. (2016) 11(1):e0148038. doi: 10.1371/journal.pone.0148038
10. Evenson KR, Arredondo EM, Carnethon MR, Delamater AM, Gallo LC, Isasi CR, et al. Physical activity and sedentary behavior among US Hispanic/Latino youth: the SOL youth study. Med Sci Sports Exerc. (2019) 51(5):891–9. doi: 10.1249/MSS.0000000000001871
11. Asieba IO. Racial/ethnic trends in childhood obesity in the United States. J Child Obes. (2016) 1(1):1–6. doi: 10.21767/2572-5394.100001
12. Lee JS, Jin MH, Lee HJ. Global relationship between parent and child obesity: a systematic review and meta-analysis. Clin Exp Pediatr. (2022) 65(1):35–46. doi: 10.3345/cep.2020.01620
13. Hernandez DC, Reesor L, Machuca I, Chishty M, Alonso Y. Low-income immigrant Hispanic mothers’ concerns and perceptions of their young child’s weight. Public Health Nurs. (2016) 33(5):412–20. doi: 10.1111/phn.12252
14. Foster BA, Hale D. Perceptions of weight and health practices in Hispanic children: a mixed-methods study. Int J Pediatr. (2015) 761515. doi: 10.1155/2015/761515
15. Starr R, Miller E, Chen RK, Carlson R, Umeasiegbu VI, Reed BJ. Association between Hispanic parents’ attitudes and knowledge regarding obesity and their children’s body mass index. Rehabil Couns Bull. (2022) 11(3). doi: 10.52017/001c.38796
16. Grzywacz JG, Arcury TA, Trejo G, Quandt SA. Latino mothers in farmworker families’ beliefs about preschool children’s physical activity and play. J Immigr Minor Health. (2016) 18(1):234–42. doi: 10.1007/s10903-014-9990-1
17. Aris IM, Perng W, Dabelea D, Padula AM, Alshawabkeh A, Vélez-Vega CM, et al. Associations of neighborhood opportunity and social vulnerability with trajectories of childhood body mass index and obesity among US children. JAMA Netw Open. (2022) 5(12):e2247957. doi: 10.1001/jamanetworkopen.2022.47957
18. Gartstein MA, Seamon E, Thompson SF, Lengua LJ. Community crime exposure and risk for obesity in preschool children: moderation by the hypothalamic-pituitary-adrenal-axis response. J Pediatr Psychol. (2018) 43(4):353–65. doi: 10.1093/jpepsy/jsx116
19. Theall KP, Chaparro MP, Denstel K, Billfield A, Drury SS. Childhood obesity and the associated roles of neighborhood and biologic stress. Prev Med Rep. (2019) 14:100849. doi: 10.1016/j.pmedr.2019.100849
20. Vazquez CE, McBride MJ, Hess KE, Cubbin C, Bearman SK, Calzada EJ. Examining school and neighborhood effects of socioeconomic status on childhood obesity in the U.S. Int J Environ Res Public Health. (2022) 19(10):5831. doi: 10.3390/ijerph19105831
21. Rogers R, Eagle TF, Sheetz A, Woodward A, Leibowitz R, Song M, et al. The relationship between childhood obesity, low socioeconomic status, and race/ethnicity: lessons from Massachusetts. Child Obes. (2015) 11(6):691–5. doi: 10.1089/chi.2015.0029
22. Scott-Sheldon LAJ, Hedges LV, Cyr C, Young-Hyman D, Khan LK, Magnus M, et al. Childhood obesity evidence base project: a systematic review and meta-analysis of a new taxonomy of intervention components to improve weight status in children 2–5 years of age, 2005–2019. Child Obes. (2020) 16(S2):S221–48. doi: 10.1089/chi.2020.0139
23. Ramachandran J, Mayne SL, Kelly MK, Powell M, McPeak KE, Dalembert G, et al. Measures of neighborhood opportunity and adherence to recommended pediatric primary care. JAMA Netw Open. (2023) 6(8):e2330784. doi: 10.1001/jamanetworkopen.2023.30784
24. DiversityDataKids. What is Child Opportunity?. Waltham, MA: Child Opportunity Index (2024). Available at: https://www.diversitydatakids.org/research-library/research-brief/what-child-opportunity (updated August 8, 2024).
25. Kersten EE, Adler NE, Gottlieb L, Jutte DP, Robinson S, Roundfield K, et al. Neighborhood child opportunity and individual-level pediatric acute care use and diagnoses. Pediatrics. (2018) 141(5):e20172309. doi: 10.1542/peds.2017-2309
26. Beck AF, Huang B, Wheeler K, Lawson NR, Kahn RS, Riley CL. The child opportunity index and disparities in pediatric asthma hospitalizations across one Ohio metropolitan area, 2011–2013. J Pediatr. (2017) 190:200–6.e1. doi: 10.1016/j.jpeds.2017.08.007
27. Kim Y, Landgraf A, Colabianchi N. Living in high-SES neighborhoods is protective against obesity among higher-income children but not low-income children: results from the healthy communities study. J Urban Health. (2020) 97(2):175–90. doi: 10.1007/s11524-020-00427-9
28. Vazquez CE, Cubbin C. Socioeconomic status and childhood obesity: a review of literature from the past decade to inform intervention research. Curr Obes Rep. (2020) 9(4):562–70. doi: 10.1007/s13679-020-00400-2
29. Soltero EG, Peña A, Gonzalez V, Hernández E, Mackey G, Callender C, et al. Family-based obesity prevention interventions among Hispanic children and families: a scoping review. Nutrients. (2021) 13(8):2690. doi: 10.3390/nu13082690
30. Noelke C, McArdle N, Baek M, Huntington N, Huber R, Hardy E, et al. Child Opportunity Index 2.0 Technical Documentation. Waltham, MA: Institute for Child, Youth and Family Policy, The Heller School for Social Policy and Management, Brandeis University (2020).
31. Anderson PM, Butcher KF, Schanzenbach DW. Understanding recent trends in childhood obesity in the United States. Econ Hum Biol. (2019) 34:16–25. doi: 10.1016/j.ehb.2019.02.002
32. Nelson CC, Colchamiro R, Perkins M, Taveras EM, Leung-Strle P, Kwass J, et al. Racial/ethnic differences in the effectiveness of a multisector childhood obesity prevention intervention. Am J Public Health. (2018) 108(9):1200–6. doi: 10.2105/AJPH.2018.304511
33. Martin A, Booth JN, Young D, Revie M, Boyter A, Johnston B, et al. Associations between obesity and cognition in the pre-school years. Obesity. (2016) 24(1):207–14. doi: 10.1002/oby.21329
34. Wong MS, Showell NN, Bleich SN, Gudzune KA, Chan KS. The association between parent-reported provider communication quality and child obesity status: variation by parent obesity and child race/ethnicity. Patient Educ Couns. (2017) 100(8):1588–97. doi: 10.1016/j.pec.2017.03.015
35. Freedson PS, Melanson E, Sirard J. Calibration of the Computer Science and Applications, Inc. accelerometer. Med Sci Sports Exerc. (1998) 30(5):777–81. doi: 10.1097/00005768-199805000-00021
36. Block G, Hartman AM, Dresser CM, Carroll MD, Gannon J, Gardner L. A data-based approach to diet questionnaire design and testing. Am J Epidemiol. (1986) 124(3):453–69. doi: 10.1093/oxfordjournals.aje.a114416
38. Spinelli A, Buoncristiano M, Nardone P, Starc G, Hejgaard T, Júlíusson PB, et al. Thinness, overweight, and obesity in 6- to 9-year-old children from 36 countries: the World Health Organization European childhood obesity surveillance initiative-COSI 2015–2017. Obes Rev. (2021) 22(Suppl 6):e13214. doi: 10.1111/obr.13214
39. Yin Z, Liang Y, Howard JT, Errisuriz V, Estrada VM, Martinez C, et al. ¡Míranos! a comprehensive preschool obesity prevention program in low-income Latino children: one-year results of a clustered randomized controlled trial. Public Health Nutr. (2022) 26:1–26. doi: 10.1017/S1368980022002439
40. Volger S, Rigassio Radler D, Rothpletz-Puglia P. Early childhood obesity prevention efforts through a life course health development perspective: a scoping. PLoS One. (2019) 14(1):e0211288. doi: 10.1371/journal.pone.0211288
41. Wolfenden L, Jones J, Williams CM, Finch M, Wyse RJ, Kingsland M, et al. Strategies to improve the implementation of healthy eating, physical activity and obesity prevention policies, practices or programmes within childcare services. Cochrane Database Syst Rev. (2016) 10(10):CD011779. doi: 10.1002/14651858.CD011779.pub2
Keywords: environmental factors, body mass index z-score, intervention, Hispanic, multilevel model
Citation: Vazquez CE, Wood B, Handique S, Liang Y, Yin Z and Parra-Medina D (2025) Relationship between child opportunity index and body mass index z-score: a mixed-effects analysis with data from a lifestyle intervention with Hispanic children. Front. Adolesc. Med. 3:1547910. doi: 10.3389/fradm.2025.1547910
Received: 18 December 2024; Accepted: 21 April 2025;
Published: 13 May 2025.
Edited by:
Emmanuel Cohen, UMR7206 Eco Anthropologie et Ethnobiologie (EAE), FranceReviewed by:
Aruna Chandran, Johns Hopkins University, United StatesKaren Ertel, Harvard University, United States
Copyright: © 2025 Vazquez, Wood, Handique, Liang, Yin and Parra-Medina. This is an open-access article distributed under the terms of the Creative Commons Attribution License (CC BY). The use, distribution or reproduction in other forums is permitted, provided the original author(s) and the copyright owner(s) are credited and that the original publication in this journal is cited, in accordance with accepted academic practice. No use, distribution or reproduction is permitted which does not comply with these terms.
*Correspondence: Christian E. Vazquez, Y2hyaXN0aWFuLnZhenF1ZXpAdXRhLmVkdQ==