 Weiqing Huang
 Cheng Xu2
- 1Beijing Institute of Technology, Beijing, China
- 2Weichai Power Co. Ltd., Weifang, Shandong, China
This paper proposes a method that significantly improves the prediction accuracy of structural degradation in the main bearing wall of diesel engine cylinders. Firstly, based on the component scaling method, a scaling study is conducted on the main bearing wall to obtain a scaled model of the main bearing wall. By performing crack growth rate (da/dN) tests and threshold value (∆Kth) tests on the scaled model, accurate da/dN and ∆Kth data for the main bearing wall are indirectly obtained. Based on this, an accurate da/dN model for the main bearing wall, considering structural and load factors, is constructed, and the accuracy of the scaled model is verified by introducing standard single-edge notched bend (SENB) specimens for comparison. Secondly, based on the scaled model and the da/dN model measured from SENB specimens, structural degradation prediction studies are conducted on the main bearing wall, establishing two prediction models for the structural degradation of the main bearing wall. Finally, fatigue tests are conducted on the main bearing wall to verify the accuracy of the structural degradation prediction model built from the scaled model. Simultaneously, microscopic characterization studies are conducted on the fracture surface of the main bearing wall to determine the microscopic failure mechanism. Fatigue test verification shows that the fracture mode of the main bearing wall is primarily ductile fracture dominated by dimple fracture. The structural degradation prediction model for the main bearing wall built from the scaled model, which fully considers the structural and load factors of the main bearing wall, can more accurately reflect the structural degradation of the main bearing wall compared to traditional SENB specimens.
1 Introduction
Diesel engines are essential for various modes of transportation and are often referred to as the core of transportation systems (Ren et al., 2024). However, due to continuous exposure to mechanical stress, components of diesel engines are susceptible to fatigue failure, particularly the upper main bearing wall of the engine block (Hutchinson, 2023; Zhang et al., 2024; Kieser and Xie, 2002). It is crucial to develop a precise model for assessing the degradation of the upper main bearing wall, monitor its condition in real-time, and promptly conduct maintenance or replacement to prevent failures and ensure the safe operation of diesel engines (Suresh and Morton, 1993).
An accurate crack growth rate (da/dN) model is crucial for establishing a precise degradation model for the upper main bearing wall. The crack growth rate (da/dN) model described in this paper is a mathematical relationship used to describe and predict the rate at which a crack propagates in a material or structure under cyclic or sustained loading. This model establishes a quantitative relationship between the da/dN and the stress intensity factor range (ΔK), reflecting the physical mechanism of crack initiation and growth until final failure. This da/dN model comprises the fatigue crack threshold (
To address this issue, relevant personnel have primarily explored the following two approaches. First, they adopted the method of cutting samples from components and preparing them into small standard single-edge notched bend (SENB) specimens (American Society for Testing and Materials, 2014), and then conducted fatigue crack propagation (FCP) tests on these SENB specimens (Yarullin et al., 2024; Langari et al., 2023). However, this method is only applicable at the material level of the components and completely ignores the influence of component structure and load factors, significantly reducing the accuracy of the measured data. Second, they employed online monitoring to directly conduct FCP tests on diesel engine components (Ren and Liu, 2025; Xu et al., 2023). However, this method typically requires high-precision sensors and data acquisition systems, leading to higher equipment costs and maintenance requirements. Especially in large and complex components, the installation and debugging of instruments are more challenging (Brown and Smith, 2017). Additionally, this method can only measure the behavior of the component surface or local areas, failing to comprehensively reflect the fatigue characteristics of the components, particularly in cases of micro-cracks or non-uniform stress distribution (Zhao and Li, 2015; Molaei et al., 2020; Correia et al., 2017). Therefore, although online monitoring offers the advantage of real-time monitoring, it still cannot be widely applied in practical engineering. In summary, there is currently no method that can accurately obtain the da/dN model for actual complex components.
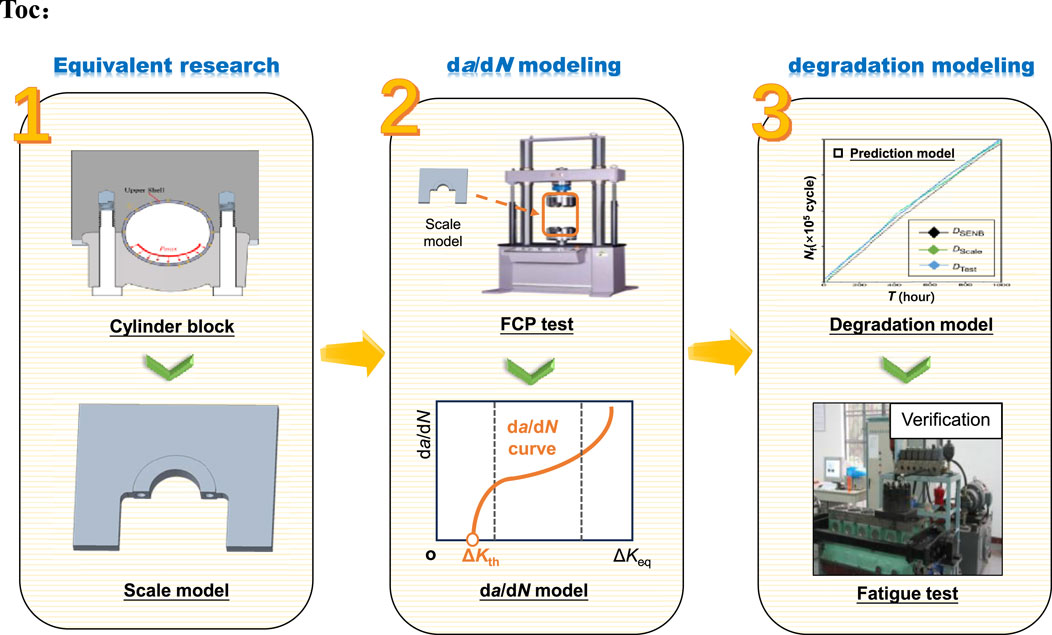
To address the aforementioned issues, this study initially conducted a scaling analysis on the upper main bearing wall to ensure a consistent stress field pre- and post-scaling. Subsequently, the wall was equivalated to a smaller scaled model for ease of clamping onto the fatigue testing machine. Following this, da/dN tests were performed on the scaled model to indirectly obtain precise da/dN data for the upper main bearing wall. SENB samples were also utilized for comparative purposes (Section 2). Concurrently, a da/dN model for the upper main bearing wall was formulated using the measured da/dN data from both the wall and SENB samples (Section 3). Subsequent to this, an accurate degradation model for the performance of the upper main bearing wall was established based on the scaled model and the da/dN model derived from the SENB sample data, enabling the prediction of structural degradation. Finally, fatigue testing of the upper main bearing wall was conducted, and the actual structural degradation curve was plotted. By comparing the projected structural degradation values from the model with the experimental results, the precision of the structural degradation model developed from the scaled model was validated (Section 4).
2 Materials and experiments
2.1 Main bearing wall of cylinder block and its scaled model
This section focuses on the upper main bearing wall of an HT300 cast iron diesel engine cylinder block, with its material parameters detailed in Table 1. Due to the large size, complex structure, and variable loading conditions of the upper main bearing wall, data acquisition is relatively challenging. To facilitate fatigue crack propagation (FCP) testing on the upper main bearing wall, this study first conducts a scaling analysis to ensure identical stress fields before and after scaling (Petrović et al., 2021). Considering the dimensions of the fatigue testing machine, a scaling ratio of 1:7 was adopted, reducing the large-scale main bearing wall (Figure 1a) to a scaled model (Figure 1b) suitable for mounting on the testing machine. To validate the accuracy of the FCP data obtained from the scaled model, a SENB specimen was introduced as a control, with its dimensions specified in Figure 1c. To minimize the potential influence of material microstructure on the test results, 16 scaled models and SENB specimens were fabricated using wire cutting from the upper main bearing wall. From these, six specimens with the most similar microstructural distributions were selected for repeated FCP testing to enhance the reliability of the experimental results (Wei et al., 2023).
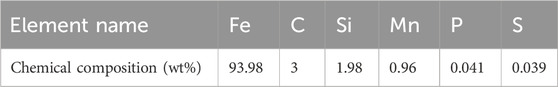
Table 1. Properties of HT300 cast iron material.
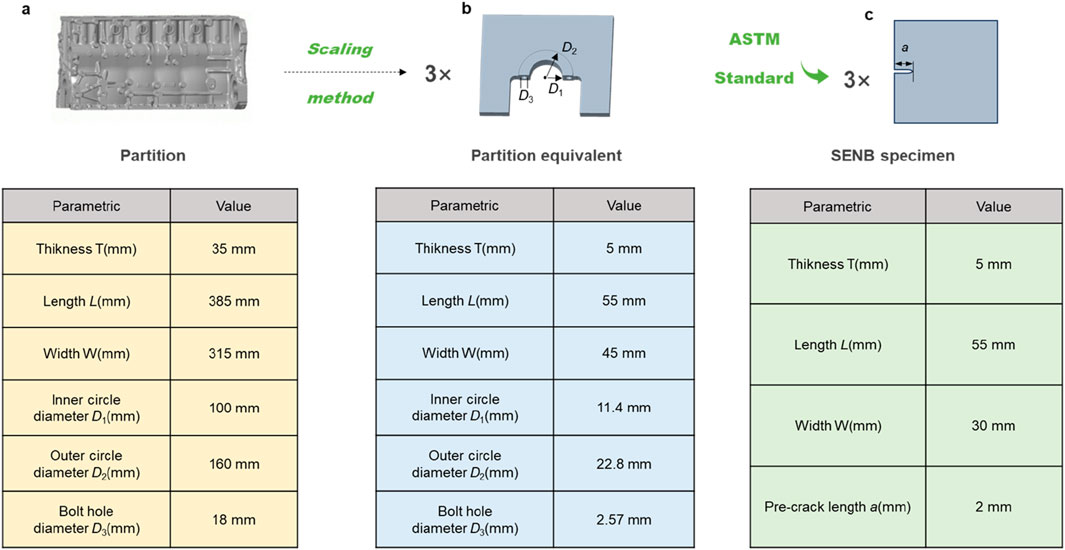
Figure 1. Dimensions of the research object. (a) Upper main bearing wall. (b) Scaled model. (c) Single-edge notched bend specimen.
2.2 FCP test
The accurate establishment of the da/dN model for the upper main bearing wall hinges on the precise determination of FCP data, which comprises the da/dN curve and the threshold stress intensity factor range (ΔKth). To enhance the accuracy of FCP data measurement, this section employs a scaled model of the upper main bearing wall that incorporates structural factors. Specifically, da/dN tests (Section 2.2.1) and ΔKth tests (Section 2.2.2) are conducted using the scaled model. Additionally, SENB specimens are introduced for comparative analysis to validate the accuracy of the scaled model. This approach ensures a robust evaluation of the model’s precision and reliability.
2.2.1 da/dN test
In this section, da/dN tests were conducted on both the scaled bearing wall model and the standard SENB specimens according to the stepwise loading method described in ASTM standards (ASTM E766-14, 2019). The clamping setups are shown in Figures 2a,b. As shown in Figure 2a, the SENB specimens were clamped into the fatigue testing machine using standard grips, while the scaled models were fixed using bolts.
Figure 2. MTS fatigue testing machine clamping situation and loading conditions. (a) SENB specimen clamping situation (b) Scale model clamping situation (c) Load application situation.
All tests were performed on an MTS 307 servo-hydraulic fatigue testing machine. The loading conditions were set with a stress ratio (R) of 0.1 and a loading frequency of 10 Hz. A sinusoidal waveform was used. When the stress intensity factor (K) was between 6 and 10 MPa m1/2, the load was set at 6 MPa. For K between 10 and 15 MPa m1/2, the load was set at 10 MPa. For K between 15 and 20 MPa m1/2, the load was set at 20 MPa (see Figure 2c). At the start of each test, a low initial cyclic load was applied. The load amplitude was then gradually increased step by step. During the loading process, the crack length was continuously monitored in real time to record the crack growth. A series of discrete data points (Ni, ai) were obtained, where Ni is the number of loading cycles and ai is the corresponding crack length. The test was stopped when the crack reached a critical length or when the specimen fractured.
After the test, the da/dN curve was plotted based on the experimental data. The calculation process for the da/dN curve is as follows: this section first applies the least squares method to fit the experimental data of (Ni, ai). The formula for the least squares method is as Equation 1:
In this equation, f(N) uses the form of a polynomial, S represents the sum of squared errors for all sample points, indicating the accuracy of the model fitting. A smaller S means that the predicted values are closer to the actual values, resulting in a better fit, while a larger S suggests poorer fitting performance. N denotes the total number of sample points, and ai is the observed crack length for the ith sample. The term (ai − f (Ni))2 is the squared error for the ith sample point, which reflects the deviation between the actual value and the predicted value. After applying the least squares method for fitting, the functional relationship between the component’s a and N is obtained, as Equation 2:
By differentiating both sides of Equation 2, the component’s
At this point, the (a,da/dN) data for both the scaled model and the SENB specimens can be obtained. The
In the equation,
In the equation,
In the equation, Y represents the shape factor of the upper main bearing wall, This paper adopts the complex da/dN curve establishment method (CCEM) studied by Sijia Ren et al. to calculate this value (Ren and Liu, 2025),
2.2.2
In this section,
2.3 Fatigue testing of cylinder block
This section presents fatigue tests conducted on the main bearing wall of the diesel engine cylinder block under three typical working conditions (WC). The tests employed a sinusoidal loading waveform with a frequency set at 30 Hz (Figure 3a). The experiments were performed in accordance with the relvant standards of the “Fatigue Testing Method for Diesel Engine Cylinder Blocks” (National Technical Committee for Standardization of Internal Combustion Engines, 2018) and were carried out on a hydraulic pulse-type block fatigue testing rig developed by the Institute of Power Machinery and Vehicle Engineering at Zhejiang University (Figure 3b). After the test, the fatigue life of the component (Nf) is recorded, as explained below. Nf is a key parameter in fatigue life prediction and represents the number of load cycles that a material or component can endure under specified loading conditions before failure occurs, such as crack initiation or complete fracture. It serves as an important indicator in structural degradation models, providing a quantitative measure of the durability of the component under cyclic loading.
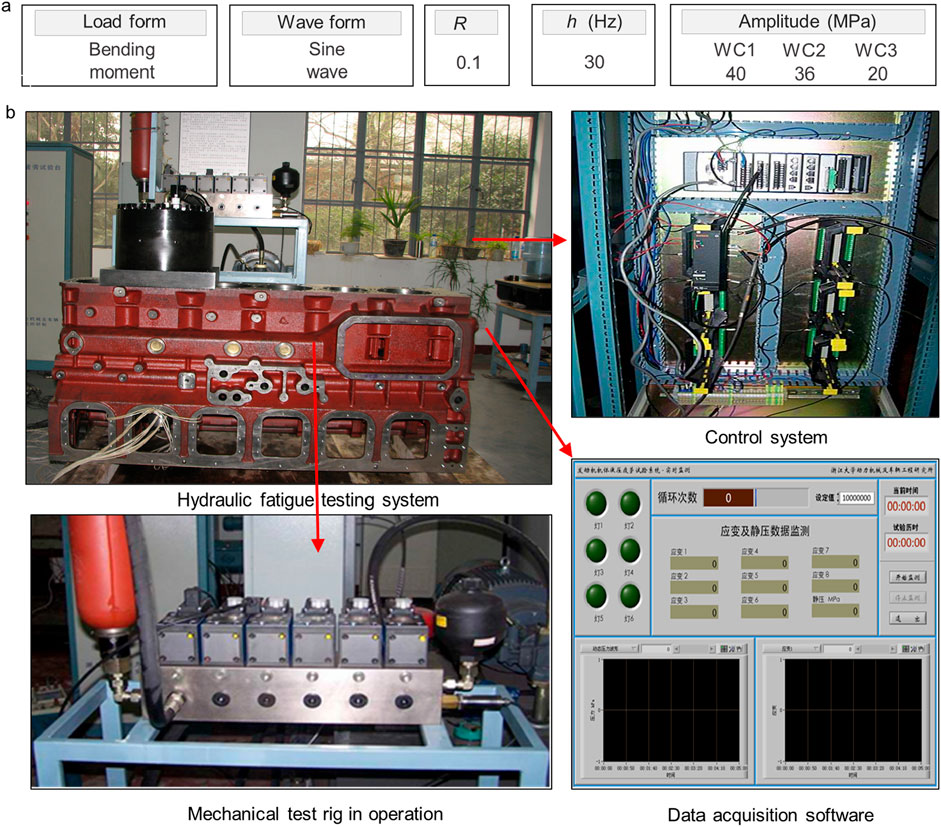
Figure 3. (a) Illustration of three typical working conditions for fatigue testing of the main bearing wall, (b) Fatigue testing machine for the upper main bearing wall and its components.
To minimize random and systematic errors during the experiments, the fatigue test results of the main bearing wall under each working condition were averaged. This approach not only enhanced the representativeness and reliability of the data but also effectively smoothed out potential random fluctuations in individual tests, providing more robust experimental evidence for subsequent structural degradation predictions and engineering applications.
2.4 Microstructural characterization
It is critically important to investigate the microscopic failure mechanisms of the main bearing wall in diesel engine blocks, as this can lay a solid foundation for accurate monitoring of its structural degradation. This section presents a systematic microstructural characterization study. The experimental procedure was conducted as follows:
2.4.1 Fractography analysis
The fracture surface was first cleaned using an ultrasonic cleaner to remove contaminants. Subsequently, scanning electron microscopy (SEM) was employed to examine the fracture morphology of the upper main bearing wall (Figure 4a), with particular emphasis on identifying characteristic features such as fatigue striations and dimples.
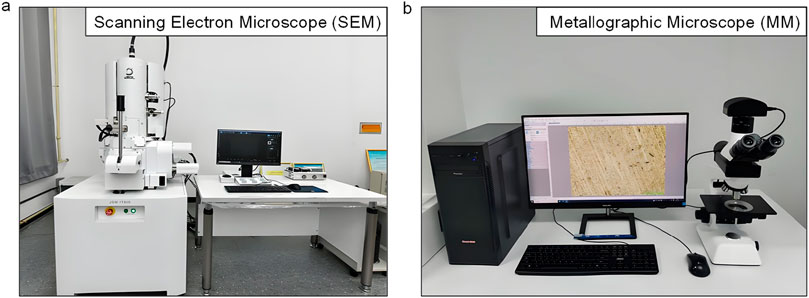
Figure 4. (a) Scanning electron microscope (SEM), (b) metallographic microscope (MM).
2.4.2 Metallographic examination
Following standard metallographic preparation protocols, the fracture surface was progressively ground using 400–2000# silicon carbide sandpaper. After polishing with diamond paste, the microstructure was observed using a research-grade metallographic microscope (MM) to determine critical parameters, including grain size and second-phase particle distribution (Figure 4b).
2.5 Validation of scaled model accuracy
To ensure that the scaled model can accurately reflect the microscopic failure mechanism of the upper main bearing wall, this study adopts an experimental verification method. The effectiveness of the scaled model is evaluated by comparing the stress fields and da/dN curves at key failure locations between the prototype of the upper main bearing wall and its scaled model. Specifically, if the stress fields and da/dN curves of the prototype and the scaled model show good consistency in key parameters and curve trends, it proves that the scaled model can effectively simulate the fatigue crack propagation behavior of the prototype, thereby validating its effectiveness.
3 Establishment of the da/dN model for the main bearing wall on the cylinder block
As outlined in the introduction, traditional SENB specimens primarily account for the material properties of the upper main bearing wall but fail to adequately incorporate the structural and loading influences specific to the upper main bearing wall. This limitation significantly compromises the accuracy of da/dN and ΔKth measurements, thereby undermining the ability of the resulting da/dN model to accurately describe the actual FCP behavior. Consequently, the precision of the structural degradation model for the upper main bearing wall is adversely affected. To address this issue, this section leverages the accurate FCP data obtained from the scaled model in Section 2.2 to develop a da/dN model that comprehensively considers both the structural and loading effects of the upper main bearing wall. The detailed steps of this process are illustrated in Figure 5.
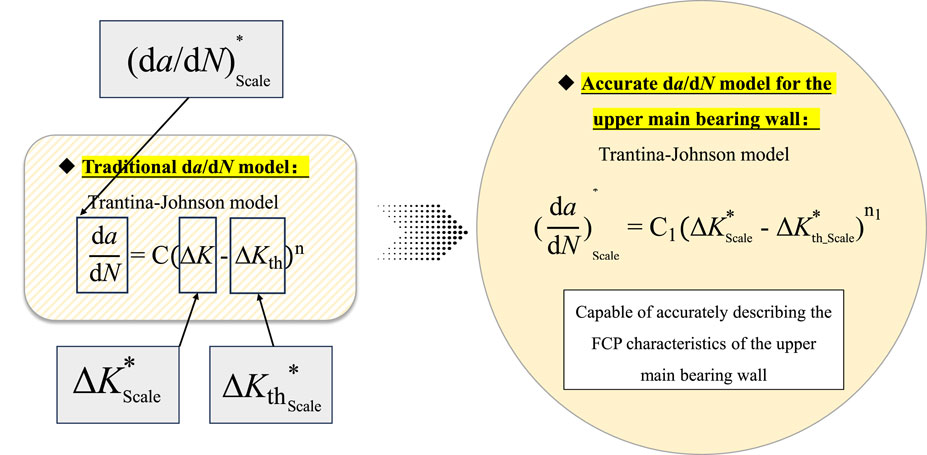
Figure 5. Process of establishing an accurate da/dN model for the upper main bearing wall.
Step 1. Selection of the initial da/dN model
The da/dN curve and the threshold stress intensity factor range (ΔKth) are key components of the da/dN model for the upper main bearing wall. Previous studies have shown that the Trantina–Johnson model (Wang et al., 2016) effectively describes crack arrest behavior under low driving forces by introducing ΔKth into the crack growth rate expression. This allows the model to more realistically capture the fatigue crack growth characteristics of materials, especially under variable amplitude loading conditions, where load cycles below the threshold can be reasonably ignored. As a result, the accuracy of fatigue life prediction is improved. In addition, the Trantina–Johnson model provides a more reasonable explanation for overload and underload effects, enhancing its applicability and physical consistency in practical engineering applications. Therefore, to account for both effects, we selected the Trantina–Johnson model as the initial da/dN model in this study. Its equation is given as Equation 7:
In the formula, C and n are material parameters.
Step 2. Establishment of an accurate component da/dN model based on precise FCP data
As outlined in Section 2.1, the scaled model employed in this study comprehensively incorporates the structural and loading effects of the component. Consequently, the measured FCP data (da/dN curve and ΔKth) for the upper main bearing wall exhibit significantly improved accuracy. In this study, the da/dN curve is denoted as
where C1 and n1 are material parameters obtained by fitting the experimental data from the scaled model.
4 Establishment and validation of the structural degradation model for the main bearing wall
4.1 Establishment of the structural degradation model for the main bearing wall
To improve the prediction accuracy of the structural degradation model for the upper main bearing wall, this study develops a structural degradation model that comprehensively considers the effects of structural features and loading conditions, based on da/dN data obtained from scaled model tests. To verify the reliability of the scaled test results, a comparative analysis was also conducted using standard SENB specimens. In engineering practice, structural degradation of a component is characterized by a gradual decline in key mechanical properties such as strength, stiffness, and toughness as service time or loading cycles increase. The physical essence of this degradation process lies in the continuous accumulation of micro-damage caused by cyclic loading, environmental corrosion, thermo-mechanical coupling, and wear during long-term operation. This accumulation eventually leads to a progressive deterioration of macroscopic mechanical performance until the component reaches its critical fatigue life Nf. In summary, from the perspective of damage mechanics, Nf quantitatively represents the accumulated degradation reaching the failure threshold. This relationship can be clearly described by Miner’s linear cumulative damage theory, with its mathematical expression given as Equation 9:
In this equation, D represents the accumulated damage value, ni is the number of cycles experienced under the ith stress amplitude, and Ni is the number of cycles required to cause fatigue failure at that stress amplitude. This formula indicates that the reduction of remaining life is closely related to the cumulative load and service time. Therefore, structural degradation is essentially a process in which the material state evolves over time. In this section, the relationship between the component’s fatigue life Nf and time t is used to represent the structural degradation process.
The establishment procedure of the structural degradation model is illustrated in Figure 6. First, the Wiener process, one of the most commonly used stochastic process models for structural degradation, is selected as the basic model (Jing et al., 2023). The core concept of this model is to treat the structural degradation process as a continuous process with random fluctuations, assuming that the change in degradation over time follows a stochastic process with increments that are normally distributed and independent. Therefore, the Wiener process can effectively describe degradation processes that exhibit a linear trend accompanied by random variability, providing high modeling flexibility. The mathematical expression of the Wiener model is given as Equation 10:
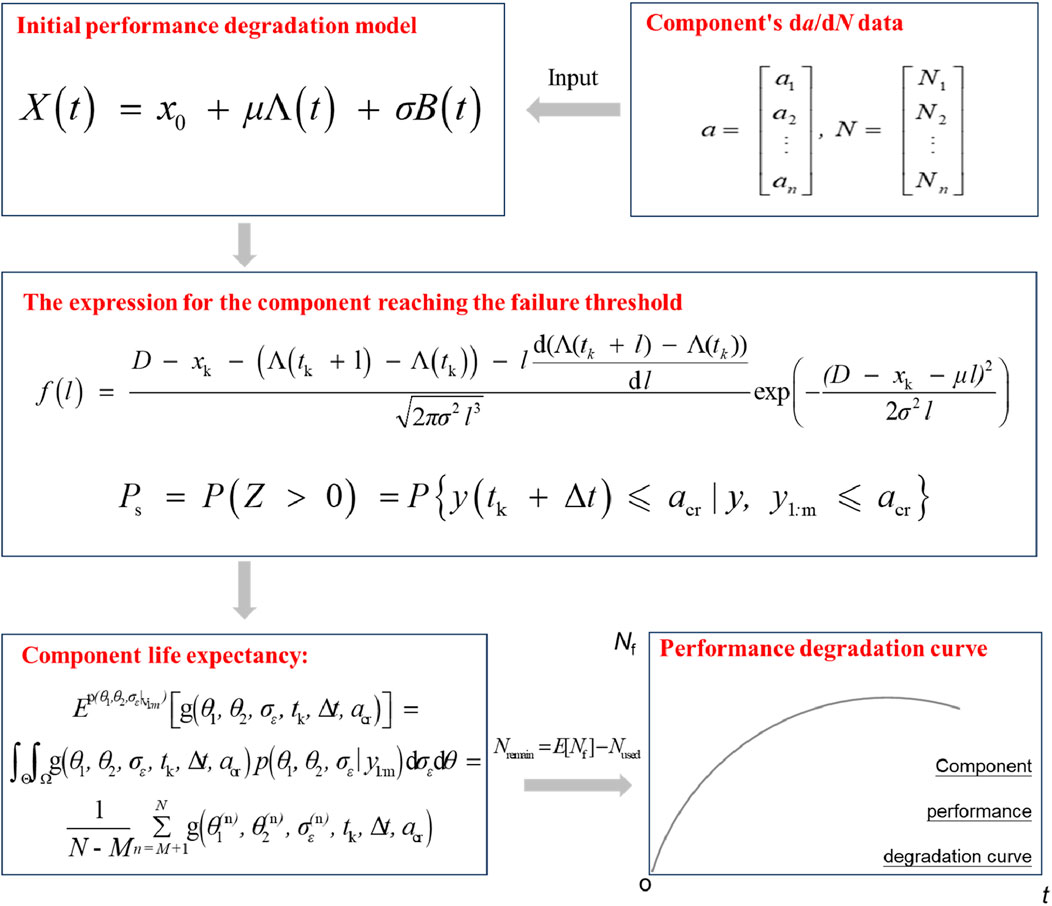
Figure 6. Component structural degradation model establishment process.
In this equation, X(t) represents the actual degradation level of the component at time t, and x0 denotes the initial degradation state. The term Λ(t) is a deterministic function of time that characterizes the drift component in the stochastic process. It is typically used to describe the trend effect accumulated over time due to external conditions or internal mechanisms. When Λ(t) takes a linear form (e.g., Λ(t) = t), it indicates that the system’s drift grows at a constant rate over time. If it adopts a nonlinear or integral form, it can capture more complex time-dependent evolution patterns. Unlike the random perturbation term B(t), the value of Λ(t) is fixed and predictable at any given time, reflecting the deterministic part of the system’s evolution. Here, μ is the drift coefficient, σ is the diffusion coefficient, and B(t) represents standard Brownian motion. Furthermore, based on the two upper main bearing wall da/dN models derived from the scaled model and the SENB specimens presented in Section 3, we use the da/dN data to predict the structural degradation behavior of the component and assume the Equation 11:
Substituting the a and N data obtained from the component test into the Wiener model, the likelihood function and the log-likelihood function of the component’s nonlinear function are respectively as Equations 12, 13:
In the formula,
Therefore, the probability density function expression f(l) of the Wiener model reaching the threshold and the reliability function (Ps) are respectively as Equations 15, 16:
In the formula, D is the failure threshold corresponding to the fracture failure of the component. Based on the obtained f(l) of the component, the expected (E) of the component at different times can be obtained, and its formula is as Equation 17:
In this equation, E represents the expected lifetime of the component, which quantifies the remaining service life from the current state to the failure state. By calculating the expected lifetime, the time-dependent relationship of the remaining life can be determined. Visualizing this relationship enables the construction of the structural structural degradation curve. This curve clearly illustrates the decreasing trend of structural performance over time during service, providing a theoretical basis and quantitative support for remaining life prediction and maintenance decision-making. Finally, based on the predicted Nf at different time points, two structural degradation models of the upper main bearing wall, derived from the scaled model and the SENB specimens, are plotted and designated as Dscale and DSENB, respectively.
4.2 Accuracy verification of the structural degradation model for the main bearing wall
To validate the accuracy of the structural degradation model for the main bearing wall established in this study based on the scaled model, an accuracy verification study was conducted as follows. First, evaluation criteria were determined. This section employs the root mean square error (RMSE), coefficient of determination (R2), mean absolute relative error (MARE), and mean absolute error (MAE) as evaluation metrics for the structural degradation model. The formulas for these metrics are as Equations 18–21:
Second, structural degradation evaluation was conducted. The accuracy of the scaled model was verified by comparing the structural degradation models Dscale and DSENB—derived from the scaled model and the SENB specimen, respectively—with the actual structural degradation behavior of the main bearing wall obtained in Section 2.3.
5 Results and discussion
5.1 Microscopic failure mechanism of the main bearing wall
Accurate determination of the actual FCP mode in the upper main bearing wall of diesel engine cylinders is of critical importance for enhancing the precision of structural degradation monitoring. Accordingly, this section presents a comprehensive microstructural characterization study of the upper main bearing wall following the experimental procedures detailed in Section 2.4.
Figures 7a–d respectively illustrate the fracture surface morphology and microstructural characteristics of the upper main bearing wall. Initial macroscopic examination (Figure 7a) reveals that the fracture surface exhibits characteristically flat morphology. Quantitative analysis indicates significant grain coarsening at the fracture zone. Furthermore, pronounced flake graphite segregation and markedly increased pearlite interlamellar spacing are observed, both of which are typical morphological features associated with instantaneous fracture. Microscopic analysis (Figures 7b–d) of three distinct regions located 3 mm, 6 mm, and 18 mm from the crack initiation site demonstrates consistent plastic deformation within the matrix material. The fracture surfaces in these regions predominantly exhibit dimple rupture features, indicative of ductile fracture mechanisms.
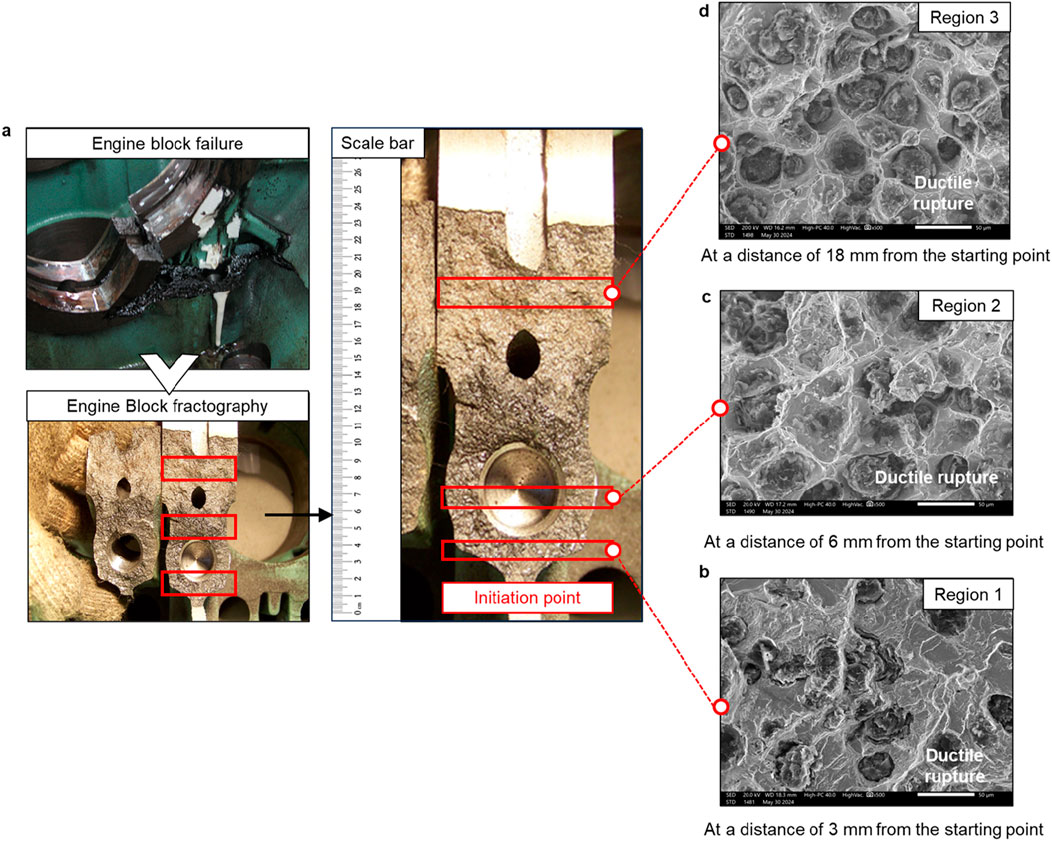
Figure 7. Microstructure analysis of the main bearing wall in a diesel engine cylinder block. (a) Macroscopic fracture of the main bearing wall. (b,c) Microstructure of the fracture at distances of 3 mm (b), 6 mm (c), and 18 mm (d) from the starting point.
Based on the combined macro- and microstructural evidence, we conclusively identify the fracture mode of the upper main bearing wall as primarily ductile fracture characterized by dimple rupture. These findings provide crucial experimental evidence for understanding the failure mechanisms of the upper main bearing wall and significantly contribute to improving the accuracy of structural degradation monitoring.
5.2 ΔKth and da/dN curves of the upper main bearing wall
The accuracy of the ΔKth and da/dN curves of the upper main bearing wall directly determines the precision of its da/dN model, thereby influencing the prediction accuracy of its structural degradation. Therefore, this section employs a scaled model that comprehensively considers the structural and loading factors of the upper main bearing wall to conduct three sets of repeated FCP tests, thereby obtaining accurate ΔKth and da/dN curves. Additionally, SENB specimens are introduced for comparison to elucidate the influence of structural and loading factors on FCP results (Carpiuc-Prisacari et al., 2017; Erdogan and Sih, 1963; Irwin, 1957; Leung and Su, 1995; Zhu et al., 2021).
Figure 8 sequentially presents the da/dN curves and ΔKth of the three scaled models and SENB specimens in the full FCP stage and near-threshold region. As shown in Figure 8, the da/dN curves of the three scaled models are significantly lower than those of the SENB specimens in both the full FCP and near-threshold regions. Moreover, the ΔKth values of the scaled models are notably higher than those of the standard SENB specimens. This indicates that, under the same testing conditions, the scaled models exhibit stronger resistance to crack propagation. The primary reason for this is that the FCP path in the scaled models is influenced by their geometric shape and load distribution, resulting in a more tortuous crack path. This tortuous FCP path significantly increases the energy consumption of crack propagation, thereby slowing the crack growth rate in the scaled models (Harris and Patel, 2017). Furthermore, Kim and Park (2018) and Zhang and Lee (2015) have pointed out that the local strengthening effects of complex structures and the discontinuities in material microstructure can significantly enhance the crack propagation resistance of components under actual loading conditions by influencing crack growth behavior. This further underscores the necessity of fully considering the actual geometric features and loading conditions of components during FCP experiments to improve the accuracy of da/dN and ΔKth measurements.
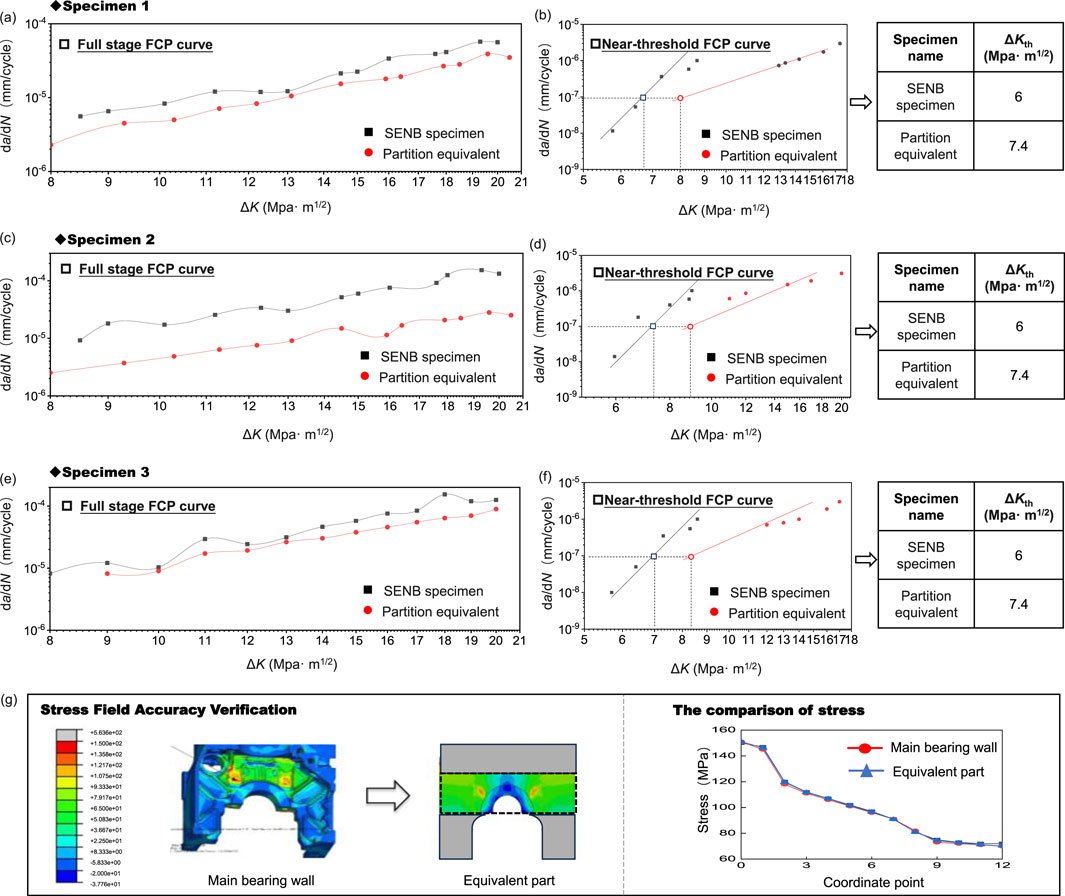
Figure 8. da/dN curves and ΔKth of three identical scaled models and SENB specimens in the full FCP region (a,c,e) and near-threshold region (b,d,f) and stress field (g).
5.3 Scale model accuracy verification
To ensure the accuracy of the micro-failure mechanism results for the upper main bearing wall obtained using the scaled model, this section follows the procedures described in Section 2.5 to validate the accuracy of the equivalent model by assessing the consistency between the test results of the upper main bearing wall and its equivalent component. In addition, the results from standard SENB specimens, which consider only material properties, are compared with the actual characteristics of the upper main bearing wall to highlight the limitations of conventional ISO specimen testing methods.
Figures 8a–f shows the da/dN curves of the upper main bearing wall and its equivalent parts, as well as the SENB specimens. The calculated da/dN curves of the upper main bearing wall and its equivalent parts have small errors, while the SENB specimens show the opposite. Figure 8g displays the stress field of the upper main bearing wall and its equivalent parts. As can be seen from Figure 8, the stress fields of both are highly consistent. Therefore, the scaled model has high equivalence and can be used to study the microscopic failure mechanisms.
5.4 da/dN model for the main bearing wall
The accuracy of the da/dN model for the upper main bearing wall is crucial for the precise prediction of its structural degradation. Additionally, the structural and loading factors of the upper main bearing wall significantly influence its FCP behavior. Therefore, to enhance the prediction accuracy of the structural degradation of the upper main bearing wall, this section establishes a more accurate da/dN model based on the FCP data obtained from the scaled model in Section 5.2. For comparison, SENB specimens, which consider only material factors, are introduced to further elucidate the impact of structural and loading factors on the da/dN model. The formulas for the da/dN models of the three SENB specimens and the scaled model are as Table 2:
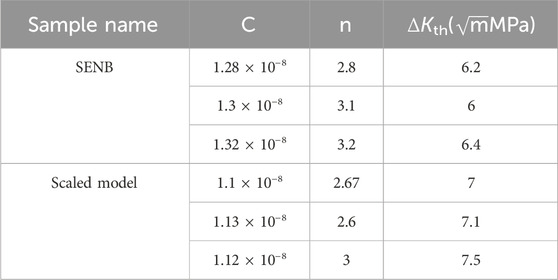
Table 2. da/dN models derived from three scaled models and SENB specimens.
By comparing the C, n, and ΔKth values from the three da/dN models derived from the two types of specimens, it is evident that, under the same precision, the C and n values of the three SENB specimens are greater than those of the scaled model, while their ΔKth values are smaller. This indicates that the da/dN rate of the scaled model is slower, suggesting stronger fatigue resistance of the material (Yang et al., 2024a; Wang et al., 2023; Teng et al., 2023; Li et al., 2024). This finding aligns with the results obtained in Section 5.2 (Barter et al., 2016; Ciavarella and Papangelo, 2018; Zhang et al., 2023; Oh, 2023). Additionally, to facilitate subsequent analysis of the structural degradation model, this section calculates the average values of the da/dN model formulas for the three SENB specimens and the scaled model. The resulting da/dN model formulas for the upper main bearing wall, derived from the scaled model and SENB specimens, are presented in Table 3.
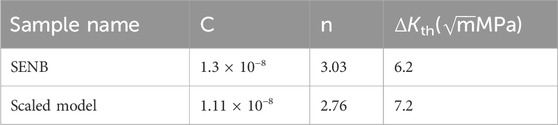
Table 3. da/dN models averaged from the scaled model and SENB specimens.
5.5 Establishment and validation of the structural degradation model for the main bearing wall
Since the scaled model incorporates the structural factors of the upper main bearing wall in the cylinder block, this section utilizes the da/dN model developed from the scaled model in Section 5.4 to predict the structural degradation of the upper main bearing wall, aiming to enhance prediction accuracy. For comparison, SENB specimens are introduced, and the structural degradation models derived from the DScale and DSENB are evaluated against DExperiment using metrics such as RMSE, R2, MARE, and MAE. This comparative study validates the accuracy of the DScale based on the scaled model.
Figures 9a–c compares the structural degradation predictions of the scaled model and SENB specimens for three different types of upper main bearing walls. As shown in Figures 8a–c, the DScale model derived from the scaled model exhibits closer agreement with the DExperiment than the DSENB model derived from SENB specimens. To further assess the accuracy of DScale, Table 4 presents the RMSE, R2, MARE, and MAE metrics for DSENB and DScale, based on the results from Figures 9a–c. The comparison of these four metrics demonstrates that DScale outperforms DSENB overall. This superiority is primarily attributed to the fact that DScale is constructed based on a scaled model that accounts for structural and loading effects. The modeling process not only considers the material properties of the upper main bearing wall but also fully incorporates the complexity of its structural and loading conditions (Wang and Zhang, 2016; Huang et al., 2022; Hosseini and Mahmoud, 1985). Consequently, the scaled model can more accurately simulate the stress distribution and local strengthening effects of the upper main bearing wall, thereby more precisely reflecting its structural degradation behavior under actual operating conditions (Jing et al., 2023; Shakeri et al., 2022). In contrast, DSENB only considers the material characteristics of the upper main bearing wall and fails to fully capture geometric discontinuities and local stress concentration effects (Yang et al., 2024b). As a result, DScale demonstrates higher precision in predicting the structural degradation of the upper main bearing wall, aligning more closely with experimental values and providing more reliable fatigue data for engineering applications.
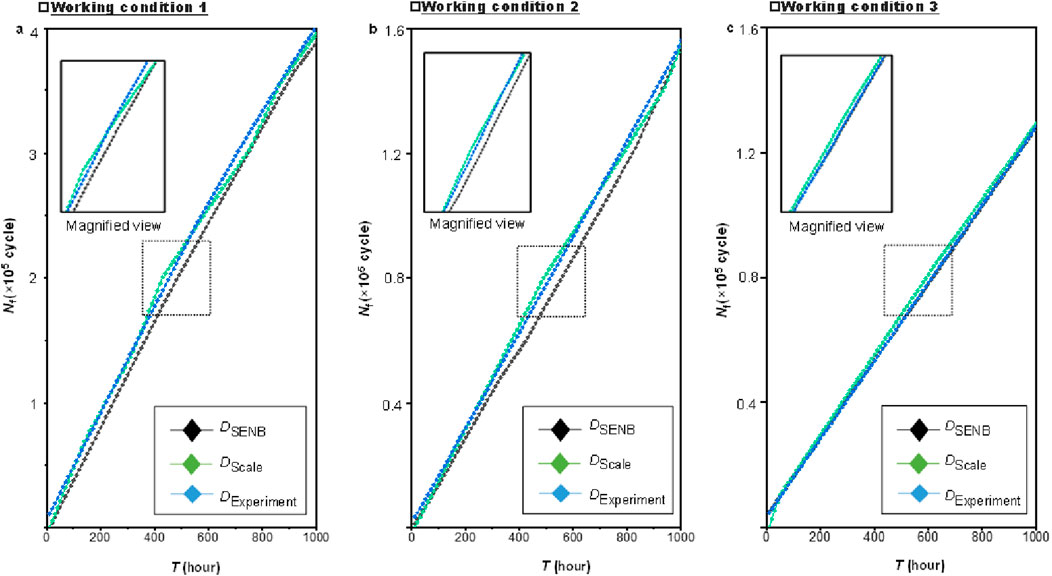
Figure 9. The structural degradation curves of the engine under three different operating conditions. (a) Comparison of performance degradation under operating condition 1. (b) Comparison of performance degradation under operating condition 2. (c) Comparison of performance degradation under operating condition 3.
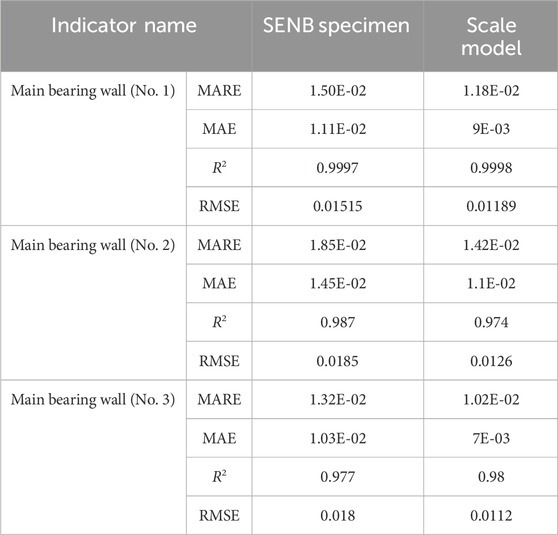
Table 4. Comparison of 4 indicators between SENB specimen and scale model.
6 Conclusion
To address the issue of insufficient consideration of structural and loading factors in existing FCP tests for the upper main bearing wall, which leads to low accuracy in structural degradation model evaluation, this study establishes an accurate da/dN model for the upper main bearing wall based on component scaling methods. Furthermore, it achieves precise assessment of the structural degradation behavior of the upper main bearing wall. The main conclusions are as follows:
1. Due to the complex structure of the upper main bearing wall, conducting FCP tests directly is challenging. This study conducts equivalent scaling research on the upper main bearing wall with the goal of maintaining identical stress fields before and after scaling. By performing da/dN and ΔKth tests on the scaled model, accurate da/dN data and ΔKth values for the upper main bearing wall are indirectly obtained, laying the foundation for the accurate establishment of the da/dN model and structural degradation model.
2. An accurate da/dN model for the upper main bearing wall is developed based on the measured da/dN data and ΔKth values, and it is compared with SENB specimens. The results show that, under the same testing conditions, the scaled model with a complex structure exhibits higher resistance to crack propagation. This difference is attributed to the more tortuous crack path caused by the complex geometry of the scaled model, which slows down the crack growth rate.
3. Based on the accurate da/dN model obtained from the scaled model, a structural degradation model that considers the structural and loading factors of the upper main bearing wall is established. Structural degradation predictions are conducted using this model, and comparisons are made with SENB specimens. Fatigue tests on the diesel engine cylinder block demonstrate that, under the same testing conditions, the structural degradation model derived from the scaled model predicts the structural degradation of the upper main bearing wall more accurately than the model derived from SENB specimens. At the same time, microscopic characterization of the fracture on the main bearing wall of the cylinder block reveals that the fracture mode of the main bearing wall is primarily ductile fracture dominated by dimple fracture.
This study significantly improves the accuracy of the da/dN model for the upper main bearing wall by employing component scaling technology, thereby enhancing the precision of structural degradation assessment. Based on these findings, reasonable maintenance strategies for critical components can be formulated, ensuring the safe operation of diesel engines and greatly improving the utilization efficiency of transportation vehicles such as cars, ships, and aircraft.
Data availability statement
The original contributions presented in the study are included in the article/supplementary material, further inquiries can be directed to the corresponding author.
Author contributions
WH: Conceptualization, Writing – original draft. CX: Investigation, Writing – original draft. ML: Conceptualization, Investigation, Software, Writing – original draft. YF: Conceptualization, Writing – original draft.
Funding
The author(s) declare that no financial support was received for the research and/or publication of this article.
Conflict of interest
Authors CX and ML were employed by Weichai Power Co. Ltd.
The remaining authors declare that the research was conducted in the absence of any commercial or financial relationships that could be construed as a potential conflict of interest.
Generative AI statement
The author(s) declare that no Generative AI was used in the creation of this manuscript.
Any alternative text (alt text) provided alongside figures in this article has been generated by Frontiers with the support of artificial intelligence and reasonable efforts have been made to ensure accuracy, including review by the authors wherever possible. If you identify any issues, please contact us.
Publisher’s note
All claims expressed in this article are solely those of the authors and do not necessarily represent those of their affiliated organizations, or those of the publisher, the editors and the reviewers. Any product that may be evaluated in this article, or claim that may be made by its manufacturer, is not guaranteed or endorsed by the publisher.
References
American Society for Testing and Materials (2014). ASTM E647-13a: Standard test method for measurement of fatigue crack growth rates. West Conshohocken, PA: ASTM International.
ASTM E766-14 (2019). Standard practice for calibrating the magnification of a scanning electron microscope.
Barter, S., White, P., and Burchill, M. (2016). Fatigue crack path manipulation for crack growth rate measurement. Eng. Fract. Mech. 167, 224–238. doi:10.1016/j.engfracmech.2016.04.020
Brown, T., and Smith, K. (2017). Economic analysis of maintenance costs in online monitoring systems for structural components. J. Struct. Health Monit. 15 (4), 457–468.
Carpiuc-Prisacari, A., Poncelet, M., Kazymyrenko, K., Leclerc, H., and Hild, F. (2017). A complex mixed-mode crack propagation test performed with a 6-axis testing machine and full-field measurements. Eng. Fract. Mech. 176, 1–22. doi:10.1016/j.engfracmech.2017.01.013
Ciavarella, M., and Papangelo, A. (2018). On the distribution and scatter of fatigue lives obtained by integration of crack growth curves: does initial crack size distribution matter? Eng. Fract. Mech. 191, 111–124. doi:10.1016/j.engfracmech.2018.01.019
Correia, J. A. F. O., Raposo, P., Muniz-Calvente, M., Blasón, S., Lesiuk, G., De Jesus, A. M. P., et al. (2017). A generalization of the fatigue kohout-věchet model for several fatigue damage parameters. Eng. Fract. Mech. 185, 284–300. doi:10.1016/j.engfracmech.2017.06.009
Erdogan, F., and Sih, G. C. (1963). On the crack extension in plates under plane loading and transverse shear. J. Basic Engng 85, 519–525. doi:10.1115/1.3656897
Harris, M., and Patel, P. (2017). The impact of structural geometry on fatigue crack growth thresholds in metallic components. Int. J. Fatigue 101, 289–300.
Hosseini, A., and Mahmoud, M. A. (1985). Evaluation ofstress intensity factor and fatigue growth of surface cracks in tension plates. Eng. Fract. Mech. 22, 957–974. doi:10.1016/0013-7944(85)90036-0
Huang, J., Wang, H., Zhou, L., Zhu, Z., Deng, Z., and Deng, A. (2022). Analysis of stress intensity factor for a crack emanating from elliptical hole subjected to compressive stress and shear stress. Theor. Appl. Fract. Mec. 120, 103413–108442. doi:10.1016/j.tafmec.2022.103413
Hutchinson, C. (2023). Resistance to fatigue. Nat. Mater 22, 1163–1164. doi:10.1038/s41563-023-01666-2
Irwin, G. (1957). Analysis of stresses and strains near the end of a crack traversing a plate. J. Appl. Mech. 24: 361–364. doi:10.1115/1.4011547
Jing, G., Li, S., Xiao, S., Ma, T., Lyu, Z., Sun, S., et al. (2023). Research on fatigue reliability assessment of engine cylinder head based on neural network. Int. J. Fatigue 175, 107800. doi:10.1016/j.ijfatigue.2023.107800
Kieser, G., and Xie, X. (2002). The importance of crack growth threshold in fatigue crack propagation. Eng. Fract. Mech. 69 (9), 1025–1034.
Kim, S., and Park, J. (2018). Influence of local strengthening and microstructural discontinuities on crack propagation in complex structures. Mater Sci. Eng. A 712, 402–412.
Langari, J., Aliakbari, K., Masoudi Nejad, R., and Kamel Abbasnia, S. (2023). Failure analysis of CK45 steel crankshaft in light truck diesel engine. Eng. Fail Anal. 145, 107045. doi:10.1016/j.engfailanal.2022.107045
Leung, A. Y. T., and Su, R. (1995). A numerical study of singular stress field of 3D cracks. Finite Elem. Anal. Des. 18, 389–401. doi:10.1016/0168-874x(94)00065-n
Li, F., Wen, Z., Luo, L., Yue, Z., Zang, Z., Li, M., et al. (2024). Fatigue life estimation of nickel-based single crystal superalloy with different inclined film cooling holes: initial damage quantification and coupling of damage-fracture mechanics models. Int. J. Plast. 176, 103967. doi:10.1016/j.ijplas.2024.103967
Molaei, R., Fatemi, A., Sanaei, N., Pegues, J., Shamsaei, N., Shao, S., et al. (2020). Fatigue of additive manufactured Ti-6Al-4V, part II: the relationship between microstructure, material cyclic properties, and component performance. Int. J. Fatigue 132, 105363. doi:10.1016/j.ijfatigue.2019.105363
National Technical Committee for Standardization of Internal Combustion Engines (2018). JB/T 13203-2017 diesel engine cylinder block fatigue test method.
Oh, G. (2023). Notch fatigue fracture and crack growth behaviors on a steel sheet under out-of-plane bending. Eng. Fract. Mech. 279, 109062. doi:10.1016/j.engfracmech.2023.109062
Petrović, A., Ignjatović, D., Sedmak, S., Milošević-Mitić, V., Momčilović, N., Trišović, N., et al. (2021). Model analysis of bucket wheel excavator SchRs 630 strength. Eng. Fail Anal. 126, 105451. doi:10.1016/j.engfailanal.2021.105451
Ren, S., and Liu, Z. (2025). Accurate evaluation of fatigue life and study of initial crack effects in diesel engine cylinder blocks based on an accurate crack propagation model. Eng. Fract. Mech. 320, 111058. doi:10.1016/j.engfracmech.2025.111058
Ren, S., Liu, Z., Yan, R., Liu, L., Du, Y., Zhang, W., et al. (2024). Efficient and accurate determination of crack propagation rate without unloading-induced crack closure. Measurement 243, 116301. doi:10.1016/j.measurement.2024.116301
Shakeri, I., Danielsen, H. K., Tribhou, A., Fæster, S., Mishin, O. V., and Eder, M. A. (2022). Effect of manufacturing defects on fatigue life of high strength steel bolts for wind turbines. Eng. Fail Anal. 141, 106630. doi:10.1016/j.engfailanal.2022.106630
Suresh, S., and Morton, D. A. (1993). Fatigue crack propagation near threshold in cast iron. Eng. Fract. Mech. 44 (3), 425–438.
Teng, X. Y., Pang, J., Liu, F., Zou, C., Gao, C., Li, S., et al. (2023). Fatigue strength optimization of gray cast iron processed by different austempering temperatures. Int. J. Fatigue 175, 107831. doi:10.1016/j.ijfatigue.2023.107831
Wang, L., and Zhang, Y. (2016). Impact of stress equivalence on the accuracy of fatigue life predictions in engineering structures. Int. J. Fatigue 89, 210–219.
Wang, C. Q., Xiong, J. J., Shenoi, R. A., Liu, M. D., and Liu, J. Z. (2016). A modified model to depict corrosion fatigue crack growth behavior for evaluating residual lives of aluminum alloys. Int. J. Fatigue 83, 280–287. doi:10.1016/j.ijfatigue.2015.10.023
Wang, Z., Shi, Y., Yang, X., and Shi, D. (2023). Low-cycle fatigue performance and life prediction of a P/M nickel-based superalloy with artificial surface defect at elevated temperature. Eng. Fract. Mech. 294, 109725. doi:10.1016/j.engfracmech.2023.109725
Wei, F., Wang, J., Peng, Y., Tan, H., Wang, Y., Qi, Y., et al. (2023). Microstructure and mechanical properties of an ultra-high strength steel fabricated by laser hybrid additive manufacturing. Mat. Sci. Eng. 885, 145594. doi:10.1016/j.msea.2023.145594
Xu, J., Wang, K., Ma, Q., Li, H., Wang, P., Chen, R., et al. (2023). Study on acoustic emission properties and crack growth rate identification of rail steels under different fatigue loading conditions. Int J Fatigue 172, 107638. doi:10.1016/j.ijfatigue.2023.107638
Yang, R., Yin, Z., Yan, Y., Ou, J., Xie, T., Liu, Z., et al. (2024a). Investigating the effect of ammonia addition on the performance of a heavy-duty natural gas spark ignition engine operated at stoichiometric conditions. J. Energy Resour. Technol. 15, 1–24.
Yang, R., Liu, J., Liu, Z., and Liu, J. (2024b). Applying separate treatment of fuel-and air-borne nitrogen to enhance understanding of in-cylinder nitrogen-based pollutants formation and evolution in ammonia-diesel dual fuel engines. Sustain Energy Technol. Assess. 69, 103910. doi:10.1016/j.seta.2024.103910
Yarullin, R. R., Yakovlev, M. M., Boychenko, N. V., and Lyadov, N. M. (2024). Effect of mixed-mode loading on surface crack propagation in steels. Eng. Fail Anal. 295, 109717. doi:10.1016/j.engfracmech.2023.109717
Zhang, Y., and Lee, C. H. (2015). Influence of structural complexity on fatigue crack growth thresholds in engineering components. Eng. Fract. Mech. 134, 96–108.
Zhang, P., Li, J., Zhao, Y., and Li, J. (2023). Crack propagation analysis and fatigue life assessment of high-strength bolts based on fracture mechanics. Sci. Rep. 13, 14567. doi:10.1038/s41598-023-41804-z
Zhang, C., Wan, R., He, J., Yu, J., and Zhao, Y. (2024). Non-stationary vibration fatigue life prediction of automotive components based on long short-term memory network. Int. J. Fatigue 187, 108459–1123. doi:10.1016/j.ijfatigue.2024.108459
Zhao, W., and Li, H. (2015). Challenges in real-time data processing: noise interference and signal filtering techniques. IEEE Trans. Signal Process 63 (14), 3765–3778.
Keywords: diesel engine cylinder block, structural degradation, structural and load factors, crack growth rate model, crack growth threshold, scaling method
Citation: Huang W, Xu C, Liu M and Fu Y (2025) Accurate prediction of structural degradation in diesel engine cylinder blocks based on component scaling methods. Front. Aerosp. Eng. 4:1604213. doi: 10.3389/fpace.2025.1604213
Received: 01 April 2025; Accepted: 28 August 2025;
Published: 05 November 2025.
Edited by:
Vittorio Memmolo, University of Naples Federico II, ItalyReviewed by:
Xuming Niu, Nanjing University of Aeronautics and Astronautics, ChinaLorenzo Esposito, University of Naples Federico II, Italy
Copyright © 2025 Huang, Xu, Liu and Fu. This is an open-access article distributed under the terms of the Creative Commons Attribution License (CC BY). The use, distribution or reproduction in other forums is permitted, provided the original author(s) and the copyright owner(s) are credited and that the original publication in this journal is cited, in accordance with accepted academic practice. No use, distribution or reproduction is permitted which does not comply with these terms.
*Correspondence: Weiqing Huang, MTUxNTM0OTA0NTZAMTYzLmNvbQ==