 Janet N. Obanyi1
 Joshua O. Ogendo1
 Richard M. S. Mulwa1
 Jane G. Nyaanga1
 Erick K. Cheruiyot1
 Philip K. Bett2
 Steven R. Belmain3
 Sarah E. J. Arnold3,4
 Victoria C. Nash-Woolley3,5
 Philip C. Stevenson3,6*
- 1Department of Crops, Horticulture and Soils, Egerton University, Egerton, Kenya
- 2Department of Biological Sciences, Egerton University, Egerton, Kenya
- 3Natural Resources Institute, University of Greenwich, Chatham, United Kingdom
- 4Agriculture Health and Environment, NIAB East Malling, East Malling, United Kingdom
- 5Crop Health and Protection, York, United Kingdom
- 6Trait Diversity and Function, Royal Botanic Gardens, Kew, Richmond, United Kingdom
Introduction: Populations of natural enemies of insect pests are declining owing to agricultural intensification and indiscriminate use of pesticides, and this may be exacerbated in agricultural systems that clear all margin plants after the cropping season for other uses such as fodder. Retaining a diversity of non-crop flowering vegetation outside the cropping season may support more resilient and effective natural pest regulation.
Methods: We tested the potential for non-crop vegetation to support natural enemies in fields across two locations after harvesting the primary crops of lablab and maize.
Results: A total of 54 plant species were recorded across the sites in Kenya with 59% of them being annuals and 41% perennials. There was a significant seasonal variation in plant species richness (ANOVA: F1, 16 = 33. 45; P< 0.0001) and diversity (ANOVA: F1, 16 = 7.20; P = 0.0511). While time since harvesting was a significant factor influencing the overall abundance of natural enemies (ANOVA: F2, 1,133 = 8.11; P< 0.0001), they were generally higher in abundance in locations with margin plants or where a diversity of margin plants was observed.
Discussion: These findings demonstrate that flowering plants in agricultural systems offer refuge and alternative food for natural enemies and potentially other beneficial insects between cropping seasons. The conservation of natural enemies between crops may lead to more effective natural pest regulation early in the following crop, thus reducing reliance on insecticides application.
1 Introduction
The effective use of natural pest regulation as an alternative to conventional pesticides requires conservation and effective management of landscapes to support natural enemies that move into crop fields targeting pest insects (Sorribas et al., 2016; Hatt et al., 2017). Natural or seminatural flowering plants adjacent to croplands can be preserved or planted to enhance cropland, but the outcomes are often crop- and system-dependent (Landis et al., 2000; Perović et al., 2010; Ochieng et al., 2022; Obanyi et al., 2023). Natural enemies may obtain nectar, refuge, and other prey from non-crop vegetation, enhancing their abundance and effectiveness in pest management (Bianchi and Wäckers, 2008). Beneficial arthropod populations, such as natural enemies and pollinators, have suffered significant reduction as a result of agricultural intensification characterized by indiscriminate pesticide use and reduction in suitable foraging and nesting habitats (Tscharntke et al., 2005; Zhao et al., 2021). In a study by Lundgren (2009), the fecundity of female predatory and parasitic arthropods was attributed to the amount of food available at the adult stage. In the absence of flowering plants, the female parasitic wasps may reabsorb eggs and devote more energy to host seeking and survival decreasing their ability to reproduce (Kishinevsky et al., 2017). Therefore, cropping systems that include complete removal of biomass at harvest create conditions that hinder resilient and effective natural enemy populations, thus reducing their potential to control pests (Nilsson et al., 2016). Crop harvesting causes rapid changes in the structure of habitats, making agroecosystems unstable for natural enemies (Obanyi et al., 2023).
There are several groups of natural enemies known to provide control of aphid insect pests (Schmidt et al., 2003). These include parasitic wasps and larvae of syrphid flies, which feed on the aphids exerting natural control of aphids in the fields. The parasitic wasps are highly specific because they are able to locate aphid colonies from a greater distance via “alarm signals” emitted by an infested plant. After locating the aphid, the wasps use their ovipositor to lay eggs (oviposit) into the aphid’s abdomen where they grow inside and kill the aphid. More generalist natural enemies that also prey on aphids include carabid and staphylinid beetles and spiders, which mainly colonize plants from the ground (Schmidt et al., 2003). The other important natural enemies for aphids include lady beetles, lacewings, big-eyed damsel, and minute pirate bugs. These are predators and directly consume or feed on one or more aphid species (Dixon, 2000; Desneux and Ramirez-Romero, 2009). In addition, birds represent the top predators of insects in many agricultural systems (Milligan et al., 2016). Adult hoverflies and some lacewings feed on nectar and pollen so floral resources are important although some lacewings also feed on soft-bodied insects such as aphids (Samaranayake and Costamagna, 2019). The ladybird beetles are common biological control agents of aphids in natural field settings. They delay and prevent aphid outbreaks and densities (Heimpel and Asplen, 2011). They regulate aphid populations as they are voracious with good searching ability, high predation capacity of both adults and larvae stages, and high reproductive rates (Amorós-Jiménez et al., 2012). The carabids are typically polyphagous; however, they are also voracious feeders, consuming close to their own body mass in food daily. They have specialized feeding habits and feed mostly on bean aphids that fall to the ground.
Although certain invertebrate species have evolved a wide range of adaptive mechanisms in response to changes in habitat structure (Langellotto and Denno, 2004; Gavish-Regev et al., 2008), studies conducted by Opatovsky and Lubin (2012) showed that small crop-inhabiting arthropods such as spiders may be less able to adjust to unexpected changes in habitat quality as a result of harvest, while migratory vertebrates may seek shelter in nearby non-crop habitats. Furthermore, the study indicated that most insect pests adapt to these changes in habitat structure by having short life cycles that are synchronized with the cropping season. However, natural enemies such as predators and parasitoids tend to have longer life cycles than seasonal crop growth cycles or may need to complete some generations outside the cropping season, prompting the need to assess the availability of non-crop habitats that can support these arthropod groups (Menalled et al., 2003). For example, Gurr et al. (2016) reported that ecologically engineered field margins in rice cropping systems using sesame plantings on rice bunds provided alternative prey and nectar for a parasitoid of the key rice pest the brown planthopper (Nilaparvata lugens) prior to the main rice crop that boosted populations of the natural enemy.
The distribution of natural enemies within fields changes throughout the crop’s growth cycles. Kishinevsky et al. (2017) reported higher parasitoid abundance at the beginning of the season within natural habitats compared to later in the growing season where more parasitoids were abundant within the crops. Similar seasonal patterns were demonstrated for spiders in desert wheat fields and were explained by the migration of spiders into the crop field throughout the season, combined with the high reproductive rates within the crop fields (Gavish-Regev et al., 2008). Conversely, at the end of the season when the crop is harvested and the field is left largely bare, there is less cover and fewer resources for natural enemies (Gavish-Regev et al., 2008; Opatovsky and Lubin, 2012). Changes within crop habitats may make them less suitable for arthropods and lead to either high mortality or to the dispersal of crop-dwelling arthropods into neighboring habitats.
Many natural enemies multiply in response to the availability of food; hence, there is a time lag between pests and natural enemy fluctuations. Natural enemies are highly mobile, and their movement in and out of the crop will depend on how far their refuges are and the availability of prey and food. Therefore, throughout the season, there will be fluctuation in population, hence the need to assess their dynamics at several crop stages (Zhao et al., 2013). It is worth remembering that as plant communities change, the associated organism species and population also change; in this case, as the crop stages and margin species change, so do the natural enemies and pests and this influences their succession and colonization (Chaplin-Kramer et al., 2011). The crop vegetation is short-lived and must be recolonized by natural enemies at the beginning of each crop season, meaning that maintaining viable natural enemy populations in non-crop habitat outside the growing system is important to achieve a reliable biocontrol without resorting to synthetic pesticides. To successfully build a suitable non-crop habitat, a detailed understanding of the distribution, diversity, and abundance of the plant species and how this links to plant–arthropod diversity after crop harvesting is vital. It is important that the non-crop habitat supports natural enemies preferentially over crop pests or the benefits of natural pest regulation may be limited. This study aimed to measure how the abundance and diversity of field margin plants supported the abundance of natural enemies of bean aphid (Aphis fabae) between cropping seasons in a legume crop, lablab (Lablab purpureus), under different agroecological conditions.
2 Materials and methods
2.1 Study sites
This study was conducted during February–April 2020 and January–March 2021 succeeding the main cropping seasons of May–December 2019 and March–November 2020, respectively, in 16 farmers’ fields in Kenya: eight in Njoro and eight in Rongai subcounties. Njoro subcounty is located at 0°10′–0°29′S and 34°7′–34°20′E with an altitude range of 2,000 to 2,500 meters above sea level (m.a.s.l). The annual rainfall range is 1,000 to 1,250 mm, and temperature ranges from 17°C to 30°C. Rongai is located at 0°10′–0°29′S and 34°7′–34°20′E with an altitude range of 1,480 to 1,550 m.a.s.l. The annual rainfall ranges between 750 and 1,000 mm and temperature ranges from 19°C to 32°C. The Njoro soils are well-drained dark reddish clays, classified as Mollic Andosols, whereas Rongai soils are well-drained sandy clay loams, classified as Vitric Andosols (Jaetzold et al., 2012).
2.2 Experimental design and treatment application
This study was conducted during February–April 2020 and January–March 2021 succeeding the main cropping seasons of May–December 2019 and March–November 2020, respectively, on experimental plots previously planted with lablab monocrop and maize–lablab intercrop on plots measuring 10 m × 10 m with a natural field margin vegetation along at least two sides of the plot (Supplementary Resource 1). There were a total of 16 farms, eight farms each from the two locations, and each farm represented a replicate. The field margin vegetation along the harvested crop was at least 5 m in width and 2 m away from the harvested experimental plots. Each of the harvested plots for the two cropping methods was evaluated as a treatment.
2.3 Sampling of natural enemies of bean aphids (Aphis fabae)
The sampling of the natural enemies was done in field margins alongside the harvested experimental plots that were either planted with lablab monocrop or lablab–maize intercrop, both common cropping approaches in the region. Sampling was done for 3 months after harvesting the field crops. Trapping of natural enemies was conducted using yellow pan traps for ground-dwelling insects and yellow sticky cards and sweep nets for flying insects. Sticky and pan traps were set up at the field margins of each plot. We used pan and sticky traps to sample natural enemies as they have been widely adopted as efficient and effective approaches to field sampling (Thant et al., 2016; Shweta and Rajmohana, 2018). In addition, pan and sticky traps can be placed and collected easily and can trap a wide range of insect taxa throughout the placement period.
A total of four (two sticky and two pan) traps were placed at the margin vegetation for each treatment spaced at 5 m from one trap to another, and the width of the field margin was not exceeding 5 m. The landscape of the study area was composed mostly of grasses, broadleaved annual weeds, and woody vegetation. The woody vegetation was mainly preserved as either natural fence or windbreaks by the farmers. Woody vegetation consisted of trees and tall shrubs which were remnants of existing vegetation, were natural plant dispersal, or established through direct plantings by farmers. In collecting natural bean aphid natural enemies using the pan trapping method, two yellow plastic pans measuring 20 cm in diameter and 5 cm high (manufacturer: Kenpoly Manufacturers Limited, Nairobi, Kenya) were placed at the ground level. They were filled with a premixed liquid solution containing 250 ml of water, 5 g of salt to preserve the natural enemies, and 5 ml of odorless liquid detergent to break the surface tension of the water. The traps were left in the field for 48 h. Thereafter, the trapped insects were retrieved by sieving and washing with clean water. The insects were picked from the sieve using a camel hairbrush and placed in 50 ml plastic falcon tubes filled with 25 ml of 75% ethanol for preservation before being taken to the laboratory. The insects were placed under a dissecting microscope (Leica ZOOM 2000 Inc., Buffalo, NY, USA 14240-0123) at ×200 magnification for counting and identification up to the family level using Simon and Schuster’s identification key (Arnett and Jacques, 1981).
Sticky trap sampling was performed by hanging two yellow sticky cards (8 cm width × 24 cm length) (manufacturer: Real IPM, Kenya) 1 m above the ground level next to the pan traps in the field margin vegetation adjacent to the harvested plots of the two cropping systems. The sticky traps were later collected from the field after 48 h, placed in non-sticky lamination pouches of 25 cm × 10 cm, and taken to the laboratory for identification at the family level. Sweep net sampling was used to capture the natural enemies in the field margins according to Spafford and Lortie (2013). Sampling involved moving forward along the field margin vegetation and making 10 sweeps parallel within the margin. The sweep net bag was closed immediately, and the insects caught were carefully transferred to a jar containing cotton wool soaked with formalin where they were left for 2 h. The preparation and identification of the insects were the same as for pan and sticky trapping. The sampling of the natural enemies was done four times during the off-season period.
2.4 Sampling of the plant species abundance and richness
The experimental farm fields were left bare after harvesting lablab and lablab–maize intercrop and were not considered during sampling. However, this may not be the case since most of the smallholder farmers plant cover crops for soil conservation and fertility improvement purposes after harvesting. The composition of individual plant species was determined from 3 × 1 m2 quadrat along the field margin. Plant species abundance and richness were determined by counting the number of individual plant species within the quadrat which were identified to the species level using pictorial aids (e-library), and authentic identification was done by a plant taxonomist at the Department of Biological Science, Egerton University.
2.5 Bean aphids during the cropping season
During the cropping season, data on aphid abundance, damage severity, and percent incidence were collected. Across the 16 farms, each farm was considered a replicate that had lablab monocrop and maize–lablab intercrop with a natural field margin along at least two sides of the plot. Bean aphid infestation levels were only scored on lablab as the main crop for this study. Aphid abundance and damage severity were collected from 10 randomly selected lablab plants from the inner five rows in each replicate. Aphid abundance was scored using a standard and widely adopted categorical scale, where 1 = no aphids, 2 = 1–100, 3 = 101–300, 4 = 301–600, 5 = 601–1,000, and 6 = >1,000 (Aken et al., 2013; Mkenda et al., 2015). The severity of damage was determined by visually observing and scoring the level of damage on the selected plants. Again, this is a widely adopted and used approach using a scoring scale of 1 to 5, where 1 = no infestation or damage; 2 = light damage and infestation, <25% plant parts damaged or infested; 3 = average damage and infestation, 26%–50% plant parts damaged; 4 = high infestation and damage, 51%–75% plants parts damaged showing yellowing of the lower leaves; and 5 = severe infestation, >75% damage resulting to plants with high infestation levels with yellow and severely curled leaves or dead plant (Mkenda et al., 2015). The incidence of aphids was determined by visually examining and counting the number of aphid-damaged/infested plants by randomly sampling 30 plants from the inner five rows.
2.6 Lablab grain yield
Lablab grain yield was recorded at physiological maturity when pods turned brown. The pods were harvested separately from the middle rows falling within a sampling area of 36 m2 for each treatment. The harvested lablab pods were sun-dried and threshed with the moisture content recorded using a digital moisture meter (manufacturer: Dramiński S.A., Poland). At 13% moisture content, grains from each treatment were weighed separately using a portable digital scale (manufacturer: Comglobal Solutions, India) and converted to kg ha−1 using the following formula:
2.7 Data analysis
Data on plant species and natural enemy counts were subjected to arcsine and square root transformation, respectively, to correct for heterogeneity of treatment variances. For plant species, the unit for calculations was the number of plants counted 1 month after harvesting the lablab crop. For natural enemies, the unit for calculations was the number of natural enemy groups caught using sticky traps, pan traps, and sweep nets at different months post-harvesting the lablab crop. To determine the extent and how field margin vegetation conserve bean aphid natural enemies outside the lablab main growing season, a species diversity index was calculated. To establish the diversity of either natural enemies or margin plants, two of the most used indices, that is Shannon–Wiener index and Simpson’s species diversity, respectively, were adopted to quantify the diversity indices for each category. The diversity of the natural enemies was determined using the Shannon–Wiener index of diversity (H) calculated at the family level to assess landscape influence on the abundance of insect predators. While we acknowledge that calculating diversity indices based on family-level determinations introduces a degree of uncertainty in our measures of natural enemy diversity, it was not possible to identify all insects to the species level owing to the geographic region not being comprehensively researched. Previous studies have, however, demonstrated that the calculation of H, at the family level, is an appropriate proxy for species-level H (Osborne et al., 1980; Zou et al., 2020) and is more practical when data sets are large or the ecosystem is understudied. Field margin plant species diversity was determined using Simpson’s species diversity index.
The effects of cropping season, location, month after harvesting, and their interactions with natural enemy population, species richness, and diversity were subjected to analysis of variance (ANOVA) using the procedure for the general linear model in SAS Institute version 9.4 (SAS Institute, 2011). Similarly, the effects of season, location, and their interaction with margin plant populations, species richness and diversity, aphid infestation, and grain were subjected to ANOVA. The treatment means were separated using Tukey’s honestly significant difference (HSD) test at P< 0.05. A simple linear correlation was carried out to determine the relationships between the diversity of margin plants and populations of natural enemy months after the crop harvest.
3 Results
3.1 Abundance and diversity of plant species at the field margins
A total of 54 plant species were recorded from the field survey across Njoro and Rongai during the study periods. There was a significant seasonal variation for plant species richness (ANOVA: F1, 16 = 33.45; P< 0.0001) and species diversity (ANOVA: F1, 16 = 7.20; P = 0.0511) (Table 1). A higher species richness was observed during 2021 across the farms in Njoro (12.3) and Rongai (13.9) as compared with 2020 (Njoro: 5.8; Rongai: 6.9). Although there was a significant difference in species richness and diversity due to location, on average, farms in Rongai had higher species richness and diversity compared with Njoro during both the 2020 and 2021 off-cropping seasons (Table 1).
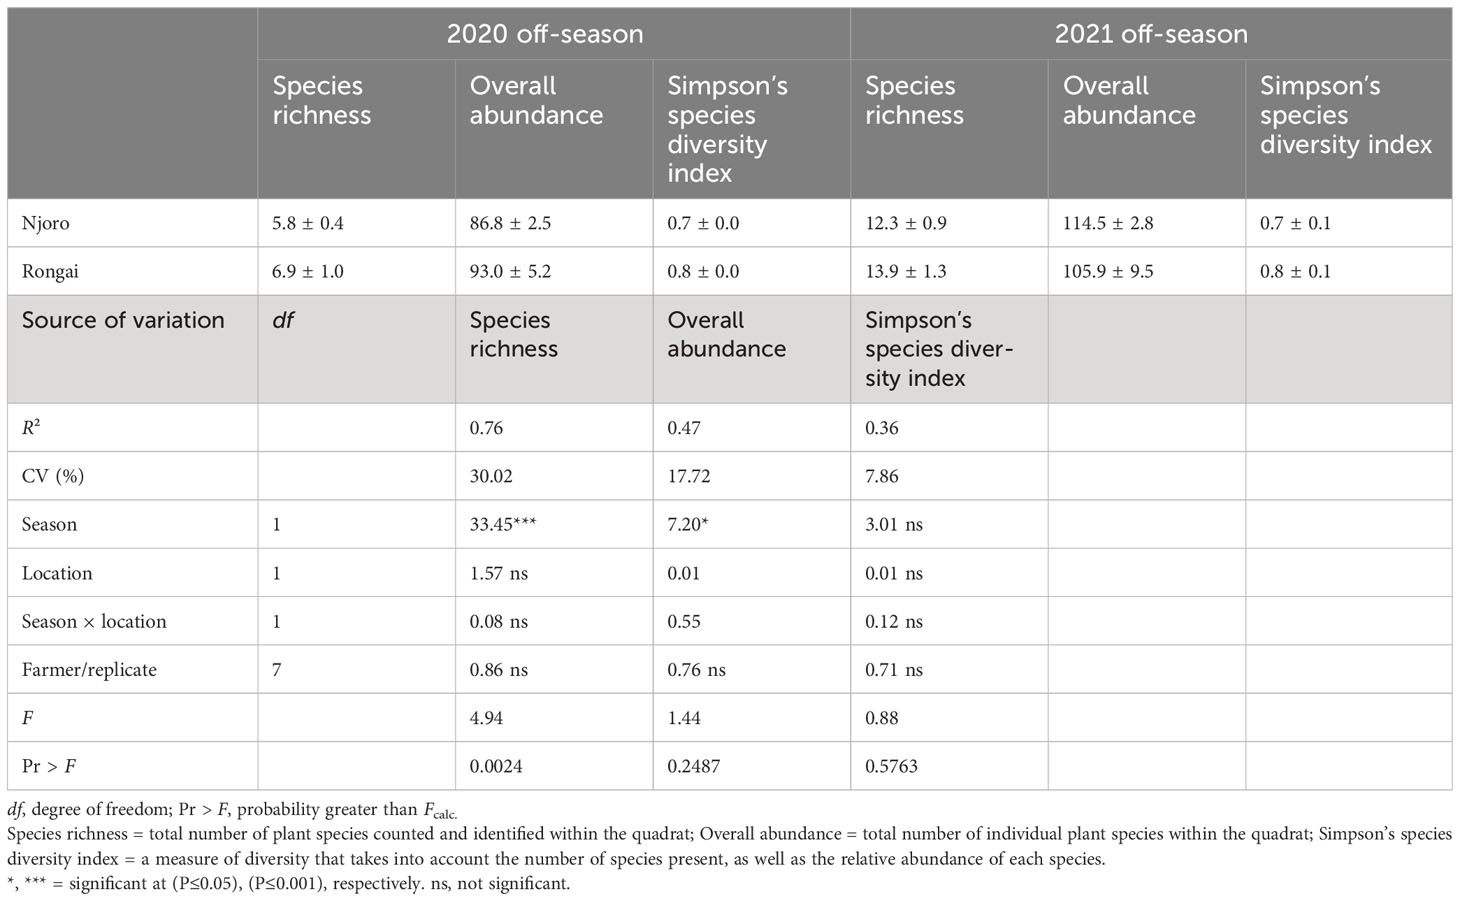
Table 1 Plant species richness, overall abundance, and Simpson’s species diversity index in Njoro and Rongai during the 2020 and 2021 January to April off-cropping seasons.
Across all farms, 59% of the margin species were annuals and 41% were perennials. In Njoro, the annual species were the most abundant in the 2020 off-cropping season compared with perennials during the same period (Figure 1). In Rongai, perennial plant species were more abundant than annuals during the 2020 off-cropping season. During the 2021 season, a low abundance of the plant species was observed across the two locations. Rongai had a lower abundance of perennial plant species (5%) compared with Njoro (6%). Annual plants across the two locations were at 8% during the 2021 off-season (Figure 2). In Njoro and Rongai during the 2020 and 2021 off-seasons, the plant species abundance is shown in Tables 2 and 3, respectively.

Figure 1 Bean aphid abundance, damage severity, and percent incidence (mean ± SE) in Njoro and Rongai locations during the 2019 and 2020 cropping seasons.

Figure 2 Mean abundance (counts per quadrat) of plant species in Njoro and Rongai during the 2020 and 2021 off-cropping seasons. Vegetation type here means the life cycle of plant species within the margins. Abundance = number of individual plant species within the quadrat.
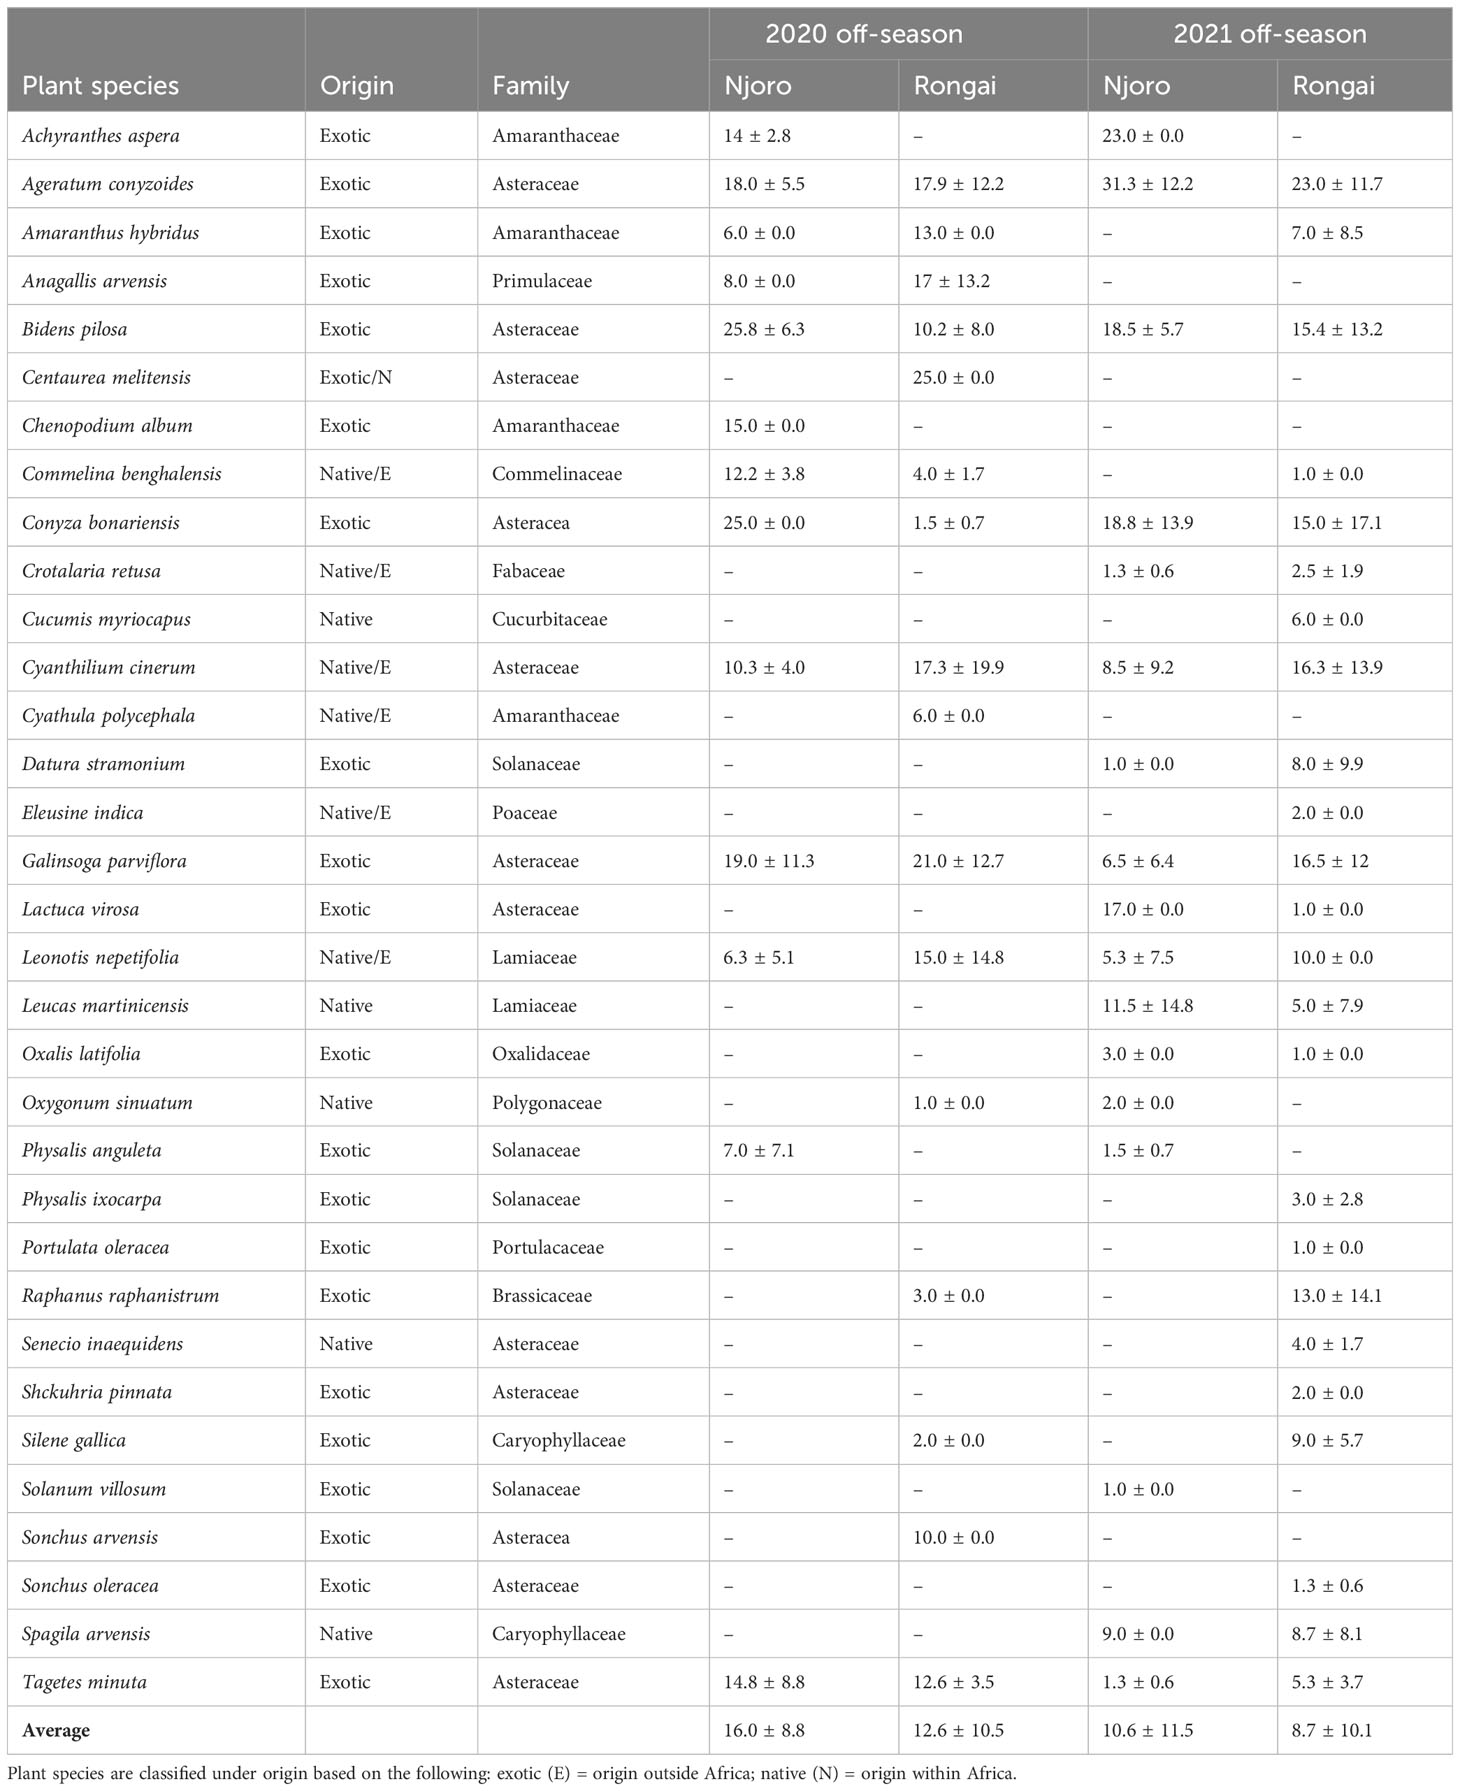
Table 2 Number (mean ± SE) of annual field margin plants at Njoro and Rongai during the 2020 and 2021 off-seasons (January–March).
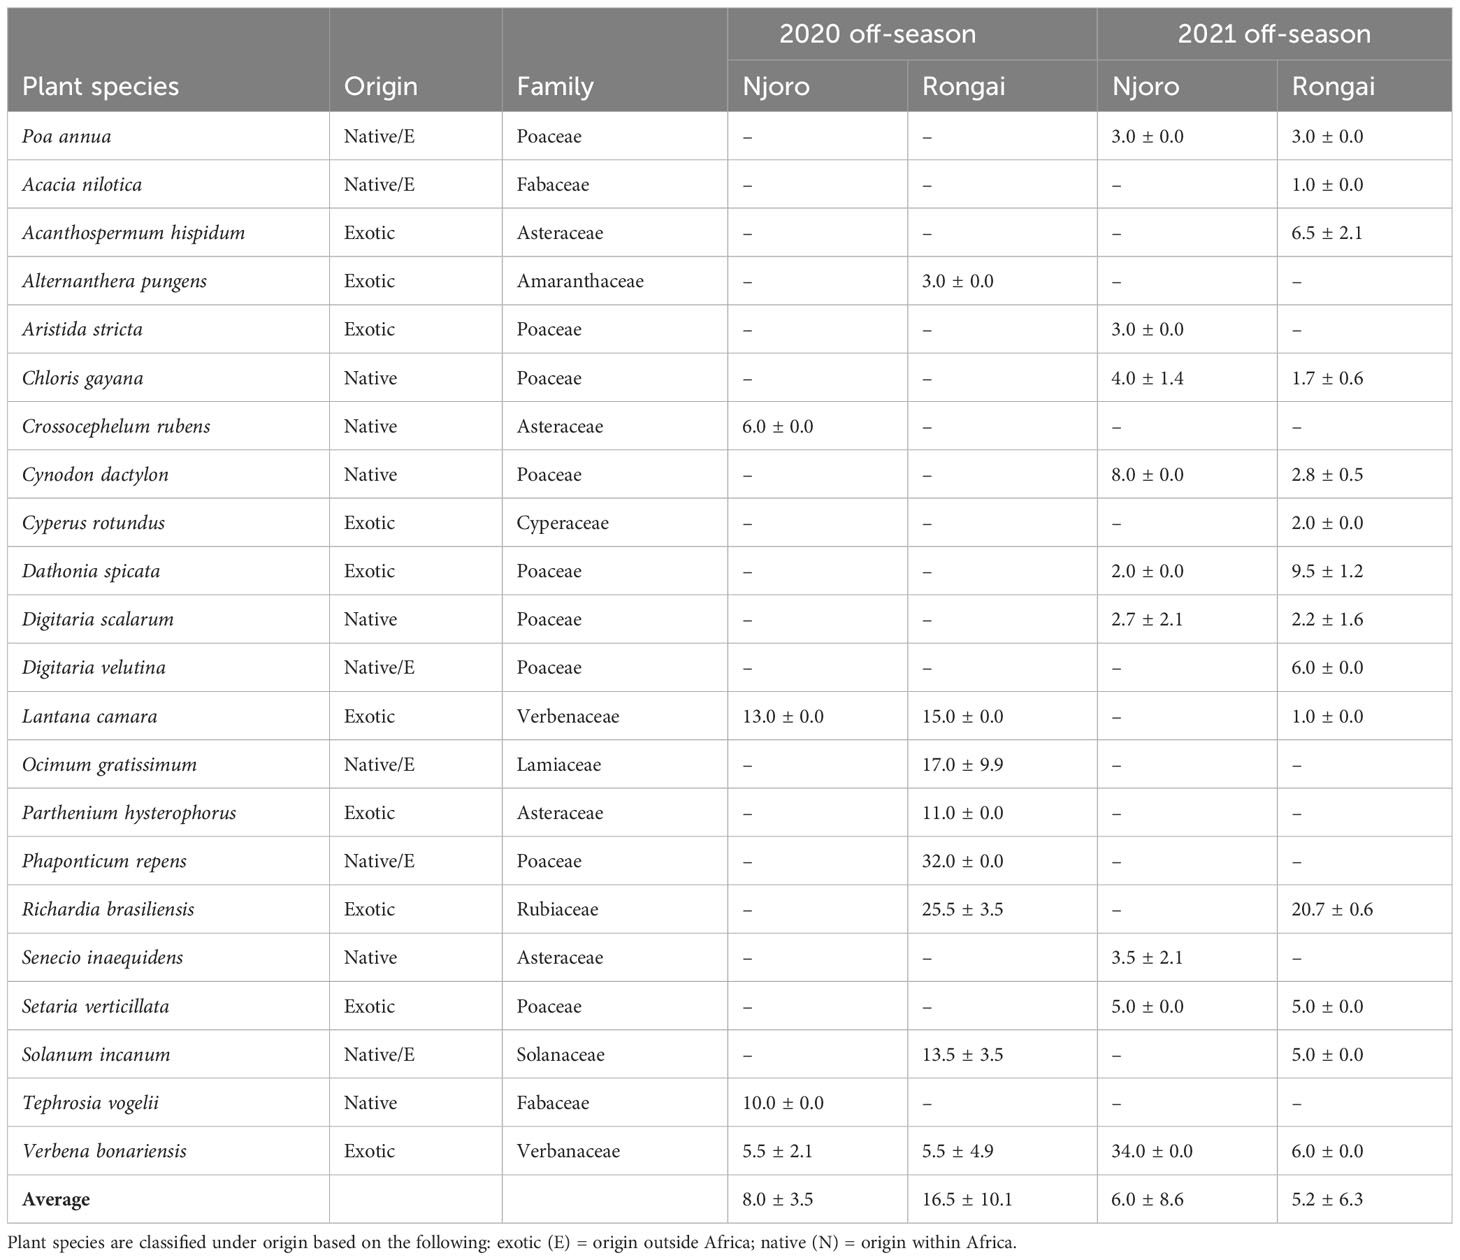
Table 3 Number (mean ± SE) of perennial field margin plants in Njoro and Rongai during the 2020 and 2021 off-cropping seasons (January–March).
3.2 Distribution, abundance, and richness of natural enemies during off- and on-cropping seasons
The abundance of natural enemies changed over time after harvest (ANOVA: F2, 1,133 = 8.11; P< 0.0001). Natural enemy abundance did not differ significantly between the two locations or between 2020 and 2021 (ANOVA: F1, 1,133 = 1.26; P = 0.262). The interaction between season × location × months after harvest was not significant for the overall abundance of NEs in the field margin (ANOVA: F1, 1,133 = 0.10; P = 0.905) (Table 4).
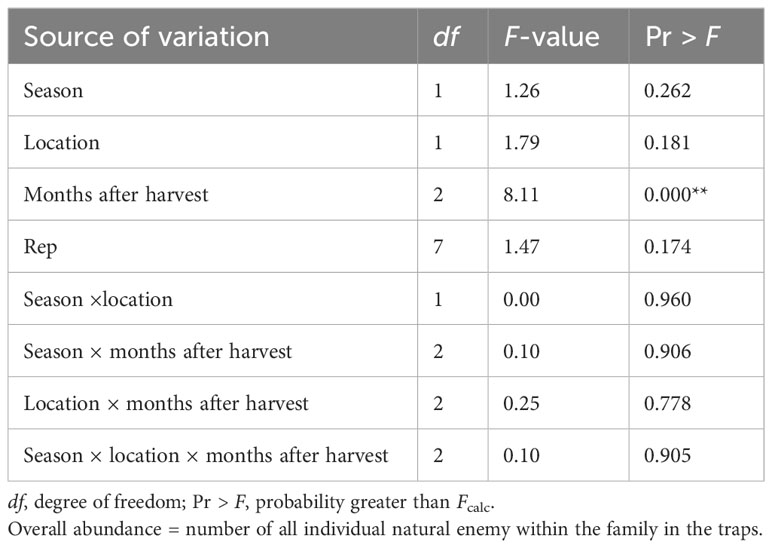
Table 4 Analysis of variance for overall abundance of natural enemies captured in Njoro and Rongai during the 2020 and 2021 off-seasons.
A total of 9,355 potential natural enemies of bean aphids belonging to nine families were collected across the two locations in the 2020 and 2021 off-seasons. During the 2020 off-cropping season, 4,859 individuals were collected, with Njoro having 2,511 and Rongai 2,348. In relation to the individual count of trapped insects, in Njoro over the 3 months after harvesting, the highest natural enemy numbers were collected 2 months after harvesting (999) and the lowest at the third month (673). In Rongai, a similar trend was observed where the highest NEs were collected at the second month (900) and the lowest at the third month (562). During the 2021 off-season, a total of 4,496 individuals were collected. Njoro had a total of 2,393 with the highest NEs collected at the second month (957) and the lowest at the third month (621). In Rongai, a total of 2,103 individuals were collected with the highest NEs at the second month (822) and the lowest at the third month (546) (Table 5).
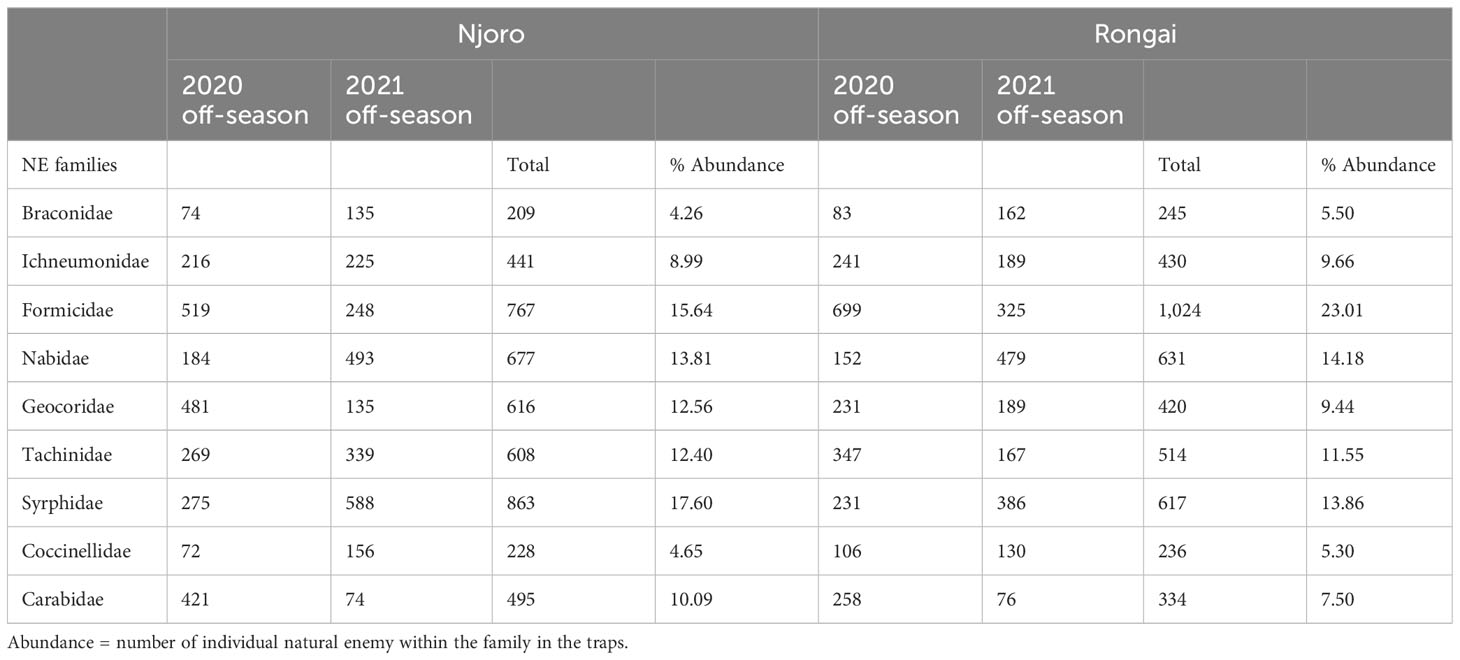
Table 5 Natural enemy abundance: the total number of families captured in Njoro and Rongai during the 2020 and 2021 off-cropping seasons.
In the two locations, the species that were most abundant changed over the cropping seasons (Figure 3). The most common species were from families that are known to bean aphid specialists such as Syrphidae, Nabidae, and Tachinidae. During on-season, natural enemies were most abundant at the lablab flowering stage. Lablab monocrop had the highest abundance across all growth stages (Table 6).
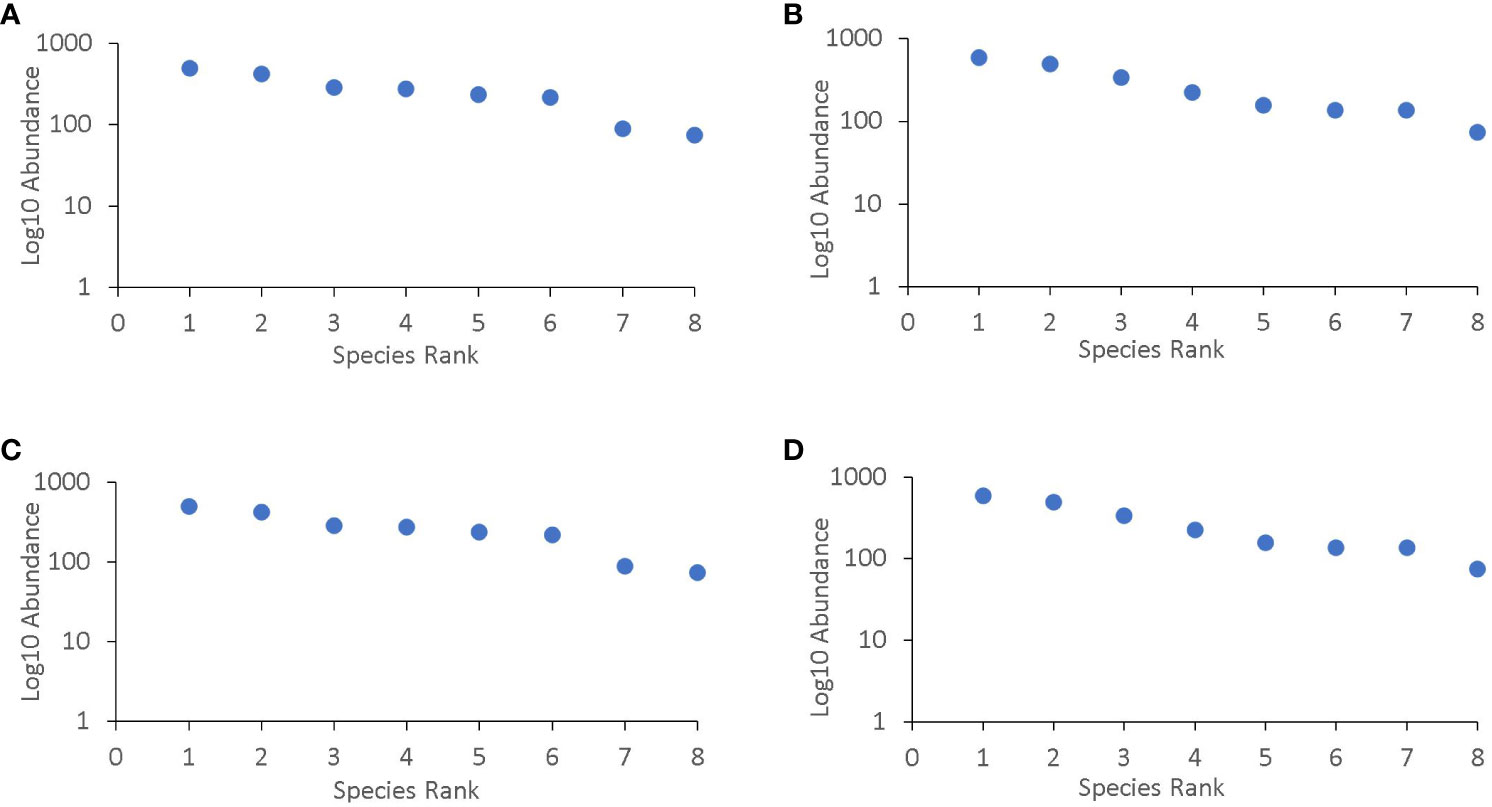
Figure 3 Species group rank abundance curve for (A) Rongai during 2020, (B) Rongai during 2021, (C) Njoro during 2020, and (D) Njoro during 2021 off-seasons. Rongai 2020 off-season species rank: Tachinidae = 1, Carabidae = 2, Ichneumonidae = 3, Geocoridae = 4, Syriphidae = 5, Nabidae = 6, Coccinellidae = 7, Braconidae = 8; Rongai 2021 off-season species rank: Nabidae = 1, Syriphidae = 2, Ichneumonidae = 3, Geocoridae = 4, Tachinidae = 5, Braconidae = 6, Coccinellidae = 7, Carabidae = 8; Njoro 2020 off-season species rank: Geocoridae = 1, Carabidae = 2, Syriphidae = 3, Tachinidae = 4, Ichneumonidae = 5, Nabidae = 6, Coccinellidae = 7, Braconidae = 8; Njoro 2021 off-season species rank: Syriphidae = 1, Nabidae = 2, Tachinidae = 3, Ichneumonidae = 4, Coccinellidae = 5, Braconidae = 6, Geocoridae = 7, Carabidae = 8.
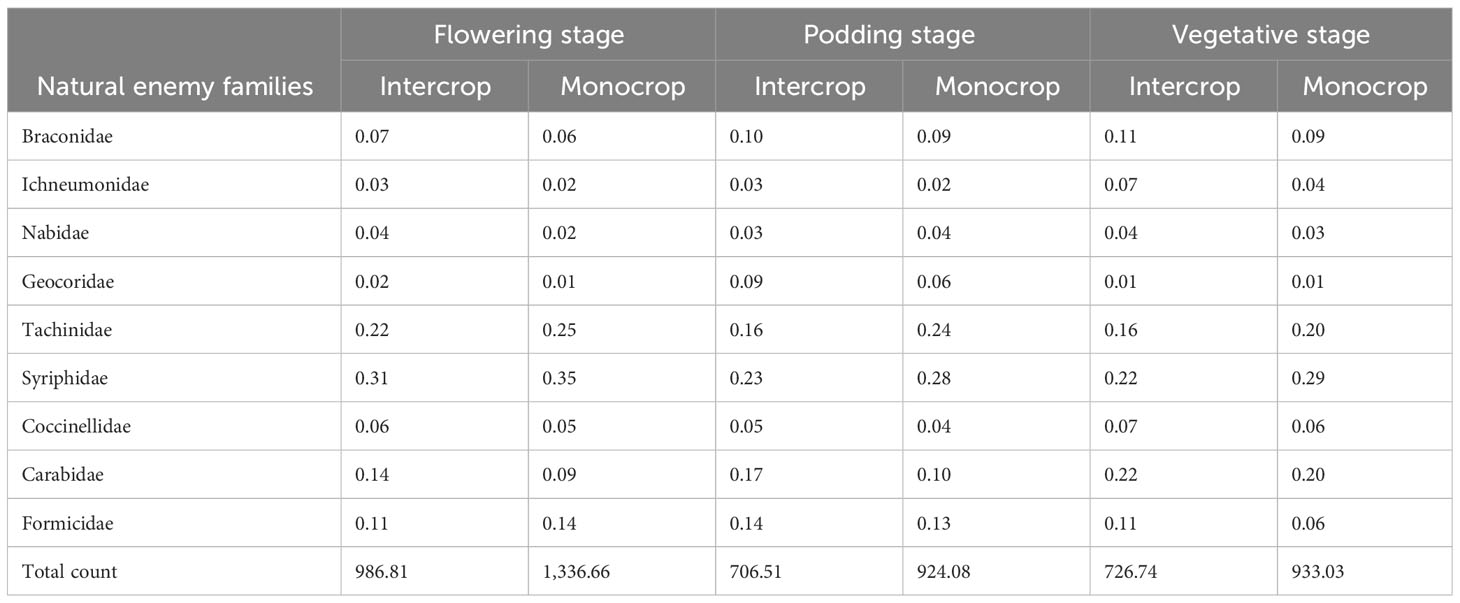
Table 6 Relative abundance of bean aphid natural enemies during on-season in lablab monocrop and lablab–maize intercrop.
3.3 Pearson correlation of field margin plants and natural enemy during off- and on-cropping seasons, aphid abundance, and lablab grain yield
Pearson correlation analysis showed a non-significant positive association for margin richness and margin abundance on natural enemy abundance off-season (P > 0.05) (Table 7). However, for plant diversity, there was a positive significant correlation for natural enemy abundance during the off-season (P = 0.002). Field margin richness had a positive significant association with natural enemy abundance during on-season. In addition, field margin richness had a negative significant association with aphid abundance (P = 0.04) and lablab grain yield (P = 0.01) (Table 7) (Supplementary Resources 2 and 3, respectively).
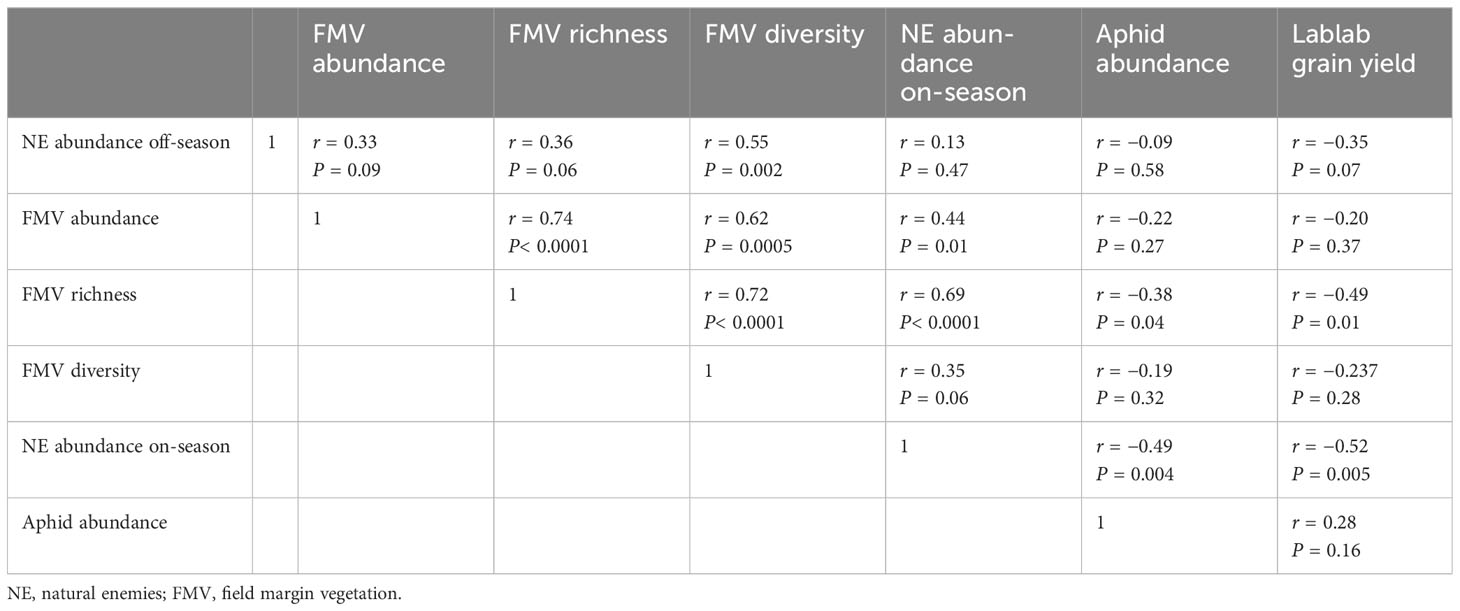
Table 7 Pearson correlation matrix between margin plants, natural enemies, bean aphids, and lablab grain yield.
3.4 Bean aphids and grain yield
Results showed that cropping season was significant for aphid abundance (ANOVA: F1, 892 = 131.50; P< 0.0001), damage severity (ANOVA: F1, 892 = 18.08; P< 0.0001), and percent incidence (ANOVA: F1, 892 = 227.23; P< 0.0001). In the 2019 cropping season, Njoro had the highest aphid abundance (245.4), damage severity (43.9), and percent incidence (9.1) compared with Rongai. In the 2020 cropping season, Rongai had a higher aphid abundance (45.5) compared with Njoro (34.8). For damage severity and percent incidence, Njoro was the highest—24.4 and 8.8, respectively—compared with Rongai (Figure 1). There was no significant interaction effect between location and cropping seasons (ANOVA: F1, 16 = 0.64; P = 0.43); however, Njoro had a higher grain yield of 1751.3 kg/ha and 1725.6 kg/ha for 2019 and 2020, respectively (Figure 4).
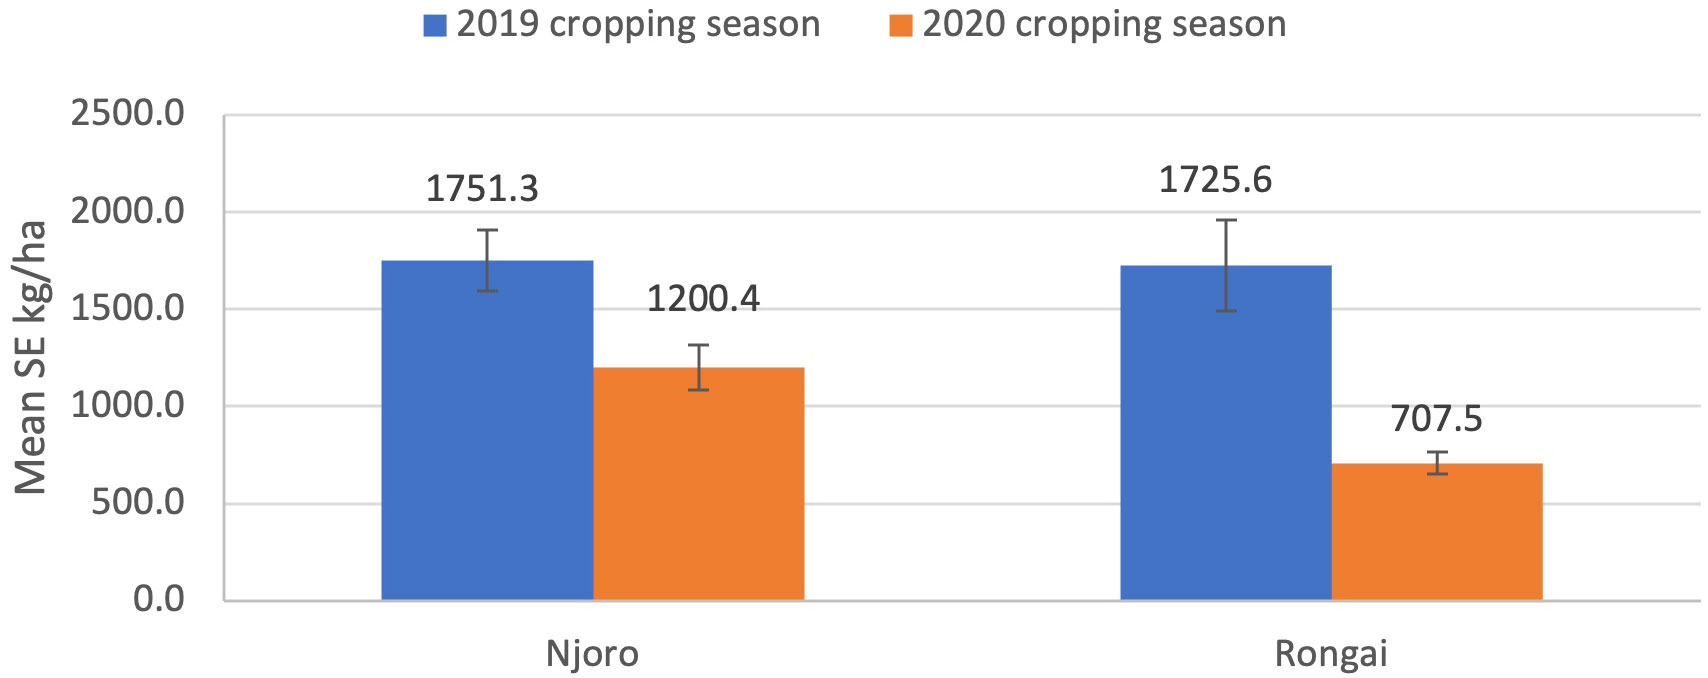
Figure 4 Lablab grain yield kg/ha (mean ± SE) in Njoro and Rongai locations during the 2019 and 2020 cropping seasons.
4 Discussion
The results from this study show that field margin habitats offer refuge for natural enemies and other beneficial insects outside the main cropping season. The data further demonstrate that plant species at crop borders may play a key role in supporting natural enemy biodiversity at the beginning of each growing season as the number of natural enemy groups increased in months after harvesting. Field margin plants and seminatural habitats can serve as biodiversity reservoirs, providing complementary resources and refuges for many natural enemies of pests (Fusser et al., 2017; Scott and Harmon-Threatt, 2021). These non-crop habitats are more often undisturbed, semipermanent, permanent, and/or regenerative in case the plants are multipurpose compared with crop fields that are frequently manipulated and disturbed (Holland et al., 2016; Amoabeng et al., 2020). Beneficial organisms which include natural enemies (predators and parasitoids) and pollinators require a stable habitat with resources (prey, pollen, and nectar) and shelter to sustainably deliver on natural pest regulation and pollination (Jado et al., 2019). Other studies from agricultural systems have highlighted the importance of continuity of resources to support beneficial insects, i.e., specifically ensuring that resources such as nectar, prey, and shelter are available year-round, not just when the crop is growing (Schellhorn et al., 2015). Many natural enemies multiply in response to the availability of food; hence, there is a “time lag” between pests and natural enemy fluctuations. Natural enemies are highly mobile, and their movement in and out of the crop will depend on how far their refuge places are and the availability of prey and food. Therefore, throughout the season, there will be fluctuations in population, hence the need to assess their dynamics at several crop stages (Zhao et al., 2013). It is worth remembering that as plant communities change, the associated organism species and population also change; in this case, as the crop stages and margin species change, so do the natural enemies and pest, and this influences their succession and colonization (Chaplin-Kramer et al., 2011).
A majority of work on biocontrol and agroecology has historically focused on temperate regions (Steward et al., 2014). As these regions usually experience a cool or cold winter, this tends to relieve pest pressure, as well as potentially reduce natural enemy populations, for several months of the year. Conversely, in tropical systems such as where lablab is grown in sub-Saharan Africa, even outside the cropping season, there is no comparable winter, and the ecology is typically influenced more by rainfall than temperature patterns. As a result, the role of off-season vegetation and refugia may be even more critical than in temperate systems, and yet, there is very little research exploring this aspect of the agroecosystem.
A higher number of natural enemies were observed in the second month after crop removal, suggesting the contribution of stable habitat in population buildup. This could be an indication that if the habitats were to remain undisturbed until the next crop cycle, relatively high numbers of natural enemies could be observed at the beginning of the crop season as described by Opatovsky and Lubin (2012) and Fountain (2022). Conservation biological control is a key strategy toward sustainable pest management with the main focus on enhancing diversity and populations of naturally occurring predatory and parasitic invertebrate taxa (Balzan et al., 2016). The presence of low numbers, the species richness, and the diversity of natural enemy groups at the onset of cropping seasons are less likely to regulate the pest population (Rusch et al., 2010).
Obanyi et al. (2023) used fluorescent dye applied to margin flowers to demonstrate that natural enemies moved from margins into the lablab crop, indicating that margin plants can provide resources or refuge for natural enemies. In the same study, colonization and population buildup were higher at the beginning of the season (vegetation stage) as the natural enemies came into the ecosystem. The natural enemy populations reduced as resources started declining at flowering and were very high at the podding stage as resources increased. Here, we observed higher natural enemy numbers in the field margins that led to more natural enemy in the crop field which is supported by other studies in crop–non-crop habitat interactions (Bertrand et al., 2016), and the higher natural enemy numbers in margin plants were correlated with increased pest management (Mkenda et al., 2019).
In this cropping system, it is likely that enhancing field margin vegetation will in turn support natural enemy populations at higher levels year-round and avoid bottlenecks in their population dynamics, which in turn can contribute to pest management (Obanyi et al., 2023). While lablab, during its flowering season, may provide nectar and pollen for beneficial insects in its own right (in common with other mass-flowering crops) (Holzschuh et al., 2013), outside the cropping season, these invertebrate species continue to need food sources and alternative prey and so are reliant on non-crop plants for prey, pollen, and nectar, such as from field margins. In a tropical system in particular, plant diversity will support a wider range of flowering phenology leading to continuity in resources where more species are present. Native and perennial plants may offer particular benefits as part of the assemblage (Cahenzli et al., 2019; Pfiffner et al., 2019). This could be the reason why the natural enemy populations were relatively uniform in abundance even though diverse in composition across the locations.
The composition of the natural enemy communities differed in Njoro and Rongai over the two off-seasons. Generally, flying insects were the most abundant compared with ground dwelling, most likely as a result of the sampling methods used or retained availability and population increase and survival in the habitat. During crop harvesting, the habitats are highly disturbed and insect families that detect the changes are bound to rapid changes and dispersal (Skirvin et al., 2011; Opatovsky and Lubin, 2012). Field margin plants and seminatural habitat are the immediate dwelling options for these arthropods (Mkenda et al., 2019; Arnold et al., 2021). The availability of these non-crop habitats ensures a rapid shift promoting arthropod dispersal from the disturbed crop fields. In farmers’ fields that were cleared immediately after harvesting, these clearance activities resulted in a simple habitat which supported only low numbers of natural enemies. This observation is supported by Cloyd (2020) who reported that the availability of diverse plant species at the field margins was a clear indicator of higher diversity and abundance of natural enemy at the onset of cropping season.
There was a seasonal variation in the abundance and species richness of plants across the study areas. This difference to a greater extent can be related to agricultural practices carried out in these regions. For instance, the Njoro region is classified as a high agricultural zone with intense agricultural activities compared with Rongai which had reduced agricultural activities due to prevailing climatic conditions. However, recommending particular plants for field margins can be difficult, as plants vary in their nutritional requirements and seasonality (Lahiru Ishan Samaranayake and Costamagna, 2019), and some can be secondary hosts to pests or crop diseases (Buck et al., 2023). Furthermore, many plant herbivores are controlled by natural enemies that are habitat generalists, which makes it difficult to identify their requirements (Sorribas et al., 2016). The inconsistent results perhaps could be attributed to either failure of field margin plants to provide the needed resources for the natural enemy community or competitive interactions among generalist predators (Fiedler and Landis, 2007; Ramsden et al., 2014; Karp et al., 2018).
5 Conclusion
Our study demonstrates that populations of agriculturally relevant natural enemies are boosted by plant-rich field margins outside the cropping period, and therefore, this habitat requires special consideration. In particular, banking natural enemies—particularly in warm climates where insect reproduction can take place year-round and beneficial populations can keep building—before a cropping season may protect the crop more effectively. Similarly, in temperate regions, the presence of natural enemies early in the season in organic arable farms reduces pressure from major insect pests of corn, soybean, and wheat (Costamagna et al., 2015; Yang et al., 2017; Gontijo, 2019). Therefore, measures to sustain natural enemies outside the cropping season could allow farms to enter the main cropping season with better baseline populations, meaning crop pests are controlled more rapidly and may take longer to build to an economically damaging threshold (Stoddard et al., 2010).
This study has demonstrated that farms with a higher abundance of non-crop vegetation in the off-season also have higher abundances of natural enemies, which can support pest management and improve yield as demonstrated by a previous work (Obanyi et al., 2023). The composition of the natural enemy communities shifts across the season, and dissecting the reasons for this and the practical consequences for agriculture will be important in tailoring management for sustainable lablab production in the future, especially in the face of the changing climate and land use in these regions.
Data availability statement
The raw data supporting the conclusions of this article will be made available by the authors, without undue reservation.
Ethics statement
The manuscript presents research on animals that do not require ethical approval for their study.
Author contributions
JOb: Data curation, Formal Analysis, Investigation, Writing – original draft, Writing – review & editing. JOg: Funding acquisition, Investigation, Project administration, Supervision, Writing – review & editing. RM: Data curation, Methodology, Supervision, Writing – review & editing. JN: Investigation, Methodology, Resources, Supervision, Writing – review & editing. EC: Methodology, Project administration, Resources, Supervision, Writing – review & editing. PB: Formal Analysis, Investigation, Methodology, Writing – review & editing. SB: Conceptualization, Data curation, Formal Analysis, Funding acquisition, Methodology, Supervision, Writing – review & editing. VN-W: Conceptualization, Formal Analysis, Methodology, Writing – review & editing. SA: Conceptualization, Formal Analysis, Methodology, Writing – review & editing. PS: Conceptualization, Funding acquisition, Investigation, Methodology, Project administration, Resources, Supervision, Writing – review & editing.
Funding
The author(s) declare financial support was received for the research, authorship, and/or publication of this article. This study was funded by UKRI-GCRF through NaPROCLA Project (Grant No. BB/R020361/1) to PS.
Acknowledgments
The authors thank the wider project team based at the University of Greenwich and Egerton University and the other team members at Nelson Mandela African Institution of Science and Technology, Tanzania and Lilongwe University of Agriculture and Natural Resources, Malawi. We are grateful to the farmers of Rongai and Njoro who allowed sampling to be carried out on their fields.
Conflict of interest
The authors declare that the research was conducted in the absence of any commercial or financial relationships that could be construed as a potential conflict of interest.
The author(s) declared that they were an editorial board member of Frontiers, at the time of submission. This had no impact on the peer review process and the final decision.
Publisher’s note
All claims expressed in this article are solely those of the authors and do not necessarily represent those of their affiliated organizations, or those of the publisher, the editors and the reviewers. Any product that may be evaluated in this article, or claim that may be made by its manufacturer, is not guaranteed or endorsed by the publisher.
Supplementary material
The Supplementary Material for this article can be found online at: https://www.frontiersin.org/articles/10.3389/fagro.2024.1277062/full#supplementary-material
References
Aken M. E., Fatokun C. A., Alabi O. Y. (2013). Screening for resistance to cowpea aphid (Aphis craccivora koch) in wild and cultivated cowpea (Vigna unguiculata L.) accessions. Int. J. Sci. Environ. Technol. 2 (4), 611–215. doi: 10.13140/2.1.4717.9207
Amoabeng B. W., Stevenson P. C., Mochiah B. M., Asare K. P., Gurr G. M. (2020). Scope for non-crop plants to promote conservation biological control of crop pests and serve as sources of botanical insecticides. Sci. Rep. 10 (1), 6951. doi: 10.1038/s41598-020-63709-x
Amorós-Jiménez R., Pineda A., Fereres A., Marcos-García M. Á. (2012). Feeding preferences of the aphidophagous hoverfly Sphaerophoria rueppellii affect the performance of its offspring. BioControl 59 (4), 427–435. doi: 10.1007/s10526-014-9577-8
Arnold S. E. J., Elisante F., Mkenda P. A., Tembo Y. L. B., Ndakidemi P. A., Gurr G. M., et al. (2021). Beneficial insects are associated with botanically rich margins with trees on small farms. Sci. Rep. 11 (1), 1–115. doi: 10.1038/s41598-021-94536-3
Balzan M. V., Bocci G., Moonen A. C. (2016). Landscape complexity and field margin vegetation diversity enhance natural enemies and reduce herbivory by lepidoptera pests on tomato crop. BioControl 61 (2), 141–545. doi: 10.1007/s10526-015-9711-2
Bertrand C., Baudry J., Burel F. (2016). Seasonal variation in the effect of landscape structure on ground-dwelling arthropods and biological control potential. Basic Appl. Ecol. 17 (8), 678–875. doi: 10.1016/j.baae.2016.07.007
Bianchi F. J., Wäckers F. L. (2008). Effects of flower attractiveness and nectar availability in field margins on biological control by parasitoids. Biol. Control 46 (3), 400–4085. doi: 10.1016/j.biocontrol.2008.04.010
Buck N., Fountain M. T., Potts S. G., Bishop J., Garratt M. P. D. (2023). The effects of non-crop habitat on spotted wing drosophila (Drosophila suzukii) abundance in fruit systems: A meta-analysis. Agric. For. Entomol. 25 (1), 66–765. doi: 10.1111/afe.12531
Cahenzli F., Sigsgaard L., Daniel C., Herz A., Jamar L., Kelderer M., et al. (2019). Perennial flower strips for pest control in organic apple orchards - A pan-European study. Agriculture Ecosyst. Environ. 278 (March), 43–53. doi: 10.1016/j.agee.2019.03.011
Chaplin-Kramer R., O’Rourke M. E., Blitzer E. J., Kremen C. (2011). A meta-analysis of crop pest and natural enemy response to landscape complexity. Ecology Letters 14 (9), 922–932. doi: 10.1111/j.1461-0248.2011.01642.x
Cloyd R. A. (2020). How effective is conservation biological control in regulating insect pest populations in organic crop production systems? Insects 11 (11), 1–15. doi: 10.3390/insects11110744
Costamagna A. C., Venables W. N., Schellhorn N. A. (2015). Landscape-scale pest suppression is mediated by timing of predator arrival. Ecol. Appl. 25 (4), 1114–1305. doi: 10.1890/14-1008.1
Desneux N., Ramirez-Romero R. (2009). Plant characteristics mediated by growing conditions can impact parasitoid’s ability to attack host aphids in winter canola. Journal of Pest Science 82 (4), 335–342. doi: 10.1007/s10340-009-0258-9
Dixon A. F. G. (2000). Expanding predator-prey theory for insects. Ecology 82 (3), 905. doi: 10.2307/2680210
Fiedler A. K., Landis D. A. (2007). Plant characteristics associated with natural enemy abundance at michigan native plants. Environ. Entomol. 36 (4), 878–886. doi: 10.1603/0046-225X(2007)36[878:PCAWNE]2.0.CO;2
Fountain M. T. (2022). Impacts of wildflower interventions on beneficial insects in fruit crops: A review. Insects 13 (3), 1–37. doi: 10.3390/insects13030304
Fusser M. S., Pfister S. C., Entling M. H., Schirmel J. (2017). Effects of field margin type and landscape composition on predatory carabids and slugs in wheat fields. Agriculture Ecosyst. Environ. 247 (June), 182–188. doi: 10.1016/j.agee.2017.06.030
Gavish-Regev E., Lubin Y., Coll M. (2008). Migration patterns and functional groups of spiders in a desert agroecosystem. Ecol. Entomol. 33 (2), 202–125. doi: 10.1111/j.1365-2311.2007.00958.x
Gontijo L. M. (2019). Engineering natural enemy shelters to enhance conservation biological control in field crops. Biol. Control 130, 155–163. doi: 10.1016/j.biocontrol.2018.10.014
Gurr G. M., Lu Z., Zheng X., Xu H., Zhu P., Guihua C., et al. (2016). Multi-country evidence that crop diversification promotes ecological intensification of agriculture. Nat. Plants 2 (3), 1–4. doi: 10.1038/NPLANTS.2016.14
Hatt Séverin, Mouchon P., Lopes T., Francis F. (2017). Effects of wildflower strips and an adjacent forest on aphids and their natural enemies in a pea field. Insects 8 (3), 99–108. doi: 10.3390/insects8030099
Heimpel G. E., Asplen M. K. (2011). A “Goldilocks” hypothesis for dispersal of biological control agents. BioControl 56 (4), 441–450. doi: 10.1007/s10526-011-9381-7
Holland J., Bianchi F., Entling H., Moonen A., Smith M., Jeanneret P. (2016). Structure, function and management of semi-natural habitats for conservation biological control: A reviewof European studies. Pest Manage. Sci. 72 (6), 1638–1651. doi: 10.1002/ps.4318
Holzschuh A., Dormann C. F., Tscharntke T., Steffan-Dewenter I. (2013). Mass-flowering crops enhance wild bee abundance. Oecologia 172 (2), 477–845. doi: 10.1007/s00442-012-2515-5
Jado R. H., Araj S. E., Abu-Irmaileh B., Shields M. W., Wratten S. D. (2019). Floral resources to enhance the potential of the parasitoid aphidius colemani for biological control of the aphid myzus persicae. J. Appl. Entomol. 143 (1–2), 34–42. doi: 10.1111/jen.12556
Jaetzold R., Schmidt H., Hornetz B., Shisanya C. (2012). Farm management handbook of Kenya (Western Central Eastern Nyzana Southern Rift Valley Northern Rift Valley Coast) (Nairobi: Ministry of Agriculture), Vols. I–IV.
Karp D. S., Chaplin-Kramer R., Meehan T. D., Martin E. A., DeClerck F., Grab H., et al. (2018). Crop pests and predators exhibit inconsistent responses to surrounding landscape composition. Proc. Natl. Acad. Sci. United States America 115 (33), E7863–E7870. doi: 10.1073/pnas.1800042115
Kishinevsky M., Keasar T., Bar-Massada A. (2017). Parasitoid abundance on plants: effects of host abundance, plant species, and plant flowering state. Arthropod-Plant Interact. 11 (2), 155–615. doi: 10.1007/s11829-016-9476-2
Landis D. A., Wratten S. D., Gurr G. M. (2000). Habitat management to conserve natural enemies of arthropod pests in agriculture. Annu. Rev. Entomol. 45, 175–201. doi: 10.1146/annurev.ento.45.1.175
Langellotto G. A., Denno R. F. (2004). Responses of invertebrate natural enemies to complex-structured habitats: A meta-analytical synthesis. Oecologia 139 (1), 1–105. doi: 10.1007/s00442-004-1497-3
Lundgren J. G. (2009). Nutritional aspects of non-prey foods in the life histories of predaceous coccinellidae. Biol. Control 51 (2), 294–305. doi: 10.1016/j.biocontrol.2009.05.016
Menalled FabiánD., Costamagna A. C., Marino P. C., Landis D. A. (2003). Temporal variation in the response of parasitoids to agricultural landscape structure. Agriculture Ecosyst. Environ. 96 (1–3), 29–35. doi: 10.1016/S0167-8809(03)00018-5
Milligan M. C., Johnson M. D., Garfinkel M., Smith C. J., Njoroge P. (2016). Quantifying pest control services by birds and ants in Kenyan coffee farms. Biol. Conserv. 194, 58–65. doi: 10.1016/j.biocon.2015.11.028
Mkenda P., Mwanauta R., Stevenson P. C., Ndakidemi P., Mtei K., Belmain S. R. (2015). Extracts from field margin weeds provide economically viable and environmentally benign pest control compared to synthetic pesticides. PloS One 10 (11), 2–145. doi: 10.1371/journal.pone.0143530
Mkenda P. A., Ndakidemi P. A., Stevenson P. C., Sarah S. E., Belmain S. R., Chidege M., et al. (2019). Field margin vegetation in tropical african bean systems harbours diverse natural enemies for biological pest control in adjacent crops. Sustainability 11 (22), 1–19. doi: 10.3390/su11226399
Nilsson U., Porcel M., Swiergiel W., Wivstad M. (2016) Habitat manipulation – as a pest management tool in vegetable and fruit cropping systems, with the focus on insects and mites. Available at: www.slu.se+/epok/english%5Cnhttp://orgprints.org/30032/1/biokontrollsyntes_web.pdf.
Obanyi J. N., Ogendo J. O., Mulwa R. M. S., Nyaanga J. G., Cheruiyot E. K., Bett P. K., et al (2023). Field margins and cropping system influence diversity and abundance of aphid natural enemies in lablab purpureus. J. Appl. Entomol. 147 (7), 439–451. doi: 10.1111/jen.13125
Ochieng L. O., Ogendo J. O., Bett P. K., Nyaanga J. G., Cheruiyot E. K., Mulwa R. M.S., et al. (2022). Field margins and botanical insecticides enhance lablab purpureus yield by reducing aphid pests and supporting natural enemies. J. Appl. Entomol. 146 (7), 838–495. doi: 10.1111/jen.13023
Opatovsky I., Lubin Y. (2012). Coping with abrupt decline in habitat quality: effects of harvest on spider abundance and movement. Acta Oecologica 41 (May), 14–19. doi: 10.1016/j.actao.2012.03.001
Osborne L. L., Davies R. W., Linton K. J. (1980). Use of hierarchical diversity indices in lotic community analysis. J. Appl. Ecol. 17 (3), 5675. doi: 10.2307/2402637
Perović D. J., Gurr G. M., Raman A., Nicol H. I. (2010). Effect of landscape composition and arrangement on biological control agents in a simplified agricultural system: A cost-distance approach. Biol. Control 52 (3), 263–705. doi: 10.1016/j.biocontrol.2009.09.014
Pfiffner L., Cahenzli F., Steinemann B., Jamar L., Bjørn M. C., Porcel M., et al. (2019). Design, implementation and management of perennial flower strips to promote functional agrobiodiversity in organic apple orchards: A pan-European study. Agriculture Ecosyst. Environ. 278 (March), 61–71. doi: 10.1016/j.agee.2019.03.005
Ramsden M. W., Menéndez R., Leather S. R., Wäckers F. (2014). Optimizing field margins for biocontrol services: the relative role of aphid abundance, annual floral resources, and overwinter habitat in enhancing aphid natural enemies. Agriculture Ecosyst. Environ. 199, 94–104. doi: 10.1016/j.agee.2014.08.024
Rusch A., Valantin-Morison M., Sarthou J. P., Roger-Estrade J. (2010). Biological control of insect pests in agroecosystems. Effects of crop management, farming systems, and seminatural habitats at the landscape scale: A review. Adv. Agron. 109, 220–241. doi: 10.1016/B978-0-12-385040-9.00006-2
SAS Institute. (2011). SAS software, user guide: Statistics. version 9.2 for windows (Carry, NC, USA: SAS Institute).
Lahiru Ishan Samaranayake K. G., Costamagna A. C. (2019). Adjacent habitat type affects the movement of predators suppressing soybean aphids. PloS One 14 (6), 1–20. doi: 10.1371/journal.pone.0218522
Schellhorn N. A., Gagic V., Bommarco R. (2015). Time will tell: resource continuity bolsters ecosystem services. Trends Ecol. Evol. 30 (9), 524–305. doi: 10.1016/j.tree.2015.06.007
Schmidt M. H., Lauer A., Purtauf T., Theis C., Schaefer M., Tscharntke T. (2003). Relative importance of predators and parasitoids for cereal aphid control. Proceedings of the Royal Society B: Biological Sciences 270 (1527), 1905–1909. doi: 10.1098/rspb.2003.2469
Scott C.C., Harmon-Threatt A. N. (2021). Field borders provide winter refuge for beneficial predators and parasitoids: A case study on organic farms. J. Insect Sci. 21 (3), 1–6. doi: 10.1093/jisesa/ieab027
Shweta M., Rajmohana K. (2018). A comparison of sweep net, yellow pan trap and malaise trap for sampling parasitic hymenoptera in a backyard habitat in Kerala. Entomon 43 (1), 33–44.
Skirvin D. J., Kravar-Garde L., Reynolds K., Wright C., Mead A. (2011). The effect of within-crop habitat manipulations on the conservation biological control of aphids in field-grown lettuce. Bull. Entomological Res. 101 (6), 623–631. doi: 10.1017/S0007485310000659
Sorribas J., González S., Domínguez-Gento A., Vercher R. (2016). Abundance, movements and biodiversity of flying predatory insects in crop and non-crop agroecosystems. Agron. Sustain. Dev. 36 (2), 34–43. doi: 10.1007/s13593-016-0360-3
Spafford R. D., Lortie C. J. (2013). Sweeping beauty: Is grassland arthropod community composition effectively estimated by sweep netting? Ecology and Evolution 3 (10), 3347–3358. doi: 10.1002/ece3.688
Steward P. R., Shackelford G., Carvalheiro LuísaG., Benton T. G., Garibaldi L. A., Sait S. M. (2014). Pollination and biological control research: are we neglecting two billion smallholders. Agric. Food Secur. 3 (1), 1–13. doi: 10.1186/2048-7010-3-5
Stoddard F. L., Nicholas A. H., Rubiales D., Thomas J., Villegas-Fernández A. M. (2010). Integrated pest management in faba bean. Field Crops Res. 115 (3), 308–318. doi: 10.1016/j.fcr.2009.07.002
Thant K. P., Oo M., Myint T. T. (2016). Species diversity of natural enemy association on rice at two location. J. Agric. Res. 4 (1), 104–125.
Tscharntke T., Klein A. M., Kruess A., Steffan-Dewenter I., Thies C. (2005). Landscape perspectives on agricultural intensification and biodiversity - ecosystem service management. Ecol. Lett. 8, 857–874. doi: 10.1111/j.1461-0248.2005.00782.x
Yang F., Xu L., Wu Y. K., Wang Q., Yao Z. W., Žikić V., et al. (2017). Species composition and seasonal dynamics of aphid parasitoids and hyperparasitoids in wheat fields in northern China. Sci. Rep. 7 (1), 1–9. doi: 10.1038/s41598-017-14441-6
Zhao H., Li J., Guo L., Wang K. (2021). Crop diversity at the landscape level affects the composition and structure of the vegetation-dwelling arthropod communities in naked oat (Avena chinensis) fields. Int. J. Environ. Res. Public Health 18 (1), 1–135. doi: 10.3390/ijerph18010030
Zhao Z. H., Shi P. J., Men X. Y., Ouyang F., Ge F. (2013). Effects of crop species richness on pest-natural enemy systems based on an experimental model system using a microlandscape. Science China Life Sciences 56 (8), 758–766. doi: 10.1007/s11427-013-4511-3
Keywords: natural enemies, field margins, off-season, smallholder farming systems, sustainable pest management
Citation: Obanyi JN, Ogendo JO, Mulwa RMS, Nyaanga JG, Cheruiyot EK, Bett PK, Belmain SR, Arnold SEJ, Nash-Woolley VC and Stevenson PC (2024) Flowering margins support natural enemies between cropping seasons. Front. Agron. 6:1277062. doi: 10.3389/fagro.2024.1277062
Received: 12 September 2023; Accepted: 02 January 2024;
Published: 22 January 2024.
Edited by:
Rachid Lahlali, Ecole Nationale d’Agriculture de Meknès, MoroccoReviewed by:
Cathy Hawes, The James Hutton Institute, United KingdomJozsef Kiss, Szent István University, Hungary
Copyright © 2024 Obanyi, Ogendo, Mulwa, Nyaanga, Cheruiyot, Bett, Belmain, Arnold, Nash-Woolley and Stevenson. This is an open-access article distributed under the terms of the Creative Commons Attribution License (CC BY). The use, distribution or reproduction in other forums is permitted, provided the original author(s) and the copyright owner(s) are credited and that the original publication in this journal is cited, in accordance with accepted academic practice. No use, distribution or reproduction is permitted which does not comply with these terms.
*Correspondence: Philip C. Stevenson, cC5jLnN0ZXZlbnNvbkBncmVlbndpY2guYWMudWs=