 Slameto
 Danil Eka Fahrudin2
 Muhamad Wahyu Saputra
- 1Agronomy Study Program, Department of Agriculture, University of Jember, Jember, East Java, Indonesia
- 2Agrotechnology Study Program, Department of Agriculture, University of Jember, Jember, East Java, Indonesia
Introduction: Rice, as a staple food in several Asian countries, contributes to approximately 10% of greenhouse gas (GHG) emissions during its cultivation. Furthermore, nitrogen fertilization increases the accumulation of GHG emissions. This study aims to investigate GHG emissions, including methane (CH4) and nitrous Oxide (N2O) resulting from the common fertilizer variations used by farmers in Indonesia for two rice varieties, Way Apo Buru and Inpari 32, and their relationship to rice yield.
Methods: The research was conducted from August to November 2022 in an open field located in Jember, Indonesia. Two rice varieties, Inpari 32 and Way Apo Buru, were employed in this study. Fertilization variations included Urea (46%-N), ZA (21%-N 24%-S), SP-36 (36%-P & 5%-S), KCl (250:100:50:50 kg ha-1) (P1); NPK (16%-N:16%-P:16%-K), Urea (46%-N), ZA (21%-N & 24%-S) (225:175:100 kg ha-1) (P2); NPK (12%-N:12%-P:17%-K), Urea (46%-N), ZA (21%-N & 24%-S) (175:150:100 kg ha-1) (P3); and NPKS (P1) + chicken manure fertilizer 5 tonnes ha-1 (P4).
Results: In this research, Inpari 32 rice achieved greater yields while also exhibiting higher global warming potential. Applying NPKS fertilizer in combination with 5 tonnes ha-1 of manure fertilizer (referred to as P4) resulted in a substantial increase in rice yield compared to alternative fertilizer formulations.
Discussions: The various inorganic fertilizers had a relatively similar influence on growth, production yield, and greenhouse gas emissions (CH4 and N2O). However, the fertilizer NPKS and 5 tonnes manure fertilizer resulted in the lowest CH4 emissions and global warming potential values.
1 Introduction
Many countries have pledged to participate in reducing greenhouse gas (GHG) emissions, such as methane (CH4) and nitrous oxide (N2O). Therefore, it is imperative to assess the magnitude of agricultural GHG emissions and identify mitigation opportunities (Hu et al., 2023). GHG emissions from agroecosystems are a significant contributor to global warming (Hou P. et al., 2023). The practice of rice cultivation contributes to CH4 and N2O emissions. Rice cultivation is accountable for more than 10% of global agricultural GHG emissions and approximately 1.3% to 1.8% of anthropogenic GHG emissions (Maraseni et al., 2018).
Nitrogen fertilization has been one of the strategies employed to enhance crop production worldwide in recent times. However, improper nitrogen fertilization practices can result in significant greenhouse gas (GHG) emissions, contributing to climate change and global warming (Guo et al., 2022). Chemical fertilizers exert a pronounced impact on soil N2O emissions, supplying an excess of mineral N that ultimately leads to N2O production (Shaaban et al., 2022). N2O gas is generated by ammonia-oxidizing bacteria and archaea through nitrification and denitrification processes within the soil. CH4 gas emanates from the soil under anaerobic conditions, exhibiting three distinct emission pathways into the atmosphere: diffusion through water layers, ebullition (bubbling), and transportation through the aerenchyma of rice plants (Santoro et al., 2011; Yuan et al., 2017).
Different fertilizer categories can induce variations in GHG fluxes and emissions, as well as variances in rice biomass throughout the growing season. GHG fluxes and CH4 emissions significantly increase in land areas treated with organic fertilizers compared to those without fertilizers or with chemical fertilizers. CH4 production is higher during the reproductive phase compared to other growth stages. Efforts to adapt to and mitigate the impacts of climate change are necessary for combating the consequences of climate change. This can be achieved through the implementation of technological innovations aimed at enhancing crop productivity and reducing greenhouse gas (GHG) (Wihardjaka and Harsanti, 2021). It is important to recognize that mitigation strategies for GHG emissions in rice cultivation, such as efficient nitrogen fertilizer management (Islam et al., 2022), and the selection of rice varieties with high productivity and low GHG emissions, are crucial for improving crop yields and mitigating climate change.
The influence of rice varieties on methane emissions is primarily associated with the rice plants growth performance, including factors such as the number of tillers, above and below-ground biomass, root exudates, and aerenchyma (Win et al., 2021). The objective of this research is to examine the greenhouse gas emissions (specifically CH4 and N2O) arising from the typical fertilizer practices employed by Indonesian farmers. These practices adhere to the guidelines prescribed by the Agricultural Research and Development Agency of the Ministry of Agriculture for paddy fields situated in specific locations. The investigation will focus on two rice varieties, Way Apo Buru and Inpari 32, and their connection to rice crop yield.
In Indonesia, the application of NPK fertilization in rice cultivation is recommended by the Indonesian Ministry of Agriculture (Ministry of Agriculture, 2021). In Jember Regency, East Java, Indonesia, there are eight variations of NPK fertilization recommendations, categorized into single and compound fertilizer variations. The compositions for single fertilizers include: 1) Urea, ZA, SP-36, KCl (200:100:50:50 kg ha-1); 2) Urea, ZA, SP-36, KCl (250:100:50:50 kg ha-1); and 3) Urea, ZA, SP-36, KCl (250:100:50:100 kg ha-1). Meanwhile, the compound fertilizer compositions involve 1) NPK 15-15-15, Urea, ZA (175:100:100 kg ha-1); 2) NPK 15-15-15, Urea, ZA (175:150:100 kg ha-1); 3) NPK 15-15-15, Urea, ZA (350:100:100 kg ha-1); 4) NPK 15-10-12, Urea, ZA (225:125:100 kg ha-1); and 5) NPK 15-10-12, Urea, ZA (350:150:100 kg ha-1). This research aims to assess rice yield and greenhouse gas emissions across different fertilization variations using two distinct rice varieties.
2 Materials and methods
2.1 Study area and experimental design
The research was conducted from August to November 2022 in an open field located near Jl. Kutai, Kranjingan Village, Sumbersari Subdistrict, Jember (8°1202.1”S 113°4340.9”E). Based on data from the Central Statistics Agency, Indonesian (2023), the study site in the Jember region had average humidity and temperature conditions of 80.02% and 27.06°C, respectively, in the year 2022. The duration of sunlight in the Jember region in August, September, October, and November 2022 was 9%, 9%, 20%, 16%, and 26%, respectively. The study site, situated in Sumbersari Subdistrict, Jember Regency, had monthly rainfall in 2022 of 0 mm (August), 5.9 mm (September), 22 mm (October), and 23.2 mm (November) (Central Statistic Agency, 2023).
The research design employed a randomized complete block design with three replications, and the experimental plot size was 2.4 m2 (2 x 1.2 m) for each plot. A 0.5-meter-wide buffer separated each experimental plot. Soil preparation was conducted before planting by plowing to a depth of 25 cm and providing water to achieve mud and ponding conditions. There were 60 planting holes per experimental plot, spaced 20 x 20 cm apart, with 2 rice seedlings planted in each hole. This study utilized two rice varieties, Inpari 32 (harvest age between 120 days after sowing) and Way Apo Buru (harvest age between 115-125 days after sowing). Fertilization variations consisted of Urea 250 kg ha-1, ZA 100 kg ha-1, SP-36 50 kg ha-1, KCl 50 kg ha-1 (P1); NPK (16:16:16) 225 kg ha-1, Urea 175 kg ha-1, ZA 100 kg ha-1 (P2); NPK (12:12:17) 175 kg ha-1, Urea 150 kg ha^-1, ZA 100 kg ha-1 (P3); and NPKS (P1) + chicken manure fertilizer 5 tonnes ha-1 (P4). Fertilization was performed periodically with the compositions listed in Table 1.
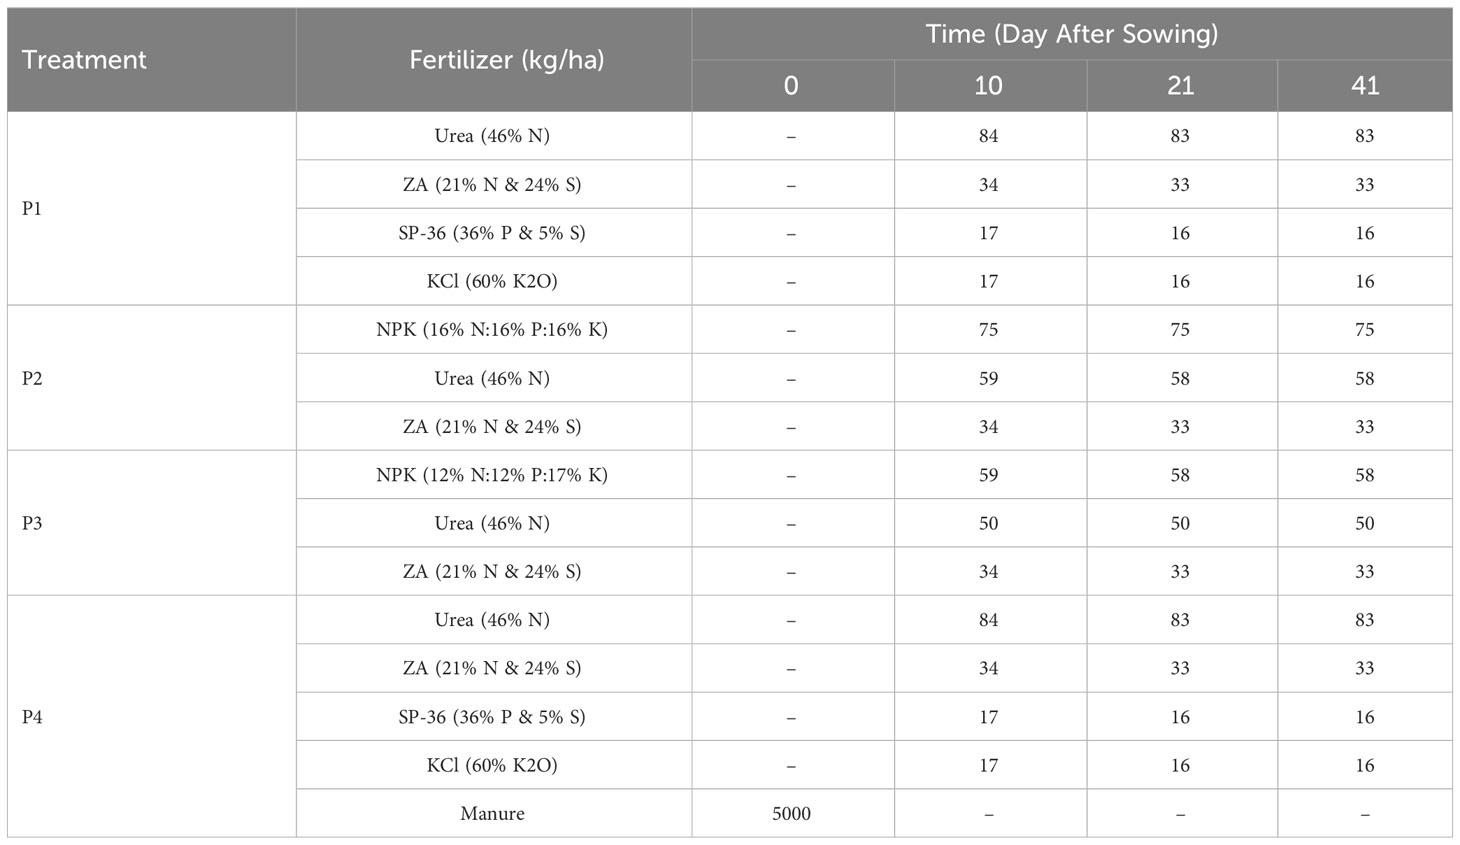
Table 1 Composition and dosage of fertilizers used.
2.2 Growth and yield sample collection
The growth data observed included plant height, the number of tillers, and leaf chlorophyll content (60 days after sowing) using the SPAD-502 meter. The recorded parameters for grain yield included grain numbers, empty grain (gram), dry grain (gram), and overall yield. Harvesting was conducted at 125 days after sowing. Data collection was performed through sampling, where four plants per experimental plot were selected for measurement. The data of yield is calculated by converting the dry weight calculation using the following equation:
2.3 Greenhouse gas sample collection
Observations and measurements of CH4 and N2O emissions were conducted three times during a single growing season. Greenhouse gas sampling was performed using the close chamber technique, adopted from the International Atomic Energy Agency (1993). CH4 gas samples were collected using a chamber measuring 50 cm × 50 cm × 103 cm, while N2O gas samples were obtained from a chamber measuring 40 cm × 20 cm × 20 cm. The time intervals between gas sampling were 5, 10, 15, and 20 minutes for both CH4 and N2O. Gas samples from the chambers were collected using 10 ml capacity syringes. Subsequently, the greenhouse gas samples in the syringes were immediately transported to the greenhouse gas laboratory for emission measurements.
Greenhouse gas emissions (CH4 and N2O) were manually measured using gas chromatography to determine the gas concentrations within the syringes. The concentration of CH4 gas was measured using a GC Shimadzu 8A with a Flame Ionisation Detector (FID), while the concentration of N2O gas was measured using a GC Shimadzu 14A with Electron Capture Detector (ECD) and Thermal Conductivity Detector (TCD). Subsequently, the emissions of these gases were calculated using the formula:
This formula is used to calculate the emissions of CH4 or N2O gases, where E represents the emission of CH4 or N2O (mg m-2 day-1), dc/dt is the difference in CH4 or N2O concentration over time (ppm min-1), Vch is the volume of the chamber (m3), Ach is the chamber area (m2), mW is the molecular weight of CH4 or N2O (grams), mV is the molecular volume of CH4 or N2O (a constant value of 22.41), and T is the average temperature during gas sampling (degrees Celsius).
2.4 Data analyses
Analysis of variance (ANOVA) was employed to assess the influence of rice varieties and fertilizer variations on growth, yield, cumulative greenhouse gas emissions, global warming potential (GWP), and yield-scaled GWP. Post hoc Duncan tests (p< 0.05) were conducted if the ANOVA results were significant. CH4 and N2O fluxes were presented using descriptive statistical analysis to identify trends in gas emissions at three different observation times. Additionally, correlation and linear regression analyses were conducted to determine the relationship between greenhouse gas emissions and grain number, empty grain, dry grain, and yield.
3 Results
3.1 Paddy growth
Different fertilization treatments have shown a significant influence on plant height, tiller count, and rice plant chlorophyll content (Table 2). The application of NPKS fertilizer (P1) + 5 tonnes ha-1 of manure tends to produce the best plant height and tiller count compared to other treatments. Furthermore, NPKS fertilizer (P1) + 5 tonnes ha-1 of manure exhibits the highest chlorophyll content in the Way Apo variety, although it is not significantly different from the NPK 225 kg ha-1 Urea 175 kg ha-1, ZA 100 kg ha-1 fertilization treatment. Both NPKS fertilizer (P1) + 5 tonnes ha-1 of chicken manure and NPK 225 kg ha-1 Urea 175 kg ha-1, ZA 100 kg ha-1 fertilization treatments also demonstrate no significant variation in yield between the Inpari 32 and Way Apo rice varieties.
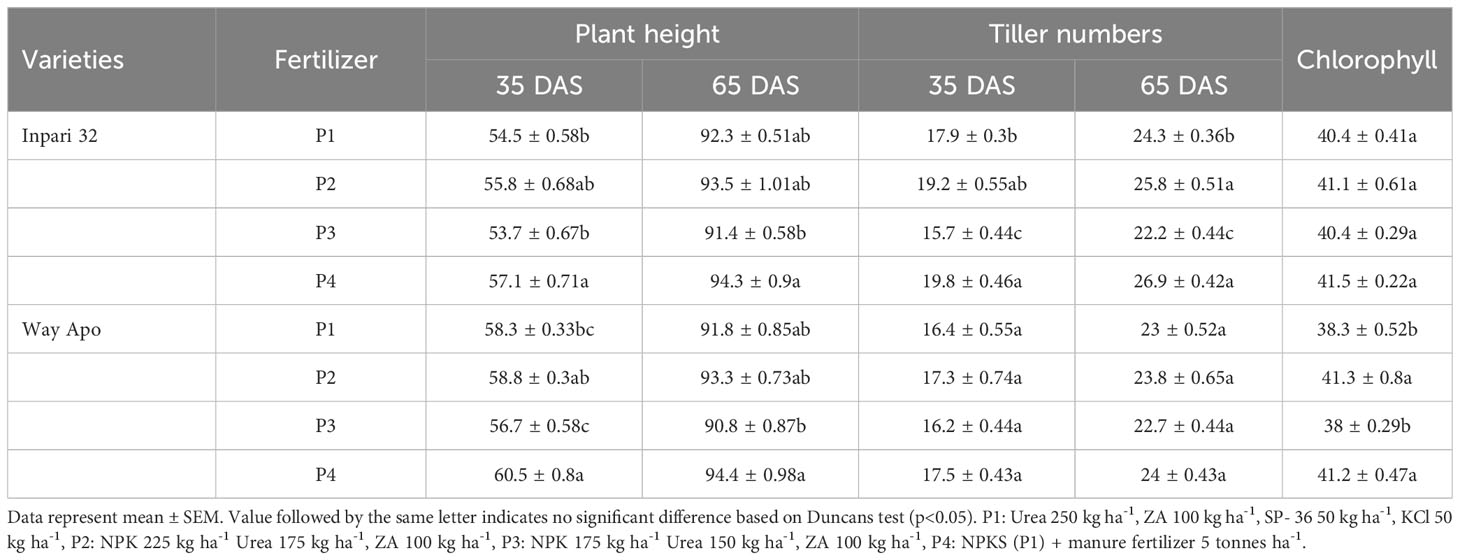
Table 2 Paddy growth on differences in varieties and fertilizer composition.
3.2 CH4 and N2O emission
Variations in fertilization applied to rice plants result in relatively similar trends in CH4 and N2O fluxes across each treatment level (Figure 1). CH4 emission fluxes exhibit high values during the early stages of rice plant growth, followed by a decline as the rice plants enter the reproductive phase and reach physiological maturity. CH4 and N2O fluxes in both rice varieties also follow the same pattern (Figure 2), with decreasing emission levels followed by aging of the rice plants. This occurs because rice cultivation in Indonesia typically involves a substantial amount of water during the vegetative phase, followed by reduced water requirements as the rice plants enter the generative phase leading up to harvest. Under certain conditions, rice fields are drained before harvest.
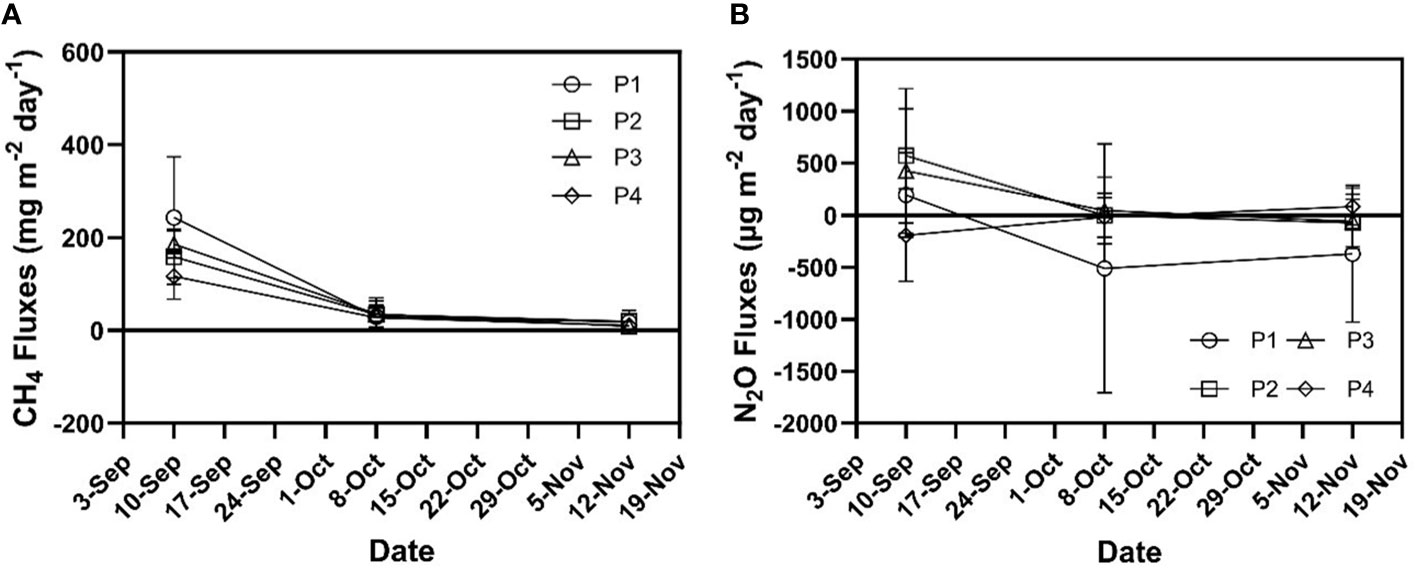
Figure 1 Measured of CH4 (A) and N2O (B) emission fluxes from paddy plants in differences composition of fertilizers during one growing season. P1: Urea 250 kg ha-1, ZA 100 kg ha-1, SP- 36 50 kg ha-1, KCl 50 kg ha-1, P2: NPK 225 kg ha-1 Urea 175 kg ha-1, ZA 100 kg ha-1, P3: NPK 175 kg ha-1 Urea 150 kg ha-1, 100 kg ha-1 ZA, P4: Urea 250 kg ha-1, ZA 100 kg ha-1, SP- 36 50 kg ha-1, KCl 50 kg ha-1, and manure fertilizer 5 tonnes ha-1.
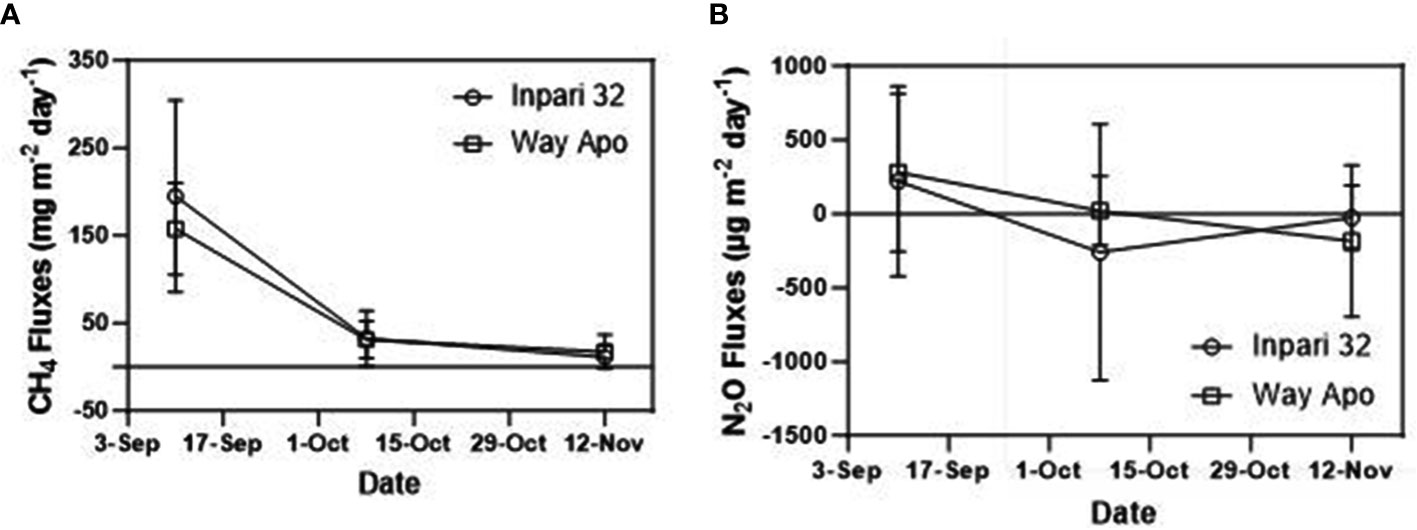
Figure 2 Measured of CH4 (A) and N2O (B) emission fluxes from paddy plants in differences varieties of paddy during one growing season. In this study, it is revealed that the trends in CH4 and N2O fluxes are more fluctuating in single-fertilizer variation treatments compared to single-rice variety treatments. This suggests that the fertilizer variations used in the study have less influence on CH4 and N2O emission rates in rice cultivation. Treatments P1, P2, and P3 each contain inorganic NPKS fertilizer at different doses that are not excessively high. On the other hand, treatment P4 is a variation of NPKS fertilizer (P1) combined with manure content. Although statistically, the differences in rice varieties and fertilizer variations used in the study do not show significant differences (Figure 3), the addition of manure content in treatment P4 and differences in rice varieties reveal factors that play a crucial role in global warming potential emissions.
3.3 Yield, global warming potential (GWP), and GWP-scaled
Fertilization variations applied to two rice varieties resulted in different production outcomes (Table 3). The application of NPK fertilizer at 175 kg ha-1 Urea 150 kg ha-1, and 100 kg ha-1 ZA in both rice varieties yielded the lowest grain numbers and dry grain numbers while producing the highest empty grain numbers. On the other hand, the application of NPKS fertilizer (P1) + 5 tonnes ha-1 of manure fertilizer in both rice varieties resulted in the lowest empty grain numbers compared to other fertilization variations. The use of manure and NPK fertilizers can enhance soil pH, vegetative growth variables (plant height and tiller count), grain yield, and yield components (number of filled grains per panicle and 1000-grain weight). Grain yield can increase by up to 24.19% with the application of 20 tons ha-1 of manure fertilizer and 100% of the inorganic fertilizer dose compared to no organic fertilizer application (Herliana et al., 2019).
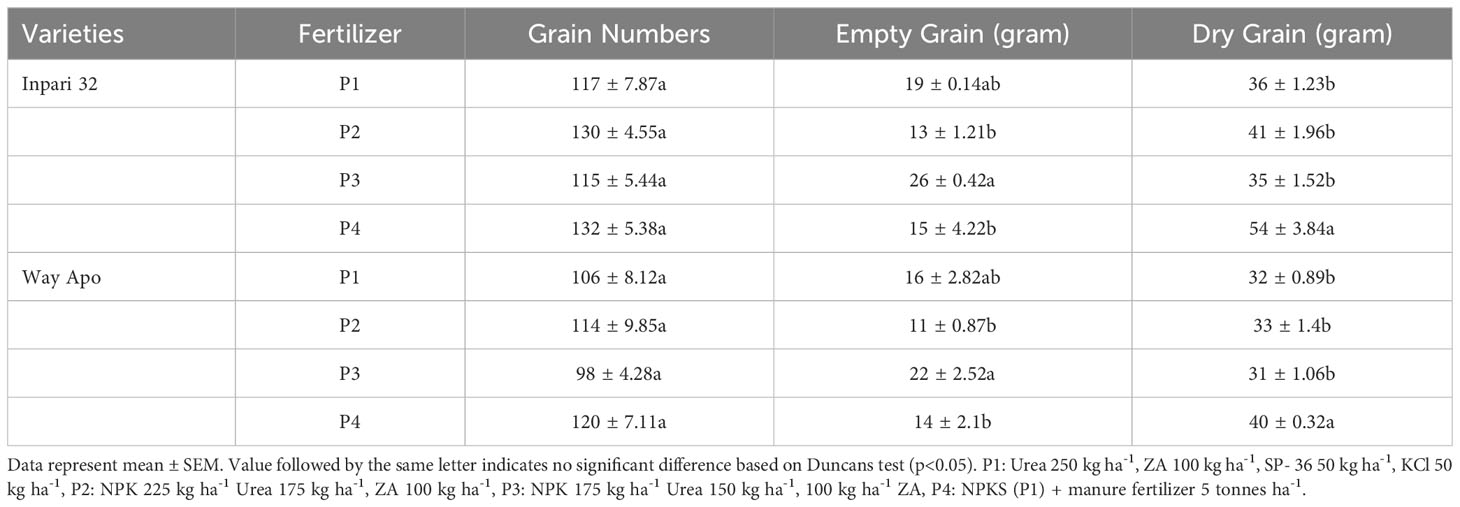
Table 3 Paddy grain yield on differences varieties and fertilizer composition.
Fertilization variations in both Inpari 32 and Way Apo rice varieties also yielded similar results in terms of yield, with NPKS fertilizer (P1) + 5 tonnes ha-1 of manure fertilizer in both varieties producing the highest yield compared to other fertilizer variations (Table 4). The NPK fertilizer at 175 kg ha-1 Urea 150 kg ha-1, and 100 kg ha-1 ZA variations also resulted in the lowest yield. The lowest Global Warming Potential (GWP) in both rice varieties was achieved with the NPKS fertilizer (P1) + 5 tonnes ha-1 of manure fertilizer.
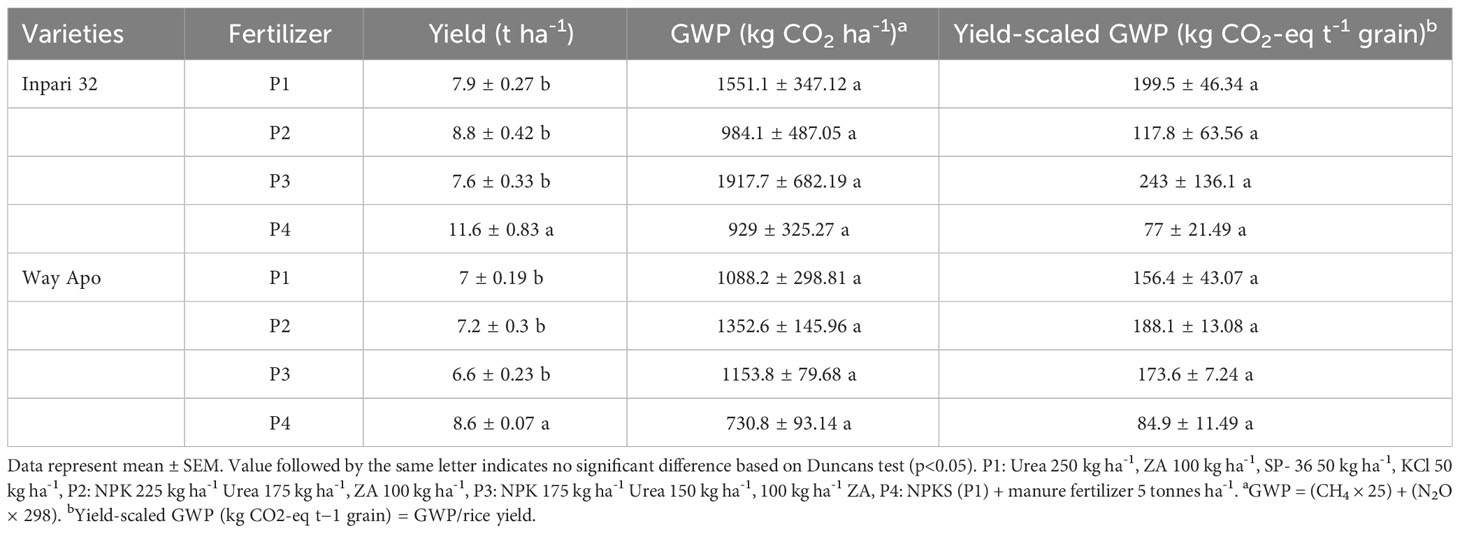
Table 4 Paddy yield, GWP, and Yield-Scaled on differences varieties and fertilizer composition.
3.4 Relationship between CH4, N2O emission and paddy yield
The results of the correlation analysis indicate a negative correlation between CH4 emissions and grain numbers, dry grain yield, and overall yield (Table 5). On the other hand, N2O emissions show a positive correlation with paddy yield. However, the correlation analysis results between CH4 uptake and N2O emissions concerning paddy yield reveal an insignificant influence.

Table 5 Correlation Between Cummulative of CH4, N2O emission, grain number, empty grain, dry grain, and yield.
The regression analysis results reveal that cumulative CH4 emissions have a negative impact on rice yield potential. High CH4 emissions exhibit a decreasing trend in terms of rice grain formation parameters. In contrast, cumulative N2O emissions show an increasing trend in grain number and empty grain. The increase in N2O emissions is also linearly followed by an increase in dry grain yield and overall yield. However, the regression analysis results for greenhouse gas emissions in this study demonstrate a coefficient of determination (R2) that is not significant concerning rice grain yield. The relationship between CH4 uptake and N2O emissions with paddy yield is more clearly depicted in Figure 3. Longer-term observations are needed to better elucidate the relationship between CH4 and N2O emissions and rice production.
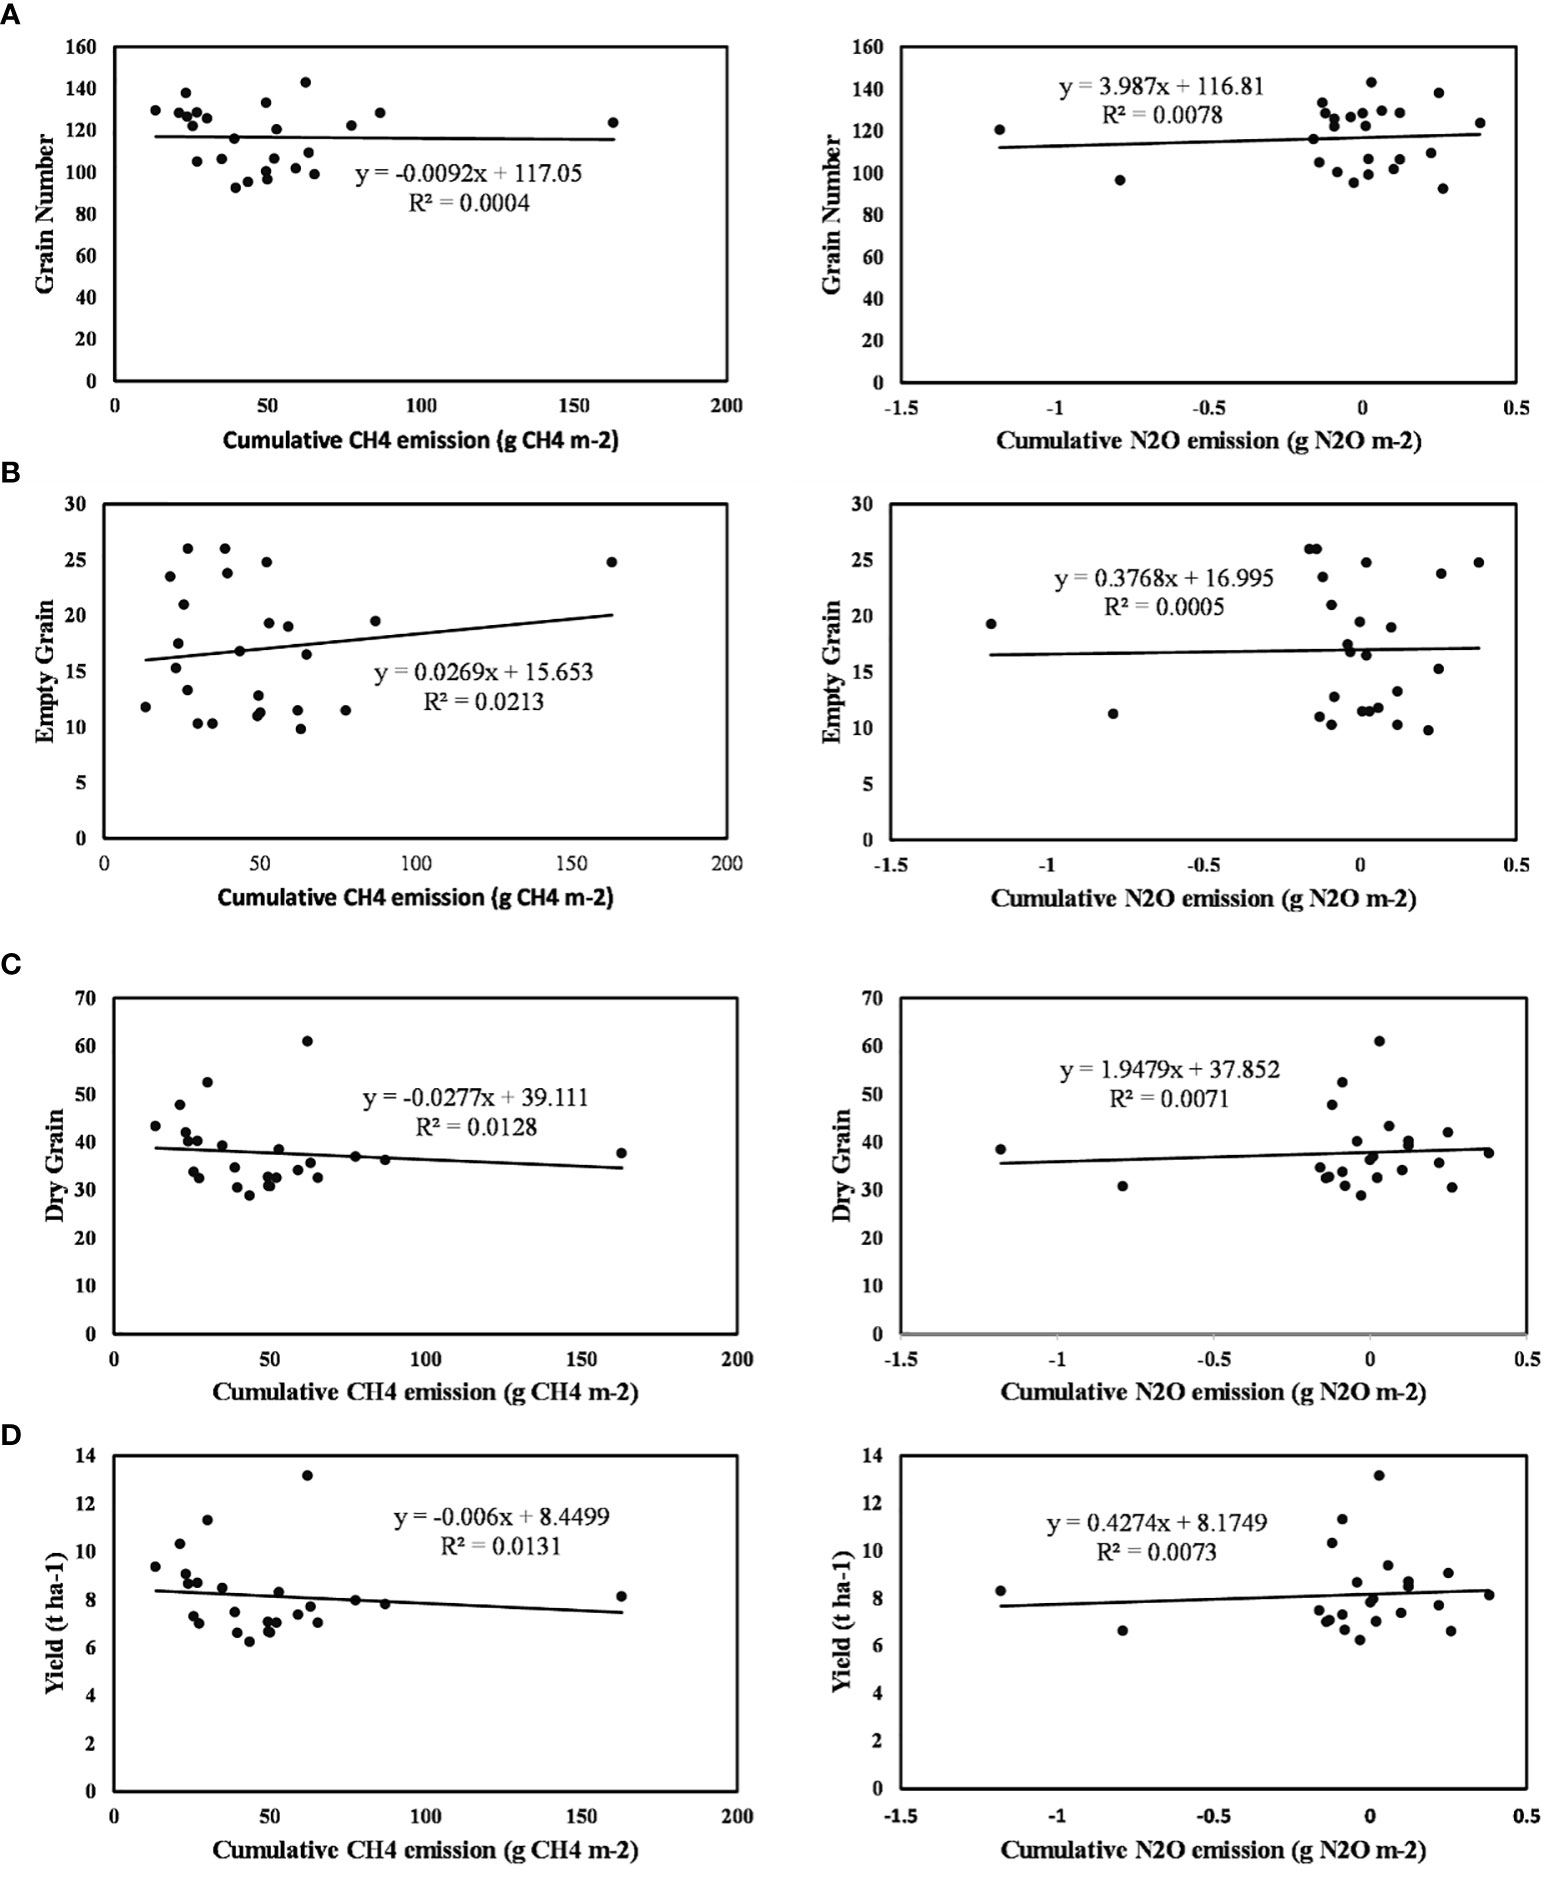
Figure 3 Regresion between cummulative of CH4 uptake and N2O emission with (A) grain number, (B) empty grain, (C) dry grain, and (D) yield. N = 24.
4 Discussion
The decrease in CH4 flux during the generative phase is attributed to the reduced activity of methane-producing bacteria under dry drainage conditions (aerobic conditions), which inhibits CH4 production and enhances CH4 oxidation (Conrad, 2007). CH4 flux gradually increases from the early planting stage to the early generative phase (promordia) and then slightly decreases before increasing again after harvest (Setyanto et al., 2016). Greenhouse gas emissions in rice cultivation tend to decrease around 50-90 days after planting (DAP). This reduction is due to a decrease in the number of tillers and a decrease in the photosynthetic rate, leading to reduced assimilation for methane production (Ardiarini et al., 2020). Methane flux decreases after the flowering stage because the photosynthetic rate decreases after seed development, and the availability of assimilates for methane formation decreases (Wihardjaka and Sarwoto, 2015). Previous research has also shown similar results, with the highest methane fluxes observed during the vegetative and early reproductive phases (about 25 days after showing), followed by a decline during the flowering and maturity phases (Chandrasekaran et al., 2022).
Methane and nitrous oxide emissions from the application of chemical and manure fertilizers can vary depending on environmental factors (such as climate and soil conditions), crop-related factors (crop type), and management factors (types of chemical and organic fertilizers), as well as the rate and timing of application (Win et al., 2021). The use of chemical and organic fertilizers contributes to 23-31% of global anthropogenic N2O emissions, with most of these emissions occurring from the soil after fertilizer application. Fertilizer application (organic or inorganic) stimulates CH4 production by enhancing rice plant growth, thereby providing a carbon source for methane-producing bacteria. Under flooded conditions, rice plant growth increases CH4 emissions by supplying a carbon source and supporting CH4 transport to the atmosphere (Cai et al., 2007). Organic fertilizers supply inorganic N in the form of NH4+ and NO3-, which can increase N2O production. Organic fertilizers provide labile C compounds, which can enhance denitrifying bacterial activity and trigger N2O emissions (Lazcano et al., 2021).
Additionally, previous research has shown that rice variety differences significantly affect greenhouse gas emissions. Short-duration and water-efficient rice varieties can reduce CH4 emission fluxes under low-water irrigation conditions (Chandrasekaran et al., 2022). In this study, the Way Apo rice variety produced lower CH4 emissions compared to Inpari 32 under the P1, P3, and P4 fertilizer variations. On the other hand, under the P2 fertilizer variation, Way Apo rice resulted in higher CH4 emissions than Inpari 32. However, the CH4 emissions produced from the rice variety differences were not statistically significant. The lower CH4 emissions from the Way Apo rice variety compared to Inpari 32 can be attributed to the fact that Way Apo rice is an amphibious rice phenotype, adapted to water-scarce irrigation conditions (Supijatno et al., 2016). Additionally, rice characteristics such as plant height, tiller count, and the size of aerenchyma cavities play a role in managing methane emissions. Inpari 32 has genetic characteristics of wider root aerenchyma cavities, broader stem aerenchyma cavities, taller plants, and a higher number of tillers. The higher number of tillers can increase CH4 production capacity because it can enhance the density and number of aerenchyma vessels (Ardiarini et al., 2020).
Cumulative CH4 emissions in the Inpari 32 rice variety are highest in the P3 fertilizer variation. Meanwhile, cumulative CH4 emissions in the Way Apo rice variety are highest in the P2 fertilizer variation. The P4 fertilizer variation (NPKS + manure) results in the lowest cumulative CH4 emissions in both rice varieties (Figure 4A). Previous research has reported that the addition of single inorganic nitrogen fertilizer linearly increases CH4 emission rates in rice cultivation (Bhattarai et al., 2021; Zhou et al., 2019; Mohanty et al., 2020; Yang et al., 2023). Although theoretically, nitrogen fertilizer plays a significant role in regulating greenhouse gas emissions. However, some recent studies have reported that single inorganic P and K fertilizers play a role in managing nitrogen conversion in the soil. Zhu et al. (2022) reported that Continuous application of inorganic P fertilizer decreases NH4 emissions by stimulating CH4 oxidation without affecting CH4 production. Datta et al. (2013) also reported that Combination of inorganic NPK fertilizer in rice plants in India resulted in lower CH4 emissions compared to single nitrogen fertilizer application, and these results were similar to treatments without nitrogen fertilizer.
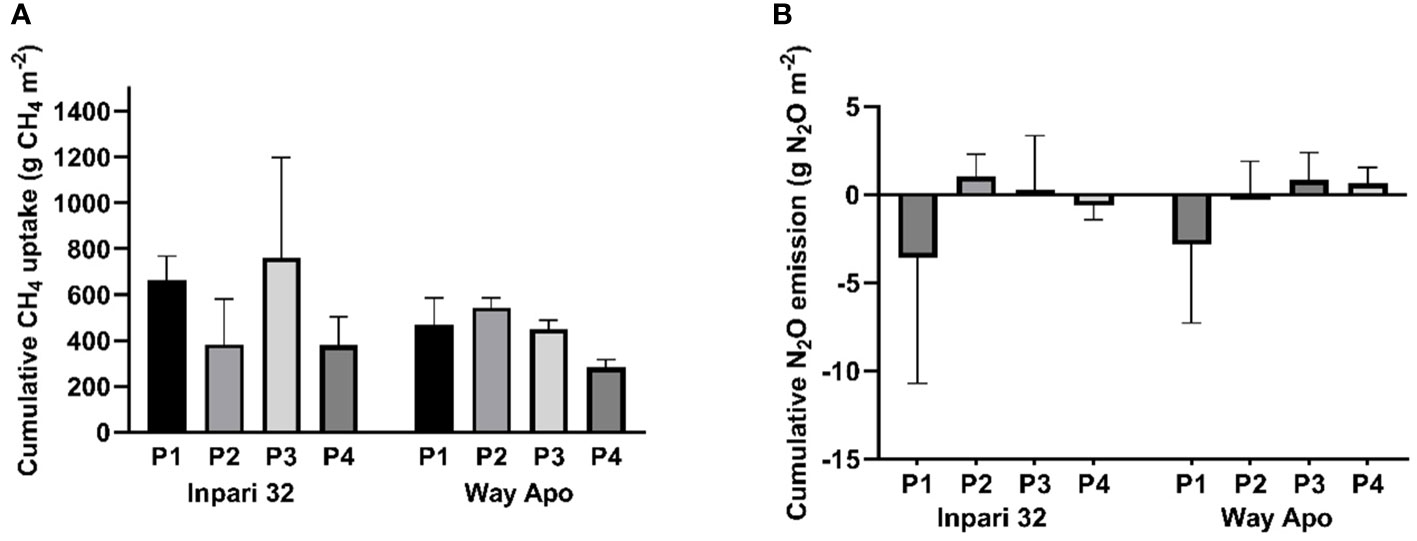
Figure 4 Cummulative of CH4 (A) and N2O emission (B) from paddy plants on differences in varieties and composition of fertilizers during one growing season. P1: Urea 250 kg ha-1, ZA 100 kg ha-1, SP- 36 50 kg ha-1, KCl 50 kg ha-1, P2: NPK 225 kg ha-1 Urea 175 kg ha-1, ZA 100 kg ha-1, P3: NPK 175 kg ha-1 Urea 150 kg ha-1, 100 kg ha-1 ZA, P4: NPKS (P1) + manure fertilizer 5 tonnes ha-1.
The research results indicate that fertilizer variations do not have a statistically significant influence on cumulative nitrous oxide (N2O) emissions (Figure 4B). Nitrous oxide (N2O) emissions are produced through the processes of nitrification and denitrification in the soil (Ji et al., 2018; Chen et al., 2020). This process starts when there is available inorganic nitrogen, such as nitrate (NO3-) and ammonia (NH4+), in the soil, which is used as an alternative energy source when oxygen (O2) in the soil is limited by denitrifying bacteria. Nitrate is converted into various forms of nitrogen gas (N2), including N2O, during the denitrification process. Subsequently, N2O is released into the atmosphere as part of greenhouse gas emissions (Chen et al., 2020). Soil properties such as moisture, temperature, pH, soil type, chemical composition, and nitrification-denitrification bacterial activity play a crucial role in N2O fluxes (Xiong et al., 2007; Morimoto et al., 2011; Behnke et al., 2018). However, nitrogen availability in the soil is a limiting factor affecting N2O emission rates, especially in flooded soil conditions (Gu et al., 2013; Zhang et al., 2018). In this study, the fertilizer variations used cannot explain the best fertilizer composition to suppress N2O emissions in rice cultivation.
In summary, the fertilizer variations used in this study cannot elucidate their relationship with greenhouse gas emission rates in rice cultivation. This is because short-term manure fertilizer additions have not significantly altered carbon and nitrogen stocks in the soil and have resulted in fluctuating CH4 and N2O emissions (Anggria et al., 2012; Cheng et al., 2016). Many studies have reported that nitrogen stocks are more influenced by inorganic nitrogen inputs than by manure fertilizer. However, some research has indicated that long-term manure application enhances organic carbon and nitrogen stocks in the soil (Chu et al., 2007; Ren et al., 2014; Abrar et al., 2023). It is important to emphasize that high doses of manure fertilizer do not necessarily lead to high greenhouse gas emissions (Cheng et al., 2016).
Manure fertilizer can improve the physical, chemical, and biological properties of the soil, such as enhancing soil quality and structure, as well as stimulating soil enzyme activity (Hou Q. et al., 2023). The application of manure fertilizer significantly increased crop yields by approximately 7.6% compared to mineral fertilizers (Du et al., 2020). The combination of chemical and/or organic compost fertilizers has a significant impact on rice yield and yield components. The mixed application of chemical and organic fertilizers enhances plant growth and yield components (Sung et al., 2023).
The research results indicate that the addition of manure fertilizer results in lower Global Warming Potential (GWP) values and yield-scaled GWP compared to the use of inorganic NPKS fertilizers. Manure fertilizer contains slowly decomposing organic matter, which can increase the soils organic carbon content and extend the carbon cycle (Ren et al., 2014; Kacprzak et al., 2023). This condition can reduce greenhouse gas emissions, especially N2O emissions, which typically occur in anaerobic conditions (Sun et al., 2019; Mayer et al., 2022). Additionally, manure fertilizer can enhance soil sustainability by improving water and nutrient retention, which can increase crop productivity and reduce the need for inorganic fertilizers. In contrast, the use of inorganic fertilizers, especially in excessive doses, can lead to more acidic and unsustainable soil conditions, which can increase greenhouse gas emissions, particularly N2O (nitrous oxide), which has a high global warming potential (Jahangir et al., 2022).
The high yield-scaled GWP associated with the use of inorganic fertilizers compared to the addition of organic fertilizers is due to the imbalance between the amount of fertilizer used and crop production. Excessive nitrogen fertilizer doses compared to plant requirements can increase N2O emissions because inorganic fertilizers contain nitrogen that is more readily degraded into N2O (Bhuiyan et al., 2021; Jahangir et al., 2022). Additionally, plants grown with high nitrogen rates can experience nutrient stress and inefficient growth, which, in turn, can reduce crop yield (Wang et al., 2020; Guo et al., 2022). Therefore, imbalances in the use of inorganic fertilizers (especially nitrogen) can result in high yield-scaled GWP, where greenhouse gas emissions relative to crop yields tend to be higher.
More photosynthate translocation is allocated toward grain formation, thereby enhancing grain productivity and reducing the efficiency of greenhouse gas emissions into the atmosphere. In varieties with low yields, more photosynthate is allocated to other vegetative parts to enrich soil carbon status and increase plant biomass productivity, resulting in higher greenhouse gas production and emissions (Gorh and Baruah, 2019). Conversely, CH4 emissions, soil pH, soil organic carbon, plant height, and the number of filled grains exhibit negative correlations with grain yield (Haque et al., 2021).
The emission of greenhouse gases, the availability of soil carbon, nutrient mineralization, soil fertility, and plant growth are components that should be interrelated. SOC and total nitrogen rates exhibit a linear quantitative relationship (Cheng et al., 2016). Greenhouse gas emissions, particularly N2O emissions, are among the causes of nitrogen loss in the soil (Smeaton et al., 2011; Ashraf et al., 2020). High SOC accumulation has been reported to mitigate nitrogen loss by suppressing N2O flux (Lee et al., 2020). In flooded lands, N2O flux exhibits a linear relationship with CH4 emission rate. Therefore, a high greenhouse gas emission rate indicates high soil carbon and nitrogen loss, resulting in reduced soil fertility and inadequate plant nutrient supply.
5 Conclusion
In comparison to the Way Apo Buru rice variety, Inpari 32 rice variety exhibited higher yields but also demonstrated a higher global warming potential. The application of NPKS fertilizer (Urea 250 kg ha-1, Ammonium sulfate (ZA) 100 kg ha-1, Superphosphate (SP-36) 50 kg ha-1, and Potassium chloride (KCl) 50 kg ha-1), along with 5 tonnes ha-1 of manure fertilizer (referred to as P4), significantly increased rice seed production compared to other fertilizer compositions. Furthermore, the P4 fertilizer composition resulted in lower CH4 emissions and global warming potential than other compositions. Greenhouse gas emissions are indicative of nitrogen and carbon losses in the soil. Therefore, this study revealed that higher CH4 emissions are associated with lower rice seed production. N2O emissions showed a positive correlation with rice production but were not statistically significant. Thus, a more intensive observation of N2O flux is required to provide a more accurate explanation of the relationship between greenhouse gas emissions and rice seed production.
Data availability statement
The original contributions presented in the study are included in the article/supplementary material. Further inquiries can be directed to the corresponding author.
Author contributions
S: Conceptualization, Data curation, Funding acquisition, Investigation, Methodology, Project administration, Supervision, Validation, Writing – original draft, Writing – review & editing. DF: Project administration, Software, Validation, Visualization, Writing – review & editing. MS: Methodology, Project administration, Resources, Validation, Visualization, Writing – original draft, Writing – review & editing.
Funding
The author(s) declare that financial support was received for the research, authorship, and/or publication of this article. The authors gratefully acknowledged research supporting research program of Institute for Research and Community Service, University of Jember for funding this study.
Acknowledgments
Sincere thanks are also addressed to Prof. Wiwiek Sri Wahyuni, MS., Ph.D. for her unwavering support and guidance throughout the research process.
Conflict of interest
The authors declare that the research was conducted in the absence of any commercial or financial relationships that could be construed as a potential conflict of interest.
Publisher’s note
All claims expressed in this article are solely those of the authors and do not necessarily represent those of their affiliated organizations, or those of the publisher, the editors and the reviewers. Any product that may be evaluated in this article, or claim that may be made by its manufacturer, is not guaranteed or endorsed by the publisher.
References
Abrar M. M., Shah S. A. A., Sun N., Mehmood K., Aziz T., Waqas M. A., et al. (2023). Long-term manure application enhances organic carbon and nitrogen stocks in Mollisol subsoil. Land Degradation Dev. 34, 815–832. doi: 10.1002/ldr.4498
Anggria L., Kasno A., Rochayati S. (2012). Effect of organic matter on nitrogen mineralization in flooded and dry soil. ARPN J. Agric. Biol. Sci. 7, 586–590. Available at: https://www.arpnjournals.com/jabs/volume_08_2012.htm.
Ardiarini N. R., Arisandi F. D., Setyanto P. (2020). Characteristics of rice plant with low methane emission. Ecology Environment COnservartion 26, 150–155. Available at: http://www.envirobiotechjournals.com/article_abstract.php?aid=10440&iid=301&jid=3.
Ashraf M. N., Hu C., Wu L., Duan Y., Zhang W., Aziz T., et al. (2020). Soil and microbial biomass stoichiometry regulate soil organic carbon and nitrogen mineralization in rice-wheat rotation subjected to long-term fertilization. J. Soils Sediments 20, 3103–3113. doi: 10.1007/s11368-020-02642-y
Behnke G., Pittelkow C., Nafziger E., Villamil M. (2018). Exploring the relationships between greenhouse gas emissions, yields, and soil properties in cropping systems. Agriculture 8, 62. doi: 10.3390/agriculture8050062
Bhattarai D., Abagandura G. O., Nleya T., Kumar S. (2021). Responses of soil surface greenhouse gas emissions to nitrogen and sulfur fertilizer rates to Brassica carinata grown as a bio-jet fuel. Global Change Biol. Bioenergy 13, 627–639. doi: 10.1111/gcbb.12784
Bhuiyan M. S. I., Rahman A., Kim G. W., Das S., Kim P. J. (2021). Eco-friendly yield-scaled global warming potential assists to determine the right rate of nitrogen in rice system: A systematic literature review. Environ. pollut. (Barking Essex: 1987) 271, 116386. doi: 10.1016/j.envpol.2020.116386
Cai Z., Shan Y., Xu H. (2007). Effects of nitrogen fertilization on CH4 emissions from rice fields. Soil Sci. Plant Nutr. 53, 353–361. doi: 10.1111/j.1747-0765.2007.00153.x
Central Statistics Agency (2023). “Jember regency in figures,” in Jember: central statistics agency region jember (Jember, Indonesia: Central Statistics Agency Region Jember). Available at: https://jemberkab.bps.go.id/publication/2023/02/28/46b8ccfda84206c194817bd2/kabupaten-jember-dalam-angka-2023.html.
Chandrasekaran D., Tabassum-Abbasi, Abbasi T., Abbasi S. A. (2022). Assessment of methane emission and the factors that influence it, from three rice varieties commonly cultivated in the state of Puducherry. Atmosphere 13, 1811. doi: 10.3390/atmos13111811
Chen M., Chang L., Zhang J., Guo F., Vymazal J., He Q., et al. (2020). Global nitrogen input on wetland ecosystem: The driving mechanism of soil labile carbon and nitrogen on greenhouse gas emissions. Environ. Sci. Ecotechnology 4, 100063. doi: 10.1016/j.ese.2020.100063
Cheng W., Padre A. T., Sato C., Shiono H., Hattori S., Kajihara A., et al. (2016). Changes in the soil C and N contents, C decomposition and N mineralization potentials in a rice paddy after long-term application of inorganic fertilizers and organic matter. Soil Sci. Plant Nutr. 62, 212–219. doi: 10.1080/00380768.2016.1155169
Chu H., Fujii T., Morimoto S., Lin X., Yagi K., Hu J., et al. (2007). Community structure of ammonia-oxidizing bacteria under long-term application of mineral fertilizer and organic manure in a sandy loam soil. Appl. Environ. Microbiol. 73, 485–491. doi: 10.1128/aem.01536-06
Conrad R. (2007). Microbial ecology of methanogens and methanotrophs. Adv. Agron. 96, 1–63. doi: 10.1016/S0065-2113(07)96005-8
Datta A., Santra S. C., Adhya T. K. (2013). Effect of inorganic fertilizers (N, P, K) on methane emission from tropical rice field of India. Atmospheric Environ. (Oxford England: 1994) 66, 123–130. doi: 10.1016/j.atmosenv.2012.09.001
Du Y., Cui B., Wang Z., Sun J., Niu W. (2020). Effects of manure fertilizer on crop yield and soil properties in China: A meta-analysis. Catena 193. doi: 10.1016/j.catena.2020.104617
Gorh D., Baruah K. K. (2019). Estimation of methane and nitrous oxide emission from wetland rice paddies with reference to global warming potential. Environ. Sci. pollut. Res. 26, 16331–16344. doi: 10.1007/s11356-019-05026-z
Gu J., Nicoullaud B., Rochette P., Grossel A., Henault C., Cellier P., et al. (2013). A regional experiment suggests that soil texture is a major control of N2O emissions from tile-drained winter wheat fields during the fertilization period. Soil Biol. Biochem. 60, 134–141. doi: 10.1016/j.soilbio.2013.01.029
Guo C., Liu X., He X. (2022). A global meta-analysis of crop yield and agricultural greenhouse gas emissions under nitrogen fertilizer application. Sci. Total Environ. 831, 154982. doi: 10.1016/j.scitotenv.2022.154982
Haque M. M., Datta J., Ahmed T., Ehsanullah M., Karim M. N., Akter M. S., et al. (2021). Organic amendments boost soil fertility and rice productivity and reduce methane emissions from paddy fields under sub-tropical conditions. Sustainability (Switzerland) 13, 1–12. doi: 10.3390/su13063103
Herliana O., Widiyawati I., Hadi S. N. (2019). The effect of stable manure and seedling number on growth and yield of black rice (Oryza sativa L. Indica). Caraka Tani: J. Sustain. Agric. 34, 13–21. doi: 10.20961/carakatani.v34i1.27098
Hou P., Deng X., Wang J., Xue L., Zhang Y., Xu T., et al. (2023). Fertilization and global warming impact on paddy CH4 emissions. Int. J. Environ. Res. Public Health 20. doi: 10.3390/ijerph20064680
Hou Q., Ni Y., Huang S., Zuo T., Wang J., Ni W. (2023). Effects of substituting chemical fertilizers with manure on rice yield and soil labile nitrogen in paddy fields of China: A meta-analysis. Pedosphere 33, 172–184. doi: 10.1016/j.pedsph.2022.09.003
Hu Y., Su M., Jiao L. (2023). Peak and fall of Chinas agricultural GHG emissions. J. Cleaner Production 389(June 2022), 136035. doi: 10.1016/j.jclepro.2023.136035
International Atomic Energy Agency (IAEA). (1993). Manual on Measurement of Methane and Nitrous Oxide Emission from Agricutural (Vienna: IAEA).
Islam S. M. M., Gaihre Y. K., Islam M. R., Ahmed M. N., Akter M., Singh U., et al. (2022). Mitigating greenhouse gas emissions from irrigated rice cultivation through improved fertilizer and water management. J. Environ. Manage. 307, 114520. doi: 10.1016/j.jenvman.2022.114520
Jahangir M. M. R., Bell R. W., Uddin S., Ferdous J., Nasreen S. S., Haque M. E., et al. (2022). Conservation agriculture with optimum fertilizer nitrogen rate reduces GWP for rice cultivation in floodplain soils. Front. Environ. Sci. 10. doi: 10.3389/fenvs.2022.853655
Ji Q., Buitenhuis E., Suntharalingam P., Sarmiento J. L., Ward B. B. (2018). Global nitrous oxide production determined by oxygen sensitivity of nitrification and denitrification. Global Biogeochemical Cycles 32, 1790–1802. doi: 10.1029/2018gb005887
Kacprzak M., Malinska K., Grosser A., Sobik-Szoltysek J., Wystalska K., Jasinska A., et al. (2023). Cycles of carbon, nitrogen and phosphorus in poultry manure management technologies environmental aspects. Crit. Rev. Environ. Sci. Technol. 53, 914–938. doi: 10.1080/10643389.2022.2096983
Lazcano C., Zhu-Barker X., Decock C. (2021). Effects of organic fertilizers on the soil microorganisms responsible for N2O emissions: A review. Microorganisms 9, 1–18. doi: 10.3390/microorganisms9050983
Lee J. H., Lee J. G., Jeong S. T., Gwon H. S., Kim P. J., Kim G. W. (2020). Straw recycling in rice paddy: Trade-off between greenhouse gas emission and soil carbon stock increase. Soil Tillage Res. 199, 104598. doi: 10.1016/j.still.2020.104598
Maraseni T. N., Deo R. C., Qu J., Gentle P., Neupane P. R. (2018). An international comparison of rice consumption behaviours and greenhouse gas emissions from rice production. J. Cleaner Production 172, 2288–2300. doi: 10.1016/j.jclepro.2017.11.182
Mayer M., Krause H.-M., Fliessbach A., Mader P., Steffens M. (2022). Fertilizer quality and labile soil organic matter fractions are vital for organic carbon sequestration in temperate arable soils within a long-term trial in Switzerland. Geoderma 426, 116080. doi: 10.1016/j.geoderma.2022.116080
Ministry of Agriculture. (2021). Location-Specific N, P and K Fertilizer Recommendations for Rice, Corn and Soybean Plants, on Pady Fields (Per District), Book I: RICE (Jakarta: Agriculture Research and Development Agency-Ministry of Agriculture of the Republic of Indonesia). Available at: https://repository.pertanian.go.id/items/7e2308ee-22e0-40dd-9cdf-d28cd104c73f.
Mohanty S., Nayak A. K., Swain C. K., Dhal B. R., Kumar A., Kumar U., et al. (2020). Impact of integrated nutrient management options on GHG emission, N loss and N use efficiency of low land rice. Soil Tillage Res. 200, 104616. doi: 10.1016/j.still.2020.104616
Morimoto S., Hayatsu M., Takada Hoshino Y., Nagaoka K., Yamazaki M., Karasawa T., et al. (2011). Quantitative analyses of ammonia-oxidizing Archaea (AOA) and ammonia-oxidizing bacteria (AOB) in fields with different soil types. Microbes Environments 26, 248–253. doi: 10.1264/jsme2.me11127
Ren T., Wang J., Chen Q., Zhang F., Lu S. (2014). The effects of manure and nitrogen fertilizer applications on soil organic carbon and nitrogen in a high-input cropping system. PloS One 9, e97732. doi: 10.1371/journal.pone.0097732
Santoro A. E., Buchwald C., McIlvin M. R., Casciotti K. L. (2011). Isotopic signature of N 2O produced by marine ammonia-oxidizing archaea. Science 333, 1282–1285. doi: 10.1126/science.1208239
Setyanto P., Rosenani A. B., Boer R., Fauziah C. I., Khanif M. J. (2016). the effect of rice cultivars on methane emission from irrigated rice field. Indonesian J. Agric. Sci. 5, 20. doi: 10.21082/ijas.v5n1.2004.p20-31
Shaaban M., Khalid M. S., Hu R., Zhou M. (2022). Effects of water regimes on soil N2O, CH4 and CO2 emissions following addition of dicyandiamide and N fertilizer. Environ. Res. 212, 113544. doi: 10.1016/j.envres.2022.113544
Smeaton D. C., Cox T., Kerr S., Dynes R. (2011). Relationships between farm productivity, profitability, N leaching and GHG emissions: a modelling approach. Proc. New Z. Grassland Assoc. 73, 57–61. doi: 10.33584/jnzg.2011.73.2834
Sun L., Ma Y., Liu Y., Li J., Deng J., Rao X., et al. (2019). The combined effects of nitrogen fertilizer, humic acid, and gypsum on yield-scaled greenhouse gas emissions from a coastal saline rice field. Environ. Sci. pollut. Res. Int. 26, 19502–19511. doi: 10.1007/s11356-019-05363-z
Sung J., Kim W., Oh T. K., So Y. S. (2023). Nitrogen (N) use efficiency and yield in rice under varying types and rates of N source: chemical fertilizer, livestock manure compost and food waste-livestock manure compost. Appl. Biol. Chem. 66. doi: 10.1186/s13765-022-00766-y
Supijatno, Chozin M. A., Sopandie D., Trikoesoemaningtyas, Junaedi A., Lubis I. (2016). Water consumption evaluation among rice genotypes showing possibility to explore benefit of water use efficiency. Indonesian J. Agron. 40, 15–20. doi: 10.24831/jai.v40i1.13198
Wang Y., Zhang P., Li M., Guo Z., Ullah S., Rui Y., et al. (2020). Alleviation of nitrogen stress in rice (Oryza sativa) by ceria nanoparticles. Environ. Science. Nano 7, 2930–2940. doi: 10.1039/d0en00757a
Wihardjaka A., Harsanti E. A. (2021). Dukungan pupuk organik untuk memperbaiki kualitas tanah pada pengelolaan padi sawah ramah lingkungan. Jurnal Pangan 30, 53–64. doi: 10.33964/jp.v30i1.496
Wihardjaka A., Sarwoto S. (2015). Emisi gas rumah kaca dan hasil gabah dari beberapa varietas padi unggul tipe baru di lahan sawah tadah hujan di jawa tengah. Jurnal Ecolab 9, 9–16. doi: 10.20886/jklh.2015.9.1.9-16
Win E. P., Win K. K., Bellingrath-Kimura S. D., Oo A. Z. (2021). Influence of rice varieties, organic manure and water management on greenhouse gas emissions from paddy rice soils. PloS One 16, 1–22. doi: 10.1371/journal.pone.0253755
Xiong Z.-Q., Xing G.-X., Zhu Z.-L. (2007). Nitrous oxide and methane emissions as affected by water, soil and nitrogen. Pedosphere 17, 146–155. doi: 10.1016/s1002-0160(07)60020-4
Yang W., Hu Y., Yang M., Wen H., Jiao Y. (2023). Methane uptake and nitrous oxide emission in saline soil showed high sensitivity to nitrogen fertilization addition. Agron. (Basel Switzerland) 13, 473. doi: 10.3390/agronomy13020473
Yuan J., Sha Z., Hassani D., Zhao Z., Cao L.k. (2017). Assessing environmental impacts of organic and inorganic fertilizer on daily and seasonal Greenhouse Gases effluxes in rice field. Atmospheric Environ. 155, 119–128. doi: 10.1016/j.atmosenv.2017.02.007
Zhang W., Sheng R., Zhang M., Xiong G., Hou H., Li S., et al. (2018). Effects of continuous manure application on methanogenic and methanotrophic communities and methane production potentials in rice paddy soil. Agriculture Ecosyst. Environ. 258, 121–128. doi: 10.1016/j.agee.2018.02.018
Zhou X., Lv X., Tao Y., Wu L., Havrilla C. A., Zhang Y. (2019). Divergent responses of nitrous oxide, methane and carbon dioxide exchange to pulses of nitrogen addition in a desert in Central Asia. Catena 173, 29–37. doi: 10.1016/j.catena.2018.09.048
Keywords: rice, fertilizer, yield, methane, nitrous oxide
Citation: Slameto, Fahrudin DE and Saputra MW (2024) Effect of fertilizer composition and different varieties on yield, methane and nitrous oxide emission from rice field in East Java Indonesia. Front. Agron. 6:1345283. doi: 10.3389/fagro.2024.1345283
Received: 27 November 2023; Accepted: 05 February 2024;
Published: 29 February 2024.
Edited by:
Binoy Sarkar, University of South Australia, AustraliaReviewed by:
Anchal Dass, Indian Agricultural Research Institute (ICAR), IndiaKanu Murmu, Bidhan Chandra Krishi Viswavidyalaya, India
Copyright © 2024 Slameto, Fahrudin and Saputra. This is an open-access article distributed under the terms of the Creative Commons Attribution License (CC BY). The use, distribution or reproduction in other forums is permitted, provided the original author(s) and the copyright owner(s) are credited and that the original publication in this journal is cited, in accordance with accepted academic practice. No use, distribution or reproduction is permitted which does not comply with these terms.
*Correspondence: Slameto, c2xhbWV0b2hkc2N0LmZhcGVydGFAdW5lai5hYy5pZA==