 Fausto Freire1*
 Manuel Carrillo2Braulio Lahuathe2
 Luis Vera2Alvaro Chipantiza1Wuellins Durango2Betty Rivadeneira2Yelitza Garcia-Orellana2,3
- 1Faculty of Engineering and Industrial Sciences, Universidad UTE, Quito, Ecuador
- 2Departamento de Manejo de Suelos y Aguas, Estación Experimental Tropical Pichilingue, Instituto Nacional de Investigaciones Agropecuarias (INIAP), Quevedo, Ecuador
- 3Dpto, Ingeniería Agrícola, Universidad Centro Occidental Lisandro Alvarado (UCLA), Barquisimeto, Venezuela
It is important to know the water status of cocoa plants because a water deficit negatively affects fruit set and fruit maturity reducing their quality. The objective of this work is determining the existence of a relationship between the fluctuation of trunk diameter and the water status of adult cocoa trees which will allow a continuous and low-cost measurement of the water status of the plants. To meet this objective a trial was carried out at Hacienda La Clemencia located in the province of Guayas- Ecuador, the foliar and stem water potentials, maximum daily trunk fluctuations (MCDT), gas exchange, and soil moisture levels were evaluated. The trial was conducted for 128 days, from July to October 2023. The physiological variables were measured twice a week, while the meteorological variables, soil moisture, and MCDT were recorded continuously. The results showed that there is a correlation between the physiological variables evaluated and MCDT. In conclusion, there is a significant relationship between stem potential and MCDT in adult cocoa plants.
1 Introduction
Cocoa (Theobroma cacao L.) is a perennial crop of great economic importance for exporting countries in the Americas, Africa, and Asia (Nair, 2021). In Ecuador, cocoa plantations occupy more than 12% of the total cultivated land, generating direct jobs for about 4% of the working population (Neira, 2016).
Despite the importance of cocoa cultivation as a significant source of income for millions of small farmers, much is yet to be explored regarding the functioning of the cocoa tree. This can be explained since experimental work is costly and time-consuming, and it has a long production cycle, resulting in little knowledge about the plant’s response to water stress conditions, climate change, nutrient effects, and phenology. At present, no tools are available to support decision-making regarding its main agricultural practices, such as irrigation, fertilization, and pruning (Tosto et al., 2023).
It is estimated that in Latin American countries the irrigation needs of perennial crops will increase due to climate change, affecting water availability in the coming decades because of the increasing crop requirements (Borja et al., 2017).
A study by Ortiz-Bobea et al. (2021), states that since 1961 there has been a reduction in agricultural productivity by ~26-34% due to the effect of anthropogenic climate change (ACC) in warmer regions such as Africa, Latin America, and the Caribbean.
Cocoa farmers in Ecuador unfortunately, are poorly prepared to adopt techniques to cope with changes in rainfall patterns because of climate change (Idawati et al., 2024). Consequently, it will be essential to use technology to improve irrigation efficiency and adopt agricultural practices that lead to a sustainable model for cocoa production (Moreno-Miranda et al., 2020).
The adoption of irrigation technologies can reduce the impact of climate change on crop production. These technologies can reduce the impact on yields due to the effect of strong climatic variability, characterized by high temperatures, reduced rainfall and shorter rainy seasons (Cavazza et al., 2018).
In cocoa plants, water shortage in the soil causes morphological (reduced root development, foliar, plant vigor), physiological (reduced photosynthetic activity, stomatal density, chlorophyll, water potential), biochemical (reduced superoxide dismutase, catalase, ascorbate peroxidase, increased ethylene), and chemical (reduced macro- and microelements) problems (Janani et al., 2019; Alban et al., 2015).
In crops such as grapes has been evidence is available that there is a strong correlation between soil water potential, plant water potential, and stomatal conductance (Centeno et al., 2010). Water potential is the most commonly used parameter to indicate the plant water status and determine irrigation timing in grapes (Barbagallo et al., 2021). However, it is a difficult measure to take, as it requires equipment and specialized labor.
The water potential is a point measurement, necessitating a dynamic nature indicator for developing irrigation programs that account for climatic and soil conditions. There are experiences in peach and lemon trees that continuous and automatic data can be obtained by measuring trunk diameter fluctuations, allowing the immediate detection of water deficit situations (Goldhamer et al., 1999; Ortuño et al., 2009).
Currently, there is a boom in the development of new techniques to evaluate plant water status directly, continuously and in real time, such as sap flow (SF) and Maximum daily trunk shrinkage (MDS), which have been successfully used in different crops (Ortuño et al., 2006b; Conejero et al., 2007; Mirás-Avalos et al., 2016; Chai et al., 2021; Zhao et al., 2023). These advancements aim to improve irrigation management, enhance water use efficiency, and produce higher-quality food with lower environmental impact (Velasco-Muñoz et al., 2019).
Given this context, it is necessary to optimize water use by adopting irrigation technologies that mitigate the impact of ACC on crop production. These technologies can reduce the reliance of crop yields on rainfall distribution, which is often associated with unpredictable variability (Cavazza et al., 2018; Velasco-Muñoz et al., 2019).
In this regard, advances have been made using parameters derived from micrometric variations in trunk diameter (very small variations that occur in stem diameter) what serve as indicators of plant water status. These methods have been tested in various perennial crops, including peach (Conejero et al., 2010; Mirás-Avalos et al., 2017), grape (Zhang et al., 2021), lemon tree (García-Orellana et al., 2007), olive tree (Moriana et al., 2011; Girón et al., 2016), almond tree (Puerto et al., 2013), and plum trees (Paltineanu et al., 2020).
Although this technique has been known for more than twenty years, there are few studies of this type in tropical conditions. Studies of this type in tropical conditions are few. The greatest benefit of this technique is could that it replaces traditional soil water status measurements, which are time-consuming, costly, and require specialized labor
Based on the above, the objective of this study is to determine the relationship between trunk diameter fluctuation and the plant water status of adult cocoa trees by (1) evaluating the behavior of physiological variables of adult cocoa trees, (2) correlating physiological variables with meteorological parameters, and (3) correlating water potential (leaf and stem) with MCDT.
2 Materials and methods
The trial was conducted at Hacienda “La Clemencia”, located in Canton Balzar, in the southern part of Guayas Province (1°9’59.24’’ S and 79°44’23.13.13’’ W), at an altitude of 63 meters above sea level. The region has a dry tropical climate (Köppen climate classification: Aw). The study utilized 22-year-old cocoa trees (Theobroma cacao L.) of the CCN-51 genetic material, full production, well maintained, planted in full sun and at a spacing of 1.8 x 2.70 m with 3.80 m between rows. CCN 51 was a clone developed in Ecuador through crosses of ICS-95×IMC-67 (International Cocoa Germplasm Database, 2006).
Within the study plot, two test pits were excavated, where the Ap, A1, B1, and B2 horizons were found, with textural variability ranging from silt loam to clayey soil, characterized by angular and subangular block structures. Roots were observed to a depth of 87 cm, and undeformed soil samples were taken using 100 cm3 cylindrical rings using an Uhland auger in each horizon. These samples were then transported to the laboratory of the Department of Soil and Water Management (DMSA) at the Pichilingue Tropical Experiment Station (EETP) for soil density and hydraulic conductivity determination. The Ap horizon showed average hydraulic conductivity values of 4.8 and 2.9 cm h-¹. Hydraulic conductivity decreased with depth, reaching 1.2 cm h-¹ in the B2 horizon.
Soil pH across different horizons ranged from 5.5 to 6.3, which did not pose any issues for crop nutrition. Nitrogen (N), phosphorus (P), sulfur (S), and boron (B) levels decreased with soil depth. In general, the availability of bases such as calcium (Ca), magnesium (Mg), and potassium (K) was medium to high across the horizons. Zinc (Zn), copper (Cu), iron (Fe), and manganese (Mn) were also present in medium to high amounts, except for Mn, which showed low values at greater depths.
The soil’s electrical conductivity did not show any problems; however, the organic matter content was generally low, typical of tropical soils. The Cation Exchange Capacity (CEC) ranged from low, with 9.59 meq/100 g of soil in the B2 horizon, to high, with 15.49 meq/100 g of soil in the Ap horizon. Bulk density values in the upper horizons ranged between 0.76 to 1.18 t m-3, while deeper horizons showed higher values, ranging from 1.20 to 1.31 t m-3.
Weed control involved two applications of agrochemicals and three manual controls. Fungicide applications, insect pest control, and fertilization were carried out as per the usual practices of local producers.
2.1 Evaluation period
The trial began on June 22, 2023 (day of the year, DOY, 173), with the measurement of physiological variables. Trees of uniform appearance were selected for evaluation, and the trial concluded on November 2, 2023 (DOY 306).
2.2 Measures
2.2.1 Environmental parameters
Meteorological data including precipitation, temperature, relative humidity, atmospheric pressure, and wind speed at 2 m height were recorded every 15 minutes using an automatic station installed at Hacienda “La Clemencia”. Data were retrieved through the Weather Link platform.
For the estimation of the daily evapotranspiration of the reference crop, the FAO56 Penman Monteith equation (Allen, 1998) was used, using the DailyET software (Hess, 1999)
2.2.2 Water relations and gas exchange
Leaf water potential at solar noon (Ψleaf) was measured twice a week on five trees. Additionally, two sunlight-exposed mature leaves per plant were assessed using a pressure chamber.
Stem water potential (Ψstem) at solar noon was measured twice a week on two mature leaves per plant, near the trunk. These leaves were covered with aluminum foil at least 2 h before pressure chamber measurements.
Stomatic conductance (gs) and net photosynthesis (Pn) were measured twice a week at noon, from DOY 173 to 306. A similar number and type of leaves used for Ψleaf measurements were evaluated using an IRGA LCPro portable photosynthesis meter.
2.2.3 Trunk micrometer variations
Throughout the trial, trunk micrometric variations were measured in five trees using a dendrometer specifically designed for cocoa trees with easily accessible and low-cost materials, with a prior calibration (Chimarro and Freire, 2023). The device incorporates a KY-024 module with a linear magnetic Hall effect sensor (SS49E), a double differential comparator (LM393), and a potentiometer, providing both analog and digital outputs.
The dendrometer includes a support structure fabricated using additive manufacturing technology in ABS material, featuring a point axis system that transmits trunk expansion or contraction to the module for quantification (see Figures 1A–C). This structure is secured to cocoa trees using a support structure clamp, depicted in Figure 1D.
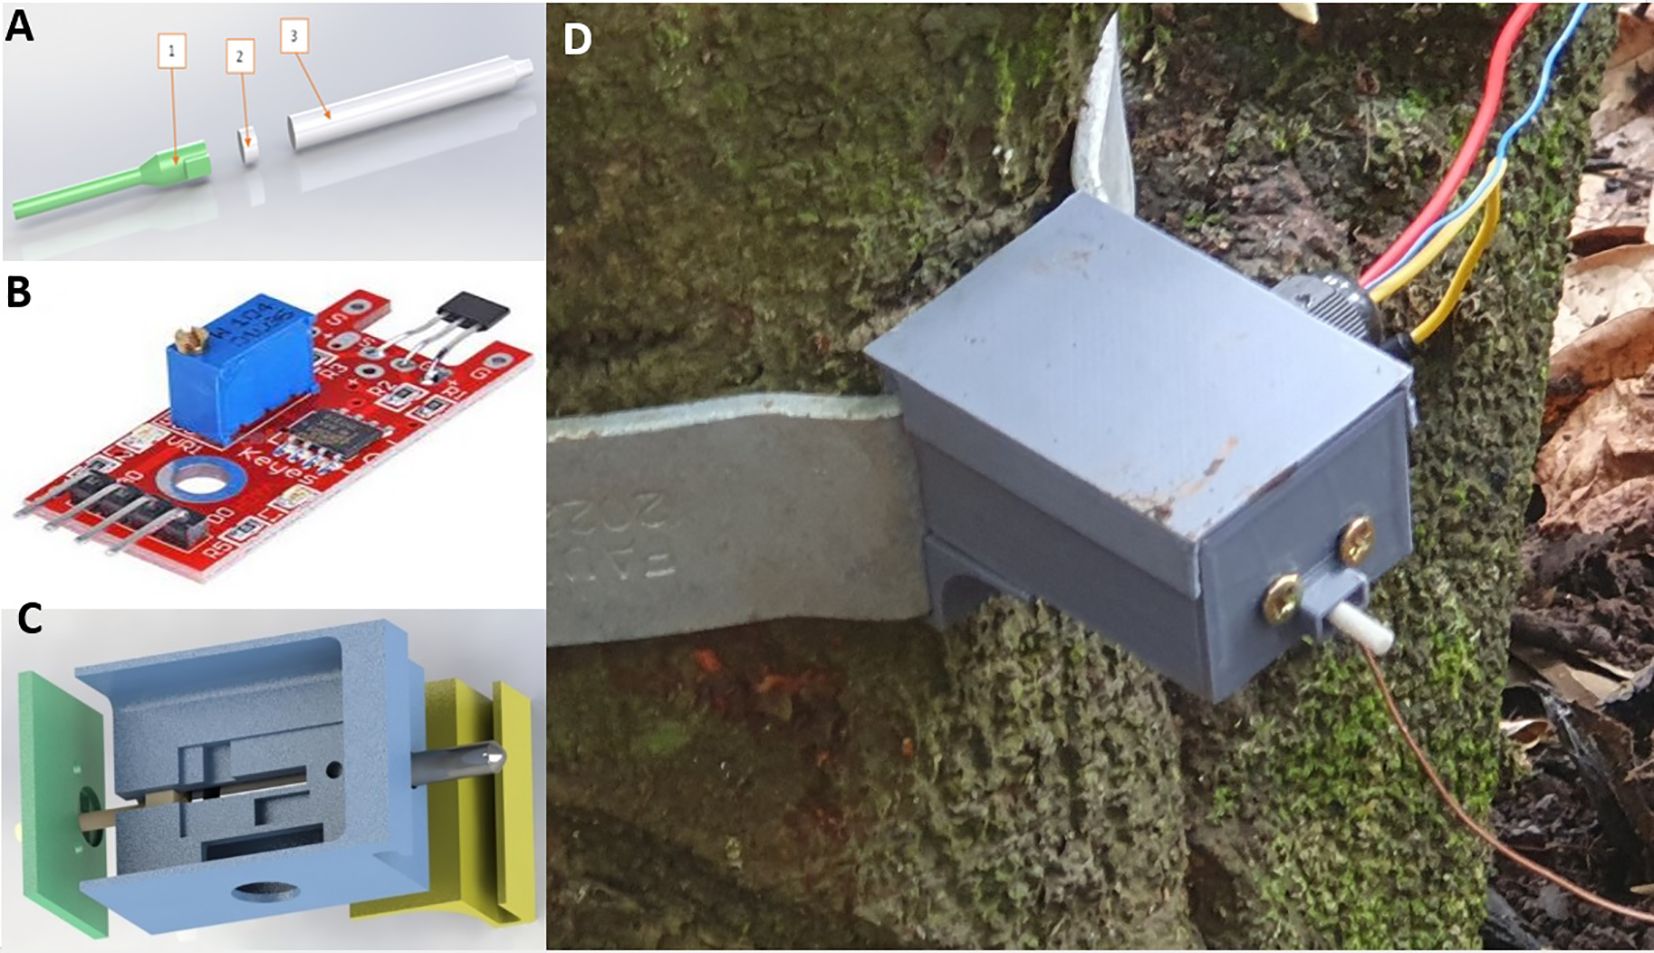
Figure 1. Dendrometer structure. (A) Hall effect sensor KY-024, (B) Point axis system: 1 - photopolymer resin shaft, 2 - neodymium magnet, 3 - steel shaft, (C) Dendrometer supporting structure and (D) Dendrometer installed on the cocoa tree.
2.2.4 Soil moisture measurement
For soil moisture measurements, an FC-28 sensor was employed, comprising a probe with two resistive electrodes (YL-69) and a YL-38 module with an LM393 comparator. The sensor detects moisture through soil conductivity variation, where a conditioning card monitors voltage levels between the electrodes.
To minimize probe deterioration, the sensor is powered intermittently, performing measurements at one-hour intervals. Soil moisture was monitored at three depths (10, 30, and 50 cm) along the cocoa tree roots and located at 25 cm from the tree trunk.
2.2.5 Data acquisition/transmission
The data acquisition and transmission system used an ESP32 microprocessor, to which the moisture sensors and dendrometers were connected (see Figure 2). This system was responsible for receiving data from these sensors and transmitting it to an IoT server in the cloud via an internet network.
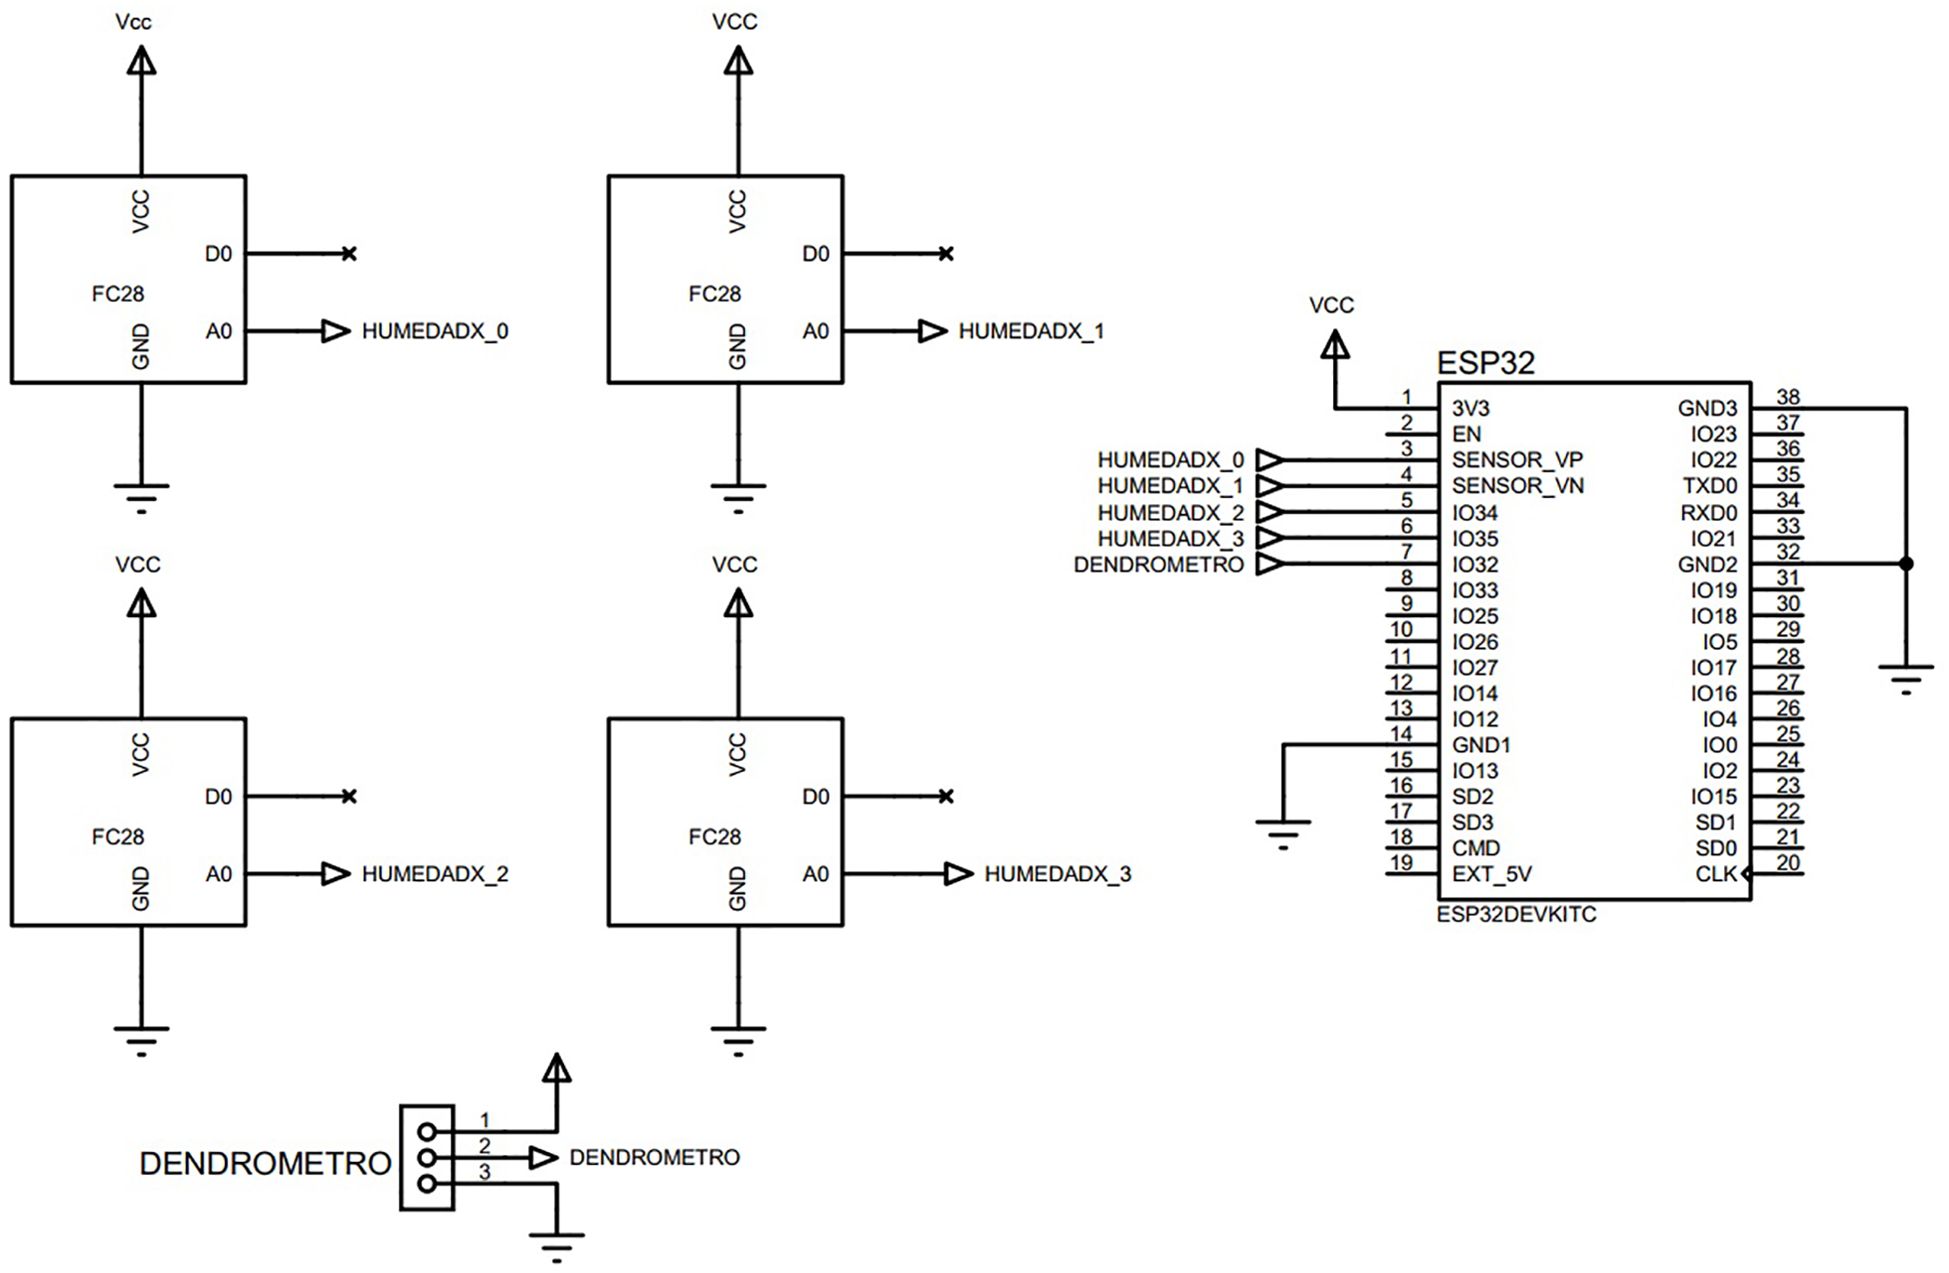
Figure 2. Data acquisition and transmission system.
Statistical analysis
A quasi-experimental study was conducted, selecting five trees, which were selected as a random sample within the plots and analyzed as completely random.
3 Results
During the experimental period, Reference Crop Evapotranspiration (ETo) levels reached a cumulative value of 453 mm, progressively increasing and reaching values above 4.5 mm d-1 in September, typical behaviour of an area with a tropical climate. (see Figure 3A).
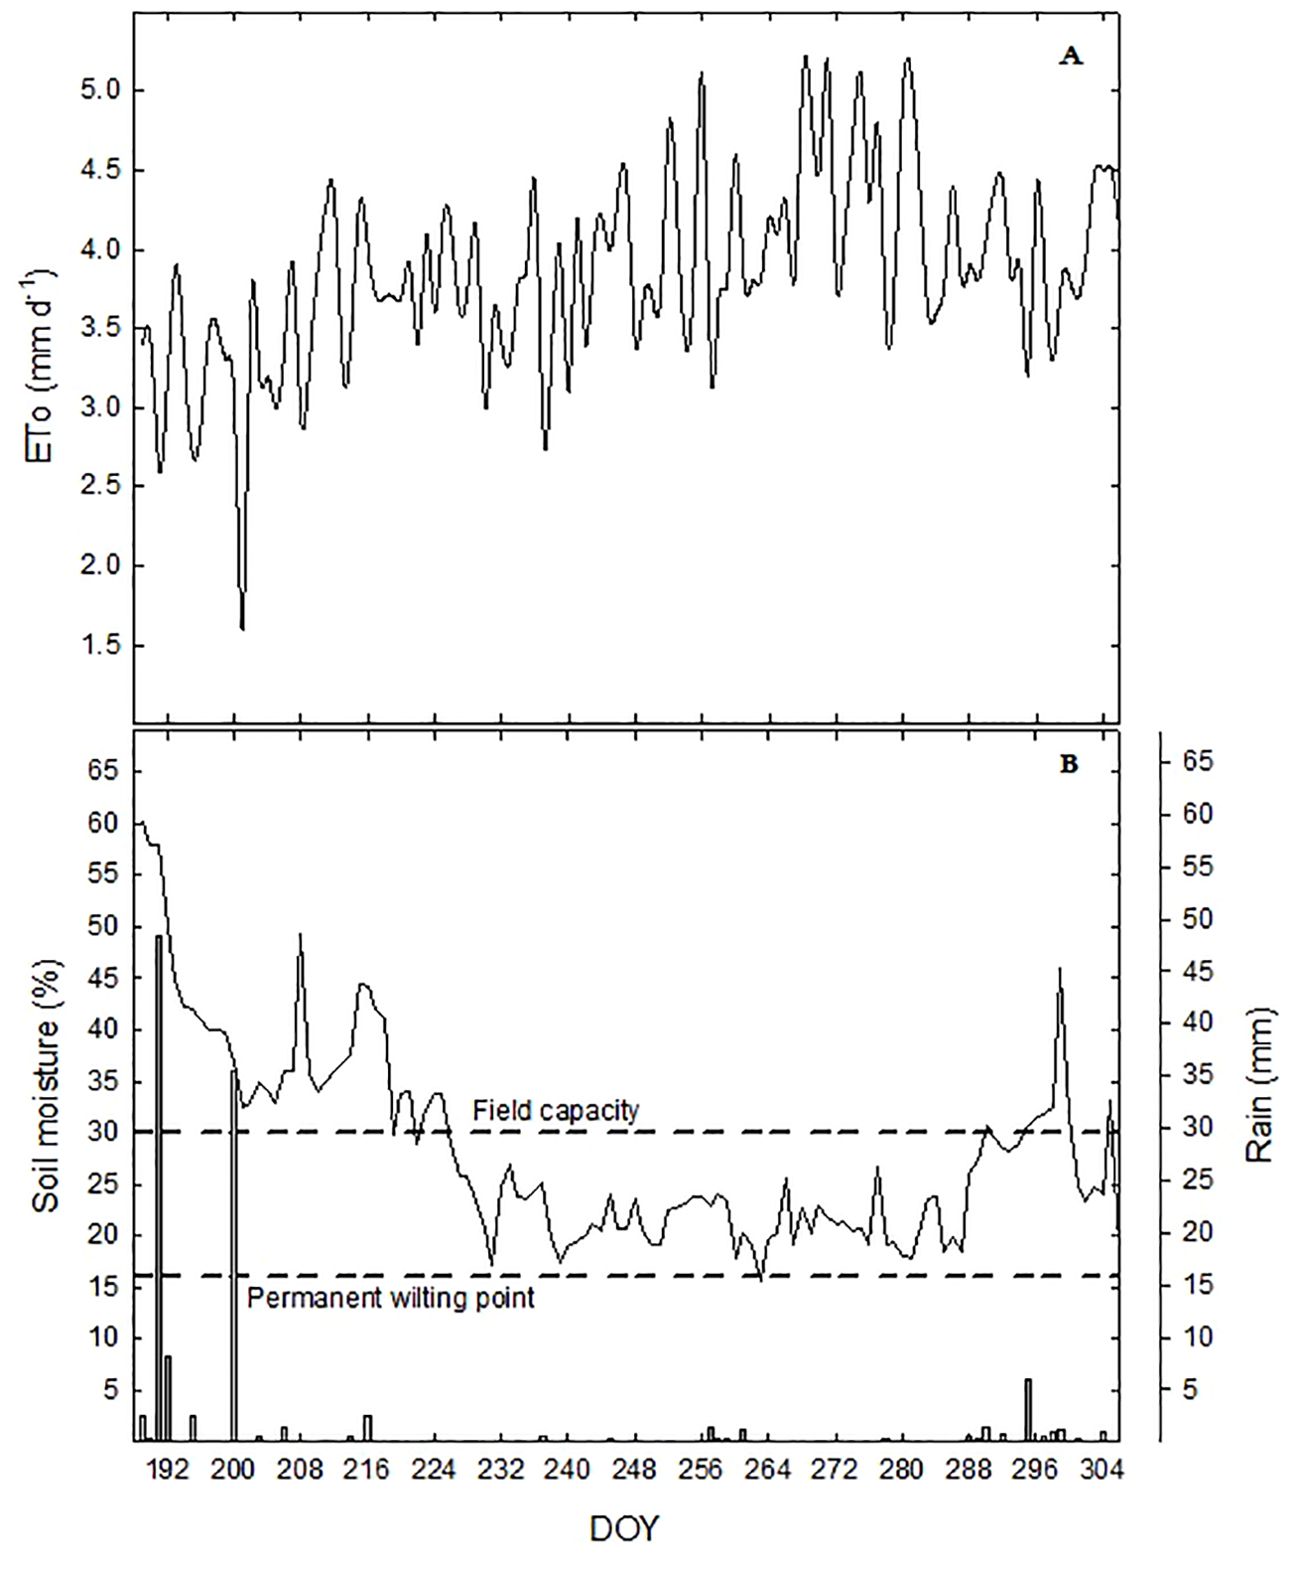
Figure 3. Values of the reference crop evapotranspiration (ETo) (A), soil moisture (solid line) and rainfall (vertical bars) (B) during the experimental period.
The average maximum temperature was 29°C, and the average relative humidity was 70%. Throughout the trial, the total precipitation was 120 mm. Starting from DOY 226 (August 14), the soil moisture remained below field capacity, a trend that continued until day 290 (October 12), where a series of precipitations occurred that raised the soil moisture above field capacity, allowing for the evaluation of the crop under different moisture conditions, but without reaching water stress (see Figure 3B).
In Figure 4A, the levels of Ψleaf of the cocoa plant showed variations in its behaviour throughout the evaluated period, with the lowest values observed on days 206 (September 25) and 286 (October 13), measuring -0.67 and -0.51 MPa, respectively. The most positive value occurred on day 192 (July 11), reaching -0.16 MPa, likely influenced by preceding rainfall events as shown in Figure 4B.
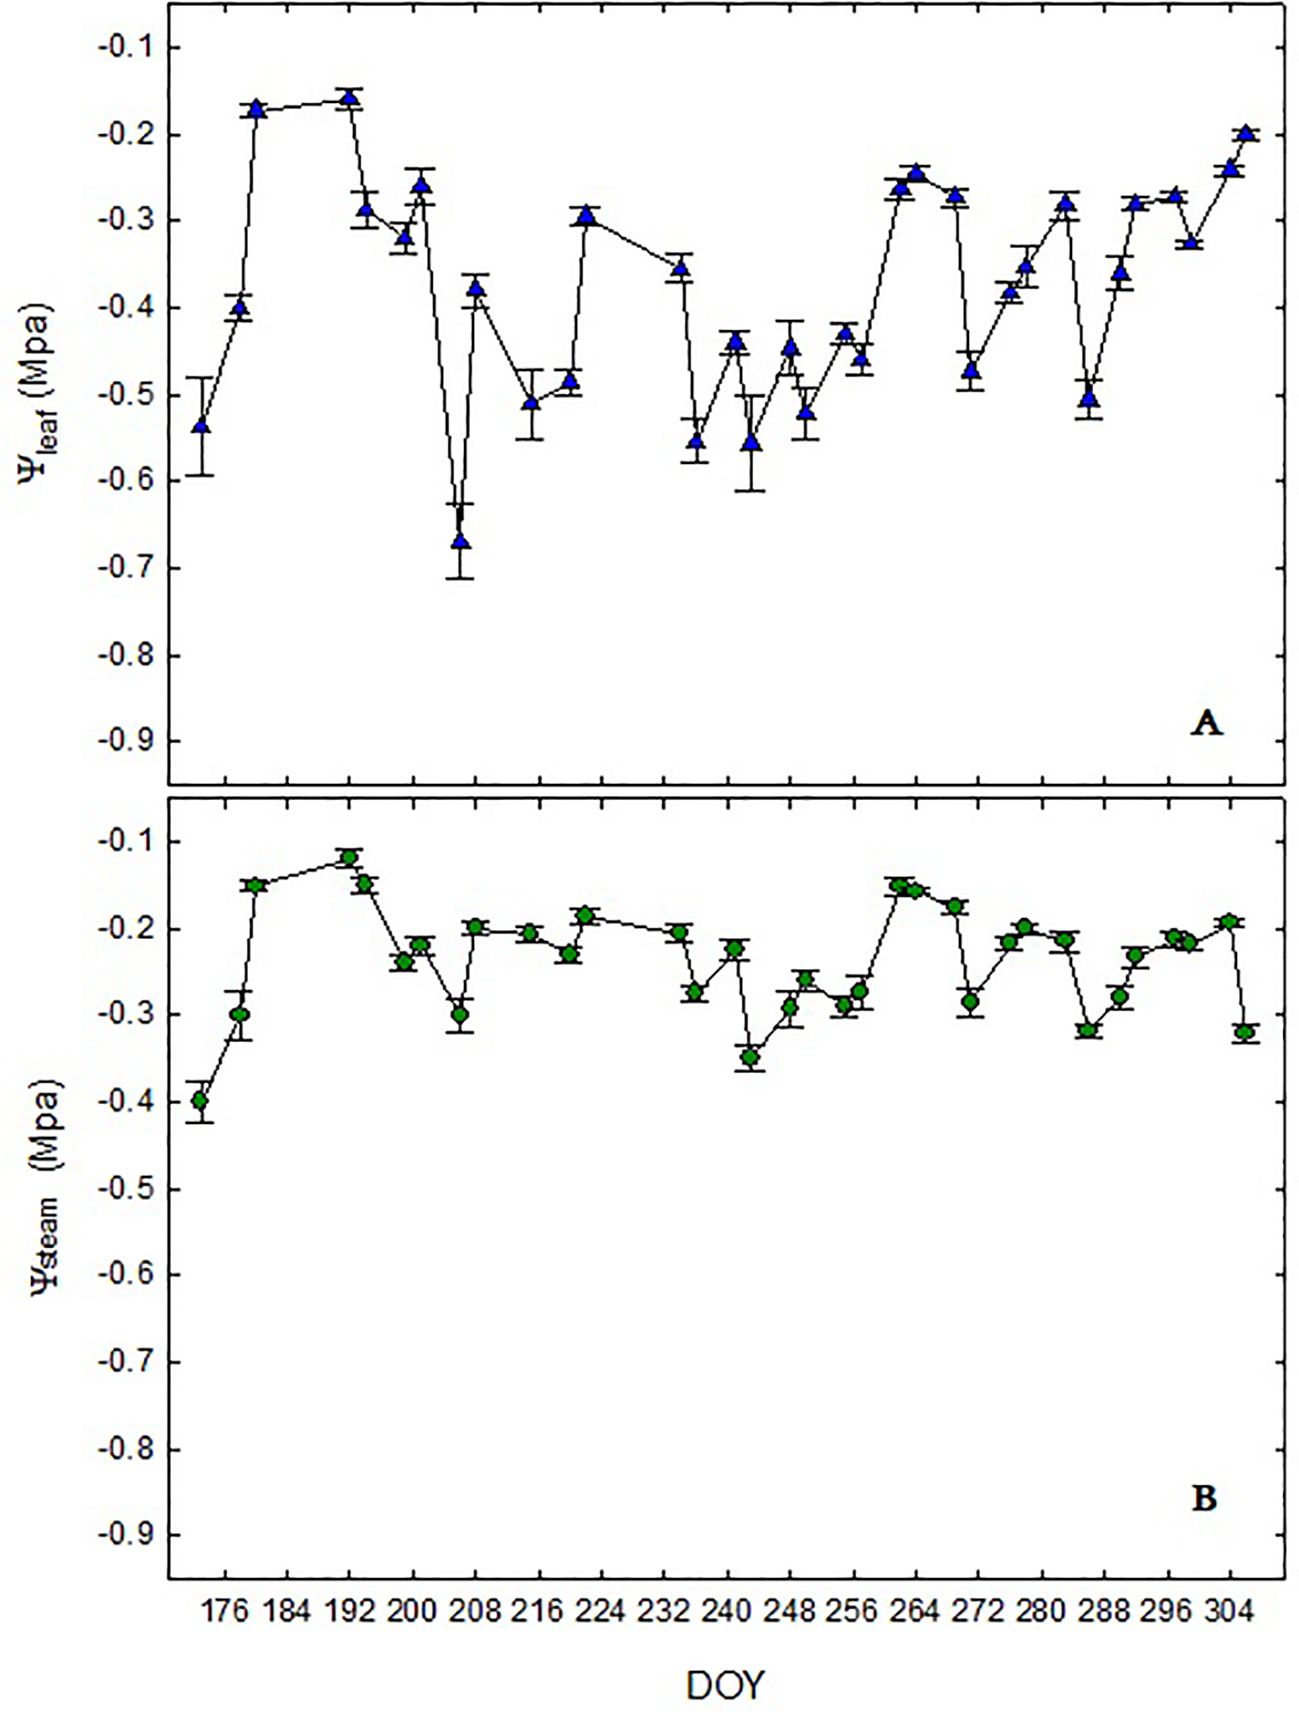
Figure 4. Values of midday leaf water potential (Ψleaf) (A) and stem water potential (Ψstem) (B) of adult cocoa trees during the experimental period. The vertical bar indicates the error of the mean. Each point represents the mean of ten values.
Similarly, Ψstem in cocoa plants showed a comparable trend to Ψleaf, with the lowest values recorded on days 206 and 286 (October 13), measuring -0.30 and -0.32 MPa, respectively. The most positive value of of -0.12 MPa was observed on day 192.
Throughout the trial period, despite decreasing soil moisture values (Figure 3B) and the absence of precipitation events, cocoa trees did not consistently exhibit a decline in water potential.
This resilience could be attributed to osmotic adjustments described by Jiménez-Pérez et al. (2019) in Guasare-type cocoa, where trees maintained turgor even under unfavorable midday conditions when the demand for water evaporation is highest.
Figure 5A illustrates respiration rate (E) levels during the trial, peaking on days 269 (September 26) and 271 (September 28) at 2.57 and 2.62 mmol m-² s-¹, respectively. These peaks coincided with minor precipitation events (see Figure 3B).
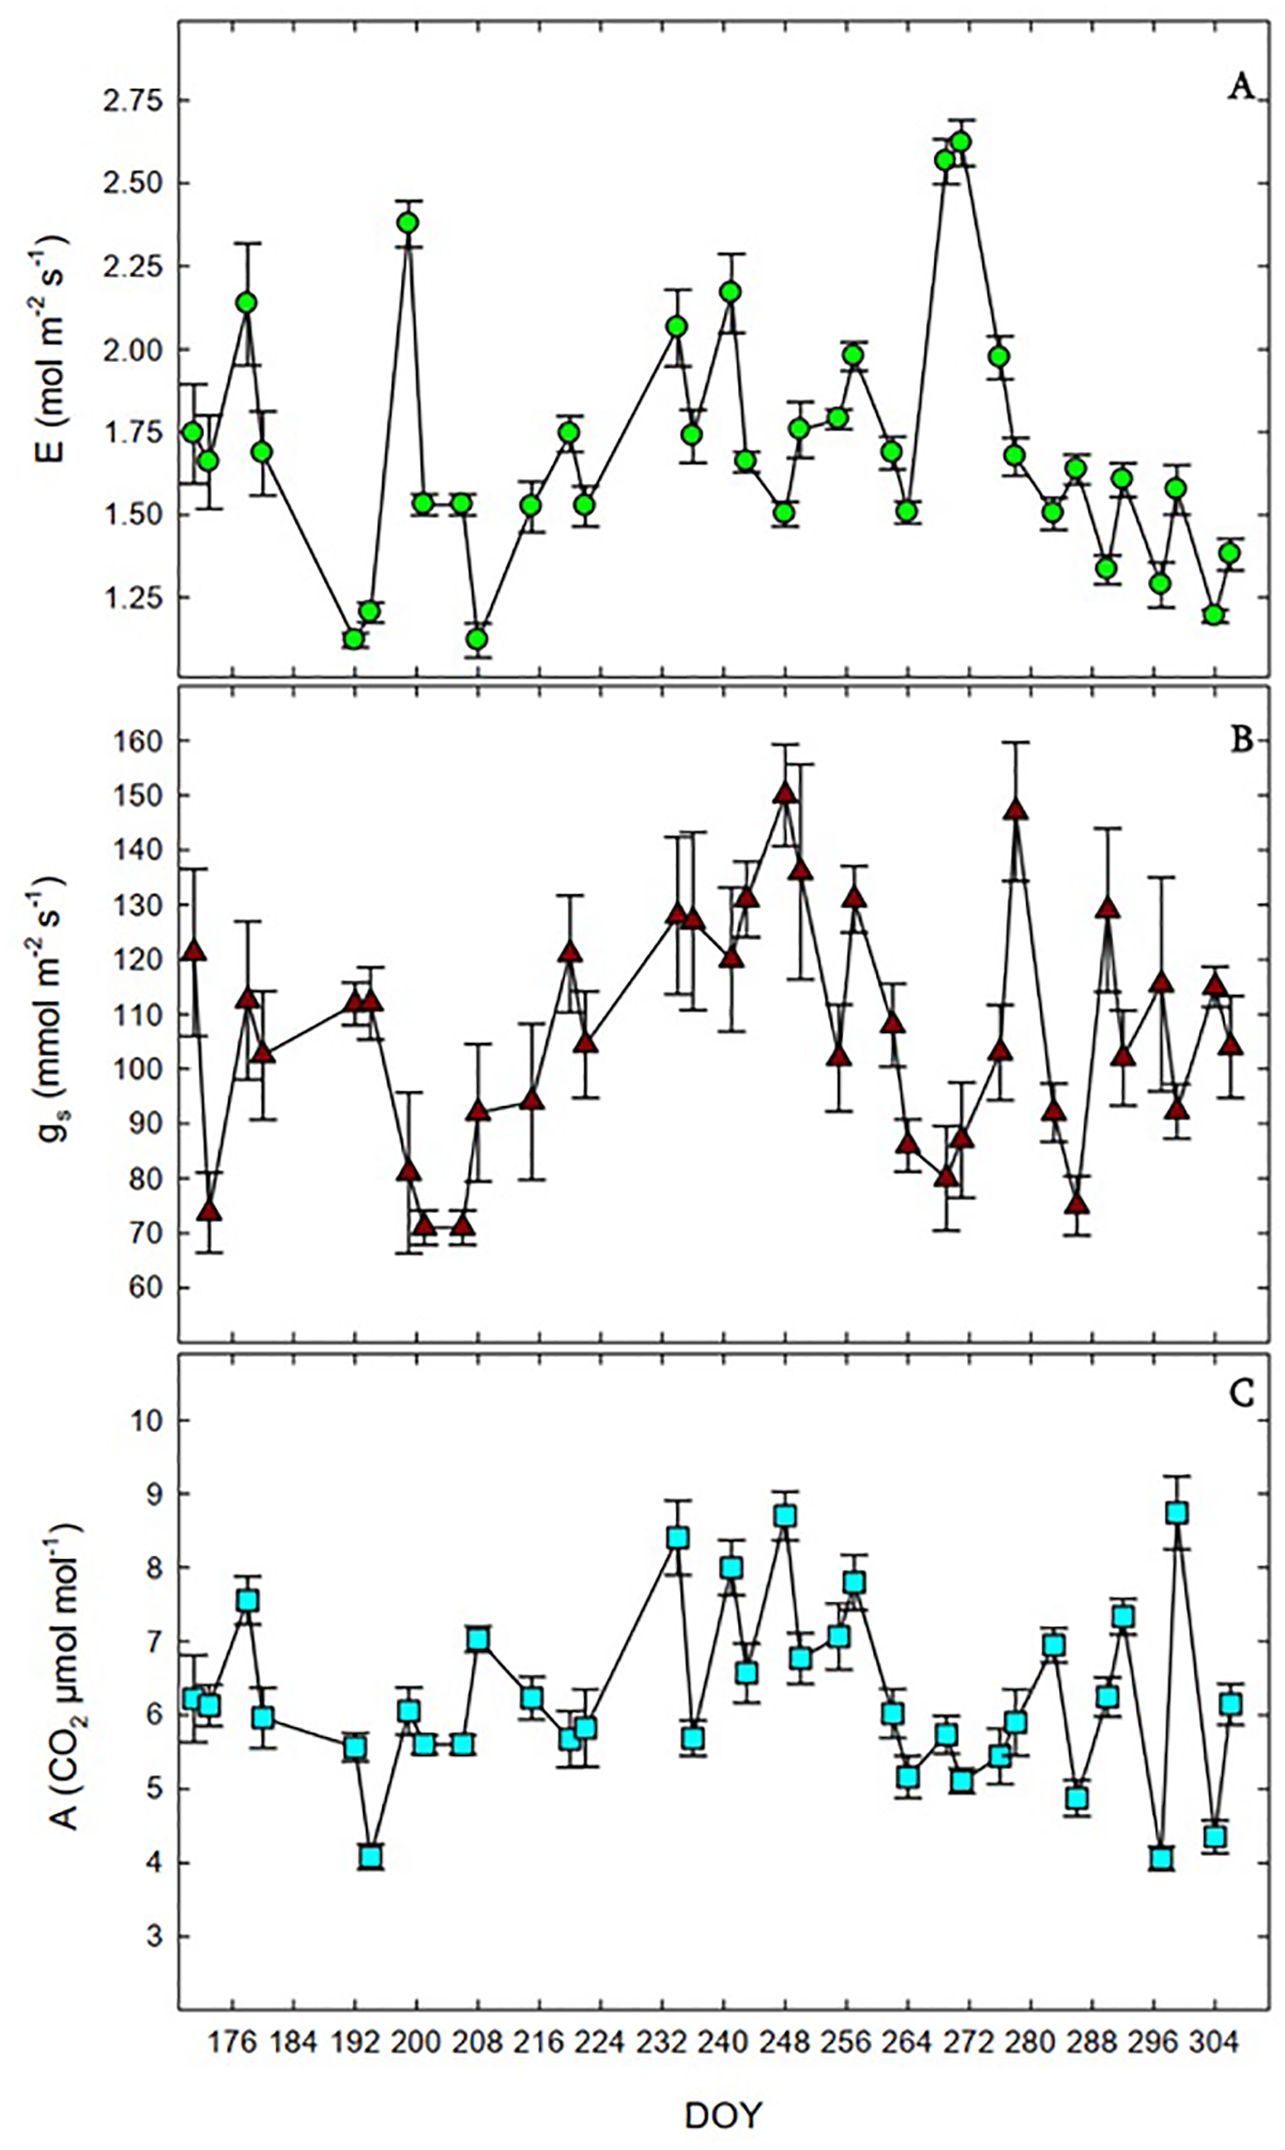
Figure 5. Values of transpiration rate (E). (A), stomatal conductance (gs) (B) and photosynthetic rate (A, C) of adult cocoa trees during the experimental period. The vertical bar indicates the error of the mean. Each point represents the mean of ten values.
The lowest E values of 1.12 mmol m-² s-¹ occurred on days 192 (July 11) and 208 (July 27), with an average of 1.68 mmol m-² s-¹ throughout the period, which was lower than reported by Agudelo-Castañeda et al. (2018), who described values between 1.91 and 2.15 mmol m-2 s-1 when evaluating the physiological yield of nine cocoa clones under shade in Rionegro, Colombia.
Stomatal conductance (gs), shown in Figure 5B, reached its highest values on days 248 (September 5) and 278 (October 5) at 150 and 147 mmol m-2 s-1 respectively. The lowest gs values of 71 mmol CO2 m-2 s-1 occurred on days 201 (July 20) and 206 (July 25).
The average gs during the evaluation period was 106.55 mmol m-2 s-1, comparable to findings by Tezara et al. (2016), who evaluated Forastero and Criollo cocoa trees over 50 years of age on Margarita Island, Venezuela, finding values of 157 and 182 mmol m-2 s-1 respectively.
CO2 assimilation (A) peaked on days 299 (October 26) and 248 (September 5), at 8.74 and 8.70 μmol m-2 s-1 respectively (see Figure 5C), aligning with previous rainfall events. The lowest A values of 4.08 and 4.06 μmol m-2 s-1 were observed on days 194 (July 13) and 297 (October 24).
The average photosynthetic rate was 6.24 μmol m-2 s-1, similar to those obtained by Janani et al. (2019). In this study, using different cocoa genotypes under greenhouse conditions, the response to changes in soil moisture by substantially reducing the photosynthetic rate was demonstrated. Values of 6.48 and 4.09 μmol m-2 s-1 were reported with two levels of moisture 100 and 50% field capacity respectively.
Figure 6 displays MCDT values, which peaked early in the evaluation period and declined from day 290 (October 18) onward in response to minor rainfall events (see Figure 3A). This rapid response of MCDT to moisture variations aligns with previous studies, highlighting its utility as a cost-effective indicator of plant water status (Ortuño et al., 2006a; García-Orellana et al., 2007; Ortuño et al., 2009; Galindo et al., 2013; Sadka et al., 2023; Wheeler et al., 2023).
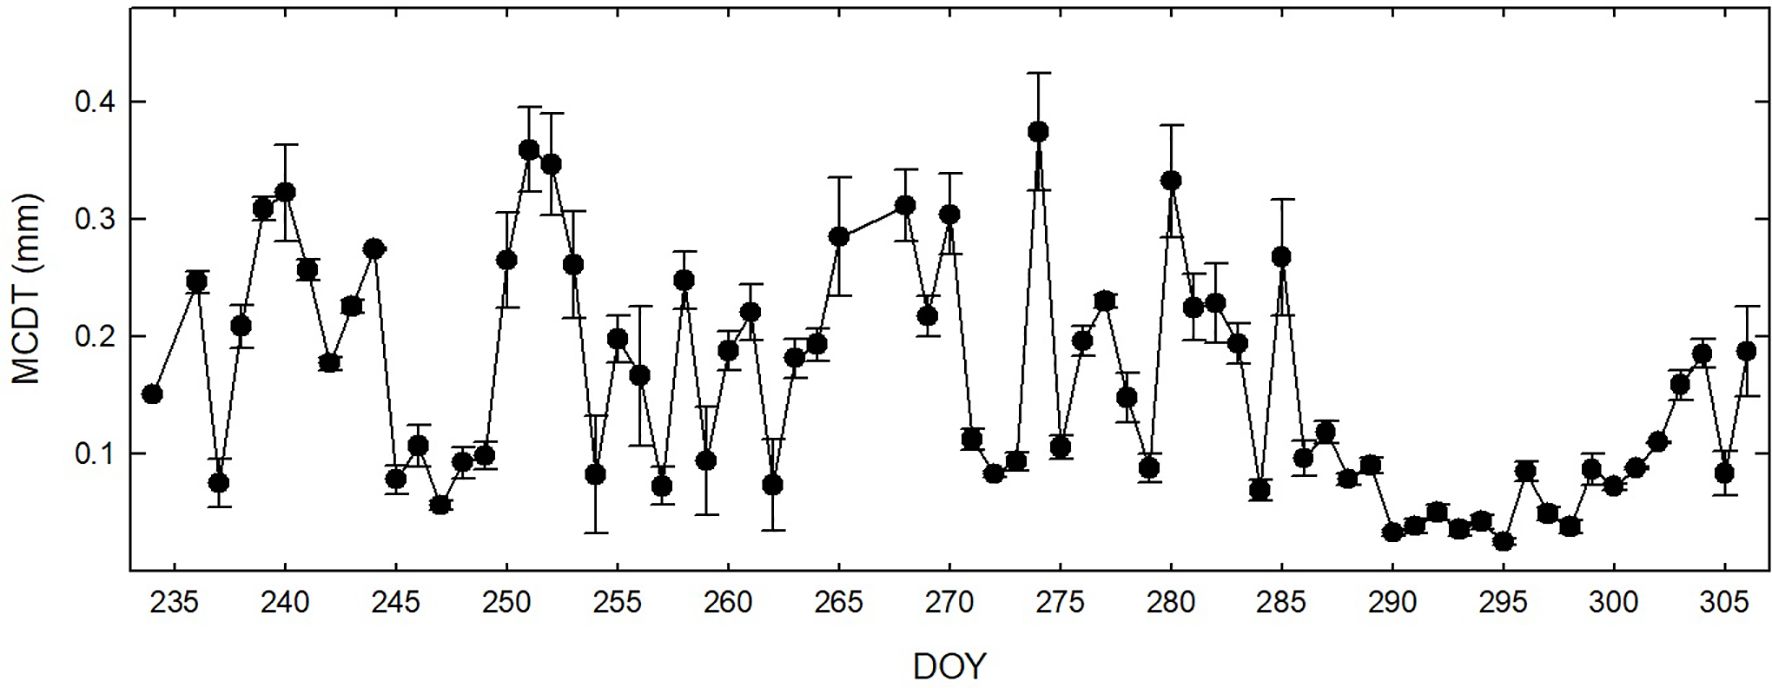
Figure 6. Values of maximum daily stem fluctuations (MCDT) of adult cocoa trees during the experimental period. The vertical bar indicates the error of the mean. Each point represents the mean of ten values.
In Figure 7, Ψleaf and Ψstem demonstrated correlations with ETo, maximum temperature, and vapor pressure deficit (VPD) during the evaluation period. Both Ψleaf and Ψstem decreased as these parameters increased. For cocoa trees, Ψleaf exhibited a stronger correlation with vapor pressure deficit (DPV), while Ψstem correlated more closely with ETo.
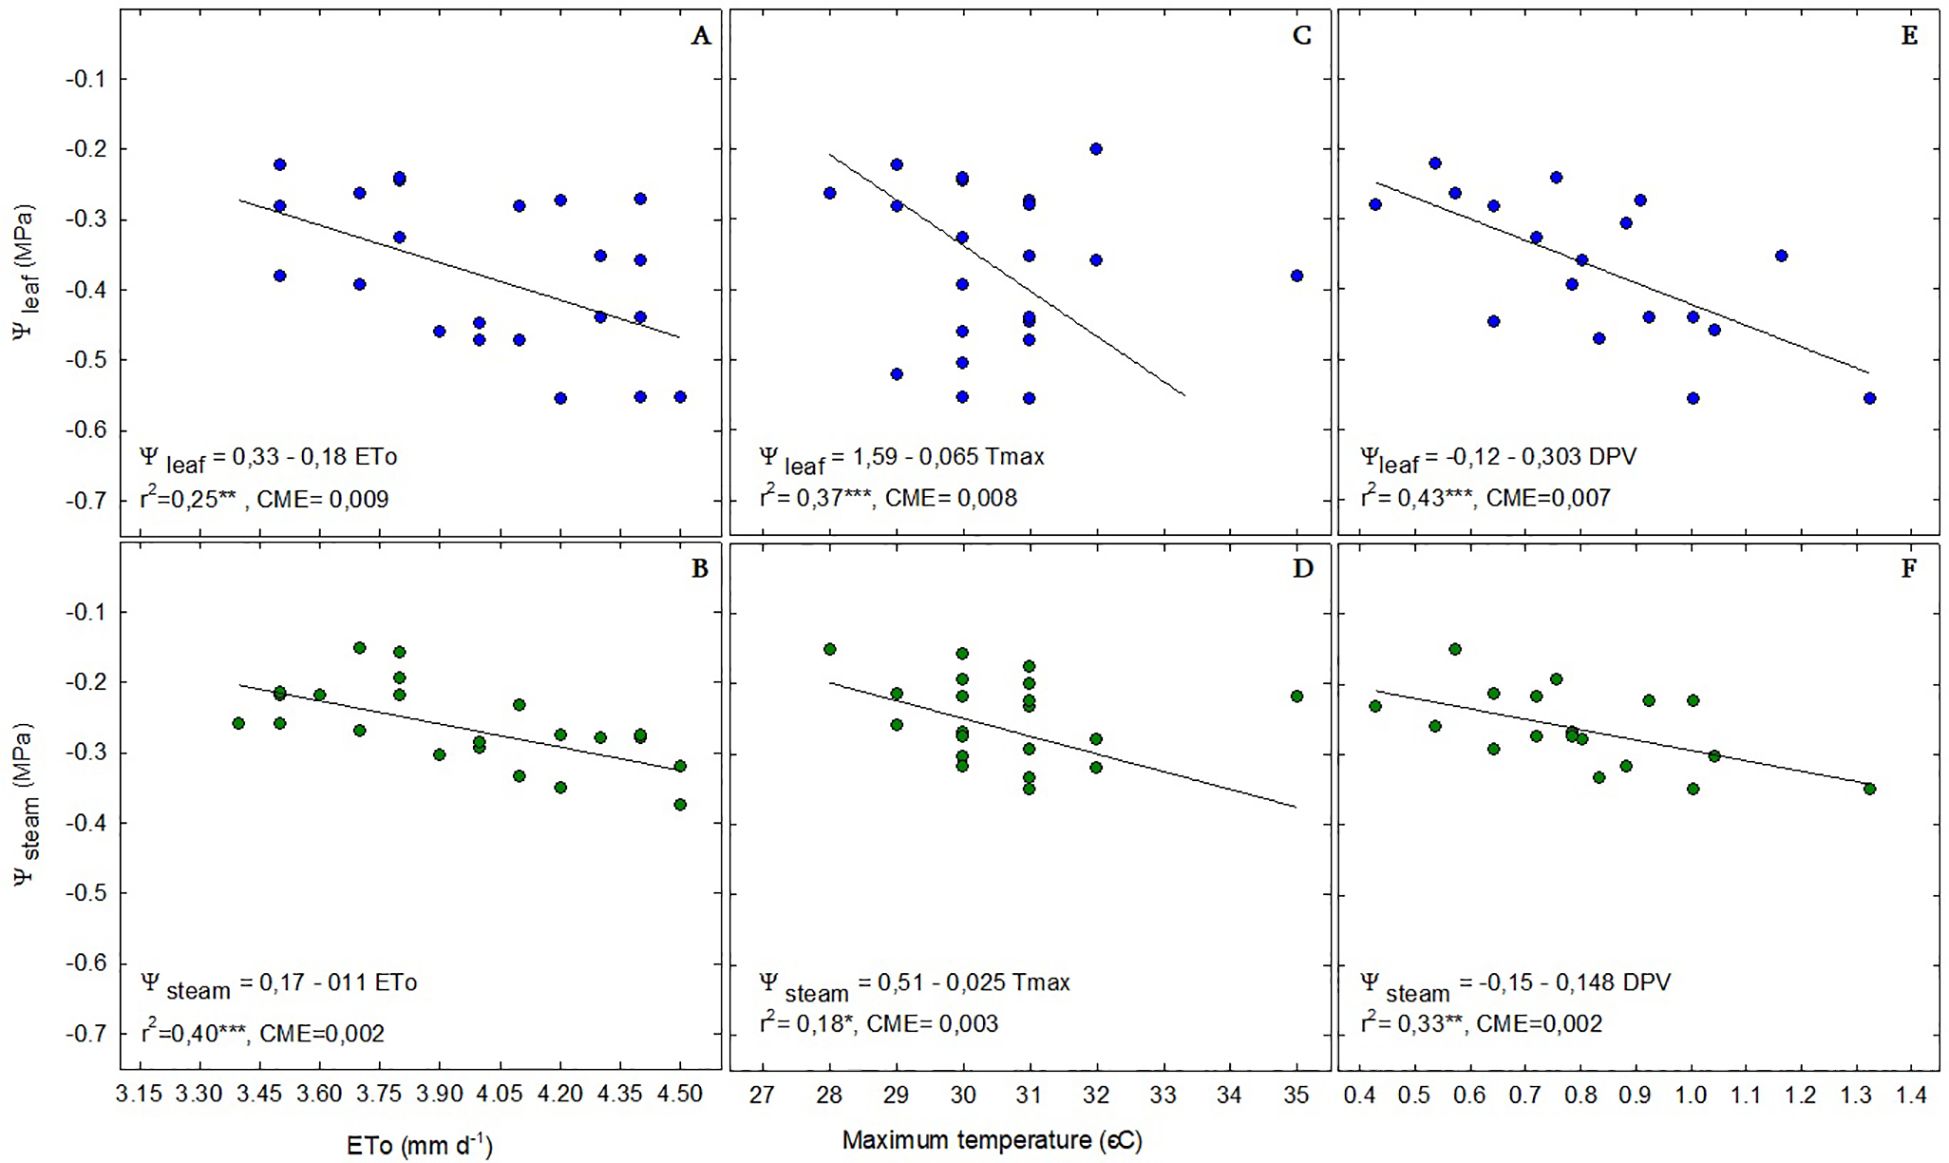
Figure 7. Relationship between reference crop evapotranspiration (ETo) (A, B), maximum temperature (C, D), and vapor pressure deficit (DPV) (E, F) with leaf water potential (Ψleaf) and stem water potential (Ψstem) in adult cocoa trees during the experimental period. Each point represents the mean of ten values. *Statistically significant at P < 0.05. **Very significant P < 0.01, ***Highly significant P < 0.1.
According to Medina and Laliberte (2017), severe stress in cocoa trees is indicated by Ψleaf values reaching -1.76 MPa, which were not observed during this period (Figure 3A). This suggests that soil type and atypical precipitation patterns may have mitigated water stress conditions.
Osorio Zambrano et al. (2021) reported Ψleaf values of -0.18 MPa under non-water limiting conditions and -2.48 MPa under stress, indicating that trees in this study did not experience significant water stress (Figure 3B), possibly influencing the observed weak correlations.
In Figure 8, Ψleaf exhibited the strongest correlation with MCDT, followed by the Ψstem. In contrast, photosynthetic rate (A) and stomatal conductance did not demonstrate strong correlations during the evaluation period. As gs and CO2 flux increased, the rate of water loss through transpiration rose, potentially exceeding the rate at which water could be extracted from the soil.
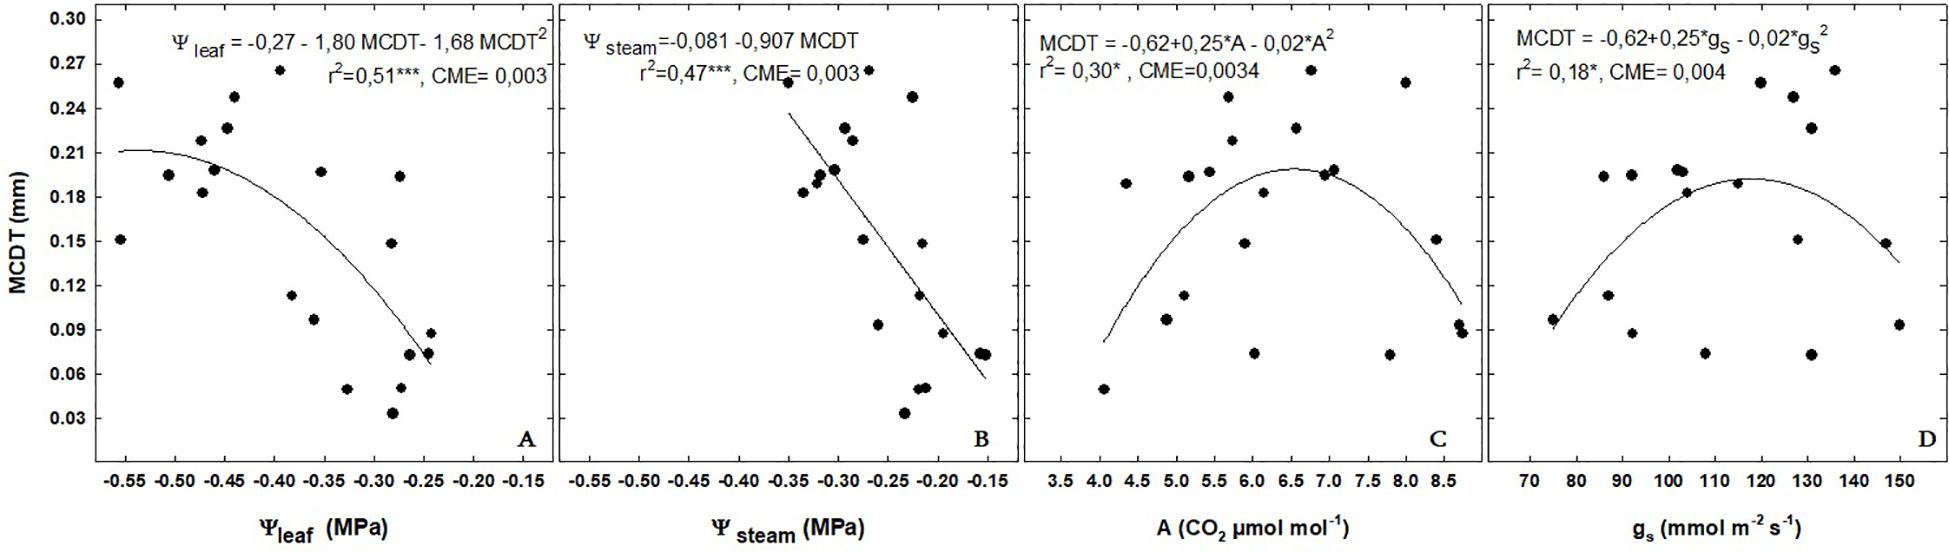
Figure 8. Relationship between daily rates of maximum daily stem shrinkage (MCDT) with leaf (Ψleaf) (A) and stem (Ψstem) water potential (B), photosynthetic rate (A, C), and stomatal conductance (gs) (D) in adult cocoa trees during the experimental period. Each point represents the mean of ten values.*Statistically significant at P < 0.05. **Very significant P < 0.01, ***Highly significant P < 0.001.
However, when soil moisture was sufficient and no limitations were encountered, stomata remained open, allowing for high stomatal activity without an increase in stem diameter. This dynamic was influenced by soil moisture availability and root water uptake capacity.
On the other hand, the relationship with stem contraction was more direct; as water potential became more positive, indicating lower water extraction rates, conducting vessels were less likely to collapse. This facilitated easier water supply to leaves, influencing the curve’s variability based on soil water conditions and root water uptake capacity. It is important to consider that water potential integrates plant vascular system water demand and supply rates (McDowell et al., 2022).
4 Conclusions
In conclusion, there is a significant relationship between stem potential and MCDT in adult cocoa plants, highlighting MCDT as a robust indicator of the plant water status. This relationship underscores the utility of MCDT in assessing water status in cocoa cultivation. Furthermore, MCDT exhibits stronger correlations with climatic parameters such as DPV and ETo than with maximum temperature, suggesting its potential use for accurately estimating ETo in adult cocoa trees and become a reliable indicator to be used for scheduling, with the intention of automating irrigation, avoiding water deficits that affect the productivity of the cocoa crop. The results obtained are promising, especially because the test was conducted in the field and in a tropical zone, with the use of dendrometers developed, designed and built by members of the work team, making the technology more affordable, increasing the feasibility of its application.
Data availability statement
The raw data supporting the conclusions of this article will be made available by the authors, without undue reservation.
Author contributions
FF: Conceptualization, Investigation, Project administration, Software, Writing – original draft. YG-O: Conceptualization, Data curation, Formal Analysis, Methodology, Visualization, Writing – original draft. MC: Conceptualization, Investigation, Methodology, Project administration, Supervision, Writing – review & editing, Validation. LV: Data curation, Funding acquisition, Resources, Writing – review & editing. BL: Data curation, Funding acquisition, Resources, Supervision, Writing – review & editing. AC: Data curation, Resources, Software, Writing – review & editing. BR: Data curation, Project administration, Writing – review & editing. WD: Data curation, Project administration, Writing – review & editing.
Funding
The author(s) declare that financial support was received for the research and/or publication of this article. This work received funding from FIASA as the main funding contributor, while INIAP and UTE University were contributors to a lesser extent.
Acknowledgments
The authors acknowledge the contributions of Washington Lomas and Jorge Chimarro from the Physics Department of Central University of Ecuador, of the Company Ecuriolindo S.A and its hacienda Clemencia (Eng. Silvia Baño Párraga, General Manager) and Marcelo Mosquera from UTE University.
Conflict of interest
The authors declare that the research was conducted in the absence of any commercial or financial relationships that could be construed as a potential conflict of interest.
Publisher’s note
All claims expressed in this article are solely those of the authors and do not necessarily represent those of their affiliated organizations, or those of the publisher, the editors and the reviewers. Any product that may be evaluated in this article, or claim that may be made by its manufacturer, is not guaranteed or endorsed by the publisher.
Supplementary material
The Supplementary Material for this article can be found online at: https://www.frontiersin.org/articles/10.3389/fagro.2025.1465311/full#supplementary-material
References
Agudelo-Castañeda G. A., Cadena-Torres J., Almanza-Merchán P. J., and Pinzón-Sandoval E. H. (2018). Desempeño fisiológico de nueve genotipos de cacao (Theobroma cacao L.) bajo la sombra de tres especies forestales en Santander, Colombia. Rev. Colombiana Cienc. Hortícolas 12, 223–232. doi: 10.17584/rcch.2018v12i1.7341
Alban A., Elain S., Hebbar K., Mathias T., and Séverin A. (2015). Morpho-physiological criteria for assessment of two month old cocoa (Theobroma cacao L.) genotypes for drought tolerance. Indian J. Plant Physiol. 21, 23–30. doi: 10.1007/s40502-015-0195-y
Barbagallo M. G., Vesco G., Di Lorenzo R., Lo Bianco R., and Pisciotta A. (2021). Soil and regulated deficit irrigation affect growth, yield and quality of ‘Nero d’Avola’grapes in a semi-arid environment. Plants 10, 641. doi: 10.3390/plants10040641
Borja N., Cho J., and Choi K. S. (2017). The influence of climate change on irrigation water requirements for corn in the coastal region of Ecuador. Paddy Water Environ. 15, 71–78. doi: 10.1007/s10333-016-0529-z
Cavazza F., Galioto F., Raggi M., and Viaggi D. (2018). The role of ICT in improving sequential decisions for water management in agriculture. Water 10, 1141. doi: 10.3390/w10091141
Centeno A., Baeza P., and Lissarrague J. R. (2010). Relationship between soil and plant water status in wine grapes under various water deficit regimes. HortTechnology 20, 585–593. doi: 10.21273/HORTTECH.20.3.585
Chai Y., Chen C., Luo X., Zhan S., Kim J., Luo J., et al. (2021). Cohabiting plant-wearable sensor in situ monitors water transport in plant. Advanced Sci. 8, 2003642. doi: 10.1002/advs.202003642
Chimarro J. and Freire F. (2023). Device for determining variations in stem thickness of trees. ESPOCH Congresses: Ecuadorian J. STEAM, 510–520. doi: 10.18502/espoch.v3i1.14470
Conejero W., Alarcón J. J., García-Orellana Y., Abrisqueta J. M., and Torrecillas A. (2007). Daily sap flow and maximum daily trunk shrinkage measurements for diagnosing water stress in early maturing peach trees during the post-harvest period. Tree Physiol. 27, 81–88. doi: 10.1093/treephys/27.1.81
Conejero W., Ortuño M. F., Mellisho C. D., and Torrecillas A. (2010). Influence of crop load on maximum daily trunk shrinkage reference equations for irrigation scheduling of early maturing peach trees. Agric. Water Manage. 97, 333–338. doi: 10.1016/j.agwat.2009.10.003
Galindo A., Rodríguez P., Mellisho C. D., Torrecillas E., Moriana A., Cruz Z. N., et al. (2013). Assessment of discretely measured indicators and maximum daily trunk shrinkage for detecting water stress in pomegranate trees. Agric. For. Meteorology 180, 58–65. doi: 10.1016/j.agrformet.2013.05.006
García-Orellana Y., Ruiz-Sánchez M. C., Alarcón J. J., Conejero W., Ortuño M. F., Nicolás E., et al. (2007). Preliminary assessment of the feasibility of using maximum daily trunk shrinkage for irrigation scheduling in lemon trees. Agric. Water Manage. 89, 167–171. doi: 10.1016/j.agwat.2006.12.008
Girón I. F., Corell M., Martín-Palomo M. J., Galindo A., Torrecillas A., Moreno F., et al. (2016). Limitations and usefulness of maximum daily shrinkage (MDS) and trunk growth rate (TGR) indicators in the irrigation scheduling of tabl e olive trees. Agric. Water Manage. 164, 38–45. doi: 10.1016/j.agwat.2015.09.014
Goldhamer D. A., Fereres E., Mata M., Girona J., and Cohen M. (1999). Sensitivity of continuous and discrete plant and soil water status monitoring in peach trees subjected to deficit irrigation. J. Am. Soc. Hortic. Sci. 124, 437–444. doi: 10.21273/JASHS.124.4.437
Hess T. (1999). Evapotranspiration estimates for water balance scheduling in the UK. Irrigation News 25, 31–36. Available online at: http://dspace.lib.cranfield.ac.uk/handle/1826/1675 (Accessed March 15, 2024).
Idawati I., Sasongko N. A., Santoso A. D., Septiani M., Handayani T., Sakti A. Y. N., et al. (2024). Cocoa farmers’ characteristics on climate variability and its effects on climate change adaptation strategy. Global J. Environ. Sci. Manage. 10, 337–354. doi: 10.22034/gjesm.2024.01.21
International Cocoa Germplasm Database (2006). The university of reading, reading. Available online at: http://www.icgd.rdg.ac.uk (Accessed December 01, 2024).
Janani P., Kumar N., and Jegadeeswari V. (2019). Dynamics of gas exchange and chlorophyll fluorescence parameters of cocoa genotypes in response to water deficit. J. Pharmacognosy Phytochem. 8, 415–419. Available at: https://www.phytojournal.com/archives/2019/vol8issue6/PartG/8-5-456-413.pdf.
Jiménez-Pérez A., Cach-Pérez M. J., Valdez-Hernández M., and Rosa-Manzano E. D. L. (2019). Efecto del manejo del dosel en el estado hídrico del cacao (Theobroma cacao) y el microclima dentro del área de cultivo. Botanical Sci. 97, 701–710. Available at: http://www.ciens.ula.ve/icae/publicaciones/ecofisiologia/pdf/rada2005.pdf (Accessed December 05, 2024).
McDowell N. G., Sapes G., Pivovaroff A., Adams H. D., Allen C. D., Anderegg W. R., et al. (2022). Mechanisms of woody-plant mortality under rising drought, CO2 and vapour pressure deficit. Nat. Rev. Earth Environ. 3, 294–308. doi: 10.1038/s43017-022-00272-1
Medina V. and Laliberte B. (2017). A Review Of Research On The Effects Of Drought And Temperature Stress And Increased CO2 On Theobroma Cacao L., And The Role Of Genetic Diversity To Address Climate change. Costa Rica Bioversity Int. Available at: https://cgspace.cgiar.org/handle/10568/89084 (Accessed January 15, 2024).
Mirás-Avalos J. M., Pérez-Sarmiento F., Alcobendas R., Alarcón J. J., Mounzer O., and Nicolás E. (2016). Reference values of maximum daily trunk shrinkage for irrigation scheduling in mid-late maturing peach trees. Agric. Water Manage. 171, 31–39. doi: 10.1016/j.agwat.2016.03.017
Mirás-Avalos J. M., Pérez-Sarmiento F., Alcobendas R., Alarcón J. J., Mounzer O., and Nicolás E. (2017). Maximum daily trunk shrinkage for estimating water needs and scheduling regulated deficit irrigation in peach trees. Irrigation Sci. 35, 69–82. doi: 10.1007/s00271-016-0523-7
Moreno-Miranda C., Molina I., Miranda Z., Moreno R., and Moreno P. (2020). La cadena de valor de cacao en Ecuador: Una propuesta de estrategias para coadyuvar a la sostenibilidad. Bioagro 32, 205–214. Available online at: https://sga.unemi.edu.ec/media/evidenciasiv/2021/08/10/articulo_2021810105931.pdf. (Accessed December 01, 2024).
Moriana A., Moreno F., Girón I. F., Conejero W., Ortuño M. F., Morales D., et al. (2011). Seasonal changes of maximum daily shrinkage reference equations for irrigation scheduling in olive trees: influence of fruit load. Agric. Water Manage. 99, 121–127. doi: 10.1016/j.agwat.2011.07.008
Nair K. P. (2021). “Cocoa (Theobroma cacao L.),” in Tree crops. Harvesting cash from the world’s important cash crops, 153–213. doi: 10.1007/978-3-030-62140-7_5
Neira D. P. (2016). Energy sustainability of Ecuadorian cacao export and its contribution to climate change. A case study through product life cycle assessment. J. Cleaner Production 112, 2560–2568. doi: 10.16/j.jclepro.2015.11.003
Ortiz-Bobea A., Ault T. R., Carrillo C. M., Chambers R. G., and Lobell D. B. (2021). Anthropogenic climate change has slowed global agricultural productivity growth. Nat. Climate Change 11, 306–312. doi: 10.1038/s41558-021-01000-1
Ortuño M. F., Brito J. J., García-Orellana Y., Conejero W., and Torrecillas A. (2009). Maximum daily trunk shrinkage and stem water potential reference equations for irrigation scheduling of lemon trees. Irrigation Sci. 27, 121–127. doi: 10.1007/s00271-008-0126-z
Ortuño M. F., García-Orellana Y., Conejero W., Ruiz-Sánchez M. C., Alarcón J. J., and Torrecillas A. (2006a). Stem and leaf water potentials, gas exchange, sap flow, and trunk diameter fluctuations for detecting water stress in lemon trees. Trees 20, 1–8. doi: 10.1007/s00468-005-0004-8
Ortuño M. F., García-Orellana Y., Conejero W., Ruiz-Sánchez M. C., Mounzer O., Alarcón J. J., et al. (2006b). Relationships between climatic variables and sap flow, stem water potential and maximum daily trunk shrinkage in lemon trees. Plant Soil 279, 229–242. doi: 10.1007/s11104-005-1302-z
Osorio Zambrano M. A., Castillo D. A., Rodriguez Perez L., and Terán W. (2021). Cacao (Theobroma cacao L.) response to water stress: Physiological characterization and antioxidant gene expression profiling in commercial clones. Front. Plant Sci. 12. doi: 10.3389/fpls.2021.700855
Paltineanu C., Chitu E., Sumedrea D., and Florea A. (2020). Correlation between maximum trunk daily shrinkage, soil matric potential and weather variables for mature plum trees in medium-textured soils and temperate climate. Erwerbs-Obstbau 62, 201–211. doi: 10.1007/s10341-020-00472-3
Puerto P., Domingo R., Torres R., Pérez-Pastor A., and García-Riquelme M. (2013). Remote management of deficit irrigation in almond trees based on maximum daily trunk shrinkage. Water relations and yield. Agric. Water Manage. 126, 33–45. doi: 10.1016/j.agwat.2013.04.013
Sadka A., Razzon S., and Paz-Kagan T. (2023). The effect of varied irrigation regimes on citrus tree water status, as monitored by remote and proximal sensing, on yield and yield loss due to fruit cracking. 654123. doi: 10.2139/ssrn.4654123
Tezara W., Urich R., Jaimez R., Coronel I., Araque O., Azocar C., et al. (2016). Does Criollo cocoa have the same exophysiological characteristics as Forastero? Botanical Sci. 94, 563–574. doi: 10.17129/botsci.552
Tosto A., Morales A., Rahn E., Evers J. B., Zuidema P. A., and Anten N. P. (2023). Simulating cocoa production: A review of modelling approaches and gaps. Agric. Syst. 206, 103614. doi: 10.1016/j.agsy.2023.103614
Velasco-Muñoz J. F., Aznar-Sánchez J. A., Batlles-delaFuente A., and Fidelibus M. D. (2019). Sustainable irrigation in agriculture: An analysis of global research. Water 11, 1758. doi: 10.3390/w11091758
Wheeler W. D., Black B., and Bugbee B. (2023). Assessing water stress in a high-density apple orchard using trunk circumference variation, sap flow index and stem water potential. Front. Plant Sci. 14. doi: 10.3389%2Ffpls.2023.1214429
Zhang Q., Chen Y., Xiong Y., Moritani S., Wu X., Yan C., et al. (2021). Which is more sensitive to water stress for irrigation scheduling during the maturation stage: grapevine photosynthesis or berry size? Atmosphere 12, 845. doi: 10.3390/atmos12070845
Keywords: maximum daily trunk fluctuations, reference crop evapotranspiration, irrigation, soil moisture, water potential
Citation: Freire F, Carrillo M, Lahuathe B, Vera L, Chipantiza A, Durango W, Rivadeneira B and Garcia-Orellana Y (2025) Relationship between trunk diameter fluctuations and physiological variables in adult cocoa trees. Front. Agron. 7:1465311. doi: 10.3389/fagro.2025.1465311
Received: 16 July 2024; Accepted: 24 April 2025;
Published: 03 June 2025.
Edited by:
Simone Erotildes Teleginski Ferraz, Federal University of Santa Maria, BrazilReviewed by:
Zachary T Brym, University of Florida, United StatesMaría R. Conesa, Spanish National Research Council (CSIC), Spain
Copyright © 2025 Freire, Carrillo, Lahuathe, Vera, Chipantiza, Durango, Rivadeneira and Garcia-Orellana. This is an open-access article distributed under the terms of the Creative Commons Attribution License (CC BY). The use, distribution or reproduction in other forums is permitted, provided the original author(s) and the copyright owner(s) are credited and that the original publication in this journal is cited, in accordance with accepted academic practice. No use, distribution or reproduction is permitted which does not comply with these terms.
*Correspondence: Fausto Freire, ZmZyZWlyZUB1dGUuZWR1LmVj