 M. Tomás Cassani1
 Jessica L. Gutknecht2*
 Andrea Basche3
 Nathaniel A. Brunsell4
 Timothy E. Crews1
 Steven Culman5
 Leonardo Deiss6
 Carrie A. M. Laboski7
 Valentín Picasso8
 Priscila Pinto8
 Roberta Bianchin Rebesquini3Nicole E. Tautges9†
 Laura K. van der Pol1
 Jacob M. Jungers10
- 1The Land Institute, Salina, KS, United States
- 2Department of Soil, Water, and Climate, University of Minnesota, Saint Paul, MN, United States
- 3Department of Agronomy and Horticulture, University of Nebraska-Lincoln, Lincoln, NE, United States
- 4Department of Geography and Atmospheric Science, University of Kansas, Lawrence, KS, United States
- 5Central Oregon Agriculture Research and Extension Center, Oregon State University, Madras, OR, United States
- 6Department of Soil and Crop Sciences, Colorado State University, Fort Colins, CO, United States
- 7USDA ARS Pasture Systems & Watershed Management Research Unit, University Park, PA, United States
- 8Department of Plant and Agroecosystem Sciences, University of Wisconsin, Madison, WI, United States
- 9Michael Fields Agricultural Institute, East Troy, WI, United States
- 10Department of Agronomy and Plant Genetics, University of Minnesota, Saint Paul, MN, United States
The intensive cultivation practices of annual cereal crops have been causing unprecedented degradation of natural resources. Perennial crops such as intermediate wheatgrass (IWG) could provide numerous benefits to address these issues, but there is still little comprehensive information about the establishment, fertilization needs, or range of IWG productivity on a regional basis in the first production year, which can be the highest over the lifespan of IWG’s grain production. The objective of this study was to evaluate how IWG establishment and first-year grain and forage yields varied across soil types, climate conditions, and in response ten fertilization treatments at six locations in the Midwestern USA. The 10 treatments included N fertilizer application at 5 rates; N application with or without P or K; varied timing of N application, and varied N fertilizer source. We found that fertilization influenced summer and fall forage yields but not grain yields. We also found that grain and forage yields varied greatly between locations, ranging from 556–1343 kg ha-1 for grain yields, 3732–8930 kg ha-1 for summer forage, and 927–3561 kg ha-1 for fall forage yields. Using a multiple linear regression approach, we found that a combination of local edaphic soil and climate factors explained 74%, 92%, and 69% of variance in grain, summer forage, and fall forage yields, respectively. Anomalies in expected and actual yields across locations led us to identify potential critical periods for IWG grain and forage production. We found accumulated precipitation in the 60 days before anthesis explained the most variance in grain and summer forage yields while the accumulated precipitation from May through October explained the most variance in fall forage yields. These findings are a first step toward identifying the regional expectations for IWG yields and could inform grower management and decisions regarding grain and forage harvest.
1 Introduction
Present-day agricultural systems are degrading the global natural resource base necessary for sustained agricultural productivity and ecosystem functionality, at an unprecedented rate and scale (IPBES, 2019). Approximately 600 million hectares globally are cleared of vegetation each year to grow wheat, maize, and rice, which provide more than 50% of human calories (FAO 2022, FAO, 2023). These and other annual crops must be planted each year often after tillage, which causes ecosystem disservices such as soil degradation and greenhouse gas emissions (Pimentel et al., 2012; Lal, 2015). Current annual row crop agriculture can degrade the soil and increase the need for energy-intensive inputs which, in turn, generate environmental and economic costs such as increased farmer dependence on agrochemicals and fuel (Massobrio et al., 2023; Tsoraeva et al., 2020). Another challenge that farmers of annual grains have faced for millennia is the need for timely, favorable weather conditions to germinate and establish a crop. For example, more than $13 billion were distributed to farmers in 2022 to compensate for lost revenues because of excess or lack of moisture which delayed planting of corn and soybean (USDA, 2024). Agricultural strategies to avoid the environmental and economic challenges associated with annual replanting could improve productivity and food security (Glover et al., 2010).
The development of perennial grain crops provides an opportunity to overcome disservices inherent to annual agriculture (Zhang et al., 2023). There is increasing evidence that perennial crops have the potential to improve agricultural sustainability because their deep root systems and perennial life strategy lead to reduced tillage and fossil fuel dependency, herbicide applications, soil erosion, nutrient leaching, and runoff (Culman et al., 2013; Crews et al., 2016; Jungers et al., 2019; Reilly et al., 2022a; Glover et al., 2010; Zimbric et al., 2020). Since perennial crops might only require replanting every few years (or longer), such systems can reduce the economic burdens related to seeding and establishment. After perennials are established, their extensive root systems can increase soil water infiltration, storage, and plant uptake throughout the year (de Oliveira et al., 2020; Clément et al., 2022) thereby enhancing resilience to extreme drought or flood conditions relative to annual crops. Increased climate resiliency by perennials can ensure some harvestable product consistently where annuals may be more prone to crop failure (Smith, 2014; Schipanski et al., 2016).
One of the most advanced perennial grain crops being developed is derived from Intermediate wheatgrass (IWG) [Thinopyrum intermedium (Host) Barkworth and D.R. Dewey]. IWG is a cool-season grass with good winter hardiness, relatively large seeds for a perennial grass, and high biomass and forage quality. Because of these qualities it emerged as a promising candidate for perennial grain breeding and crop development (Wagoner, 1990; Wagoner and Schauer, 1990; Crain et al., 2024; DeHaan et al., 2014). IWG seeds can be harvested as grain for direct human consumption, while vegetative biomass can be used simultaneously as livestock forage, thus providing multiple market opportunities while offering enhanced environmental quality (Crews et al., 2018; Natural Resources Conservation Service (NRCS), 2021; Pinto et al., 2022; Cureton et al., 2023). Over 40 years of breeding has resulted in modern IWG lines with improved yield, seed size, and disease resistance (Wagoner, 1994; Cox et al., 2002; DeHaan et al., 2005, 2014; Zhang et al., 2016; Cattani and Asselin, 2017; DeHaan et al., 2018; Hayes et al., 2018; Bajgain et al., 2022). In 2009, The Land Institute trademarked the grain harvested from improved IWG lines as “Kernza®” (Natural Resources Conservation Service (NRCS), 2009), and in 2019 the first commercial variety “MN-Clearwater” was released in the United States by the University of Minnesota (Bajgain et al., 2020). Since that time, IWG research in the Midwestern United States has been concentrated in Minnesota (Zhang et al., 2016; Jungers et al., 2019; Bajgain et al., 2020), Kansas (Culman et al., 2023; DeHaan et al., 2018; de Oliveira et al., 2018; McKenna et al., 2020; Barribal et al., 2022; Means et al., 2022), Wisconsin (Zimbric et al., 2020; Pinto et al., 2021, 2024), Ohio (Pugliese, 2017; Pugliese et al., 2019), and Michigan (Culman et al., 2013). Results of these and other studies have shown first year IWG grain yields to range from 500 to 1000 kg ha-1, and forage yields from 3800 to 10800 kg ha-1 (Supplementary Table S1). Both geographic location and fertility optimization influence grain and biomass yields (Jungers et al., 2017) but with rapid IWG expansion in the past decade, there is a strong need to better understand both IWG’s fertility needs and the other management and environmental characteristics which influence IWG establishment, growth, and grain and biomass yields.
Research to determine best practices to establish IWG as a grain crop in the Upper Midwest has provided a baseline for this and future research (DeHaan et al., 2025). For example, sowing IWG in the fall has been a common practice because it has the advantage of lowering weed pressure during establishment and allowing seeds to vernalize and produce a grain harvest in the subsequent first full growing season (Locatelli et al., 2022). Within this planting period, researchers have quantified the influence of temperature on seedling success and subsequent yields when sown on various dates (Jungers et al., 2022). Temperature and precipitation in the first spring after planting can also significantly affect survival and first-year yields of IWG as it does for annual grain crops (Carrera et al., 2024). Within the general influence of weather on first year establishment, there is a ‘critical period’ defined for many crops but not yet defined for IWG, when weather conditions during flowering and grain-filling strongly influence yield or seed abortion in the first or subsequent growing seasons (Fischer, 1985; Slafer and Andrade, 1993; Andrade et al., 1999). Other edaphic factors such as soil aggregate structure, organic matter contents and temperature are also important for perennial species growth and productivity (Crews et al., 2018; Culman et al., 2023). Little is known how these variables affect establishment success and first-year yields, but because IWG often has the highest grain yields in the first production year (Zhen et al., 2024), understanding and predicting first year establishment and yields is of importance for improving producer success.
How IWG yields are influenced by the interaction between endogenous nutrient supplies of different soil types and fertilizer amendments is another important area of investigation. N addition rates of 90 kg N ha-1 in Minnesota have been found to sustain harvests near yield potential (Tautges et al., 2023), but a wide range of rates (e.g. 67–112 kg N ha-1) have been found to be sufficient in other regions (Vogel et al., 1993; Fagnant et al., 2024). Grain yields have tended to decrease with higher N rates because of increased lodging (Jungers et al., 2017; Tautges et al., 2023) or tiller density resulting in a decrease in reproductive tillers (Fagnant et al., 2024). Fertilizer effects on IWG yield (grain or forage) vary strongly by location and stand age (Pugliese et al., 2019; Pinto et al., 2022; Reilly et al., 2022b; Bowden, 2023), and although less studied, growers are interested in organic sources of fertilizer for N or other nutrients. Although IWG often does not respond to N fertilizer in the first production year, (i.e. Reilly et al., 2022b; Crews et al., 2022), these studies are based on relatively few N rates or locations, and the optimal fertilization timing is also still unclear (Fernandez et al., 2020; Dobbratz et al., 2023; Tautges et al., 2023). Preliminary studies have also shown that macronutrients can limit productivity and that P and K concentrations in forage and grain affect their quality (Muhandiram, 2023; Tautges et al., 2018) but very few studies have explored the P and K limitation or requirements of IWG. Together, there is a need to better understand how the establishment of Kernza varies across locations, and systematically how first year IWG grain and biomass yields respond to a range of fertilization strategies versus local climate conditions across a wider geographic range than has been previously explored.
In this analysis we addressed these research needs with the following objectives: 1) to determine the effect of N fertilizer application rate and timing along with the omission of P or K on first year IWG grain and biomass yields; and 2) to examine how a gradient of soil and climate conditions across multiple study locations in the Midwest influence IWG establishment, productivity and initial responses to fertilization treatments. These objectives were addressed using a multi-institutional, multi-site fertility experiment that was funded by the United States Department of Agriculture Sustainable Agricultural Systems Coordinated Agricultural Projects USDA SAS-CAP). Specifically, we focus on N fertilizer rates, timing of N application, interactions between N, P and K fertilizer applications. We expected that 1) IWG grain and biomass yields would increase in response to increasing N fertilization rates up to 135 kg ha-1, and then grain yield gains would diminish at higher N rates due to lodging or excess tillering; and 2) yield variation response to fertilization strategy within a site would be small relative to the variation across study locations due to climate and soil being primary drivers of plant establishment and growth. There has seldom been investigation about the interacting effects of soil, climate, and fertility management on IWG performance. This information is essential to develop management best practices across a range of suitable growing environments for IWG for grain, forage, and dual use.
2 Materials and methods
2.1 Location and characterization of the study area
The experiment was conducted in six locations: Salina, Kansas (KS-TLI; The Land Institute); Mead, Nebraska (NE; University of Nebraska-Lincoln); Rosemount, Minnesota (MN-ROS; University of Minnesota-Twin Cities); Arlington, Wisconsin (WI-UW; University of Wisconsin-Madison); Troy Center, Wisconsin (WI-MFAI; Michael Fields Agricultural Institute), and Wooster, Ohio (OH; The Ohio State University) (Figure 1; Table 1). The soil orders presented across these locations are Mollisols and Alfisols (Soil Survey Staff, 2023; Table 1). The climates are classified as follows (Kottek et al., 2007): NE and OH have hot and humid continental summers (Dfa); MN-ROS, WI-UW, and WI-MFAI have mild and humid continental summers (Dfb); KS-TLI is between a hot humid subtropical summer (Cfa) and a hot humid continental summer (Dfa).
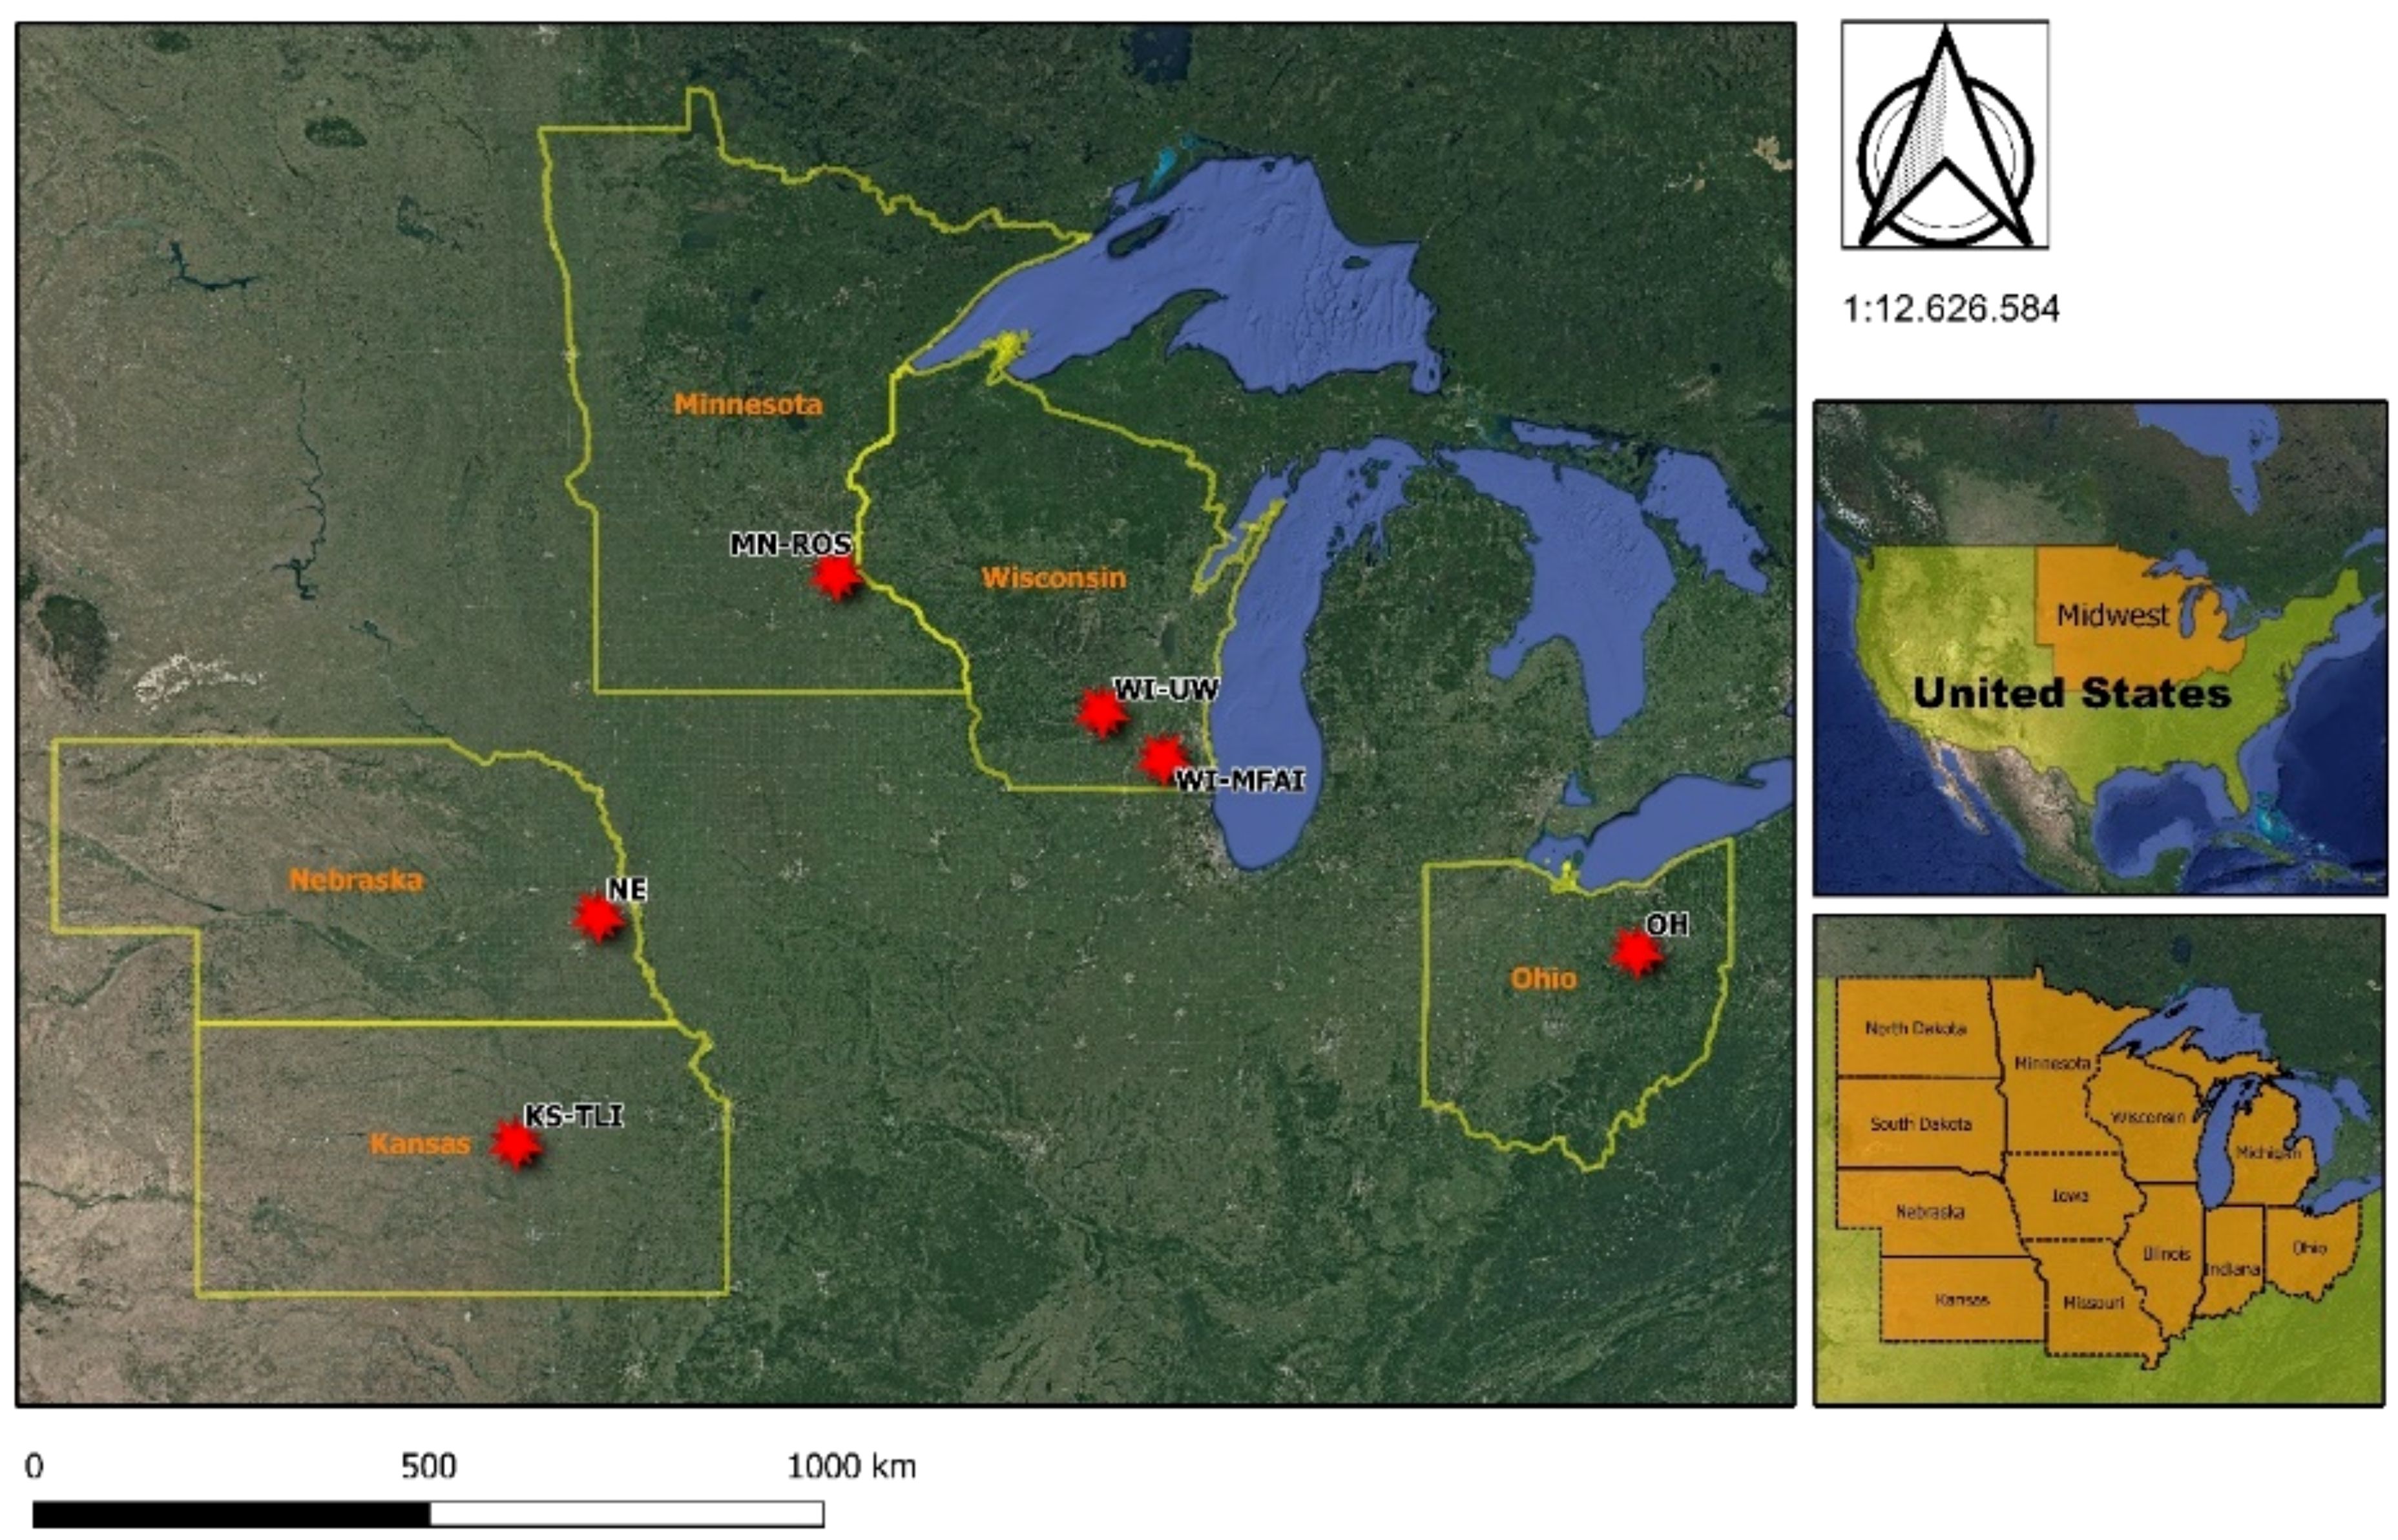
Figure 1. Visualization of the six study locations in the Midwestern United States, using a Modified satellite image of the Midwestern United States, based on imagery from Google Earth (Google, 2025).
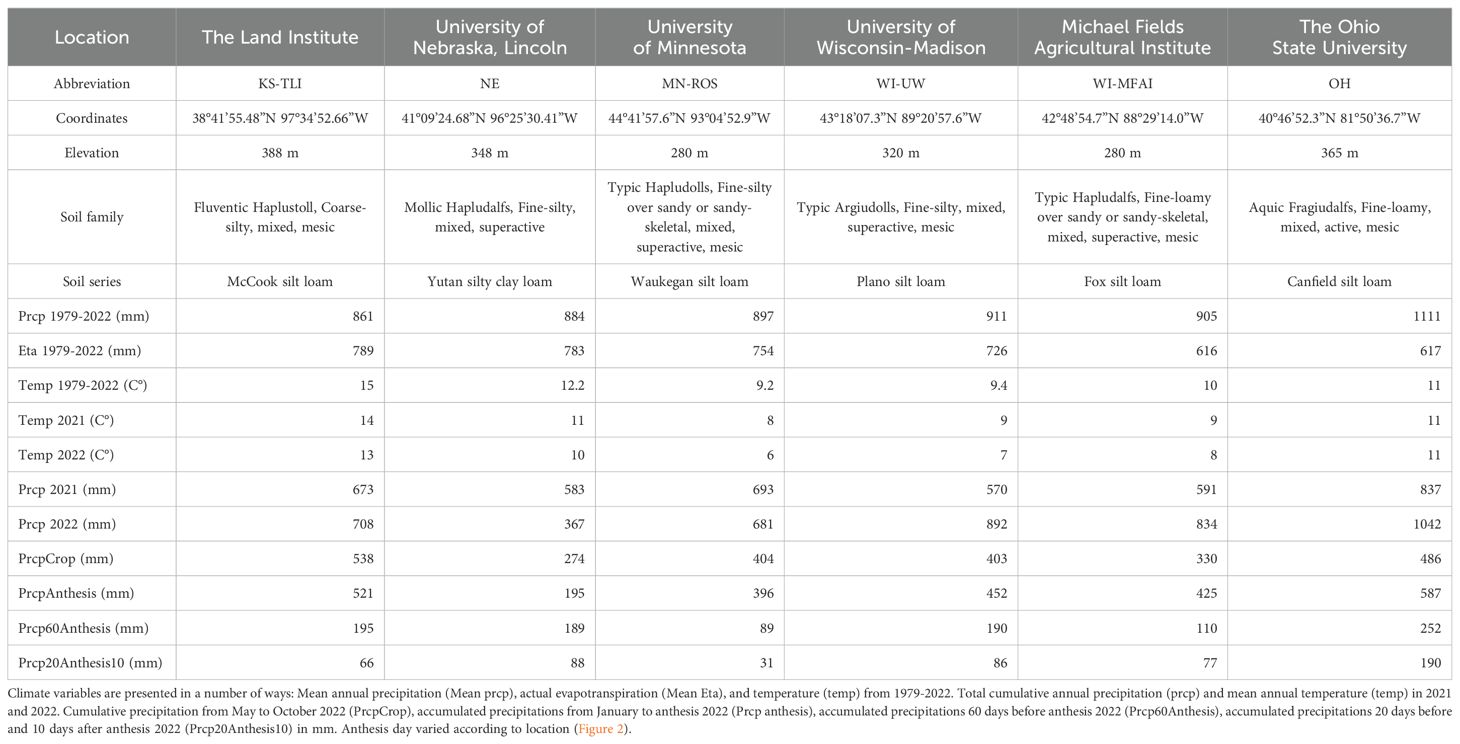
Table 1. Experimental site locations and characteristics including geographical coordinates, meters above sea level, and soil taxonomy (Soil Survey Staff, 2023).
2.2 Experimental design
All locations were planted to oats (Avena sativa) in spring 2021 and harvested in July of that year before establishing experimental treatments. Previous management at each location had been a continuous annual crop rotation typical of the region of each location (a corn-soybean rotation WI-UW, WI-MFAI, OH, MN-ROS, and NE, and a soybean-sorghum rotation at KS-TLI). We established the same random block design with twelve treatments (Table 2) replicated once per each of four blocks. We provide a detailed description of the site characteristics and agronomic management in Supplementary Tables S1 and S2. Plots were approximately 15.24 m x 6 m at each location. We collected baseline soil samples in a subset of the treatments referred to as the ‘soil health treatments’ with a hydraulic soil probe (5.08 cm diameter and 0-20, 20-50, and 50–90 cm deep) in the summer of 2021 following oat harvest as described below. There were 12 treatments total, including 10 IWG planted treatments with various fertilization strategies described below, and two “business as usual” (BAU) treatments that tested annual crops chosen to reflect typical crops of the given region. These BAU treatments were a soybean-corn rotation with both phases (labeled BAU1 and BAU2) included at most locations and a sorghum-soybean rotation at KS-TLI only (Table 2, Supplementary Table S2). Data from BAU treatments is not included in the analysis presented in this paper, but will be compared with IWG responses in the coming years. Prior to planting IWG, we applied fertilizer appropriate to each treatment (Table 2) and prepared the seedbed by tillage (Supplementary Table S2). Fertilizer rates were optimized so that at least one treatment could both meet the nutritional needs of IWG and to create a useful comparison between the IWG and BAU crops, as well as balance the amount of fertilizer all crops received over two-year periods (Jungers et al., 2017, Table 2). N application rates in this study were selected to encompass the range of applications currently recommended as well as higher rates to assess potential N-limitation at current recommended rates with the newest released variety, MN Clearwater (Jungers et al., 2017; Bajgain et al., 2020). N rate treatments included 0, 45, 90, 135 and 180 kg N ha-1 applied as urea in the spring. All N addition treatments also included 56 kg P ha-1 and 168 kg K ha-1, and two additional fertility treatments tested the 90 kg N ha-1 rate either without the added P or without the added K. P and K fertilizer rates were selected to approximate crop removal rates through harvest based on unpublished Kernza grain and forage data, as well as published corn and soybean removal data (e.g., Culman et al., 2020; Table 2). The K rate likely exceeded the BAU removal rates, but is within range of what would be considered typical farmer practice in Midwest corn and soybean cropping systems.
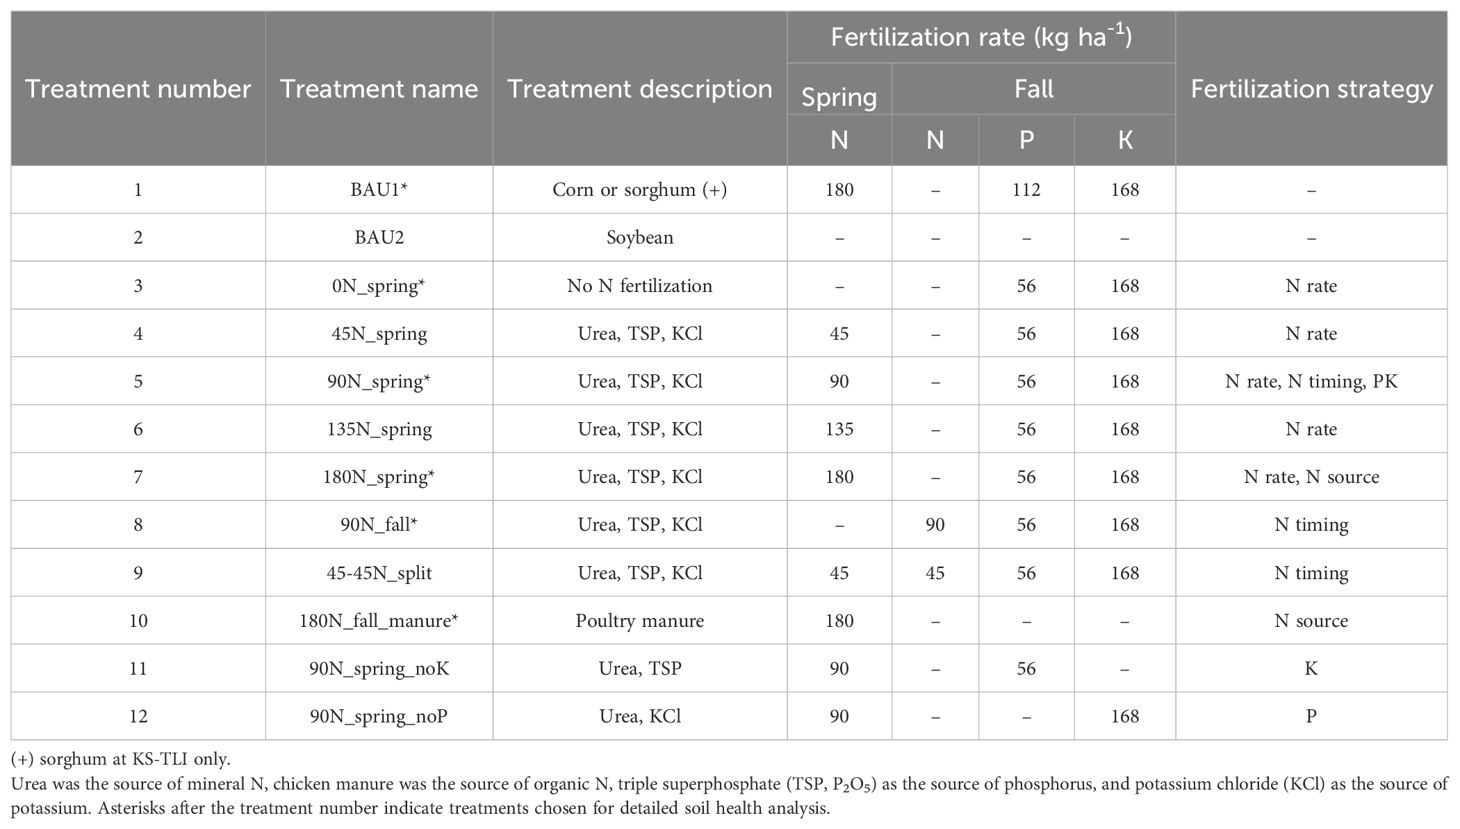
Table 2. Description of study treatments in the study including the number, name, description, fertilizer rate (kg ha-1, - = no fertilizer), timing (spring or fall) and strategy [N fertilization timing, N fertilization rate, N fertilizer source, phosphorus (P) and potassium (K) fertilization].
In addition to examining N rates, we examined IWG responses to N source and N timing. The N source treatment assigned 180 kg N ha-1 added as chicken manure, with the same product used across all experimental sites. N timing treatments were implemented by applying N (at 90 kg N ha-1) in the fall or as a spring-fall split (45 kg N ha-1 at each application). Tillage and seedbed preparation occurred as described in Supplementary Table S2 throughout the late summer of 2021 in all plots. In September 2021 the IWG variety ‘MN-Clearwater’ was planted at a density of approximately 7.8 (MN-ROS, TLI), 12 (NE, WI-UW), or 16 (MFAI, OH) pure live seeds ha-1, with either 30 (MN-ROS, KS-TLI) or 38 (OH, NE, WI-MFAI, WI-UW) cm between rows, depending on available equipment. We fertilized relevant IWG treatments in April-May 2022 as described in Table 2. Urea fertilizer was mixed with a urease inhibitor (ANVOL®) before application, at a rate of 1.5 quarts per ton of urea, per product recommendations (Koch Agronomic Services, LLC). Grain and summer forage harvest took place in August 2022. Fall fertilizer for relevant IWG treatments took place in September 2022. Fall forage harvest for IWG took place after the first frost In October 2022.
2.3 Soil sampling and analysis
Baseline soil samples were collected from a subset of treatments including 1, 3, 5, 7, 8, and 10 (Table 2). This subset is hereafter referred to as the ‘soil health plots’. Multiple soil cores were randomly extracted from each plot to control for field heterogeneity and divided into the following depth increments: 0-20, 20-50, and 50–90 cm. Samples within each plot were combined by depth into one composite sample per plot (~450g), sieved to 8 mm, and stored appropriately for each subsequent analysis. All soil analysis followed standardized methods (Supplementary Table S3). Briefly, samples were refrigerated at 4˚ C until sieved to 2 mm and weighed and subsampled for gravimetric soil moisture (~10–20 g subsample dried to 105˚ C for 48 hrs). Bulk density was estimated by dividing the dry weight equivalent of each composite sample core by the volume of the core. Soil texture analysis was conducted on subsamples air dried (~100 g) using the hydrometer method (Carter and Gregorich, 2008). Subsamples were analyzed for soil organic matter (SOM), pH, cation exchange capacity, ammonium-N, nitrate-N, available P, exchangeable K, at A&L Great Lakes Laboratory (Ft. Wayne, IN) using standard procedures (Brown, 1998). Total soil carbon and total N were analyzed by combustion analysis using (varioPYRO cube, Elementer Inc., New Jersey, US). For aggregate stability analysis, we collected three bulk soil samples with a 2.54 cm wide (0–20 cm deep) soil probe which were then combined into one composite ~100g sample per plot. Soil was then sieved to 8 mm and placed in a 4 mm sieve at the top of a stack containing 4 mm, 2 mm, 0.250 mm, and 0.053 mm sieves. The aggregates were first wetted with capillary action by setting the sieves just at water level, followed by oscillation for 10 min in a water tank using a mechanical sieving device ((Angers et al., 2008); with a modification that no sand correction was performed). After drying and weighing the soil remaining in each sieve, we calculated the mean weight diameter (MWD) of water stable aggregates (Rakkar et al., 2023). Soil subsamples were analyzed for nitrate and ammonium using extractions with 1M KCl and subsequent colorimetric analysis (Doane and Horwath, 2003; Sinsabaugh et al., 2000).
2.4 Measurement of crop establishment, growth staging, and grain, summer forage, and fall forage yields
To assess establishment, we conducted plant counts within three weeks after IWG planting by counting seedlings within a 50 cm section in two rows of each plot. We assessed IWG growth stages using Zadoks growth at stem elongation, anthesis, and harvest (Zadoks et al., 1974). Lodging was assessed following procedures described by Frahm et al. (2018) at harvest and was not a concern in 2022. We measured aboveground production (grain and summer forage yield) by harvesting 1 m sections from three adjacent rows in two representative areas of each plot (see quadrats size for each location in ST2). IWG grain yield was measured by first clipping the seedheads from stems just below the bottom spikelet. Seedheads from both sampled areas were placed into the same bag and then all remaining vegetative biomass above 7.6 cm from both sampled areas was harvested, combined, and placed in a separate bag. The remaining vegetative biomass is referred to as summer forage. In all field sample collection and measurements, the outermost plot rows and 50 cm border of the plot edges were excluded from sampling to avoid edge effects. Both seedhead and summer forage biomass were weighed fresh before being dried for 7 days at 35°C and re-weighed again for determining moisture content and dry matter yield. Grain was threshed from seed heads using a laboratory thresher (Wintersteiger LD 350, Ried im Innkreis, Austria) followed by sieving and aspirating to fully separate the grain from the chaff. All plots were mechanically combine-harvested after the manual harvest such that both grain and remaining straw were cut and removed with only approximately 7.6 cm of residue remaining on the plots. Fall forage samples were collected from treatments 3, 5, and 7 and processed using the same methods described above for the summer forage harvest. Yields of all crops were expressed in kg ha-1 by multiplying harvested kg per m-1 by row spacing (m-1), then multiplying by 10000 (m2 ha-1).
2.5 Climate data analysis
We compiled a suite of climate variables from 1979–2022 for each site so that we could characterize the 2022 data of this study within the context of historical trends. Actual evapotranspiration (Eta), precipitation (Prcp), net solar radiation, and temperature were derived by the European Centre for Medium-Range Weather Forecasts (ECMWF) and Reanalysis v5 (ERA5) (Hersbach et al., 2020; Supplementary Tables S4, S5, Supplementary Tables metadata). ECMWF consists of a dynamically consistent combination of numerical weather prediction forecasts, satellite, and in-situ observations of climatic variables. Data for 2021-2022, as the more recent trends for each location, were downloaded from National Centers for Environmental Information (National Oceanic and Atmospheric Administration (NOAA), 2023), the CFAES Weather System (Ohio State University, 2013), and Davis weather station at TLI (Supplementary Tables S6, S7).
To assess the correlation of climate factors with IWG grain and biomass yields, we selected a number of variables that would balance comprehensiveness and minimization of covariance. The selected variables included precipitation (Pp; mm, the sum of rainfall, snow and hail), actual evapotranspiration (Eta; mm), temperature (˚C, annual, monthly and daily averages), frequency occurrence Prcp (25%, 50% and 75%; Irigoin, 2011) and evaporative fraction (Ef). Ef is defined as the ratio of latent heat flux to the available energy, i.e. how much of the radiation received can be used for Eta. Ef is controlled by water in the root zone (Bastiaanssen et al., 1997).
In addition, the cumulative actual evapotranspiration from May to October was calculated as an estimate of evapotranspiration over the crop growing season (EtaCrop). We also calculated cumulative Prcp over several different time intervals associated with various critical physiological periods to determine if any were correlated with yield. The cumulative growing season precipitation (PrcpCrop) was calculated as the sum Prcp from May to October 2022 (de Oliveira et al., 2018). Cumulative precipitation was also calculated for the 60 days before anthesis (Prcp60Anthesis, Figure 2), for the 20 days before + 10 days after anthesis (Prcp20Anthesis10; the critical period of the wheat based on Fischer, 1985), for the entire calendar year before anthesis (PrcpAnthesis) (beginning January 1st and ending on the date of observed anthesis at each location), and for the entire calendar year (PrcpAnnual). The mean temperature of crop establishment through harvest (TempCrop) was calculated as well (September 2021 to August 2022 for grain and summer forage; September 2021 to October 2022 for fall forage).
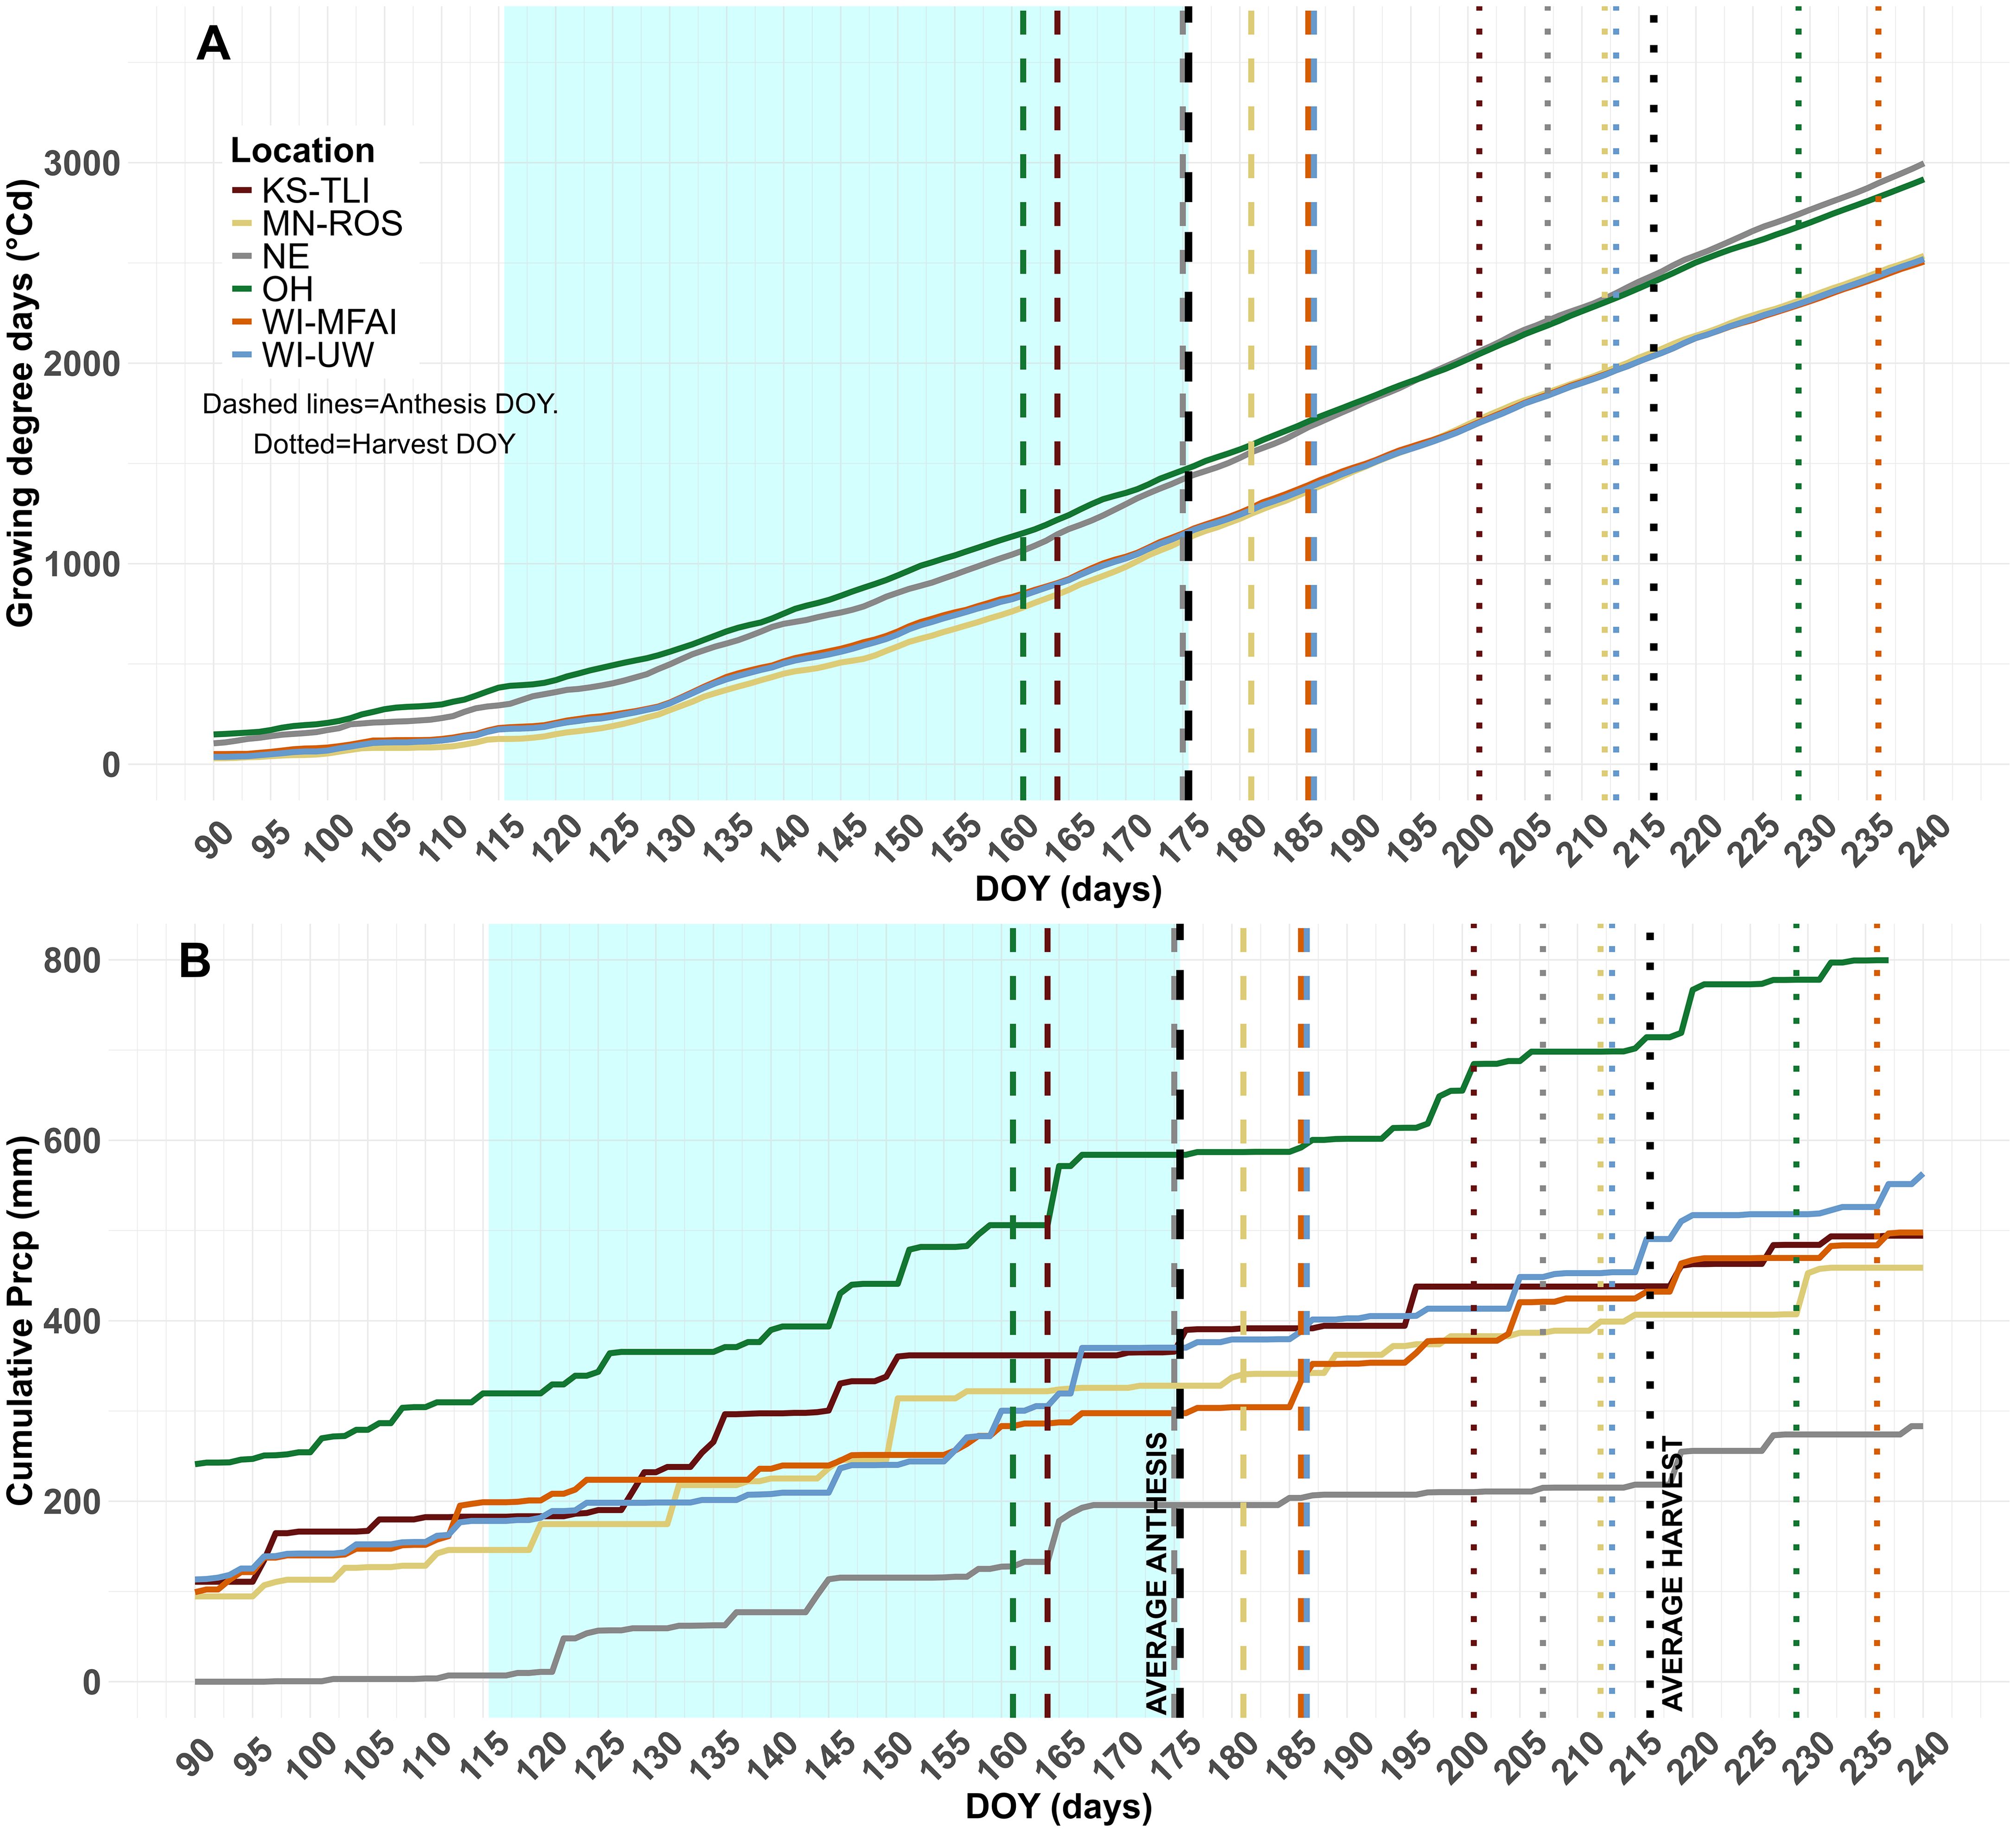
Figure 2. 2022 cumulative growing degree days (GDD) (°Cd) (A) and cumulative precipitation (mm) (B) for each location. The x-axis shows day of the year (DOY) from day 90 to day 240. Dashed lines show the day of anthesis; dotted lines show the harvest day (DOY) where colors indicate different locations and black is the average day across sites. The light blue shadow shows 60 days before the average anthesis date.
Additionally, growing degree days (GDD) were calculated according to Jungers et al. (2018) and Barribal et al. (2022) (Equation 1), where Tmax and Tmin are the maximum and minimum temperatures and Tbase (0 ˚C) is the minimum temperature threshold for IWG plant growth (Jungers et al., 2018; Barribal et al., 2022). Growing degree day accumulation began after the average daily temperature exceeded the base temperature for 5 consecutive days (Jungers et al., 2018) after January 1st 2022 (Barriball et al., 2022).
2.6 Statistics
To assess how fertility treatment, climate and soil factors could be related to differences in IWG establishment and growth across locations, we used several data analysis approaches. We analyzed data using R Software (version 2023.06.1; R Core Team, 2021) and tools in the dplyr package to structure data frames appropriately (Wickham et al., 2021). For all analyses, we first assessed whether measured soil and IWG variables conformed to model assumptions of homogeneity of variance and normality, and applied a square root transformation as needed. We tested for the fixed effect of location on IWG plant counts and baseline soil parameters with blocks specified as random variables, since there were no fertility treatments implemented for these response variables. Linear mixed effects models were used to test the effects of the fertility treatments and locations for IWG grain and forage yield. We used both one-way ANOVA and mixed effects models using the following R packages: stats (R Core Team, 2021), scales (Wickham and Seidel, 2020), and lme4 (Bates et al., 2015). For mixed effects models, we specified fixed effects for treatment, location, and the interaction of treatment and location and assigned block as a random effect. When fixed effects were deemed significant (α ≤ 0.05), mean comparisons of levels within each fixed effect were conducted using Tukey’s HSD posthoc pairwise comparison with the emmeans package (Lenth, 2024).
To compare the potential productivity between locations, we estimated the crop productivity index (CPI) for each location using the National Commodity Crop Productivity Index (NCCPI) model developed by the NRCS-USDA. The CPI ranks soils according to their inherent capacity to produce dryland commodity crops. Ratings are based on soil properties and climate, and range from 0 to 100, with higher ratings indicating greater yield potential (Natural Resources Conservation Service (NRCS), 2022; Supplementary Figure S1).
2.7 Multiple linear regression modeling
Separate multiple linear regression models were developed to estimate the predictive value of soil baseline (0–90 cm depth average) and climate (2021–2022 series) data on grain, summer forage, or fall forage yields. Before constructing and fitting the models, Pearson correlation analysis (R Core Team, 2021) was performed on all possible predictors, and variables with a correlation of 0.6 or greater were considered significantly correlated and thus excluded from consideration (Supplementary Table S8). Predictors were also centered by subtracting the mean. Based on this preliminary analysis, we used the following predictors in each model: SOM, CEC, P, K, Mg, Na, S, the MWD of water stable soil aggregates; sand; Prcp60Anthesis; PrcpAnthesis, and EtaCrop. For the fall forage model, we used PrcpCrop as the climate predictor instead of Prcp60Anthesis or PrcpAnthesis. We then used the dredge function of MuMln package (Barton, 2013) for each of the three full models to explore all possible combinations of predictors and selected the model with the lowest AIC score. After a first run of the models, outliers were identified by calculating the standardized residuals for the models, identifying and deleting observations where the absolute value of the standardized residual was greater than 1.5. The variance inflation factor (VIF) analysis was performed to identify multicolinearity between predictors (Fox and Weisberg, 2019). Predictors with VIF values greater than 5 were deleted for fitting the models. Lastly, we performed an ANOVA, and tested the assumptions for linearity, independence, homoscedasticity, normality and non-collinearity to each estimated model using the lmtest package (R Core Team, 2021).
Once the full models were finalized, we created bivariate linear regression models for each remaining predictor to better understand how each factor alone predicted variability in IWG grain yields, summer forage yields, and fall forage yields.
3 Results
3.1 Climate
Over the past 40 years (1979-2022), the month with the lowest average temperature (Feb) and highest average temperature (Aug) were consistent across locations; while the lowest mean temperatures (-0.16 C) occurred at MN-ROS and the highest (25.3 ˚C) at KS-TLI (Table 1).
The 1979–2022 the minimum precipitation (Prcp) occurred in January or February at all locations. Maximum Prcp occurred in spring for KS-TLI, NE, and OH, and spring-summer for WI-MFAI, WI-UW and MN-ROS (Figure 3). The maximum actual evapotranspiration (Eta) occurred during late spring and summer in all locations. Precipitation varied seasonally for all locations, as was the case for Eta at KS-TLI, NE and MN-ROS (Supplementary Figures S2, S3). The evaporative fraction (Ef) was highest during late spring and summer months, and NE, MN and WI-UW had the highest values, while WI-MFAI and OH had the lowest (Supplementary Figure S4).
Temperature trends during our study period of 2021–2022 were similar to the long-term averages from 1979-2022, with the minimum occurring in February and maximum in August. MN-ROS was an exception with maximum temperatures in June (Figure 3). The years 2021 and 2022 had notably less precipitation than 1979–2022 means at all locations (by 188 and 153 mm in KS-TLI; 301 and 517 mm in NE, 186 and 198 mm in MN-ROS; 341 and 19 mm in WI-UW; 314 and 71 mm in WI-MFAI; 274 and 69 mm in OH, lower annual and accumulated Prcp, respectively; Figures 2, 3). Annual Prcp at NE was exceptionally low relative to its long-term average and was the lowest of all locations (367 mm). May and June 2022 were the only months at KS-TLI and NE that were not drier than average during our study. In this two-month window, Prcp in KS-TLI was higher (by 142 (May) and 79 (June) mm) than the 1979–2022 averages. Higher than average (by 73 mm) Prcp also occurred in MN-ROS in August 2022 (Figure 3; Table 1, Supplementary Table S7).
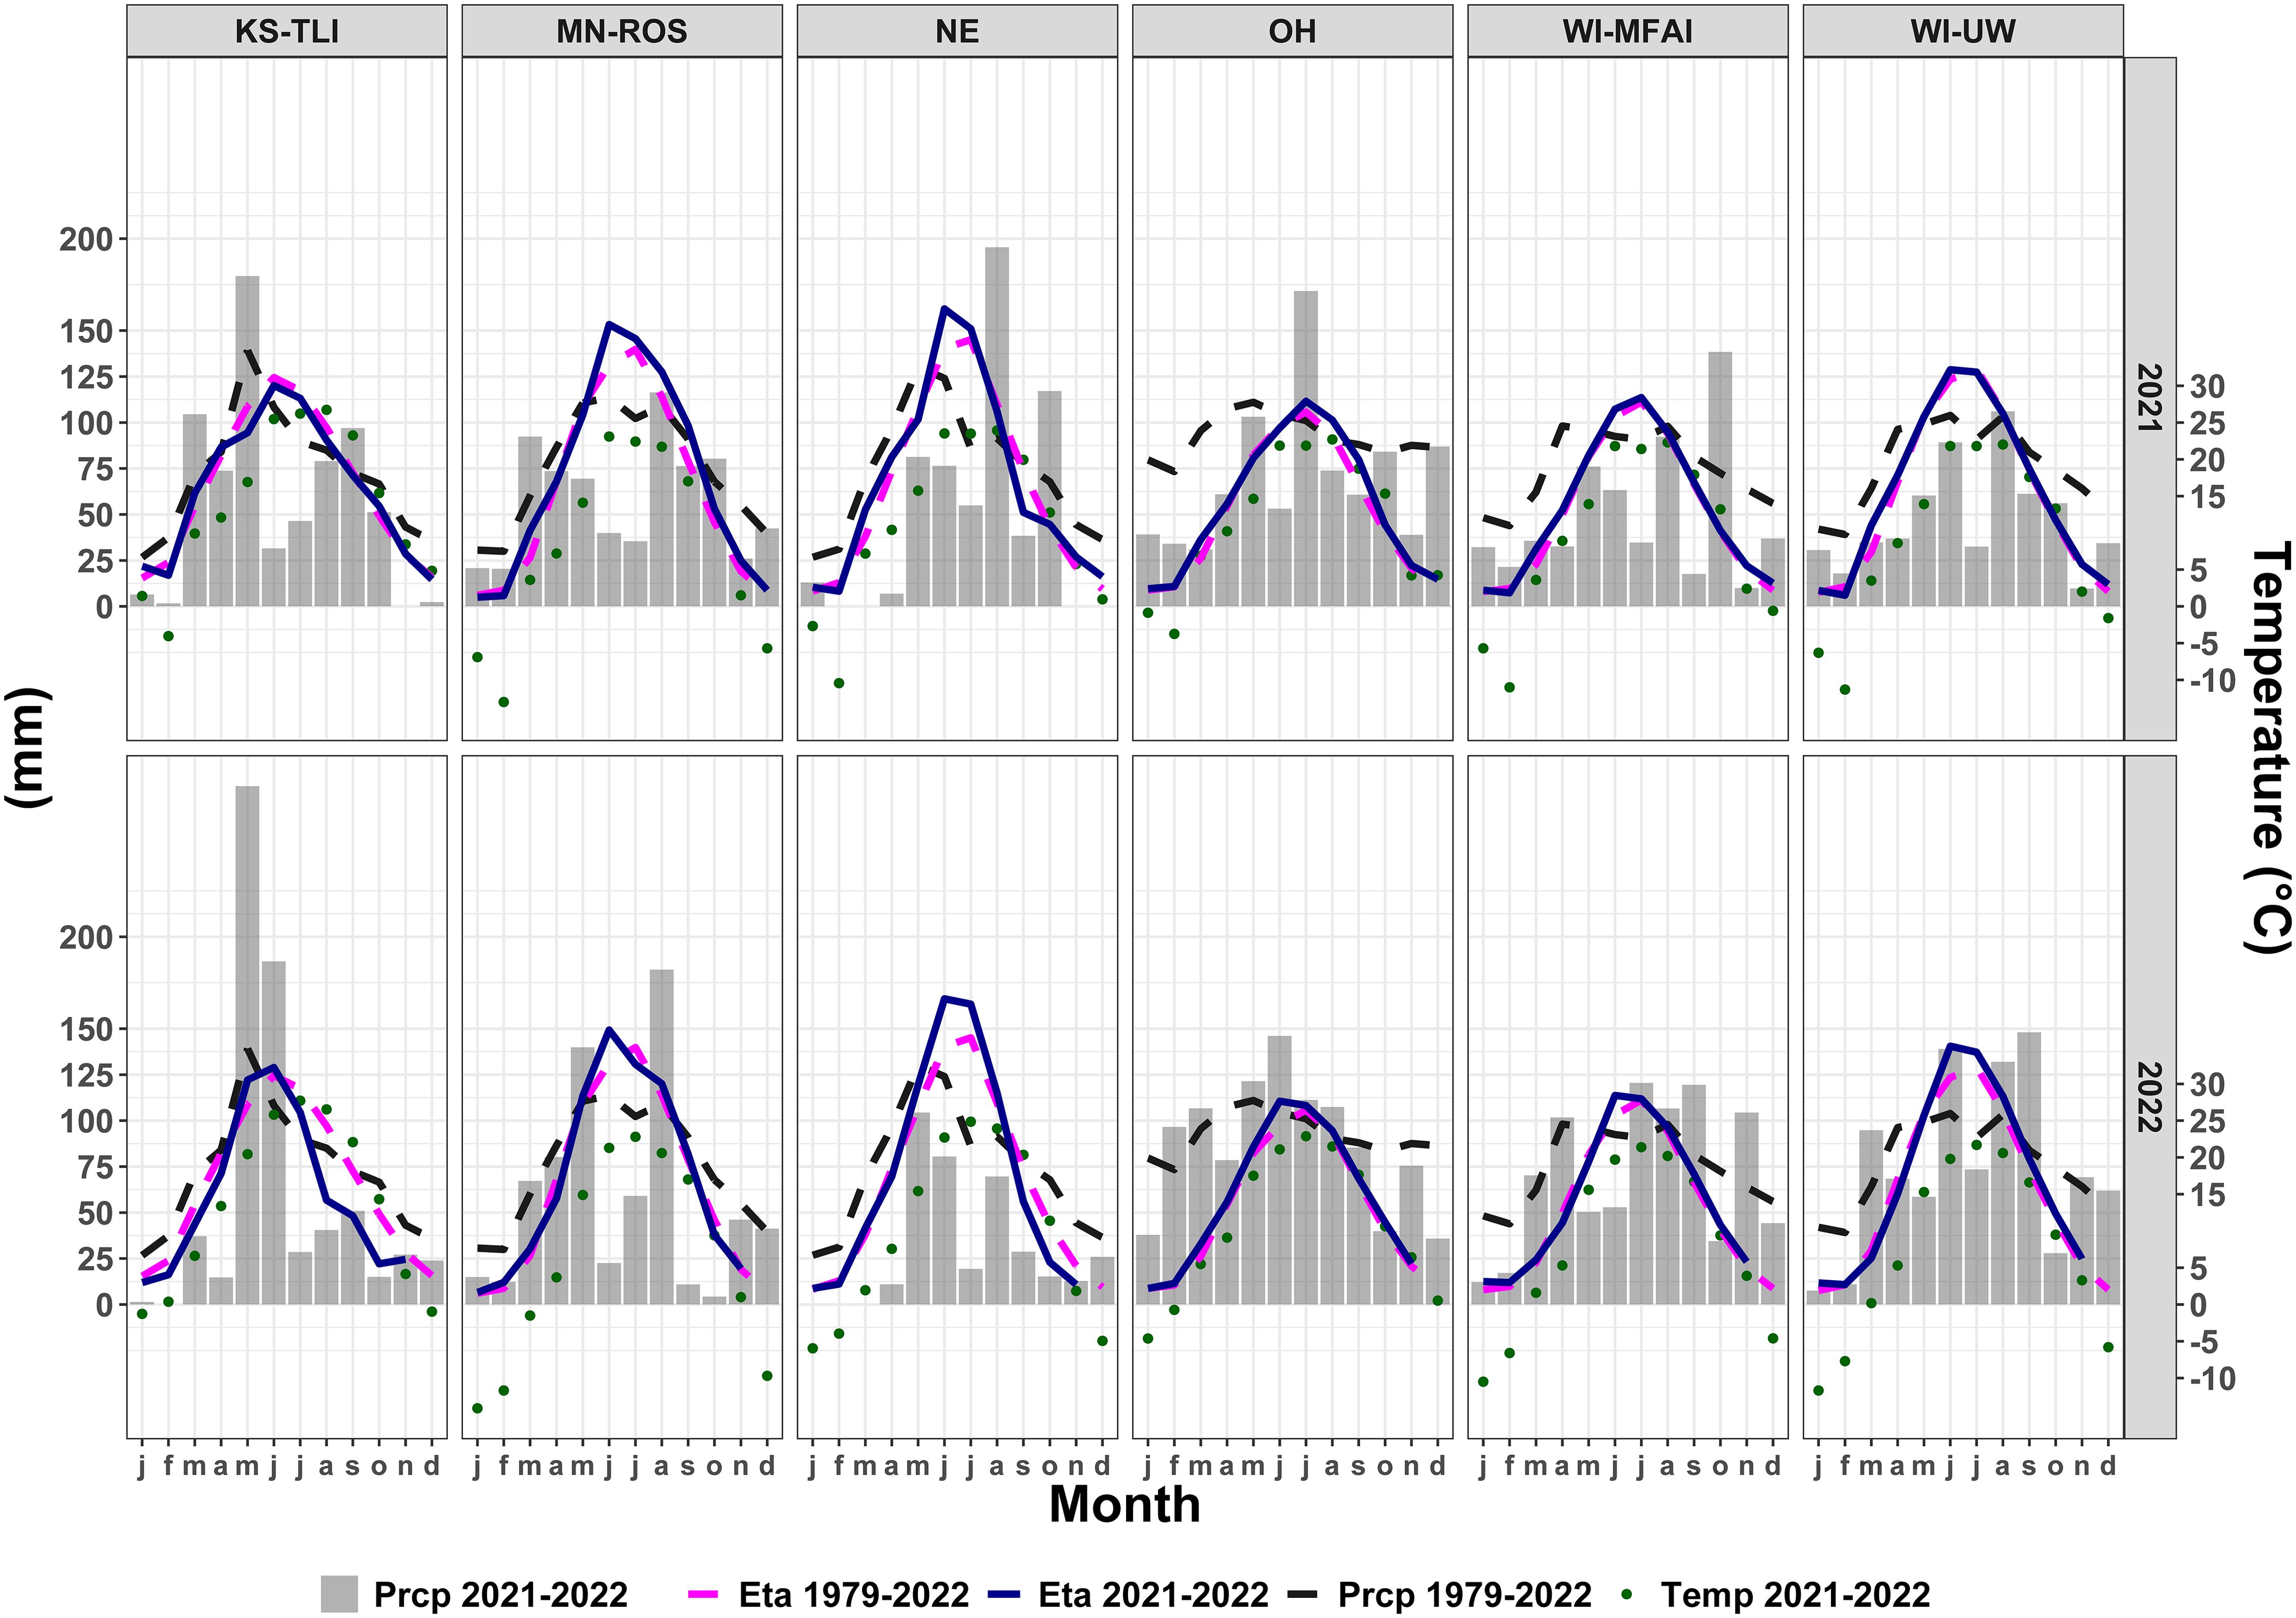
Figure 3. Mean monthly 2021–22 precipitation (Prcp, gray bars), 1979–2022 Prcp (black dashed lines), 2021–22 actual evapotranspiration (Eta; dark blue lines), 1979–2022 Eta (pink dashed lines), and 2021–22 temperature (green dotted lines) for each location. The left-hand y-axis shows mm of Prcp or Eta, and the right-hand y-axis shows the temperature (°C). The x-axis shows the month of the year for each location.
3.2 Soil characteristics
Soil parameters were statistically different across locations and with depth (Table 3, Supplementary Tables S9, S10). These location differences were reflected in the crop productivity index (Supplementary Figure S1). Soil texture analysis showed that all locations had relatively fine soil, ranging from loam to silty clay loam or silt loam 0–20 cm. At 50–90 cm, the texture was coarser, sandy clay loam in WI-MFAI, and loam for MN-ROS and OH. Soil organic matter (SOM) percentage varied across depths and locations with SOM being lower at depth at a given location. The highest SOM was reported at MN-ROS at 56 g kg-1, at 0–20 cm, and the lowest values being reported at OH and WI-MFAI at 11.5g kg-1 at the 50–90 cm depth.
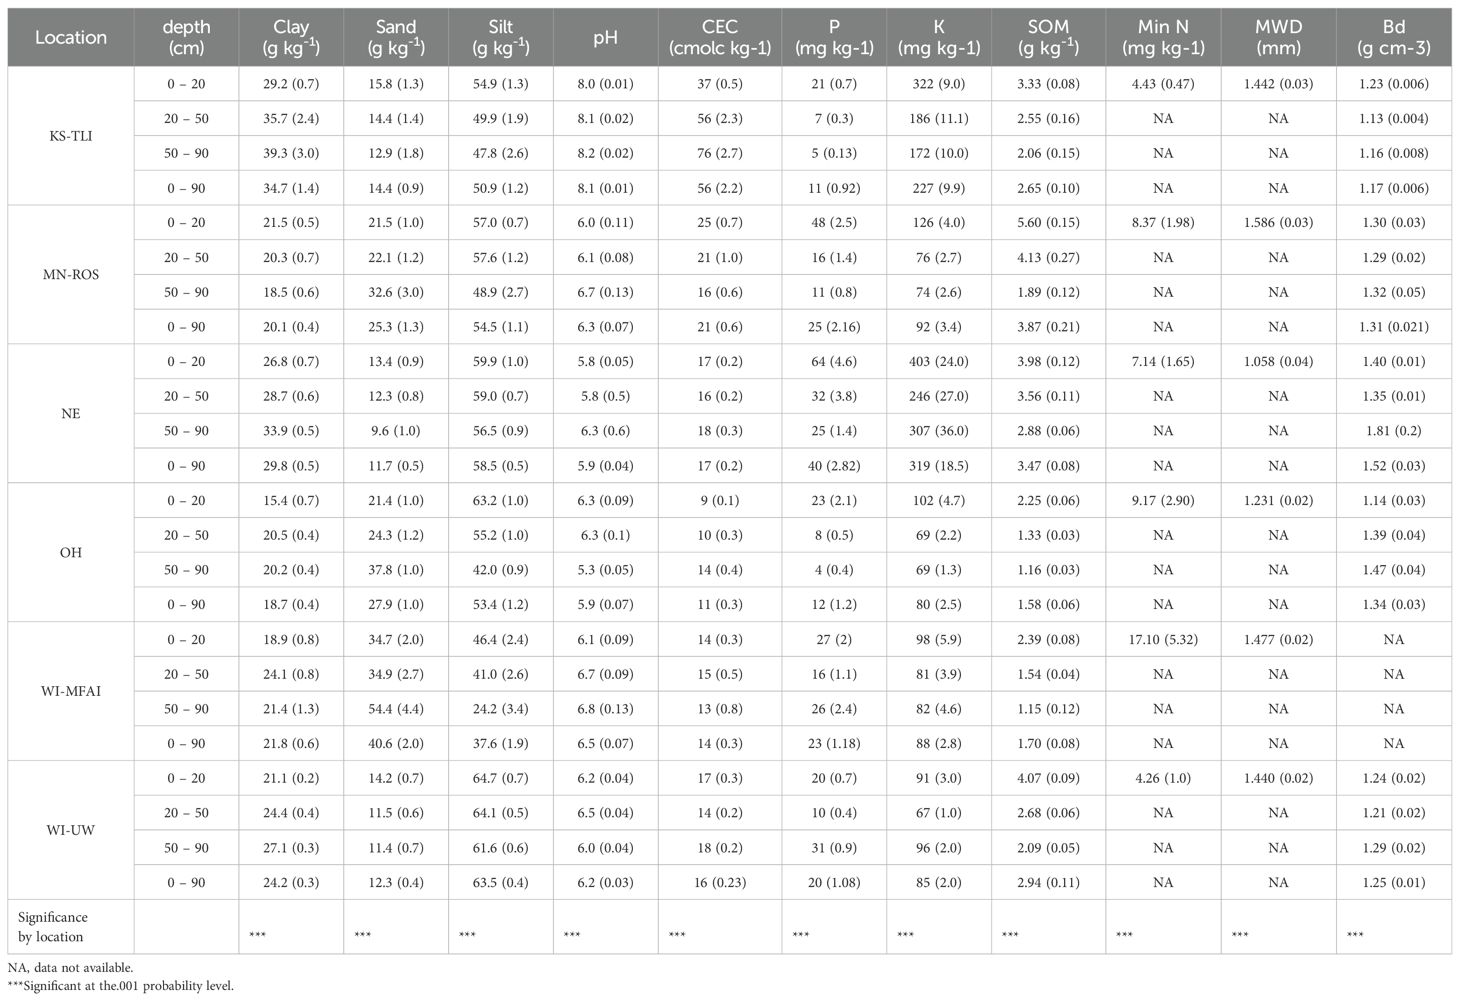
Table 3. Means (SE) of soil parameters analyzed for each depth and location: clay (g kg-1), sand (g kg-1), silt (g kg-1), pH, cation exchange capacity (CEC), phosphorus (P), potassium (K), soil organic matter (SOM), mineral N (Min N), mean weight diameter (MWD) and bulk density (Bd). The 0–90 cm depth increment represents the parameter value averaged across the entire depth profile.
3.3 Establishment, growth, and yields across locations
Establishment success, measured by plant counts after germination, varied across locations (p < 0.001). KS-TLI had the lowest plant count at an average of 5 ± 4 plants m-1 and OH had the highest, at an average of 23 ± 3.0 plants m-1 (Table 4, Supplementary Table S11).
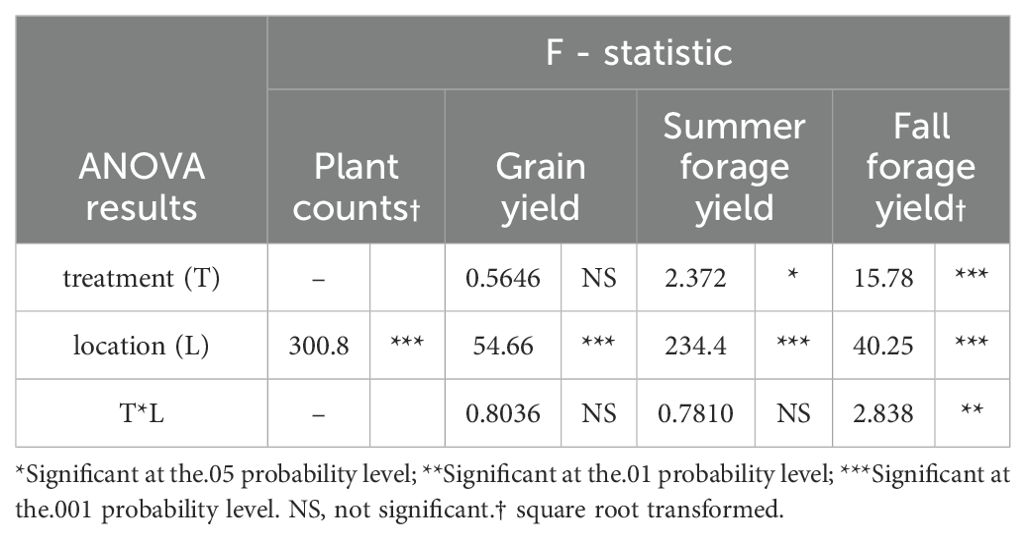
Table 4. Results of mixed model analysis of variance (ANOVA) F-statistic and statistical significance values of IWG grain, summer and fall forage.
IWG reached the anthesis growth stage at a similar timing at the MN-ROS, WI-MFAI, and WI-UW sites both when measured by DOY (day 181, 186 and 186 respectively) and by GDD (1249°Cd, 1391°Cd, 1378°Cd). KS-TLI and NE also reached anthesis at a similar DOY (164 and 174 respectively) and GDD (1536°Cd and 1422°Cd respectively). OH had the earliest DOY of anthesis (day 161) and the least GDD 1153°Cd to anthesis across the locations (Figures 2A, B).
IWG yields varied significantly by location (p < 0.001). MN-ROS had the lowest mean grain yields at 556 ± 34 kg ha-1 and WI-UW had the highest mean grain yields at 1343 ± 24 kg ha-1 for IWG (Figure 4, Table 4, Supplementary Table S11). Summer forage mean yields varied across locations with the lowest being at WI-MFAI at 2054 ± 124 kg ha-1 and the highest at WI-UW at 8930 ± 159 kg ha-1.
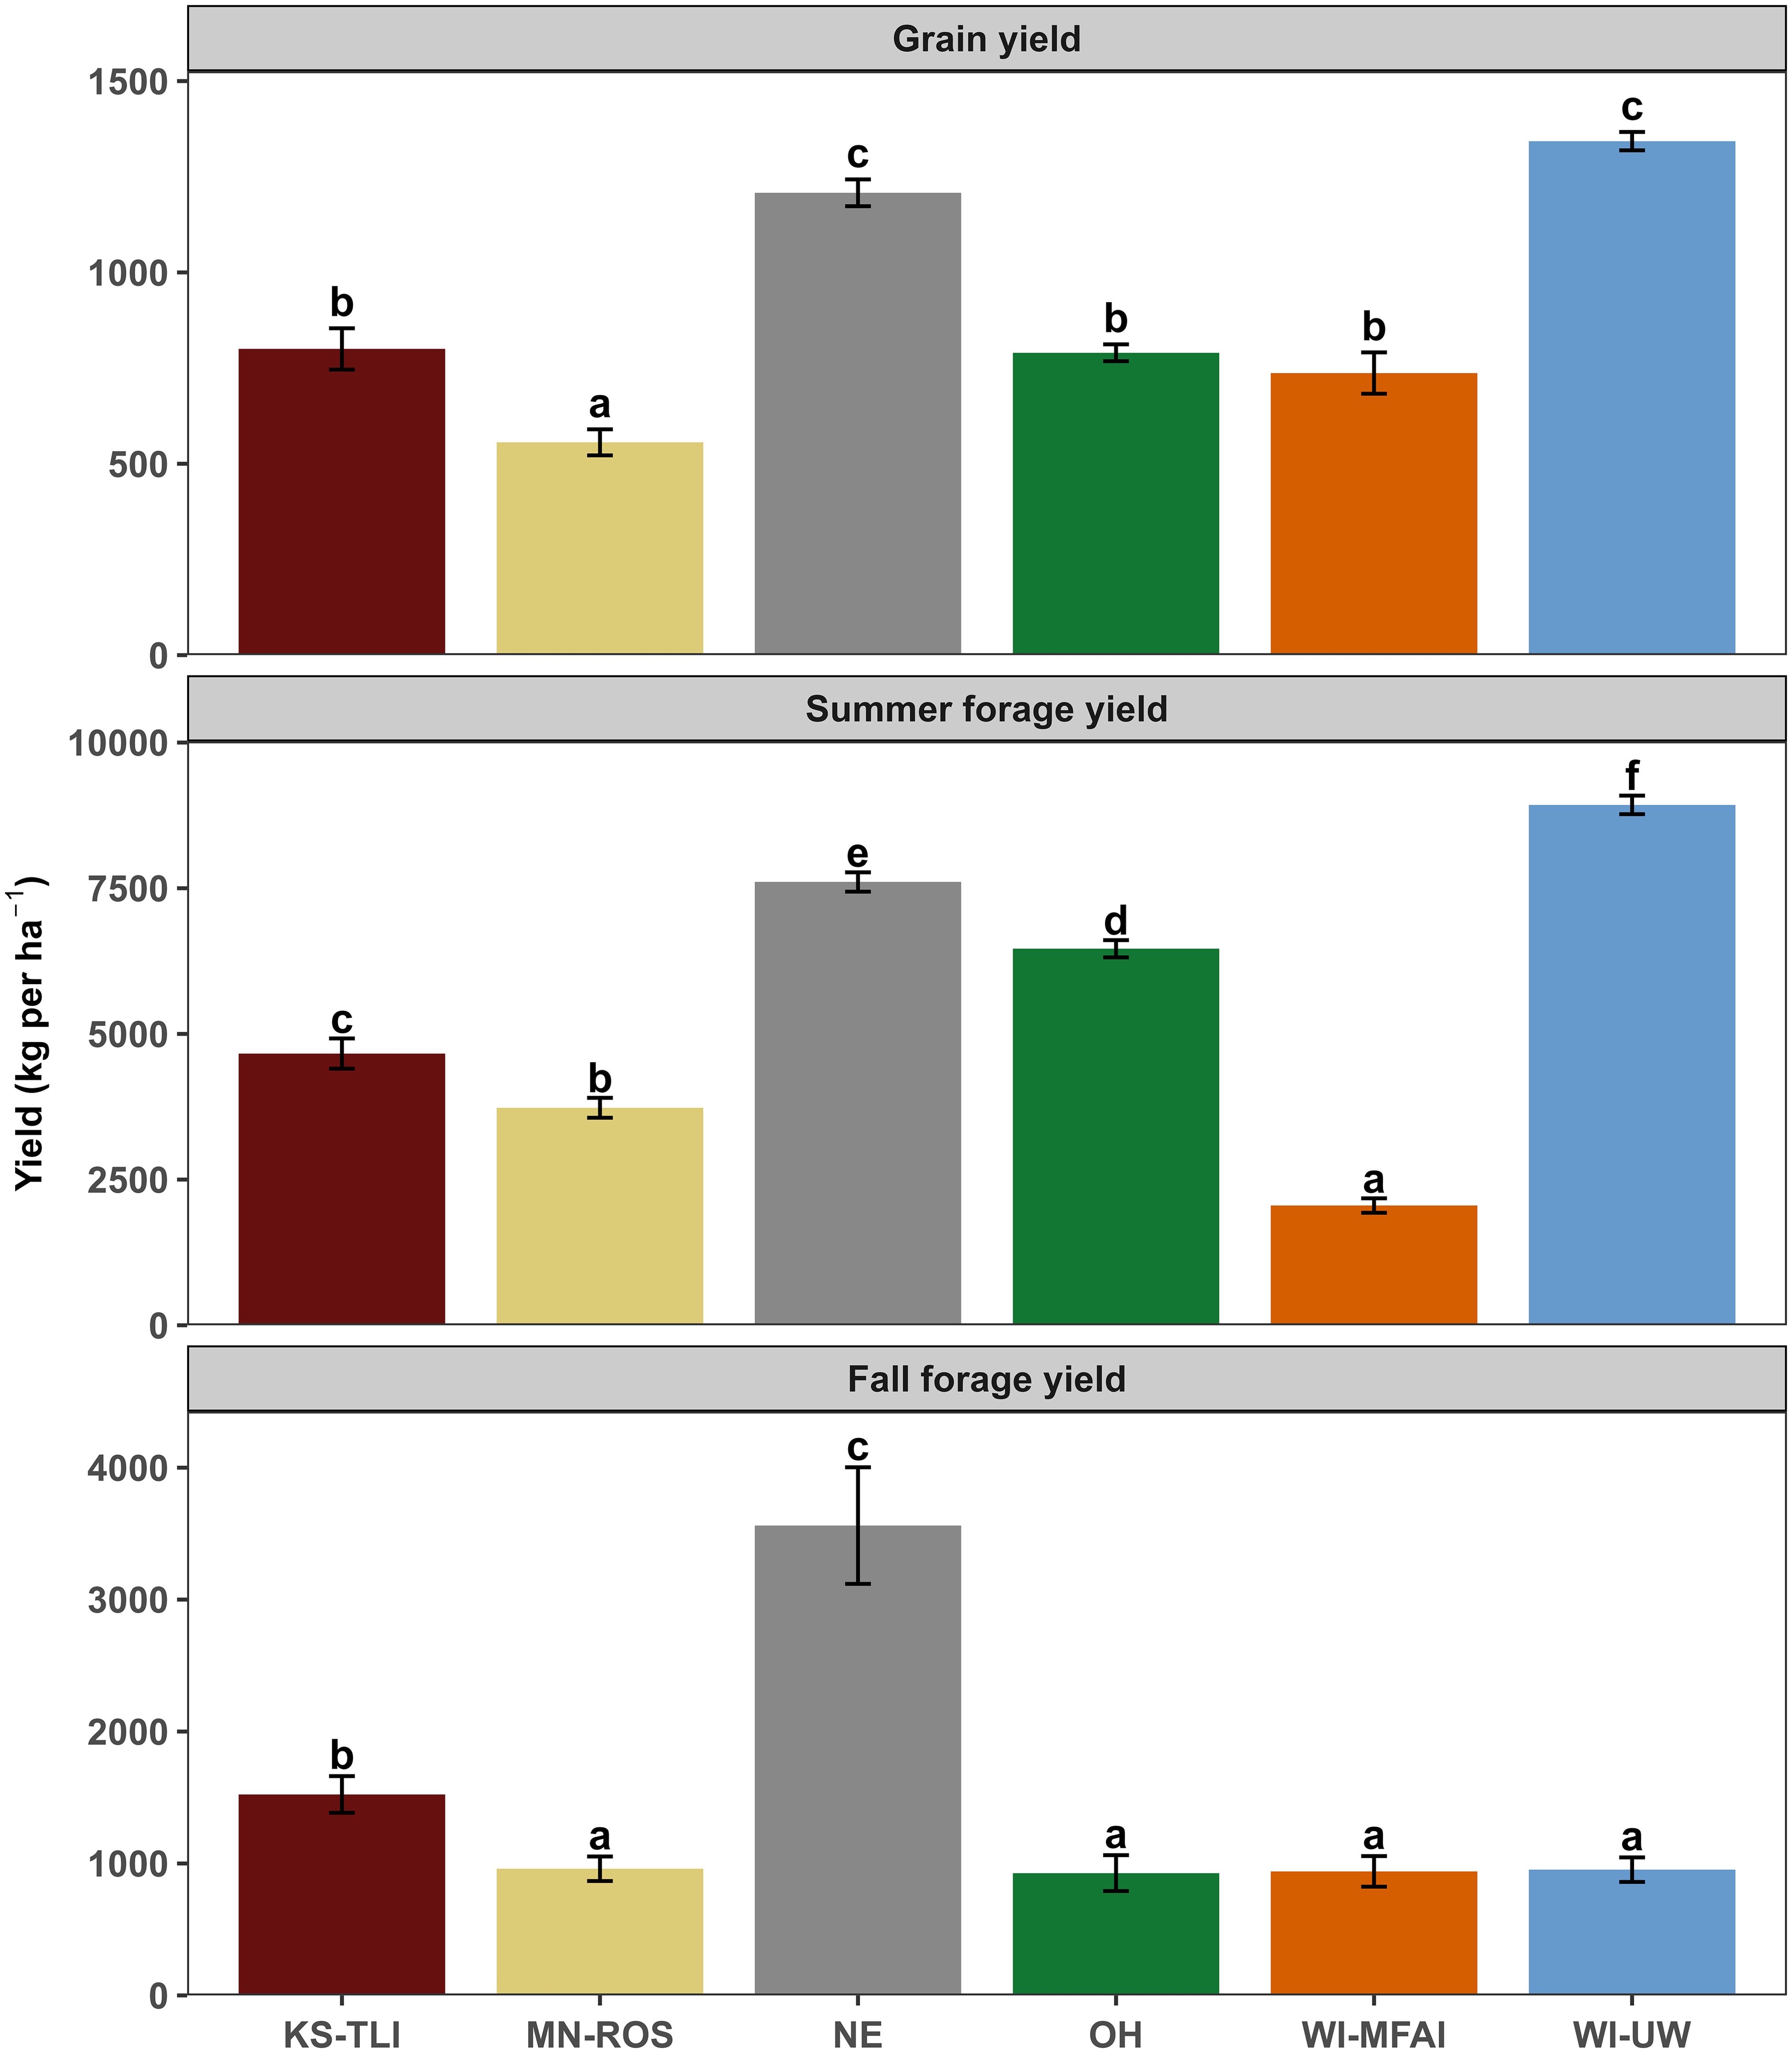
Figure 4. Average grain, summer forage, and fall forage yields (kg ha-1) at each experimental location. Error bars represent one standard error from the mean. Letters within each panel represent significant differences (p < 0.05) between sites, based on Tukey’s HSD posthoc pairwise comparison testing. Statistics were performed on square root transformed data.
3.4 Modeling the climate and soil predictors of grain and forage yields
Various combinations of soil nutrient concentrations, percent sand, aggregate stability, and climate variables including Prcp60Anthesis, EtaCrop, and PrcpCrop explained 74%, 92% and 69% of the variability in grain (Equation 2), summer forage (Equation 3) and fall forage (Equation 4) yields, respectively, across locations (p<0.001) (Tables 5, 6; Supplementary Table S12). Variables that best explained each harvest product varied, though all included some measure of precipitation (Table 6). The final models were as follows:
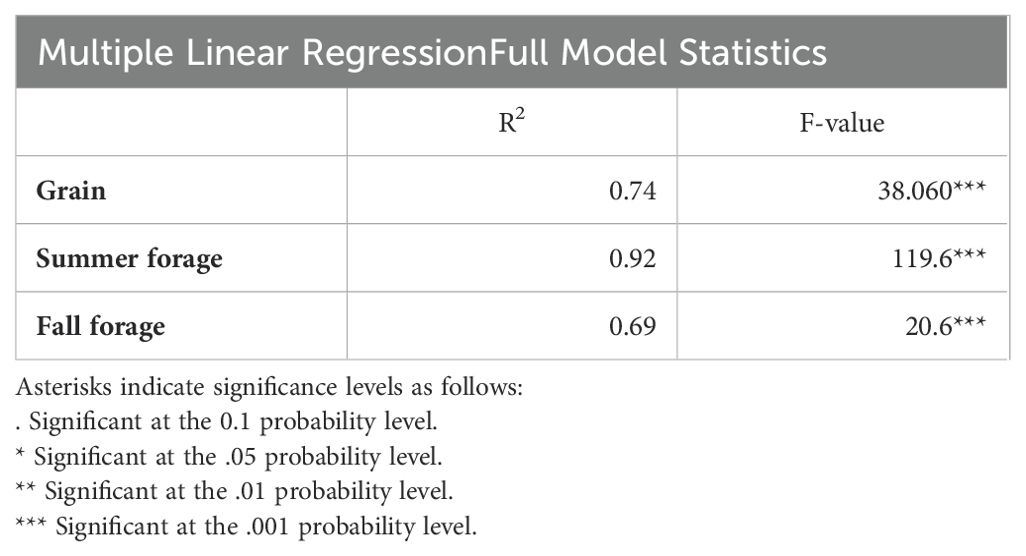
Table 5. Multiple Linear Regression model output statistics for IWG grain, summer and fall forage yields for soil parameters and climate data that were significant in final models
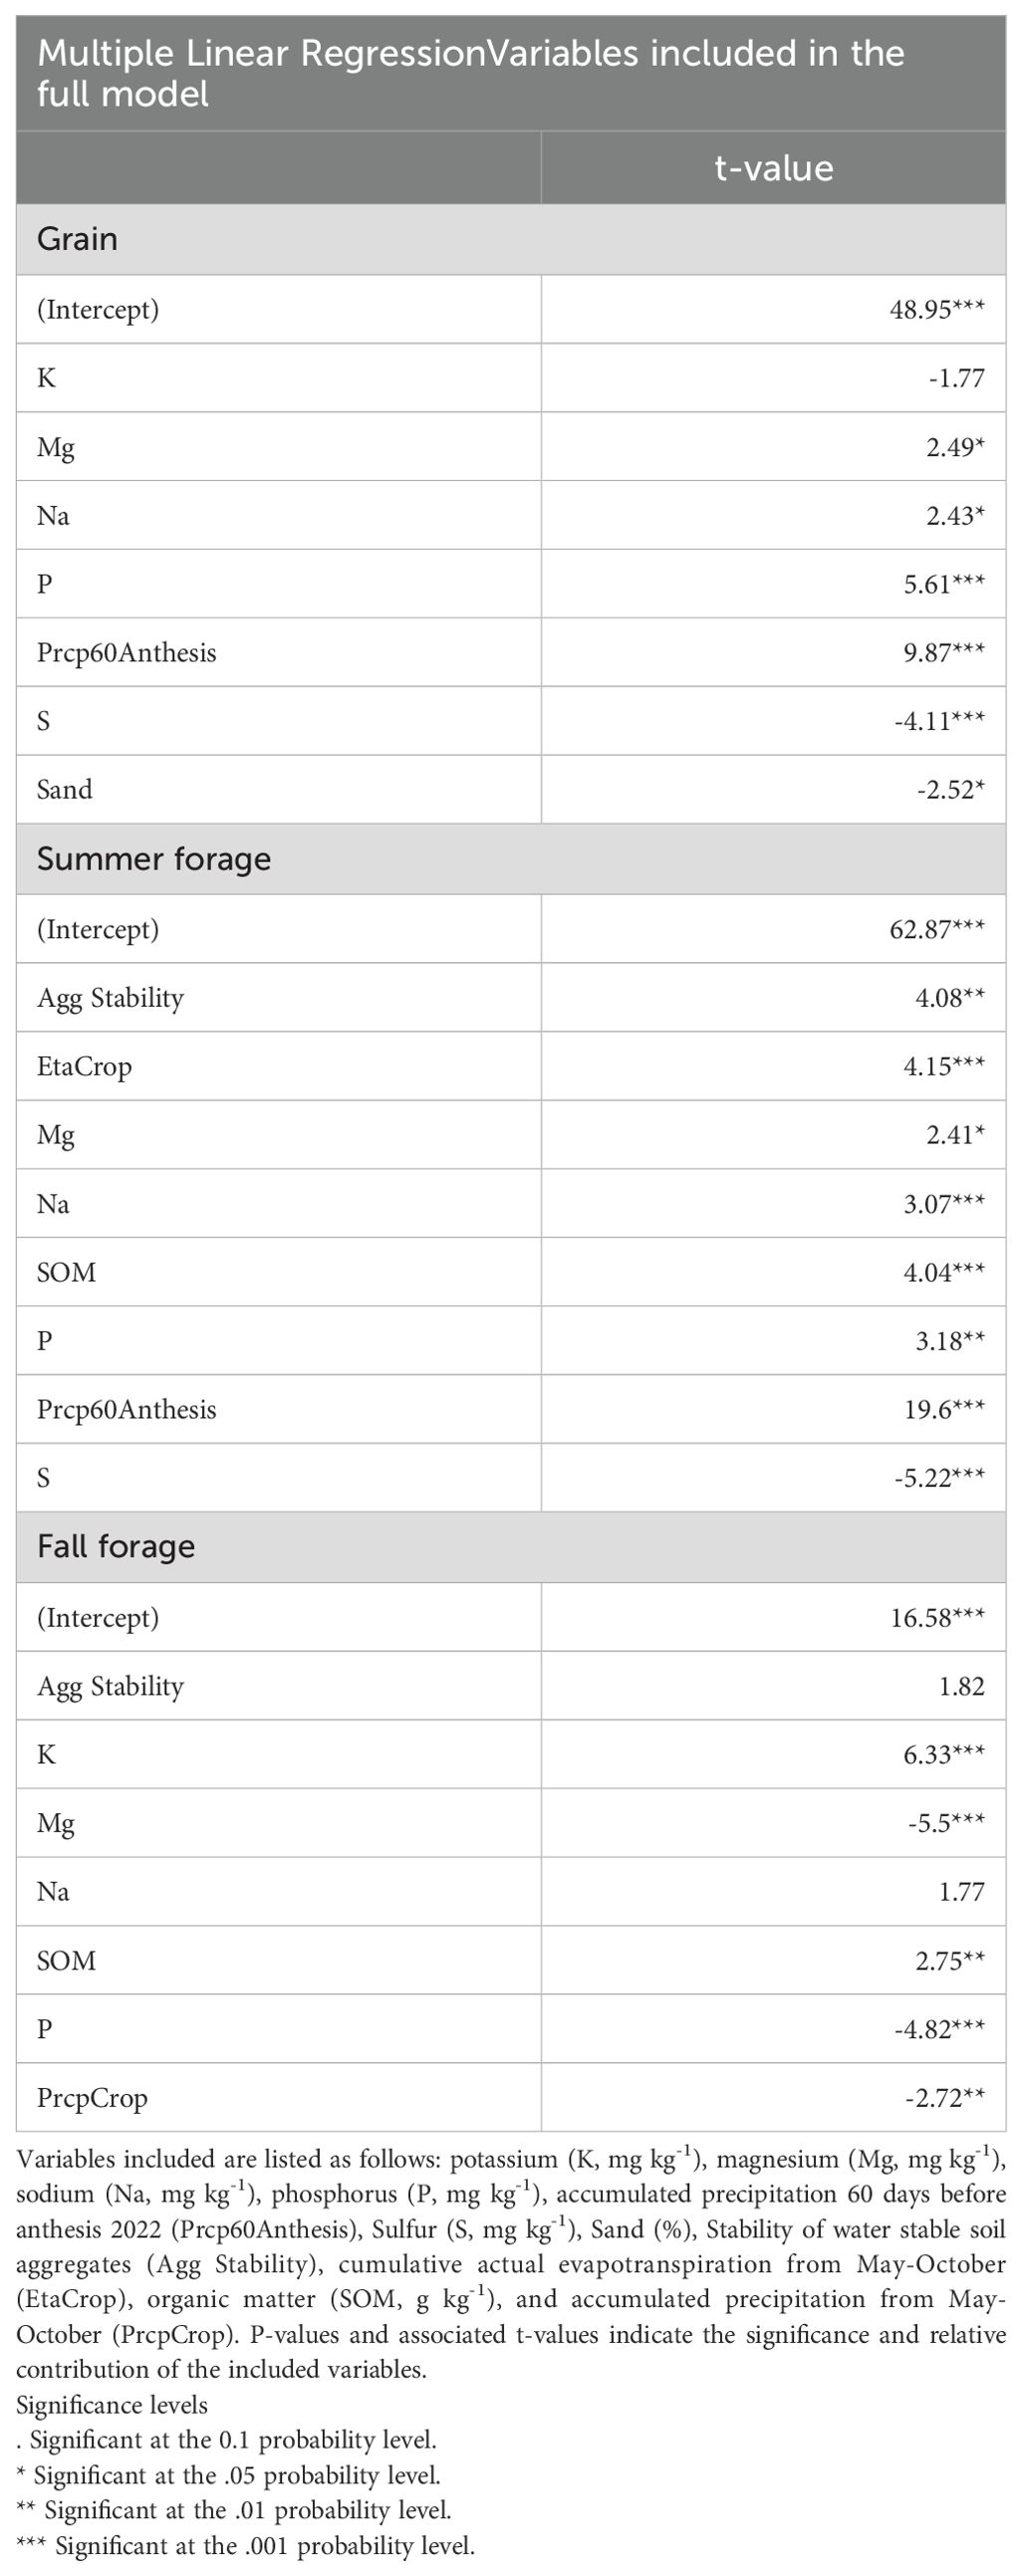
Table 6. Multiple linear regression detailed results for those soil parameters and climate data included in final models for IWG grain, summer forage, and fall forage yields.
After model construction, we performed individual regressions for those variables included in the final models (Table 7). Based on this analysis, we found that Prcp60Anthesis (accumulated precipitation 60 days before anthesis) had the greatest influence on grain and summer forage yields and alone explained 21% and 45% of the yield variability in the individual regressions respectively (Table 7). By contrast, PrcpCrop (accumulated precipitation from May to October) alone explained 2% of the variability in fall forage (Table 7). Alone, EtaCrop (accumulated actual evapotranspiration from May to October) alone also had an important influence on summer forage and explained 20% of the variability based on individual regressions (Table 7).
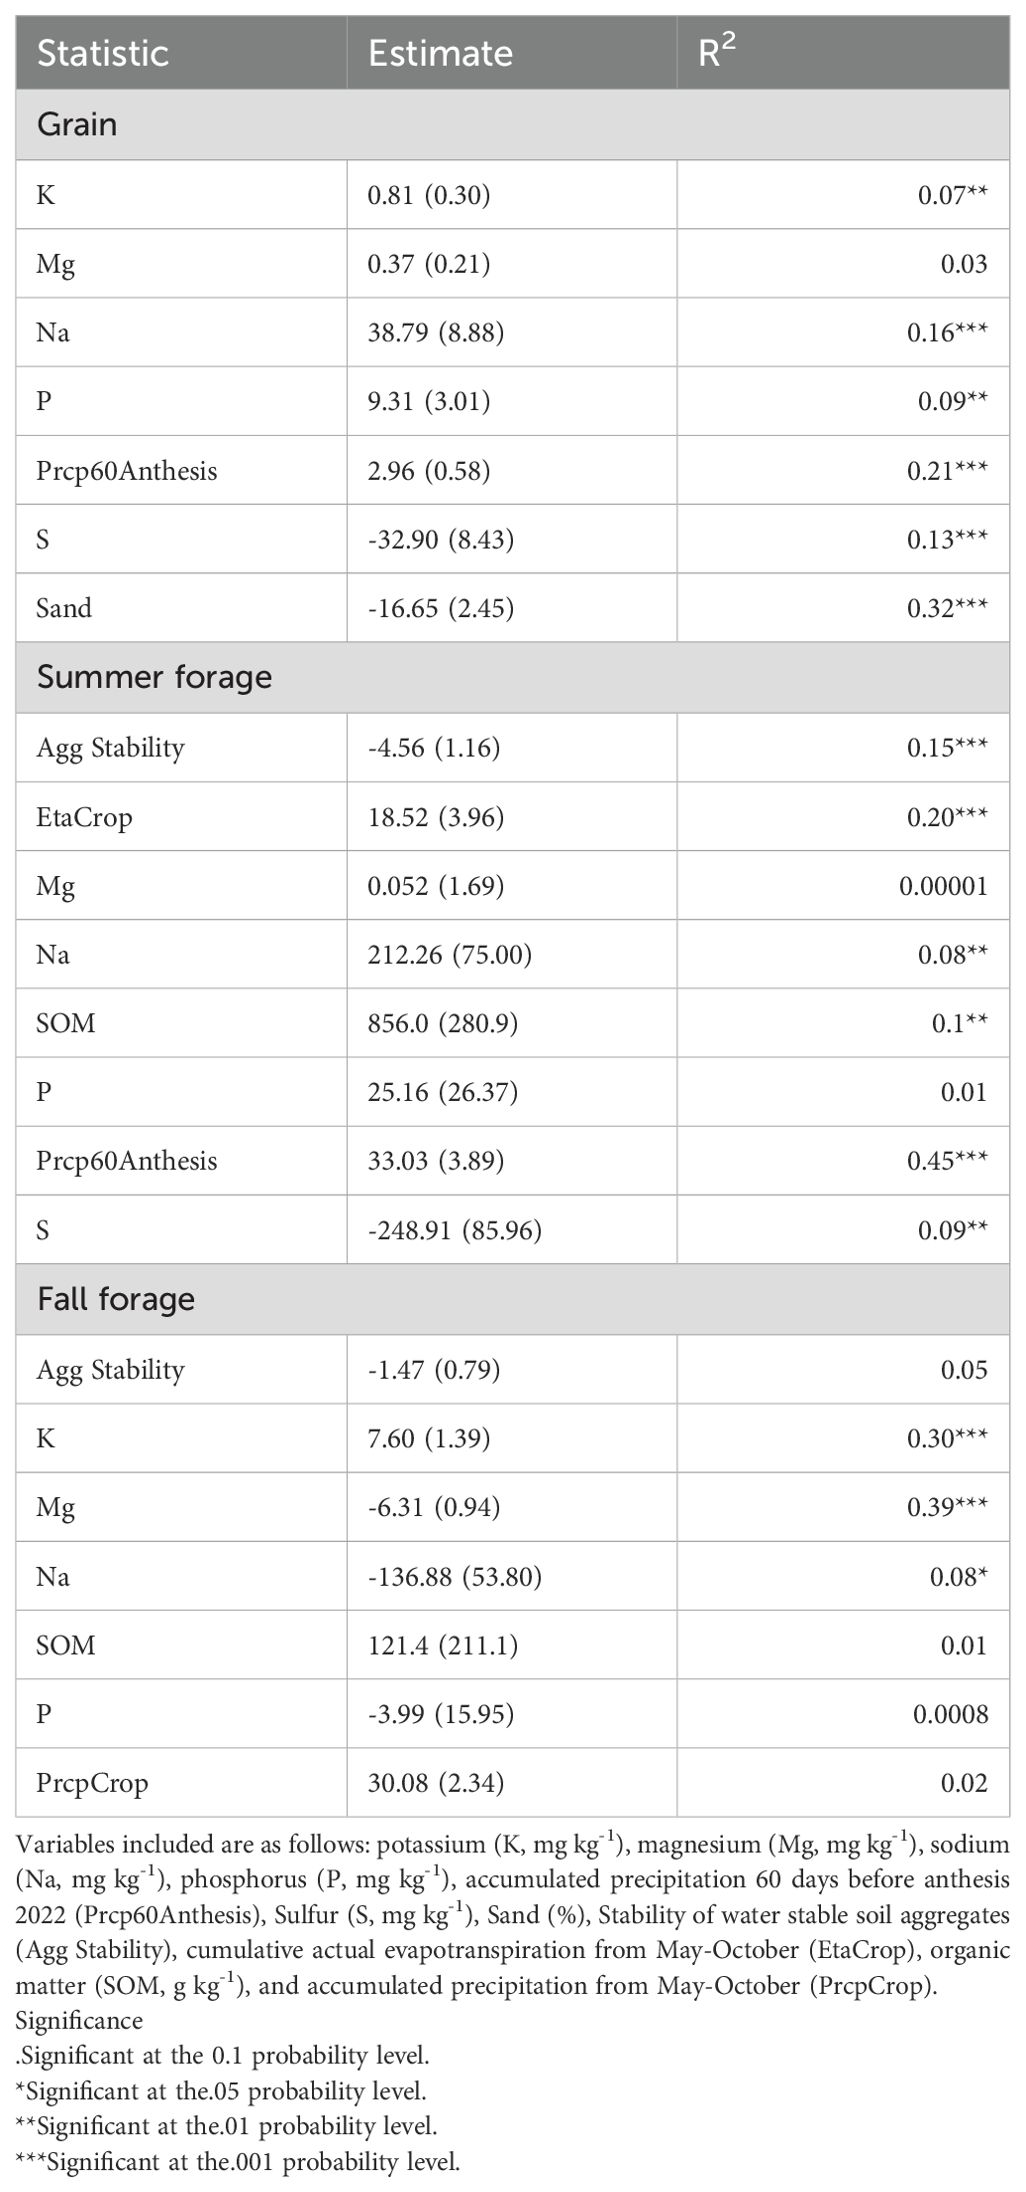
Table 7. Individual linear regression for IWG grain, summer and fall forage yields for soil parameters and climate data that were significant in final multiple linear regression models.
Soil variables tended to explain less of the variation in yields in individual regressions than precipitation with the exception of fall forage. Mg, Na and P explained 28% in grain, 9% summer forage and 47% fall forage when individual regressions were summed (Table 7). K explained 7% in grain and 30% fall forage yields models (Table 7). Agg Stability (soil water stable aggregate stability) explained 15% and 5% in summer and fall forage model in individual regressions (Table 7). Sand explained 32% of grain yields in individual regressions (Table 7). A difference between the individual regressions and the full multiple linear regression models was that although the full multiple linear regressions showed positive relationships with each response variable, some individual regressions demonstrated negative relationships with the response variables (Tables 6, 7).
3.5 Yield responses to fertility treatments
Neither fertility treatment alone nor the interaction of treatment by location influenced grain yields (p > 0.05). Treatment and location both influenced IWG summer forage yield (p<0.05 and p<0.001 respectively; Figure 5, Table 4). Among treatments, only the addition of 135 kg ha-1 spring applied mineral N increased summer forage yields compared to the no N control (p<0.05; Figure 5, Table 4). Fall forage yields were affected by the interaction of treatment and location (p < 0.01; Figure 6, Table 4), where treatments with 90 and 180 kg N ha-1 of spring mineral applied N had mean yields significantly greater than when no N was applied, only at the NE location or when fall forage was averaged across locations (p<0.05; Figure 6, Table 4, Supplementary Table S11).
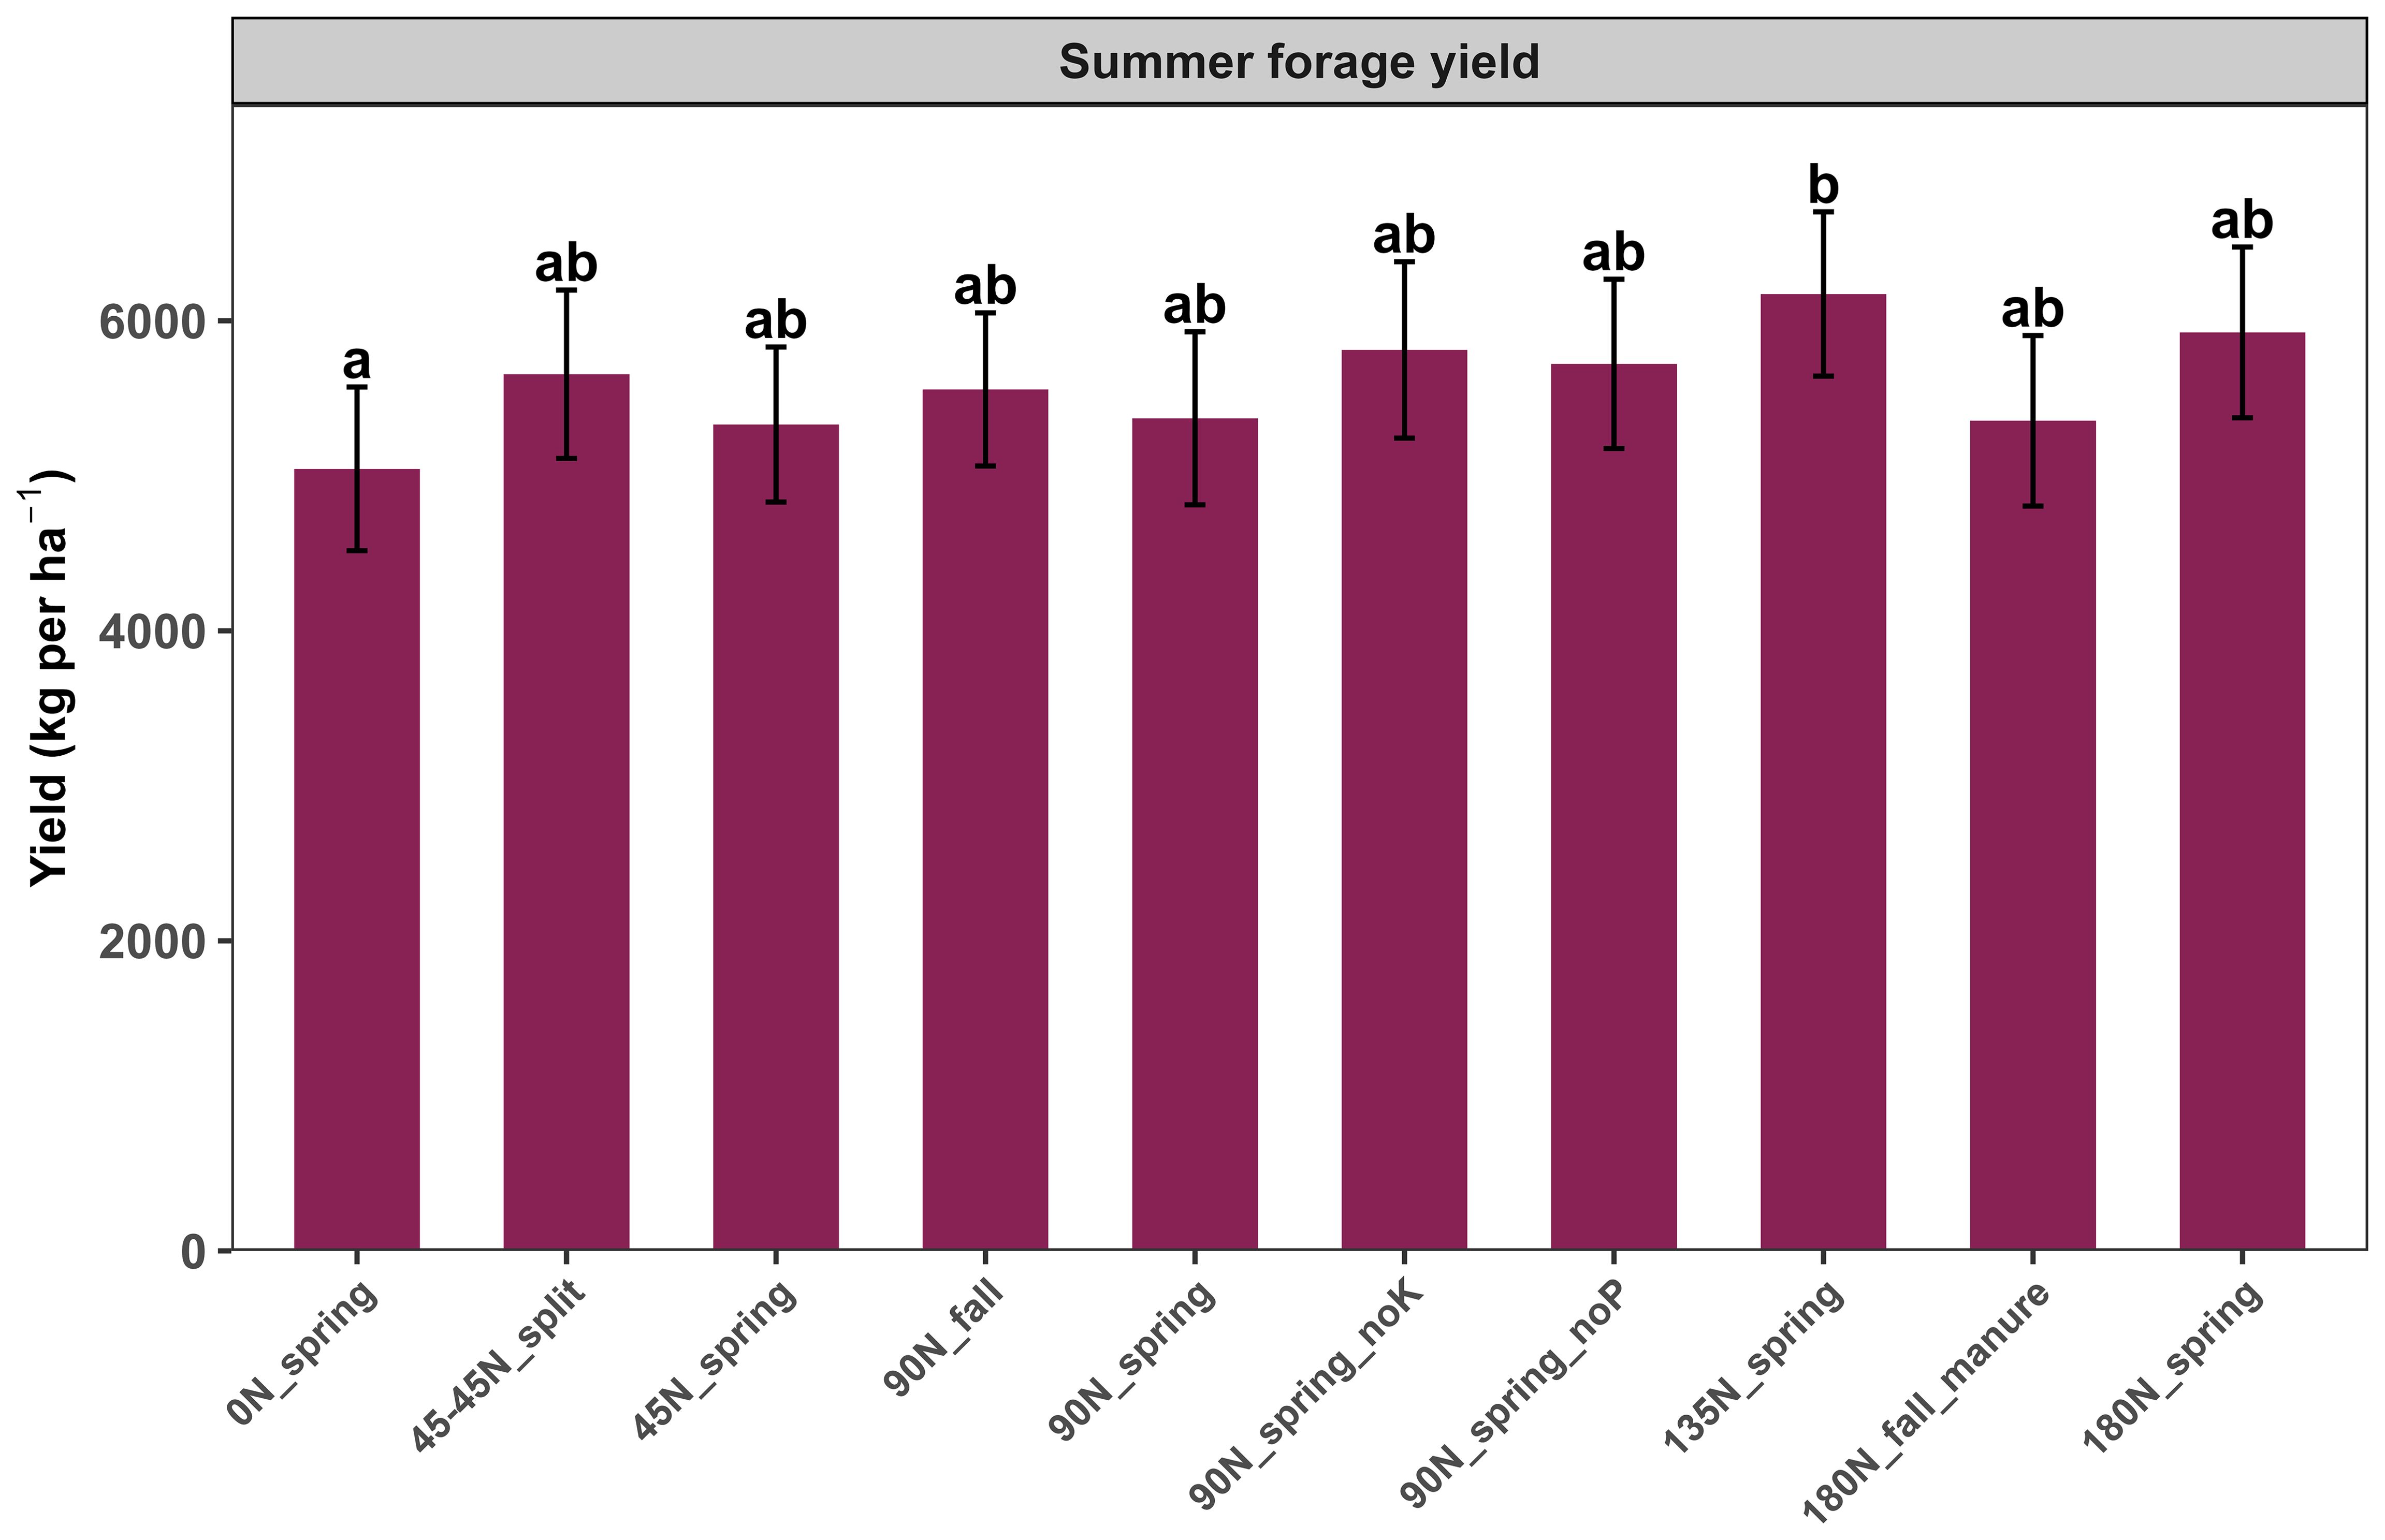
Figure 5. Summer forage yields by treatment, averaged across study locations. Error bars represent one standard error from the mean. Letters represent significant differences (p < 0.05) between sites, based on Tukey’s HSD posthoc pairwise comparison testing.
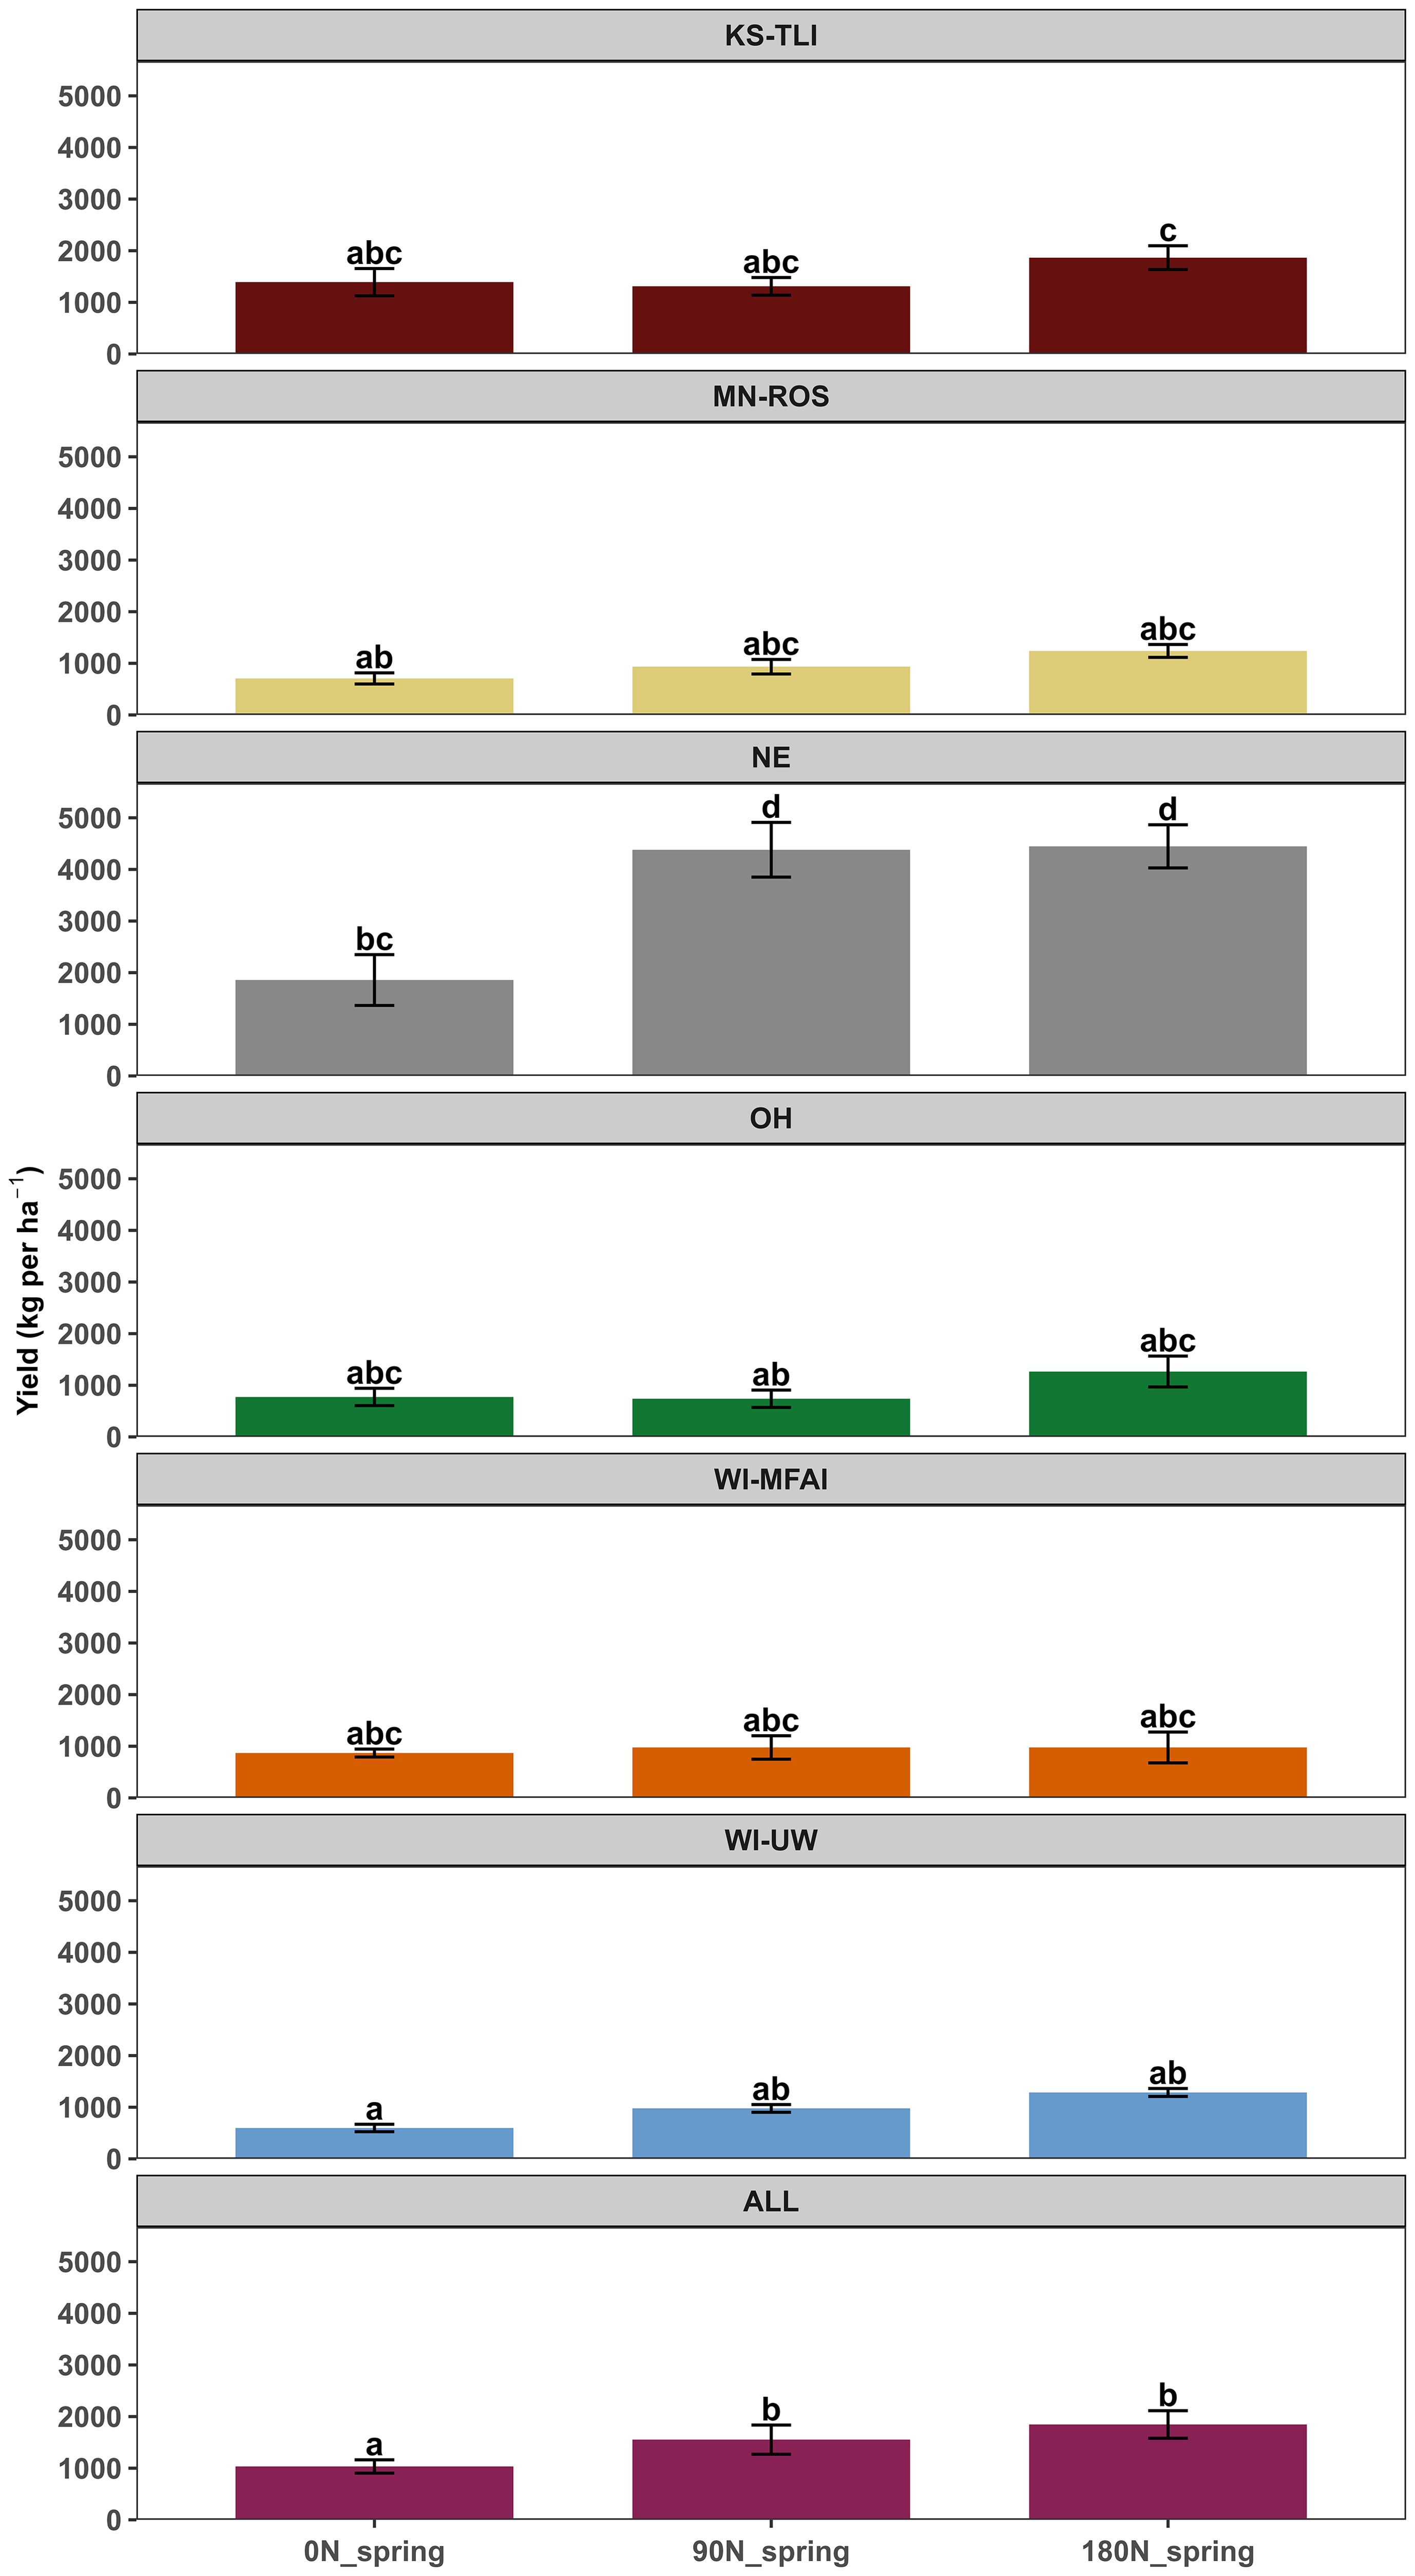
Figure 6. Fall forage yields averaged by treatment and location. Error bars represent one standard error from the mean. Statistics were performed on square root transformed data. Letters within each panel represent significant differences (p < 0.05) between sites, based on Tukey’s HSD posthoc pairwise comparison testing.
4 Discussion
Research and commercial production of IWG has been focused within a few states and regions but is now rapidly expanding to new regions. This is the most comprehensive study to date to examine the climate, soil, establishment, and fertilizer management effects on both grain and forage yields of the IWG MN-Clearwater variety in regions with increasing grower presence. At these multiple locations, we used a multiple regression analysis to determine which local factors most explain first year yields in order to generalize or guide future research to regions even beyond those studied here. Our specific objective was to understand how the first year of IWG establishment and yields (grain, summer and fall forage) were related to fertilization strategies and environmental conditions across six locations in the Midwestern United States. While other factors such as weed pressure and seeding date have been explored as factors influencing IWG establishment in the first year, the intersection of climate and fertility has been less explored. We expected that grain and forage yields would be mainly determined by soil and climate characteristics and would be further modified by fertilization treatments. These expectations were only partially confirmed.
4.1 IWG establishment
Establishment of IWG varied significantly across locations with OH having more than double, and KS-TLI with less than half the number of plants per length of planted row than the other locations (MN-ROS, WI-UW, WI-MFAI, and NE (Table 4). The low establishment observed at KS-TLI could have been associated with low precipitation at that location during the months around seeding (Figure 3). Despite variability across locations, plant counts did not predict grain or biomass yields. IWG spreads via tillers and rhizomes that can take up space between plants within sown rows. This ability to vegetatively propagate is an establishment strategy in the first year of growth (Woeltjen et al., 2024; Shoenberger, 2022). Because of this, initial plant counts in the range we observed (5.3–23 plants per m1) are expected to be able to produce a robust stand in the first year given other growth conditions and agronomic variables such as weed pressure. Research is needed to determine threshold plant populations for IWG after establishment and the first winter period to inform growers on when stands should be terminated as a result of poor establishment. Such information is available for overwintering crops like winter wheat and canola, for example (Paulsen, 1987; Assefa et al., 2018).
4.2 Variability of IWG grain and forage yields across locations
First year IWG grain yields (ranging from 586–1343 kg ha-1) were similar to and sometimes higher than year 1 yields reported in other studies (ranging from 494–1074 kg ha-1; see Supplementary Table S1 for a summary of publications reporting grain yields). WI-UW and KS-TLI yields were ~30% and ~20 – 30% higher than those described in the literature for Wisconsin and Kansas respectively (Bowden, 2023; Culman et al., 2023; Pinto et al., 2022).
At the same time, MN-ROS yields were ~20 – 25% lower than those reported in other literature from Minnesota, WI-MFAI yields were 35% lower than other reports from Wisconsin, and OH yields were similar to previous findings from Ohio (Bowden, 2023; Culman et al., 2023; Pinto et al., 2022; Bajgain et al., 2020; Fernandez et al., 2020). The highest IWG grain yields are typically observed during the first production year. Although some studies have reported comparable or higher yields in second-year stands (Culman et al., 2013; Bowden, 2023), a decline over time is more commonly observed when IWG is well established in the first year (Culman et al., 2023; Pinto et al., 2024; Bajgain et al., 2020; Mårtensson et al., 2022; Tautges et al., 2018; Zhen et al., 2024). Also, as discussed below, precipitation in the 60 day period before anthesis and local soil characteristics could be related to variance in grain yields across locations. Based on these results, expectations of yields should be established on a regional basis with the knowledge there is likely significant local variation in IWG performance depending on precipitation and establishment in the first growing year.
IWG summer forage yields also differed across locations. Similar to the trend with grain yields, WI-UW summer forage (8930 kg ha-1) was ~30- 50% higher than that previously reported for Wisconsin (Pinto et al., 2024; Culman et al., 2023) (see Supplementary Table S1 for a summary of publications reporting summer forage yields), and summer forage values at MN-ROS were ~20 – 75% lower than those previously reported for Minnesota (Bowden, 2023; Culman et al., 2023). KS-TLI summer forage yields were roughly the same as those previously reported in Kansas for the MN-Clearwater variety (Bowden, 2023) but ~20% higher than those previously reported for C4 TLI variety (Culman et al., 2023). This makes sense in that higher productivity is a major breeding goal (Bajgain et al., 2020). Although fall forage yields were lower than summer forage yields (Table S11), they were not as variable as summer forage yield by location, with the exception of NE, which had ~50 – 75% higher yield than the other sites. Together, the variance we and others have observed in grain and summer forage yields indicates a need to better understand what could give rise to this large range in growth from one year or location to the next. Fall forage has not been as extensively studied across our study locations, but our range of fall forage biomass, when averaged across locations, were similar to that reported previously (Pinto et al., 2024; Culman et al., 2023), with the average at NE approximately two-three times higher. Below, we discuss how climate and soil variables were also related to this variance in biomass yields across locations.
4.3 Modeled influence of climate and soil variables
One objective of our study was to determine the extent to which local climate and soil conditions explained variance of first year grain and forage yields. The context within which we performed this analysis with a first growing year of 2022 was that at our experimental locations, the temperature and precipitation in 2021 and 2022 were respectively colder and drier than the 1979–2022 means for all locations except OH, which had temperature similar to the historic average (Table 1). The drier conditions observed over this region are in line with the climate change patterns observed since 1900 across the Midwest (Yu et al., 2018). Although precipitation levels in the eastern Midwest were below average, they were still higher than the western Midwest region in 2022 as is typical (Marvel et al., 2023). Actual evapotranspiration (Eta) also varied across locations (Table 1, Figure 3). The relationship between Eta and precipitation determines the level of agricultural drought (Wilhite and Glantz, 1985). KS-TLI and NE are often at risk of drought because they have higher probability of seasonal crop moisture deficit (Wilhelmi and Wilhite, 2002; Logan et al., 2010), more so than the other locations in our study (Yu et al., 2018) (Supplementary Table S5, Supplementary Figure S3).
Of the climate variables identified after model selection, cumulative precipitation 60 days before anthesis (Prpc60Anthesis) was the strongest predictor of grain and summer forage yields (Table 6). According to our multiple linear regression models, for every 1 mm increase in Prcp60Anthesis, we would expect 4.7 ± 0.5 and 50.9 ± 2.6 kg ha-1 grain and forage increase respectively when other environmental conditions are held constant (Equations 2, 3).
In previous studies, temperature was more strongly related to grain and summer forage yields than precipitation (Culman et al., 2023), with precipitation explaining 16% and 6% of variability in grain and summer forage yields respectively. In this study, narrowing the window of precipitation to relate to yield may have strengthened this relationship as the 60 days before anthesis explained 21% to 45% of the variability of grain and summer forage yields (Table 7). The importance of this period of precipitation before anthesis is demonstrated by some of the observed trends. For example, while the MN-ROS location had a similar amount of annual cumulative precipitation as several other locations in 2021 and 2022, it had the lowest yields in the study perhaps because it also had 47% lower precipitation in this window compared to the average across locations. This may also explain why the WI-MFAI had significantly lower yields than the WI-UW location despite similar historical climate; the WI-MFAI precipitation before anthesis was 35% below average across locations while WI-UW was 12% above. Locations with 189–195 mm precipitation in the 60 days before anthesis had typical or higher than expected yields for the region, whereas locations with lower (MN-ROS, WI-MFAI) and higher (OH) precipitation in this period had significantly lower yields than expected for the region (Supplementary Table S1). We also observed anomalies in these trends. For example, despite having the lowest annual precipitation in 2021 and 2022 and high Eta (Table 1), grain yields from the NE location were among the highest in this study.
Narrowing the window of precipitation analyzed with grain yield resulted in greater correlation with grain yields and may be a meaningful starting point for identifying a ‘critical period’ for IWG. Common annual crops have established critical periods around anthesis when any water, temperature, or light stress influences the number and size of grain (Slafer and Andrade, 1993; Andrade et al., 1999). For example, the critical period for wheat is 20 days before and 10 days after anthesis (Fischer, 1985), while for corn, it is 15 days before and after anthesis (Andrade et al., 1999). Our results point to the potential need to investigate a much longer precipitation window (189–195 mm in the 60 days before anthesis) than for annual crops to infer potential weather impacts to grain and summer forage yields.
The analyses in this study on climate impacts are limited by having a single data point for precipitation and temperature within each location despite wide variation in yield both within and among locations. This could have resulted in the nonsignificant or negative relationships between some climate factors and grain and fall forage yield that seem contradictory to our ecological understanding of plant growth during moisture limitation (Table 7). Thus, these results are not conclusive about the relationship between precipitation and IWG yield or the critical period for IWG. They do however provide preliminary data from which future determination of the critical period for IWG could be determined. Our results also demonstrate that many factors together influence yield across and within a given climate and that multi-site modeling efforts, with multidisciplinary datasets, are needed to synthesize and elucidate these patterns.
Soil characteristics explained as much or more variance in IWG grain and forage yield data than climate variables in multiple regression models (Tables 5, 6). Soil texture was the most influential variable in explaining grain yields, where each increase in percent sand resulted in a decline of 16.7 ± 2.5 kg grain ha-1. Soil texture strongly influences soil water holding capacity, water retention, and provision of nutrients important to plant growth, and the ability of the soil to retain or form soil organic matter (Crews and Rumsey, 2018; Crews et al., 2018; Sprunger et al., 2018). Aggregate stability had a surprisingly negative but consistent relationship with forage yield. NE had lowest aggregate stability but nearly the highest yields, where MN-ROS was the opposite with the highest aggregate stability and lower yields. This could be an inadvertent correlation with baseline soil characteristics. We expect soil aggregate stability to increase with increasing IWG stand age (Rakkar et al., 2023; Chamberlain et al., 2022; Wuest et al., 2006), just as we expect improvements in SOM and infiltration (Culman et al., 2013). Potassium (K), sodium (Na) and magnesium (Mg) also consistently explained variance in our yield data (Tables 5, 6). Very few studies have investigated the IWG requirements of macro or micro-nutrients other than nitrogen but there is evidence that IWG total biomass, grain yield, or yield components can be explained by soil elemental composition (up to 35% of variance for grain yield, 39% for total biomass, 79% for the number of grain producing stems; Muhandiram, 2023). This suggests that although we did not find that other macro or micronutrients explained variance in grain or biomass yields in this study, they could be important for IWG fertility at certain locations.
4.4 IWG grain and summer forage yield responses to fertility treatments
Among all fertilization treatments, the only significant responses we observed were with summer forage when averaged across locations, and fall forage yields when averaged across locations or at NE, with no response from grain yields (Table 4). The lack of grain yield response to fertilizer is common in first year IWG production (Jungers et al., 2018; Reilly et al., 2022b; Pinto et al., 2022), but because these studies all used older varieties of IWG with lower yield potential than MN Clearwater, we had anticipated that we might see stronger year 1 responses. At the same time, a meta-analysis on IWG grain and biomass yields in response to N fertilizer rates showed that grain yields were not affected by increasing N rates in the first year, but a positive effect of N rates on grain yields increased as stands aged (Bianchin Rebesquini, 2023). IWG’s large and deep root system that can access nutrients deep in the soil profile (Ryan et al., 2018) could be related to the lack of fertilizer response. Endogenous N mineralization from SOM induced by tillage before planting may help explain the lack of N limitation in year one. Between 0.9 and ~10 mg N kg−1 soil has been adequate for fulfilling IWG (Dobbratz et al., 2023) and, more generally, perennial grass demand (Vogel et al., 2002). Locations in this study (except KS-TLI) fell within the low end of that range (Table 3). Thus, it appears that for MN Clearwater, the range of sufficient soil N to meet IWG grain needs in the first year of growth remains the same. Also, since the number of grain producing spikes is highly correlated to grain yields, it could be that domestication traits and environmental factors that control tiller production are as important as fertility management for determining grain yields (Fagnant et al., 2024). With annual removal of N in grain and forage biomass, we expect there will be a grain yield response to treatment in future years as has been observed in other studies (Bianchin Rebesquini, 2023; Pugliese et al., 2019; Pinto et al., 2022; Bowden, 2023).
Although endogenous soil N may be adequate for IWG grain production, we found evidence that IWG may have a higher first year N demand for both summer and fall forage production. We observed summer forage yield responses to N fertilizer when averaged across locations, and fall forage yield responses when averaged across locations and at the NE location (Table S11). Specifically, we found that 135 kg ha-1 of spring applied N produced ~ 19% more summer biomass than the unfertilized control. We also found that both 90 and 180 kg ha-1 of spring applied N produced ~55% more fall forage biomass than the unfertilized control at the NE location, and ~60% more fall forage biomass when averaged across locations (Table S11). Although N absorption early in the season until the point of spike and grain development may be critical for grain yields, N can continue to be taken up or reallocated in fall for vegetative forage biomass production. There have been inconsistent results in terms of summer forage yield response to fertilizer (Bowden, 2023; Pinto et al., 2022; Reilly et al., 2022b). In the case of fall forage biomass, few studies have reported yield responses to variable N rates (Bowden, 2023; Pinto et al., 2024). In summary, the fertilization strategy of IWG could depend on specific management goals of grain, forage, or dual use Kernza production given that grain versus biomass production may require different N rates or timings in the first year.
5 Conclusions
This is the first study to inform a potential critical period for IWG and comprehensively assess soil, climate, and management conditions on both grain and forage production across the U.S. Midwest. We found that in the first harvest year IWG only responds to N fertilization vegetatively (summer and fall forage) and not with grain production. Our study also demonstrates that environmental factors such as precipitation, actual evapotranspiration, and soil characteristics influence IWG grain yields more than fertility management in the first harvest year. Specifically, the cumulative precipitation 60 days before anthesis may be critical for determining grain and summer forage yields, where the cumulative precipitation from May through October may be more important for fall forage yield production. Soil characteristics such as sand content, aggregate stability, magnesium, sodium, and potassium help predict first-year IWG yields as well.
The role of precipitation may have been overemphasized in our models compared to edaphic soil characteristics due to the historic drought conditions at several locations during the study period. Despite this, our results could help explain how IWG performs across a range of environmental conditions, even beyond the 6 study sites presented here, which will contribute to a more nuanced decision-making tool for farmers and inform suitable regions for IWG as a viable grain crop. Models such as those tested here can only provide correlative, not causal, relationships, but will still aid in developing accurate predictions for IWG establishment, first year performance, and refining the critical period for IWG as well. For example, once a more specific critical period is established for IWG in the first year, it can inform producers about whether to invest in a grain harvest in year one or simply harvest IWG for forage, saving resources, if precipitation during the critical period is below a given threshold. In summary, the relationships described here will be informative to future best practices and outreach to producers establishing new IWG stands.
Data availability statement
The raw data supporting the conclusions of this article will be made available by the authors, without undue reservation.
Author contributions
MTC: Conceptualization, Data curation, Formal analysis, Investigation, Methodology, Validation, Visualization, Writing – original draft, Writing – review & editing. JG: Conceptualization, Data curation, Funding acquisition, Investigation, Methodology, Project administration, Resources, Supervision, Writing – original draft, Writing – review & editing. AB: Conceptualization, Funding acquisition, Investigation, Methodology, Project administration, Writing – review & editing, Resources. NB: Conceptualization, Data curation, Formal analysis, Funding acquisition, Investigation, Methodology, Project administration, Writing – review & editing. TC: Conceptualization, Funding acquisition, Investigation, Methodology, Project administration, Resources, Supervision, Writing – review & editing. SC: Conceptualization, Funding acquisition, Investigation, Methodology, Project administration, Resources, Writing – review & editing. LD: Investigation, Project administration, Resources, Writing – review & editing. CL: Conceptualization, Funding acquisition, Investigation, Methodology, Resources, Writing – review & editing. VP: Methodology, Project administration, Resources, Writing – review & editing, Conceptualization, Funding acquisition, Investigation. PP: Conceptualization, Data curation, Investigation, Methodology, Writing – review & editing. RR: Data curation, Investigation, Methodology, Writing – review & editing. NT: Conceptualization, Data curation, Funding acquisition, Investigation, Methodology, Project administration, Resources, Writing – review & editing. LP: Formal analysis, Investigation, Methodology, Project administration, Resources, Supervision, Writing – review & editing. JJ: Conceptualization, Funding acquisition, Investigation, Methodology, Project administration, Resources, Supervision, Writing – review & editing.
Funding
The author(s) declare that financial support was received for the research and/or publication of this article. This project was funded by USDA-NIFA Sustainable Agricultural Systems Coordinated Agricultural Projects (SAS CAP) grant # 2020-68012-31934.
Acknowledgments
We thank the large collaborative team of the Kernza CAP project. Specifically we thank CAP project manager Josh Keisemer-Cook and previous project manager Tara Ritter, data manager Dr. Craig See, site lab managers Katherine Bohn (UMN), Leah Hallett (UMN), Madeline DuBois (TLI), and Ben Robinson (OSU), representing researcher and technician teams at each of the 6 site locations.
Conflict of interest
The authors declare that the research was conducted in the absence of any commercial or financial relationships that could be construed as a potential conflict of interest.
Generative AI statement
The author(s) declare that no Generative AI was used in the creation of this manuscript.
Correction note
This article has been corrected with minor changes. These changes do not impact the scientific content of the article.
Publisher’s note
All claims expressed in this article are solely those of the authors and do not necessarily represent those of their affiliated organizations, or those of the publisher, the editors and the reviewers. Any product that may be evaluated in this article, or claim that may be made by its manufacturer, is not guaranteed or endorsed by the publisher.
Supplementary material
The Supplementary Material for this article can be found online at: https://www.frontiersin.org/articles/10.3389/fagro.2025.1528534/full#supplementary-material
References
Andrade F. H., Vega C., Uhart S., Cirilo A., Cantarero M., and Valentinuz O. (1999). Kernel number determination in maize. Crop Sci. 39, 453–459. doi: 10.2135/cropsci1999.0011183X0039000200026x
Angers D. A., Bullock M. S., and Mehuys G. R. (2008). “Aggregate Stability to Water,” in Soil Sampling and Methods of Analysis, 2nd Edition, vol. 62 . Eds. Carter M. R. and Gregorich E. G. (CRC Press Taylor & Francis, Boca Raton, FL, USA).
Assefa Y., Prasad P. V., Foster C., Wright Y., Young S., Bradley P., et al. (2018). Major management factors determining spring and winter canola yield in North America. Crop Sci. 58, 1–16. doi: 10.2135/cropsci2017.02.0079
Bajgain P., Crain J. L., Cattani D. J., Larson S. R., Altendorf K. R., Anderson J. A., et al. (2022). “Breeding Intermediate Wheatgrass for Grain Production,” in Plant Breeding Reviews. Ed. Goldman I. doi: 10.1002/9781119874157.ch3
Bajgain P., Zhang X., Jungers J. M., DeHaan L. R., Heim B., Sheaffer C. C., et al. (2020). ‘MN-Clearwater’, the first food-grade intermediate wheatgrass (Kernza perennial grain) cultivar. J. Plant Regist. 14, 288–297. doi: 10.1002/plr2.20042
Barriball S., Han A., and Schlautman B. (2022). Effect of growing degree days, day of the year, and cropping systems on reproductive development of Kernza in Kansas. Agrosys. Geosci. Environ. 5, e20286. doi: 10.1002/agg2.20286
Barton K. A. (2013). MuMIn: multi-model inference. R package version 1.9.13. Available online at: https://cran.r-project.org/web/packages/MuMIn/index.html (Accessed May 21, 2025)
Bastiaanssen W. G. M., Pelgrum H., Droogers P., de Bruin H. A. R., and Menenti M. (1997). Area-average estimates of evaporation, wetness indicators and top soil moisture during two golden days in EFEDA. Agric. For. Meteorol. 87, 119–137. doi: 10.1016/s0168-1923(97)00020-8
Bates D., Maechler M., Bolker B., and Walker S. (2015). Fitting linear mixed-effects models using lme4. J. Stat. Softw. 67, 1–48. doi: 10.18637/jss.v067.i01
Bianchin Rebesquini R. (2023). Optimizing Crop Productivity and Fertility Practices in Intermediate Wheatgrass. (Master's thesis, University of Nebraska-Lincoln). Available online at: https://digitalcommons.unl.edu/agronhortdiss/254/
Bowden J. H. (2023). Organically managed intermediate wheatgrass (Thinopyrum intermedium) as a dual-use grain and forage crop. Master thesis. Minneapolis, MN, USA: University of Minnesota Press. Available at: https://www.proquest.com/openview/fbe25fd8dc3a64a3ed62f483e036aa80/1?pq-origsite=gscholar&cbl=18750&diss=y (Accessed January 1, 2025).
Brown J. R. (1998). Recommended chemical soil test procedures for the North Central Region (No. 1001) (Missouri Agricultural Experiment Station, University of Missouri-Columbia). Available online at: https://extension.missouri.edu/media/wysiwyg/Extensiondata/Pub/pdf/specialb/sb1001.pdf (Accessed May 21, 2025).
Carrera C. S., Savin R., and Slafer G. A. (2024). Critical period for yield determination across grain crops. Trends Plant Sci. 29, 329–342. doi: 10.1016/j.tplants.2023.08.012
Carter M. R. and Gregorich E. G. (2008). Chapter 55 Particle Size Distribution. In Carter M. R. and Gregorich E. G. (Eds.), Soil Sampling and Method of Analysis. 2nd ed. (Roca Baton, FL, USA: Canadian Society of Soil Science, CRC Press and Taylor & Francis Group), pp. 720–722.
Cattani D. J. and Asselin S. R. (2017). Extending the growing season: forage seed production and perennial grains. Can. J. Plant Sci. 98, 235–246. doi: 10.1139/cjps-2017-0212
Chamberlain L. A., Aguayo T., Zerega N. J., Dybzinski R., and Egerton-Warburton L. M. (2022). Rapid improvement in soil health following the conversion of abandoned farm fields to annual or perennial agroecosystems. Front. Sustain. Food Syst. 6. doi: 10.3389/fsufs.2022.1010298
Clément C., Sleiderink J., Svane S. F., Smith A. G., Diamantopoulos E., Desbroll D. B., et al. (2022). Comparing the deep root growth and water uptake of intermediate wheatgrass (Kernza®) to alfalfa. Plant Soil 472, 369–390. doi: 10.1007/s11104-021-05248-6
Cox T. S., Bender M. H., Picone C., Van Tassel D. L., Holland J. H., Brummer E. C., et al. (2002). Breeding perennial grain crops. Crit. Rev. Plant Sci. 21, 59–91. Available at: https://landinstitute.org/wp-content/uploads/2002/01/Cox-Bender-et-al-2002.pdf (Accessed May 21, 2025).
Crain J., Wagoner P., Larson S., and DeHaan L. (2024). Origin of current intermediate wheatgrass germplasm being developed for Kernza grain production. Genetic Resources and Crop Evolution. 71, 4963–4978. doi: 10.1007/s10722-024-01952-1
Crews T. E., Blesh J., Culman S. W., Hayes R. C., Jensen E. S., Mack M. C., et al. (2016). Going where no grains have gone before: From early to mid-succession. Agricult. Ecosys. Environ. 223, 223–238. doi: 10.1016/j.agee.2016.03.012
Crews T., Carton W., and Olsson L. (2018). Is the future of agriculture perennial? Imperatives and opportunities to reinvent agriculture by shifting from annual monocultures to perennial polycultures. Global Sustain. 1, E11. doi: 10.1017/sus.2018.11
Crews T. E., Kemp L., Bowden J. H., and Murrell E. G. (2022). How the nitrogen economy of a perennial cereal-legume intercrop affects productivity: can synchrony be achieved? Front. Sustain. Food Syst. 6. doi: 10.3389/fsufs.2022.755548
Crews T. and Rumsey B. (2018). Erratum: crews, T.E.; Rumsey, B.E. What agriculture can learn from native ecosystems in building soil organic matter: A review. Sustainability 9, 578. doi: 10.3390/su10040915
Culman S. W., Fulford A. M., Camberato J. J., and Steinke K. (2020). Tri-state fertilizer recommendations for corn, soybean, wheat, and alfalfa (Columbus, OH, USA: The Ohio State University Press). Available online at: https://extensionpubs.osu.edu/tri-state-fertilizer-recommendationsfor-corn-soybean-wheat-and-alfalfa-pdf/ (Accessed May 21, 2025).
Culman S., Pinto P., Pugliese J., Crews T., DeHaan L., Jungers J., et al. (2023). Forage harvest management impacts “Kernza” intermediate wheatgrass productivity across North America. Agron. J. 115, 2424–2438. doi: 10.1002/agj2.21402
Culman S. W., Snapp S. S., Ollenburger M., Basso B., and DeHaan L. R. (2013). Soil and water quality rapidly responds to the perennial grain Kernza wheatgrass. Agron. J. 105, 735–744. doi: 10.2134/agronj2012.0273
Cureton C., Peters T. E., Skelly S., Carlson C., Conway T., Tautges N., et al. (2023). “Towards a practical theory for commercializing novel continuous living cover crops: a conceptual review through the lens of Kernza perennial grain 2019–2022. Continuous Living Cover: Adaptive Strategies for Putting Regenerative Agriculture into Practice. Frontiers in Sustainable Food Systems, 280. doi: 10.3389/fsufs.2023.1014934
DeHaan L., Christians M., Crain J., and Poland J. (2018). Development and evolution of an intermediate wheatgrass domestication program. Sustainability 10, 1499. doi: 10.3390/su10051499
DeHaan L., Olivier Duchene O., Franco J. G., Gutknecht J., Jungers J. M., Peters T. E., et al (2025). From concept to crop: Kernza perennial grain is a work in progress. Adv. Agron. in press.
DeHaan L., Van Tassel D., and Cox T. (2005). Perennial grain crops: A synthesis of ecology and plant breeding. Renewable Agric. Food Syst. 20, 5–14. doi: 10.1079/RAF200496
DeHaan L. R., Wang S., Larson S., Kantarski T., Zhang X., and Cattani D. (2014). Current efforts to develop perennial wheat and domesticate Thinopyrum intermedium as a perennial grain. In: Perennial crops for food security: Proceedings of the FAO expert workshop. Batello C., et al editors. (Oakland, CA, USA: University of California Press), 72–89. doi: 10.1525/elementa.310
de Oliveira G., Brunsell N. A., Crews T. E., DeHaan L. R., and Vico G. (2020). Carbon and water relations in perennial Kernza (Thinopyrum intermedium): An overview. Plant Sci. 295, 110279. doi: 10.1016/j.plantsci.2019.110279
de Oliveira G., Brunsell N. A., Sutherlin C. E., Crews T. E., and DeHaan L. R. (2018). Energy, water and carbon exchange over a perennial Kernza wheatgrass crop. Agric. For. Meteorol. 249, 120–137. doi: 10.1016/j.agrformet.2017.11.022
Doane T. A. and Horwath W. R. (2003). Spectrophotometric determination of nitrate with a single reagent. Anal. Lett. 36, 2713–2722. doi: 10.1081/AL-120024647
Dobbratz M., Jungers J. M., and Gutknecht J. L. M. (2023). Seasonal Plant Nitrogen Use and Soil N pools in Intermediate Wheatgrass (Thinopyrum intermedium). Agriculture 13, 468. doi: 10.3390/agriculture13020468
Fagnant L., Duchene O., Celette F., and Dumont B. (2024). Maintaining grain yield of Th. intermedium across stand age through constant spike fertility and spike density: Understanding its response to various agronomic managements. Eur. J. Agron. 152, 127038. doi: 10.1016/j.eja.2023.127038
FAO, Food and Agriculture Organization (2022). World Food and Agriculture – Statistical Yearbook 2022 (Rome). doi: 10.4060/cc2211en
FAO, Food and Agriculture Organization (2023). “Processed by Our World in Data. “Rye” [dataset],” in Production: Crops and livestock products (Rome, Italy: Food and Agriculture Organization of the United Nations Press). Available at: https://ourworldindata.org/land-useall-charts (Accessed May 21, 2025.
Fernandez C. W., Ehlke N., Sheaffer C. C., and Jungers J. M. (2020). Effects of nitrogen fertilization and planting density on intermediate wheatgrass yield. Agron. J. 112, 4159–4170. doi: 10.1002/agj2.20351
Fischer R. A. (1985). Number of kernels in wheat crops and the influence of solar radiation and temperature. J. Agric. Sci. 105, 447–461. doi: 10.1017/S0021859600056495
Fox J. and Weisberg S. (2019). An R Companion to Applied Regression. 3rd ed. (Thousand Oaks CA, USA: Sage Publishing) 472.
Frahm C. S., Tautges N. E., Jungers J. M., Ehlke N. J., Wyse D. L., and Sheaffer C. C. (2018). Responses of intermediate wheatgrass to plant growth regulators and nitrogen fertilizer. Agron. J. 110, 1028–1035. doi: 10.2134/agronj2017.11.0635
Glover J. D., Culman S. W., DuPont S. T., Broussard W. P., Young L. K., Mangan M. E., et al. (2010). Harvested perennial grasslands provide ecological benchmarks for agricultural sustainability. Agricult. Ecosys. Environ. 137, 3–12. doi: 10.1016/j.agee.2009.11.001
Google Earth. (2025). Base image of the Midwestern United States [Satellite imagery, modified by author]. Google. https://earth.google.com (Accessed May 21, 2025).
Hayes R., Wang S., Newell M., Turner K., Larsen J., Gazza L., et al. (2018). The Performance of Early-Generation Perennial Winter Cereals at 21 Sites across Four Continents. Sustainability 10, 1124. doi: 10.3390/su10041124
Hersbach H., Bell B., Berrisford B., Hirahara S., Horányi A., Muñoz-Sabater J., et al. (2020). The ERA5 global reanalysis. Q. J. R. Meteorol. Soc. 146, 1999–2049. doi: 10.1002/qj.3803
IPBES (2019). Summary for policymakers of the global assessment report on biodiversity and ecosystem services of the Intergovernmental Science-Policy Platform on Biodiversity and Ecosystem Services. Eds. Díaz S., Settele J., Brondízio E. S., Ngo H. T., Guèze M., Agard J., et al. (Bonn, Germany: IPBES secretariat), 56. Available at: https://files.ipbes.net/ipbes-web-prod-public-files/inline/files/ipbes_global_assessment_report_summary_for_policymakers.pdf (Accessed May 21, 2025).
Irigoin J. (2011). Sistemas de evaluación de tierras y elaboración de modelos de aptitud de uso agrícola, para distintos escenarios climáticos, en un sector de la subregión pampa arenosa (Provincia de Buenos Aires, Argentina). Master disertation, University Of Buenos Aires, Buenos Aires, Argentina. Faculty Agron. Escuela para Graduados. Available at: http://ri.agro.uba.ar/greenstone3/library/collection/tesis/document/2011irigoinjulieta.
Jungers J. M., DeHaan L. R., Betts K. J., Sheaffer C. C., and Wyse D. L. (2017). Intermediate wheatgrass grain and forage yield responses to nitrogen fertilization. Agron. J. 109, 462–472. doi: 10.2134/agronj2016.07.0438
Jungers J. M., Frahm C. S., Tautges N. E., Ehlke N. J., Wells M. S., Wyse D. L., et al. (2018). Growth, development, and biomass partitioning of the perennial grain crop Thinopyrum intermedium. Ann. Appl. Biol. 172, 346–354. doi: 10.1111/aab.12425
Jungers J.M., Schiffner S., Sheaffer C., Ehlke N.J., DeHaan L., Torrion J., et al. (2022). Effects of seeding date on grain and biomass yield of intermediate wheatgrass. Agronomy Journal 114 (4), 2342–2351.
Kottek M., Grieser J., Beck C., Rudolf B., and Rubel F. (2007). World map of the Köppen-Geiger climate classification updated. Hydrology and Earth System Sciences 11, 1633–1644. doi: 10.5194/hess-11-1633-2007
Lal R. (2015). Sequestering carbon and increasing productivity by conservation agriculture. J. Soil Water Conserv. 70, 55A–62A. doi: 10.2489/jswc.70.3.55A
Lenth R. (2024). Emmeans: Estimated Marginal Means, aka Least-Squares Means. R package version 1.10.1. Available online at: https://CRAN.R-project.org/package=emmeans (Accessed May 21, 2025).
Locatelli A., Gutierrez L., and Picasso Risso V. D. (2022). Vernalization requirements of Kernza intermediate wheatgrass. Crop Sci. 62, 524–535. doi: 10.1002/csc2.20667
Logan K. E., Brunsell N. A., Jones A. R., and Feddema J. J. (2010). Assessing spatiotemporal variability of drought in the U.S. central plains. J. Arid Environ. 74, 247–255. doi: 10.1016/j.jaridenv.2009.08.008
Mårtensson L. M. D., Barreiro A., Li S., and Jensen E. S. (2022). Agronomic performance, nitrogen acquisition and water-use efficiency of the perennial grain crop Thinopyrum intermedium in a monoculture and intercropped with alfalfa in Scandinavia. Agron. Sustain. Dev. 42, 21. doi: 10.1007/s13593-022-00752-0
Marvel K., Su W., Delgado R., Aarons S., Chatterjee A., Garcia M. E., et al. (2023). Ch. 2. Climate trends. In: Fifth National Climate Assessment. Eds. Crimmins A. R., Avery C. W., Easterling D. R., Kunkel K. E., Stewart B. C., and Maycock T. K. (Washington, DC, USA: U.S. Global Change Research Program). doi: 10.7930/NCA5.2023.CH2
Massobrio M. J., Irigoin J., and Cassani M. T. (2023). “Evaluación de Tierras,” in Degradación de tierras con énfasis e la región Pampeana: aportes para una gestión racional del uso agropecuario. Editorial Facultad de Agronomía. Ed. Chagas C. (CABA, Argentina), 516.
McKenna T. P., Crews T. E., Kemp L., and Sikes B. A. (2020). Community structure of soil fungi in a novel perennial crop monoculture, annual agriculture, and native prairie reconstruction. PloS One 15, e0228202. doi: 10.1371/journal.pone.0228202
Means M., Crews T., and Souza L. (2022). Annual and perennial crop composition impacts on soil carbon and nitrogen dynamics at two different depths. Renewable Agric. Food Syst. 37, 437–444. doi: 10.1017/S1742170522000084
Muhandiram N. (2023). Short-term dynamics of soil chemical and health properties under an intermediate wheatgrass (Thinopyrum intermedium) forage-grain system. Masters Thesis, University of Manitoba, Canada. Available at: http://hdl.handle.net/1993/37092 (Accessed May 21, 2025).
National Oceanic and Atmospheric Administration (NOAA). (2023). Centers for Environmental Information, Climate Data Online. Available online at: https://www.ncei.noaa.gov/cdo-web/ (Accessed May 21, 2025).
Natural Resources Conservation Service (NRCS). (2021). Perennial grain crop conservation rotation (E328O) (USDA, United States Department of Agriculture). Available at: https://www.nrcs.usda.gov/programs-initiatives/csp-conservation-stewardship-program/perennial-grain-crop-conservation.
Natural Resources Conservation Service (NRCS). (2022). User Guide for the National Commodity Crop Productivity Index (NCCPI) v.3.0 (USDA, United States Department of Agriculture). Available at: https://www.nrcs.usda.gov/sites/default/files/2023-01/NCCPI-User-Guide.pdf (Accessed May 21, 2025).
Ohio State University OSU. (2013). CFAES Weather System. Available online at: https://weather.cfaes.osu.edu/ (Accessed November 21, 2024).
Pimentel D., Cerasale D., Stanley R. C., Perlman R., Newman E. M., Brent L. C., et al. (2012). Annual vs. perennial grain production. Agricult. Ecosys. Environ. 161, 1–9. doi: 10.1016/j.agee.2012.05.025
Pinto P., Cartoni-Casamitjana S., Cureton C., Stevens A. W., Stoltenberg D. E., Zimbric J., et al. (2022). Intercropping legumes and intermediate wheatgrass increases forage yield, nutritive value, and profitability without reducing grain yields. Front. Sustain. Food Syst. Sec. 6. doi: 10.3389/fsufs.2022.977841
Pinto P., Cartoni-Casamitjana S., Stoltenberg D. E., and Picasso V. D. (2024). Forage boost or grain blues? Legume choices shape Kernza intermediate wheatgrass dual-purpose crop performance. Field Crops Res. 316, 109522. doi: 10.1016/j.fcr.2024.109522
Pinto P., De Haan L., and Picasso V. (2021). Post-harvest management practices impact on light penetration and kernza intermediate wheatgrass yield components. Agronomy 11, 442. doi: 10.3390/agronomy11030442
Pugliese J. Y. (2017). Above-and belowground response to managing Kernza (Thinopyrum intermedium) as a dual-use crop for forage and grain. Columbus, OH, USA: The Ohio State University Press. Available online at: http://rave.ohiolink.edu/etdc/view?acc_num=osu1494000853982965 (Accessed May 21, 2025).
Pugliese J. Y., Culman S. W., and Sprunger C. D. (2019). Harvesting forage of the perennial grain crop Kernza (Thinopyrum Intermedium) increases root biomass and soil nitrogen. Plant Soil 437, 241–254. doi: 10.1007/s11104-019-03974-6
Rakkar M., Jungers J. M., Sheaffer C., Bergquist G., Grossman J., Li F., et al. (2023). Soil health improvements from using a novel perennial grain during the transition to organic production. Agricult. Ecosys. Environ. 341, 108164. doi: 10.1016/j.agee.2022.108164
R Core Team (2021). R: A language and environment for statistical computing (Vienna, Austria: R Foundation for Statistical Computing). Available at: https://www.R-project.org/ (Accessed May 21, 2025).
Reilly E. C., Gutknecht J. L., Sheaffer C. C., and Jungers J. M. (2022a). Reductions in soil water nitrate beneath a perennial grain crop compared to an annual crop rotation on sandy soil. Front. Sustain. Food Syst. 6. doi: 10.3389/fsufs.2022.996586
Reilly E. C., Gutknecht J. L., Tautges N. E., Sheaffer C. C., and Jungers J. M. (2022b). Nitrogen transfer and yield effects of legumes intercropped with the perennial grain crop intermediate wheatgrass. Field Crops Res. 286, 108627. doi: 10.1016/j.fcr.2022.108627
Ryan M. R., Crews T. E., Culman S. W., DeHaan L. R., Hayes R. C., Jungers J. M., et al. (2018). Managing for multifunctionality in perennial grain crops. BioScience 68, 294–304. doi: 10.1093/biosci/biy014
Schipanski M. E., MacDonald G. K., Rosenzweig S., Jahi Chappell M., Bennett E. M., Bezner Kerr R., et al. (2016). Realizing resilient food systems. BioScience 66, 600–610. doi: 10.1093/biosci/biw052
Shoenberger E. (2022). Agronomic practices to manage competition in dual-use Kernza intermediate wheatgrass (Thinopyrum intermedium) to sustain grain yield over time. Madison, WI, USA: University of Wisconsin-Madison. Available at: https://agroecology.wisc.edu/wp-content/uploads/sites/75/2023/08/Shoenberger_MS_Thesis-reduced.pdf (Accessed May 21, 2025).
Sinsabaugh R. L., Reynolds H., and Long T. M. (2000). Rapid assay for amidohydrolase (urease) activity in environmental samples. Soil Biol. Biochem. 32, 2095–2097. doi: 10.1016/S0038-0717(00)00102-4
Slafer G. A. and Andrade F. H. (1993). Physiological attributes related to the generation of grain yields in bread wheat cultivars released at different eras. Field Crops Res. 31, 351–367. doi: 10.1016/0378-4290(93)90073-V
Smith P. (2014). Do grasslands act as a perpetual sink for carbon? Global Change Biol. 20, 2708–2711. doi: 10.1111/gcb.12561
Soil Survey Staff, Natural Resources Conservation Service, United States Department of Agriculture, and Web Soil Survey (2023). Available online at: http://websoilsurvey.nrcs.usda.gov/ (Accessed August 01 2023).
Sprunger C. D., Culman S. W., Philip R. G., and Snapp S. S. (2018). Perennial grain on a Midwest Alfisol shows no sign of early soil carbon gain. Renewable Agric. Food Syst. 33, 360–372. doi: 10.1017/S1742170517000138
Tautges N., Detjens A., and Jungers J. M. (2023). Kernza Grower Guide. Available online at: https://kernza.org/wp-content/uploads/Grower-guide_final.pdf.
Tautges N. E., Jungers J. M., Dehaan L. R., Wyse D. L., and Sheaffer C. C. (2018). Maintaining grain yields of the perennial cereal intermediate wheatgrass in monoculture v. bi-culture with alfalfa in the Upper Midwestern USA. J. Agric. Sci. 156, 758–773. doi: 10.1017/S0021859618000680
Tsoraeva E., Bekmurzov A., Kozyrev S., Khoziev A., and Kozyrev A. (2020). Environmental issues of agriculture as a consequence of the intensification of the development of agricultural industry. E3S Web of Conferences. 215, 02003. doi: 10.1051/e3sconf/202021502003
USDA, Economic research Service (2024). Available online at: https://www.ers.usda.gov/topics/farm-practices-management/risk-management/crop-insurance-at-a-glance (Accessed May 21, 2025).
USPTO, United States Patent and Trademark Office (2009). Kernza, case 77649502. Available online at: https://tmsearch.uspto.gov/bin/ (Accessed May 21, 2025).
Vogel K. P., Reece P. E., and Nichols J. T. (1993). Genotype and genotype× environment interaction effects on forage yield and quality of intermediate wheatgrass in swards. Crop Science 33 (1), 37–41.
Vogel K. P., Brejda J. J., Walters D. T., and Buxton D. R. (2002). Switchgrass biomass production in the Midwest USA. Agron. J. 94, 413–420. doi: 10.2134/agronj2002.0413
Wagoner P. (1990). Perennial grain: new use for intermediate wheatgrass. J. Soil Water Conserv. 45 (1), 81–82. doi: 10.1080/00224561.1990.12456435
Wagoner P. and Schauer A. L. (1990). “Intermediate wheatgrass as a perennial grain crop,” in Advances in New Crops. Eds. Janick J. and Simon J. (Timber Press, Portland, OR).
Wickham H., François R., Henry L., and Müller K. (2021). dplyr: A Grammar of Data Manipulation (Version 1.0.7) [Software]. Available online at: https://CRAN.R-project.org/package=dplyr (Accessed May 21, 2025).
Wickham H. and Seidel D. (2020). scales: Scale Functions for Visualization. R package version 1.1.1. Available online at: https://CRAN.R-project.org/package=scales (Accessed May 21, 2025).
Wilhelmi O. B. and Wilhite D. A. (2002). Assessing vulnerability to agricultural drought: A Nebraska case study. Natural Hazards 25, 37–58. doi: 10.1023/a:1013388814894
Wilhite D. A. and Glantz M. H. (1985). Understanding the drought phenomenon: the role of definitions. Water Int. 10, 111–120. doi: 10.1080/02508068508686328
Woeltjen S., Gutknecht J., and Jungers J. (2024). Age-related changes in root dynamics of a novel perennial grain crop. Grassland Res. 3, 57–58. doi: 10.1002/glr2.12068
Wuest S. B., Williams J. D., and Gollany H. T. (2006). Tillage and perennial grass effects on ponded infiltration for seven semi-arid loess soils. J. Soil Water Conserv. 61, 218–223. doi: 10.1080/00224561.2006.12435886
Yu Z., Lu C., Cao P., and Tian H. (2018). Long-term terrestrial carbon dynamics in the Midwestern United States during 1850-2015: Roles of land use and cover change and agricultural management. Global Change Biol. 24, 2673–2690. doi: 10.1111/gcb.14074
Zadoks J. C., Chang T. T., and Konzak C. F. (1974). A decimal code for the growth stages of cereals. Weed Res. 14, 415–421. doi: 10.1111/j.1365-3180.1974.tb01084.x
Zhang S., Huang G., Zhang Y., Lv X., Wan K., Liang J., et al. (2023). Sustained productivity and agronomic potential of perennial rice. Nat. Sustain. 6, 28–38. doi: 10.1038/s41893-022-00997-3
Zhang X., Sallam A., Gao L., Kantarski T., Poland J., DeHaan L. R., et al. (2016). Establishment and optimization of genomic selection to accelerate the domestication and improvement of intermediate wheatgrass. Plant Genome 9, 1–18. doi: 10.3835/plantgenome2015.07
Zhen X., Dobbratz M., Jungers J. M., and Sadok W. (2024). Is interannual grain yield decline of intermediate wheatgrass influenced by management and climate in the Upper Midwest? Agricult. Ecosys. Environ. 362, 108856. doi: 10.1016/j.agee.2023.108856
Keywords: perennial crop, Kernza®, soil characteristics, ecological intensification, nitrogen fertility, regional variance
Citation: Cassani MT, Gutknecht JL, Basche A, Brunsell NA, Crews TE, Culman S, Deiss L, Laboski CAM, Picasso V, Pinto P, Bianchin Rebesquini R, Tautges NE, Pol LKvd and Jungers JM (2025) Productivity of intermediate wheatgrass responds more to local soil and climate factors than fertility treatments in the first establishment year. Front. Agron. 7:1528534. doi: 10.3389/fagro.2025.1528534
Received: 15 November 2024; Accepted: 25 April 2025;
Published: 27 June 2025; Corrected: 02 July 2025.
Edited by:
Nasim Ahmad Yasin, University of the Punjab, PakistanReviewed by:
Zhenxing Zhou, Anyang Institute of Technology, ChinaFachrur Rozi, National Research and Innovation Agency (BRIN), Indonesia
Thi Thuy Phan, Tay Nguyen University, Vietnam
Copyright © 2025 Cassani, Gutknecht, Basche, Brunsell, Crews, Culman, Deiss, Laboski, Picasso, Pinto, Bianchin Rebesquini, Tautges, Pol and Jungers. This is an open-access article distributed under the terms of the Creative Commons Attribution License (CC BY). The use, distribution or reproduction in other forums is permitted, provided the original author(s) and the copyright owner(s) are credited and that the original publication in this journal is cited, in accordance with accepted academic practice. No use, distribution or reproduction is permitted which does not comply with these terms.
*Correspondence: Jessica L. Gutknecht, amd1dEB1bW4uZWR1
†ORCID: Nicole E. Tautges, orcid.org/0000-0003-1708-6966