 Abebe Getu Asfaw*
 Demsew Bekele Gelagil
 Getachew Yilma Abebe
 Wubayehu Gebremedhin WoldieTesema Minale Getahun
- Fogera National Rice Research and Training Center, Ethiopian Institute of Agricultural Research, Woreta, Ethiopia
Wheat (Triticum aestivumL.) is the third most important crop in Ethiopia yet its productivity in the country remains significantly below experimental yields and water-limited yield potential due to soil fertility variability and the absence of site-specific fertilizer recommendations. To identify yield-limiting nutrients and support the development of a precision fertilizer recommendation tool, a nutrient omission study was conducted in the 2021 main cropping season across eight sites in the South Gondar Zone of Northwestern Ethiopia. The study evaluated eight treatments: (1) NF (NPKSZnB), (2) -B, (3) -Zn, (4) -S, (5) -K, (6) -P, (7) -N, and (8) F0, with nutrients applied at 138 kg N, 46 kg P2O5, 60 kg K2O, 10.5 kg S, 5 kg Zn, and 1 kg B ha-1. Results indicated that N omission significantly reduced wheat yield and yield-related traits across all sites, while P limitation was significant in 50% of the locations. The average yield response to N application was 2071.9 kg ha-1 (ranging from 847.2 to 2873.6 kg ha-1), followed by P, with a mean response of 499.1 kg ha-1 (16.6–850.8 kg ha-1). Soil indigenous nutrient supply (SINS) assessments revealed that N was only 45.0% sufficient, whereas P sufficiency was higher (87.0%). Potassium (K), sulfur (S), zinc (Zn), and boron (B) were found to be non-limiting, with soil supplies exceeding 90%. Yield gaps due to N and P omission averaged 53.9% and 11.9%, respectively, while omissions of K, S, Zn, and B had negligible effects. Agronomic efficiency was highest for P (22.2 kg kg-1), followed by N (13.1 kg kg-1) and K (5.2 kg kg-1). These findings demonstrate that N is the primary yield-limiting nutrient in the study area, with P being secondary in half of the evaluated farms. To enhance wheat productivity and minimize yield gaps, site-specific fertilizer recommendations emphasizing optimized N and P application are critical. The study was conducted for one season, and hence multi-year experiments to address season variation on the effect of the nutrient omission treatments is recommended.
1 Introduction
With an annual production of 5.78 million metric tons (Mt) cultivated across 1.9 million hectares, Ethiopia stands as Africa’s second-largest wheat (Triticum aestivum L.) producer after Egypt (FAOSTAT, 2020; CSA, 2022). As the nation’s third most economically significant cereal crop following teff (Eragrostis tef) and maize (Zea mays L.), wheat production engages approximately 4.9 million smallholder farmers, predominantly under rain-fed conditions, accounting for 12.2% of the country’s total harvested cropland (CSA, 2022). Recent agricultural intensification efforts, particularly government-sponsored irrigation schemes, have expanded cultivation to 2.6 million hectares with concomitant production increases to 8.2 Mt (Effa et al., 2023). Nevertheless, persistent yield limitations are evident, as current average productivity (3.05 t ha-1) represents just 61% of experimental yields (5.0 t ha-1) and a mere 36.3% of the estimated water-limited yield potential (8.4 t ha-1), underscoring substantial untapped production capacity within existing agroecological systems (Abdulkadir et al., 2016; www.yieldgap.org).
The persistent yield gap in Ethiopian wheat production systems necessitates a comprehensive understanding of its underlying drivers to inform targeted policy interventions and strategic investments. Current evidence identifies technological constraints as the primary limiting factors, particularly: (1) inadequate access to and inefficient use of mineral fertilizers, (2) limited availability of improved seed varieties, and (3) suboptimal pest and disease management practices (Yirga et al., 2002; Silva et al., 2021). These challenges are exacerbated by the predominant rain-fed production systems characterized by low-input use (Anteneh and Asrat, 2020), with national fertilizer application rates averaging just 40 kg ha-1 - among the lowest in Africa and substantially below recommended levels of 64 kg N and 20 kg P ha-1 (IFDC, 2015). Current fertilizer recommendation systems demonstrate significant limitations, being both spatially fragmented (Gorfu et al., 1991) and temporally inconsistent. These ‘blanket’ recommendations fail to account for substantial spatial and temporal variability in soil fertility (Stoorvogel et al., 1993; Tadesse et al., 2019; Sileshi et al., 2022) and differential access to nutrient resources among farms (Sanchez, 2002). Consequently, fertilizer application often results in either suboptimal or excessive use, leading to inconsistent yield responses (Erkossa et al., 2022; Abera et al., 2023). To address these limitations, the development of precision-based, site-specific fertilizer recommendations through advanced decision support tools (DSTs) is imperative. Nutrient omission trials (NOTs) serve as a critical methodological approach in this context, generating essential empirical data on soil nutrient dynamics. The present study was specifically designed to contribute to national efforts in precision agriculture by: (1) identifying key yield-limiting nutrients, (2) quantifying existing yield gaps, and (3) determining indigenous soil nutrient supply capacities. These objectives collectively aim to establish a robust foundation for the development of an optimized DST that can enhance wheat productivity through tailored nutrient management strategies.
2 Materials and methods
2.1 Study area description
The research was conducted during the 2021 main cropping season (June-September) across eight farmers’ fields distributed in seven kebeles (the smallest administrative units in Ethiopia) within Farta and Lay Gayint districts of South Gondar Zone, Amhara Region, northwestern Ethiopia (Figure 1, Table 1). The study area encompasses a topographically diverse landscape comprising highland plateaus (>3,000 m asl), deep valleys, and rolling hills with elevations ranging from approximately 2,300 to 3,200 meters above sea level (Tefera et al., 2019).
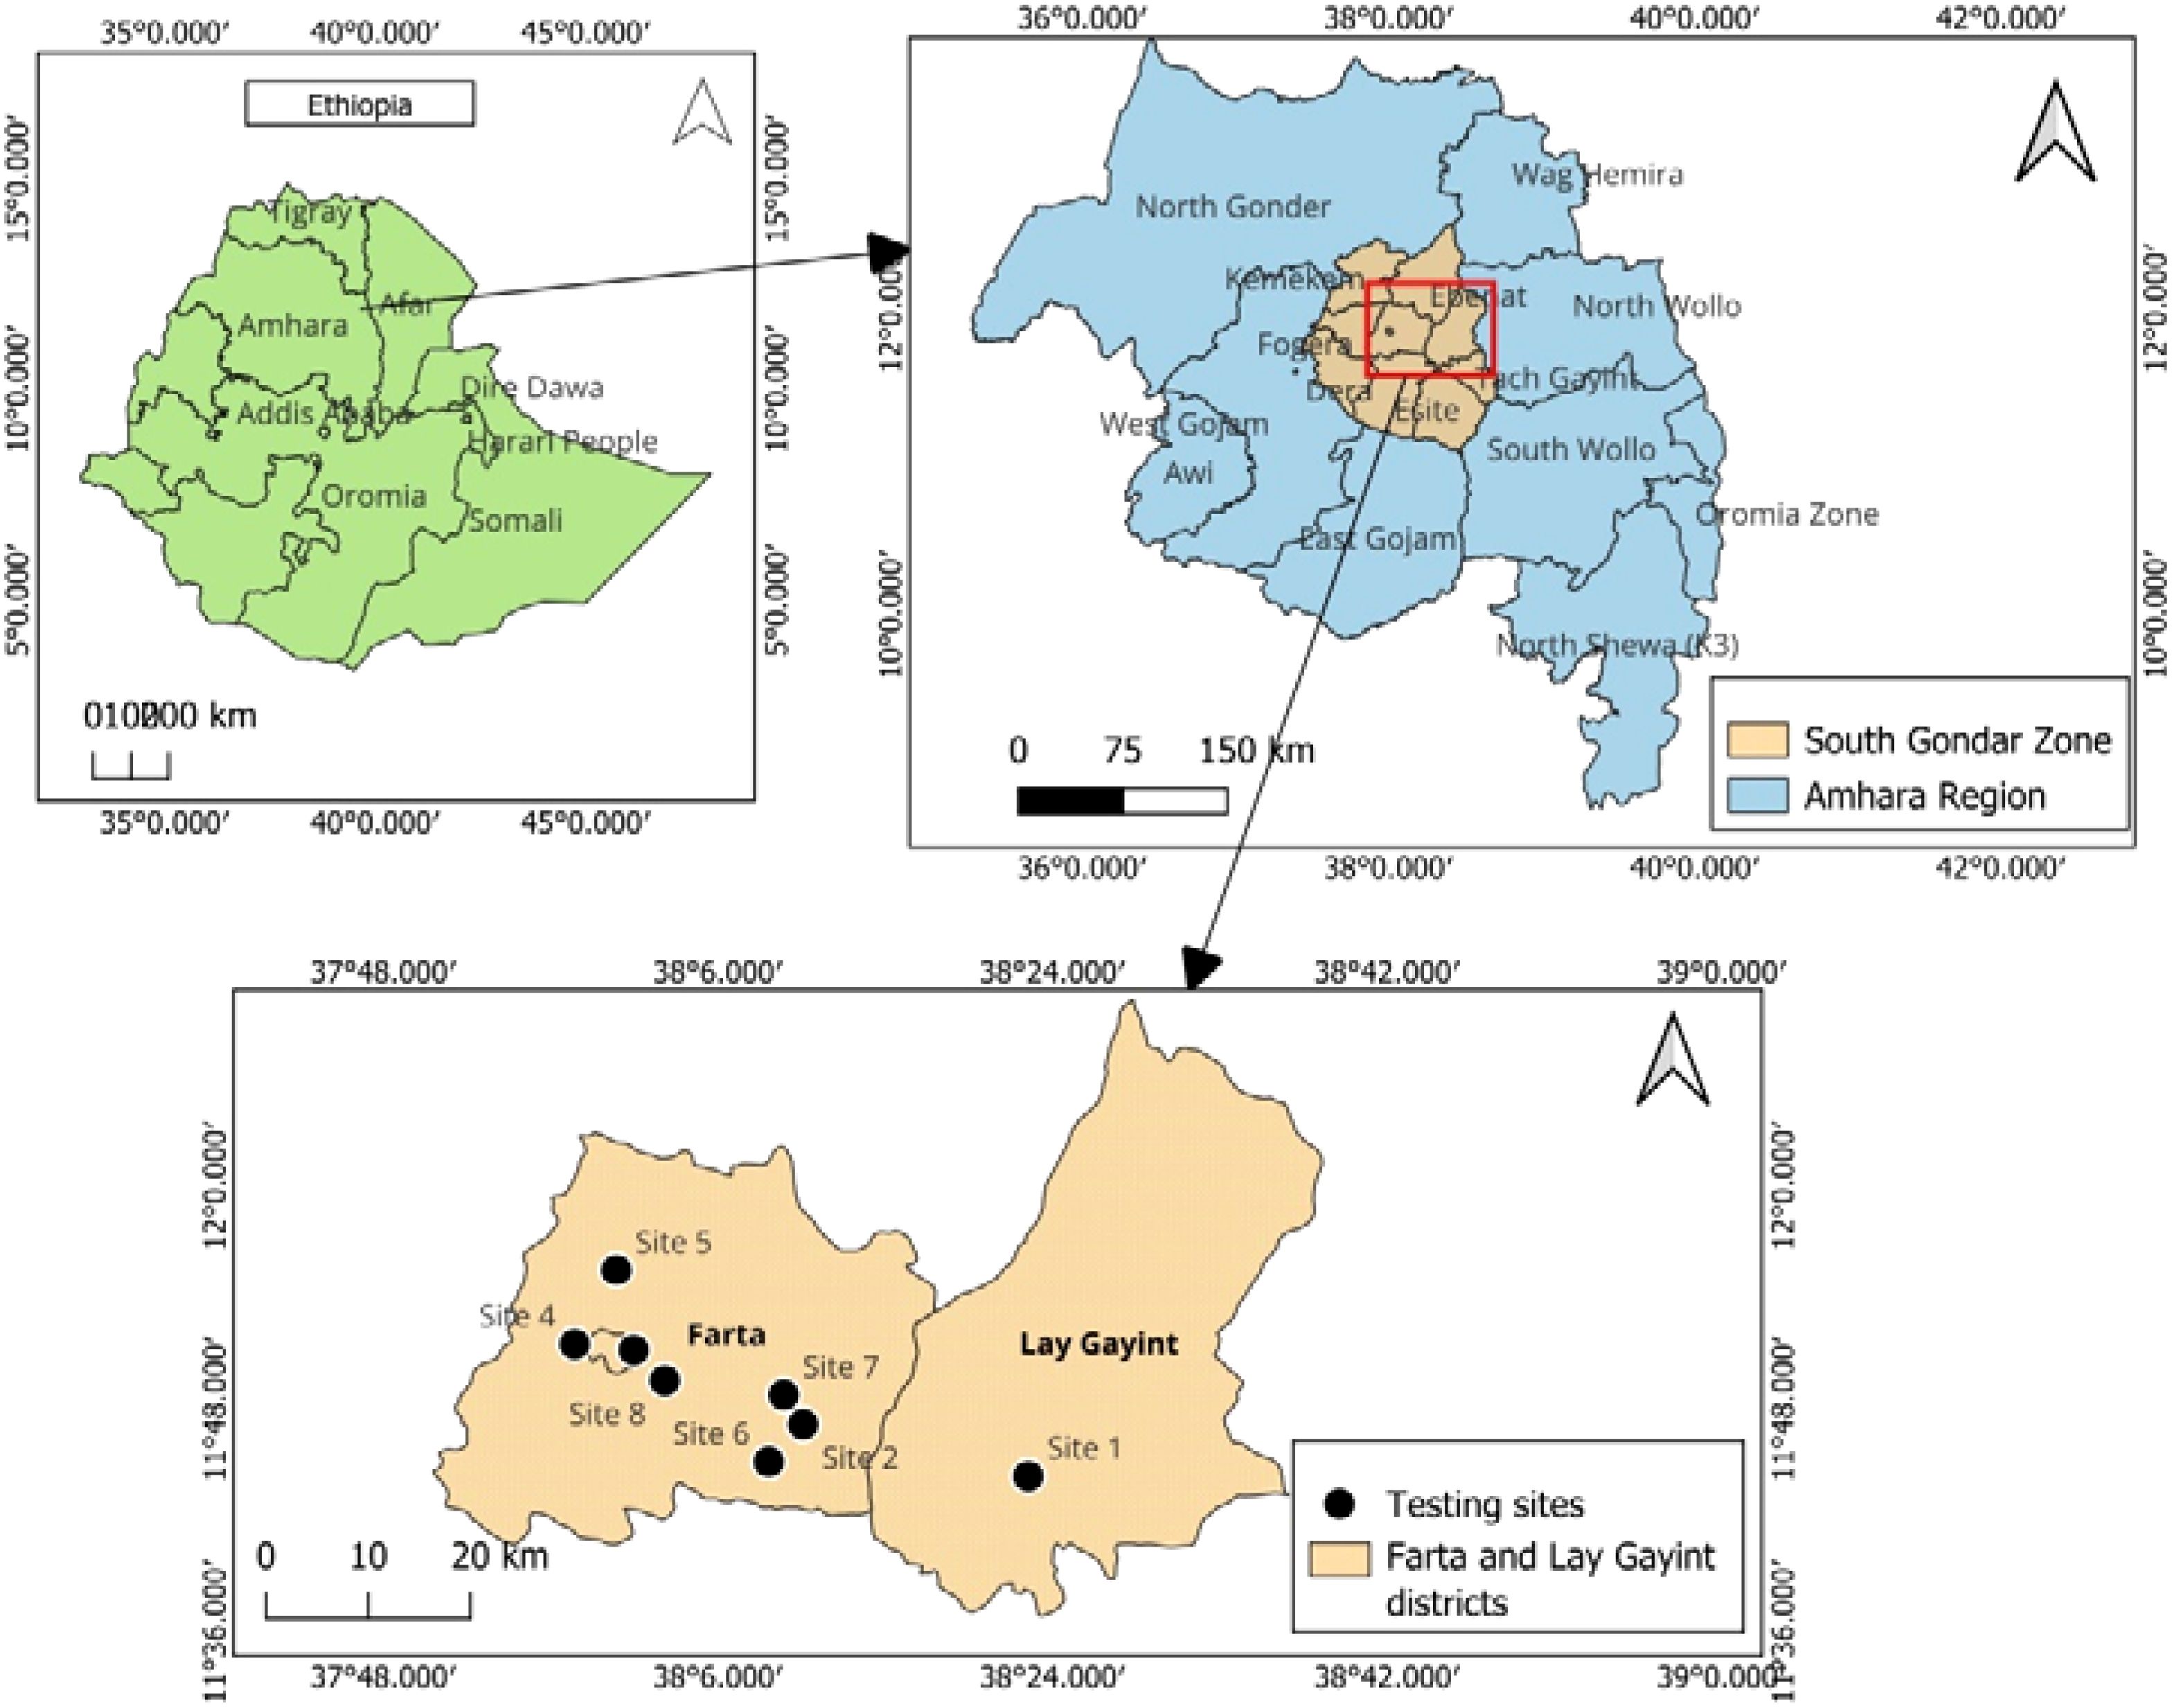
Figure 1. Location map of the study area and testing sites in the Farta and Lay Gayint districts of the Amhara Region in northwest Ethiopia. Source: Author (2024).
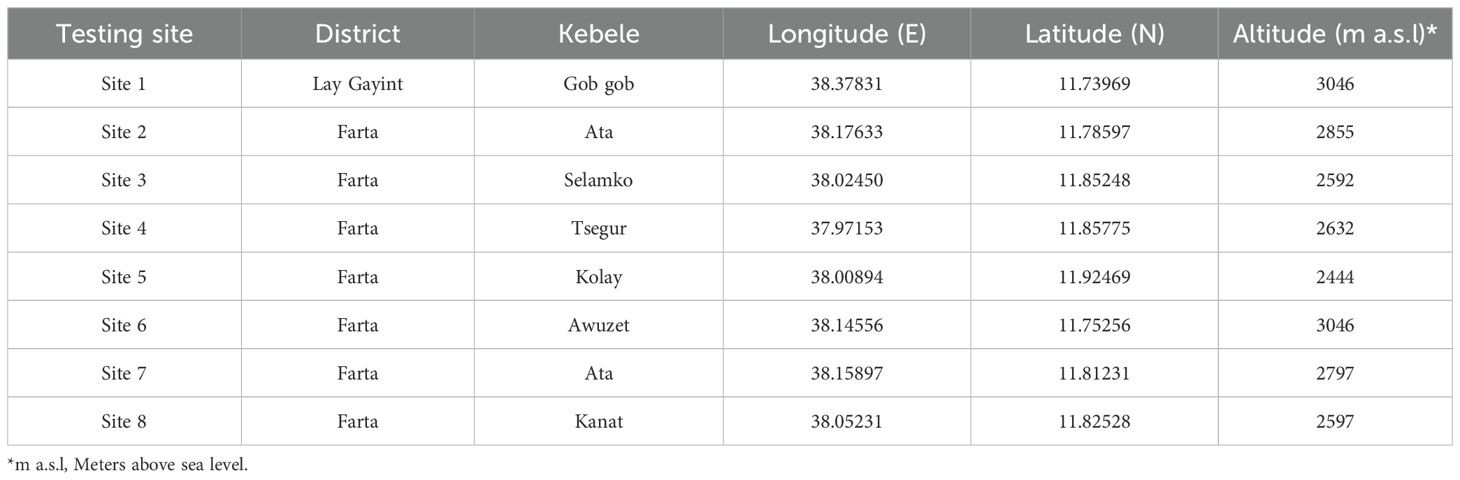
Table 1. Geographic location of experimental sites in Farta and Lay Gayint districts, showing GPS coordinates (latitude, longitude), and elevation.
Climatically, the region is classified as “Woyna Dega” (mid-altitude; 1,500-2,300 m asl) to “Dega” (high-altitude; 2,300-3,200 m asl) agroecological zones (Taye, 2017). Meteorological data obtained from the Ethiopian Meteorological Agency (Northwestern Region, Bahir Dar) indicate a mean annual precipitation range of 1,300-1,900 mm, with mean monthly temperatures varying between 9.4°C (minimum) and 23.1°C (maximum) (Figure 2). The soils in the study area are predominantly Leptosols, Luvisols and Cambisols (Abayneh, 2017, unpublished data; Beyene et al., 2023; Sisay et al., 2023, preprint). These soil types present distinct agronomic constraints and management requirements that influence local cropping patterns. The predominant cropping system features a cereal-legume rotation dominated by bread wheat (Triticum aestivum L.), barley (Hordeum vulgare L.), teff (Eragrostis tef L.), and maize (Zea mays L.), intercropped with or rotated with faba beans (Vicia faba L.) and field peas (Pisum sativum L.) (Alemayehu et al., 2019). This diversified cropping system operates within an integrated crop-livestock production framework, where smallholder farmers strategically combine agricultural and animal husbandry activities to optimize resource use efficiency, manage risk, and sustain household food security (Tadesse and Solomon, 2018).
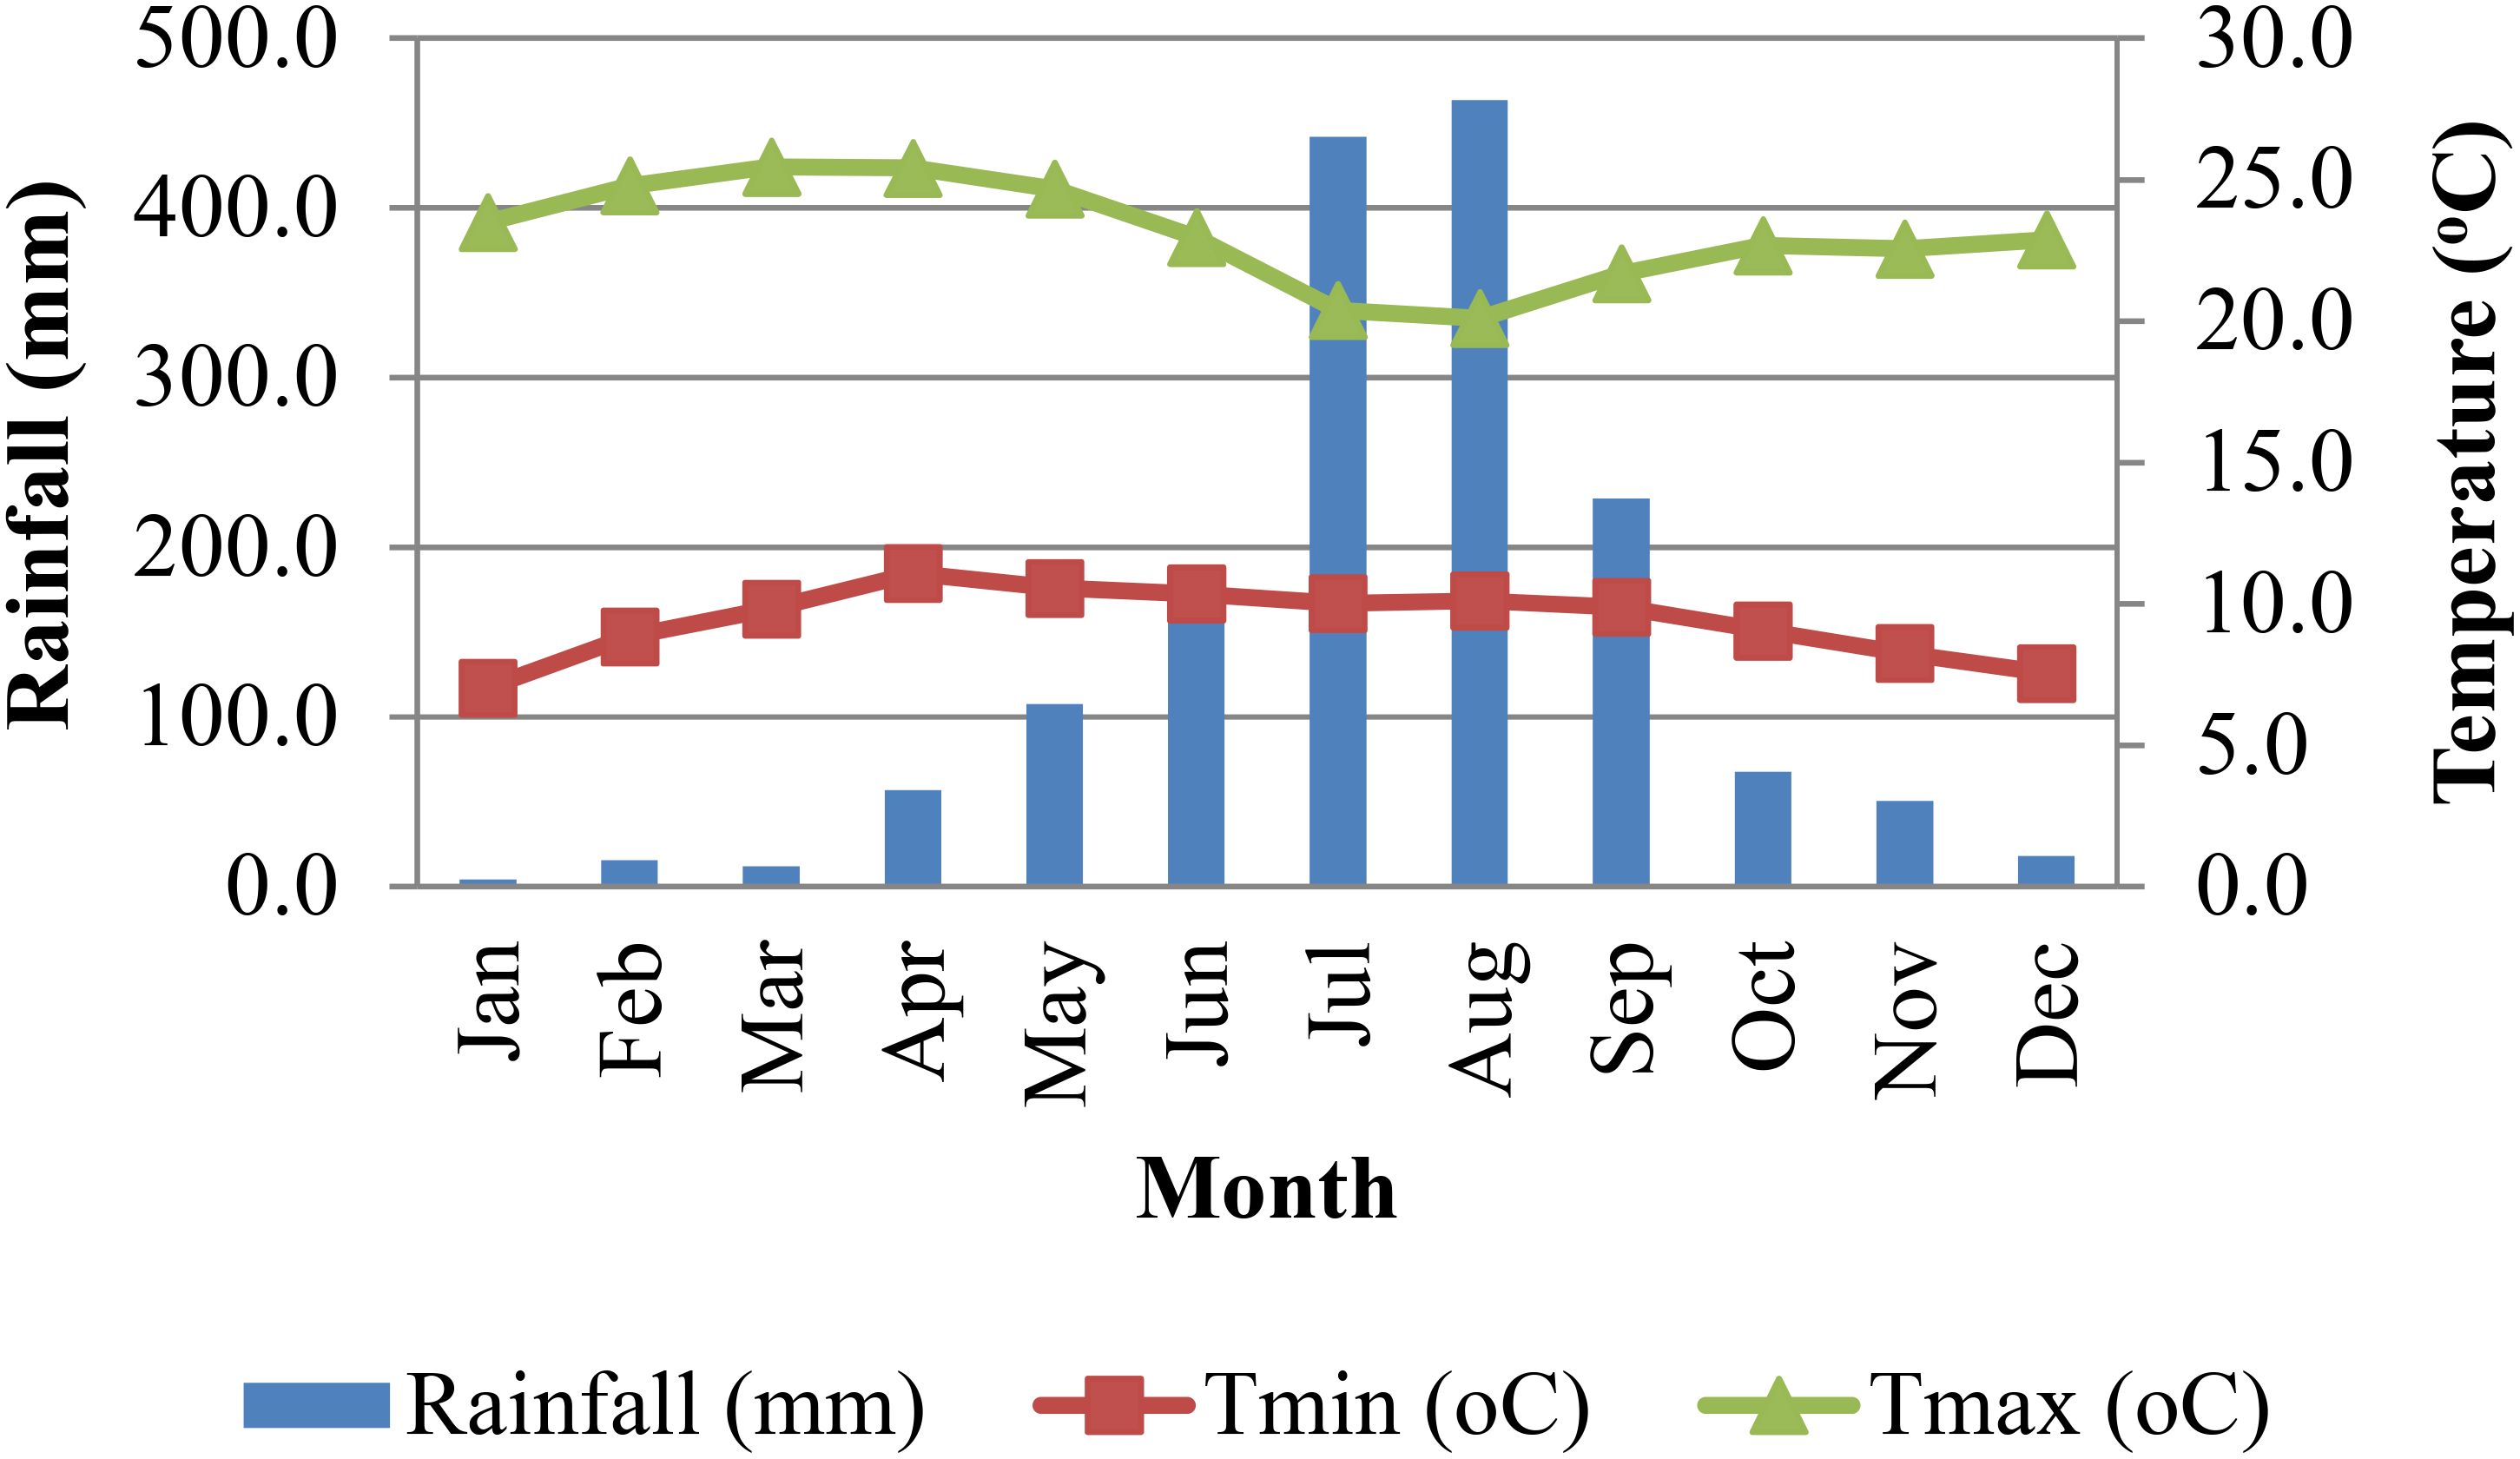
Figure 2. Climatic conditions of the study area showing (a) mean monthly rainfall (mm) and (b) mean daily minimum (Tmin) and maximum (Tmax) temperatures (°C) during the 2021 growing season. Data source: [Ethiopian Meteorological Agency, Northwest region, Bahir dar branch, 2024].
2.2 Experimental set up
The study employed a randomized complete block design (RCBD) with three replications to evaluate the full nutrient treatment (NPKSZnB) against various nutrient omission treatments (Table 2). The selection of nutrient types was based on a soil fertility map specific to the study area (EthioSIS, 2014). The nutrient rates were adapted from existing research recommendations for wheat in the study area and from regions with similar agro-ecological conditions. Individual experimental plots consisted of a gross area of 12 m² (4 m × 3 m) with a net harvestable area of 10.8 m² (3.6 m × 3.0 m), separated by 1 m buffer zones between plots and blocks. The widely cultivated bread wheat (Triticum aestivum L.) cultivar ‘Tay’ was selected for the study based on its regional adaptation and farmer preference. Seeds were drill-sown at a rate of 150 kg ha-1 with 20 cm inter-row spacing. Nutrient applications followed standardized protocols: phosphorus (P), potassium (K), sulfur (S), zinc (Zn), and boron (B) were applied in full as basal dressings at planting, while nitrogen (N) was split-applied (50% at planting and 50% side-dressed at 40 days after sowing).

Table 2. Nutrient application treatments and rates (kg ha-1) used in the wheat fertilization study, including: (i) Full fertilization (NF), (ii) individual nutrient omissions (-N, -P, -K, -S, -Zn, -B), and (iii) zero-fertilization control (F0).
All experimental plots received uniform agronomic management throughout the growing season to ensure consistency in cultivation practices and minimize confounding variables. Standardized protocols were implemented for land preparation, planting, weed control, and other crop management interventions. The following fertilizers were utilized as nutrient sources in the study: urea (CO(NH2)2) for N, triple superphosphate (Ca(H2PO4)2) for P, potassium chloride (KCl) for K, calcium sulfate (CaSO4) for S, zinc sulfate (ZnSO4·7H2O) for Zn, and borax (Na2B4O7·10H2O) for B.
2.3 Soil sampling and analysis
Prior to planting, representative composite soil samples were obtained from each experimental field by combining five spatially distributed subsamples collected from a 0–20 cm depth using a standardized soil auger. Following collection, samples were air-dried, ground mechanically, and sieved through a 2-mm mesh to ensure particle size uniformity. Soil analyses were conducted at Bahir Dar Design and Supervision Works Authority laboratory, following standard soil testing methods to determine selected soil chemical properties including: soil pH (1:2.5 soil: water suspension), total nitrogen (micro-Kjeldahl digestion), available phosphorus (Olsen extraction), exchangeable potassium (ammonium acetate extraction), available boron (hot water extraction), and DTPA-extractable zinc.
2.4 Data collection
All plant measurements were conducted using standardized protocols on the net plot area of 10.8 m² (3.6 m × 3.0 m), excluding border rows from both ends of each plot to eliminate edge effects. The following parameters were systematically recorded:
Plant height: was measured from soil surface to spike tip (excluding awns) for 10 randomly selected plants per plot using a graduated meter stick.
Spike length: was determined from spike base to tip (excluding awns) for 10 randomly sampled spikes per plot.
Seeds per spike: was calculated as the mean value from manual seed counts of 10 randomly selected spikes.
Aboveground biomass: Total sun-dried biomass from the harvest area was weighed using a suspension balance.
Grain yield: was measured using a precision balance (0.1 g accuracy) after threshing and adjusted to 12.5% moisture content.
Thousand seed weight: was determined by weighing 1000 randomly selected, disease-free seeds using an analytical balance, with moisture content similarly adjusted to 12.5%.
2.5 Statistical analysis and data interpretation
The experimental data were analyzed using one-way ANOVA in SAS version 9.2 (SAS/STAT Software, 2008) at a significance level of α = 0.05, with nutrient omission treatments as fixed effects. Assumptions of normality were verified using different normality test methods including Shapiro-Wilk test. Where ANOVA indicated significant differences (p < 0.05), treatment means were separated using Duncan’s Multiple Range Test (DMRT). Data are presented as treatment means ± standard error (SE) of three replicates (n = 3). Graphical outputs were generated in Microsoft Excel (version 2016).
2.5.1 Yield response
Yield response (YR) to a nutrient serves as a direct and practical indicator of inherent soil fertility. It quantifies the difference between the attainable yield (the yield obtained from non-nutrient limited yield i.e. the yield from full nutrient supplied treatment) and the yield from the nutrient omission plots. This metric reflects the extent to which crop productivity is constrained by the deficiency of a specific nutrient, while also providing insight into the indigenous soil nutrient supply (Dobermann et al., 2003; Xu et al., 2014).
The yield response for each nutrient was computed using Equation 1:
where YR stands for yield response to a nutrient in kg ha-1, YNF is the attainable yield, the grain yield (kg ha-1) from the full nutrient (NPKSZnB) supplied treatment and Yno is the grain yield (kg ha-1) from the nutrient omitted treatment.
2.5.2 Agronomic use efficiency of N, P and K
Agronomic use efficiency of N (AEN), P (AEP), and K (AEK) were calculated to quantify the yield increase per unit of applied nutrient, following the methodology established by Craswell and Godwin (1984) and Mengel and Kirkby (1996). These efficiency indices were determined using the following equations (Equations 2–4):
Where YNo, YPo, and YKo are the yield obtained from the N-omitted, P-omitted and K-omitted treatments, respectively and N, P, K are the amount of N, P, and K applied in kg ha-1 in the full nutrient-supplied treatment.
2.5.3 Yield gap
The yield gap, expressed as a percentage, was calculated to assess the production losses attributable to the omission of individual nutrients. The following formula (Equation 5) was used to calculate the yield gaps due to the omission of each nutrient:
2.5.4 The indigenous soil nutrient supply
The indigenous soil nutrient supply serves as a critical indicator of inherent soil fertility and provides a scientific basis for developing fertilizer recommendations. This parameter reflects the soil’s natural capacity to provide essential nutrients for crop growth. Following established methodologies (Xu et al., 2014), we quantified the indigenous nutrient supply through relative yield calculations, where higher values indicate greater native soil fertility.
The relative yield, representing the soil's indigenous nutrient-supplying capacity, was calculated as follows (Equation 6):
3 Results
3.1 Initial soil properties of the testing sites
The soil analysis results (Table 3) indicated a moderately to slightly acidic pH range (5.3–6.4) across the sampling sites (Jones, 2003). Total nitrogen (N) content (0.15-0.18%) was within the medium range, while plant-available phosphorus (P) exhibited substantial spatial variability (6.4-36.8 mg kg-1), ranging from low to high (Hazelton and Murphy, 2007). Exchangeable potassium (K) levels (0.58–2.56 cmolC(+)) kg-1) were classified as high (FAO, 2006), whereas micronutrient analysis revealed available boron (B) concentrations spanning insufficient to adequate and extractable zinc (Zn) levels within the medium-to-high range (Jones, 2003). Additionally, available sulfur (S) content (4.2-5.5 mg kg-1) was categorized as medium (Landon, 1991).

Table 3. Mean soil chemical properties (0–20 cm depth) across eight experimental sites in Farta and Lay Gayint districts in 2022 cropping season.
3.2 Growth and yield attributes
The -N and F0 treatments significantly reduced plant height, spike length, and seed number per spike across most sites (Tables 4–6), though thousand seed weight remained unaffected (Table 7). While -P and -K treatments only impacted plant height at 25% (Sites 5 and 8) and 12.5% (Site 8) of sites, respectively, the most severe growth reductions occurred under F0 (73.0 cm) and -N (81.1 cm) treatments. In contrast, the -Zn treatment produced the tallest plants (103.1 cm), comparable to NF. Spike morphology followed similar trends: F0 and -N treatments yielded the shortest spikes (7.1-7.5 cm) and fewest seeds (35-42.4), whereas NF produced the longest spikes (9.2 cm) and -K (statistically similar to NF) the highest seed number (52.9). Notably, NF outperformed -N by 18.7% in spike length and 15.2% in seed number. No significant effects of -P, -K, -S, -Zn, or -B were observed for spike traits across sites.

Table 4. Treatment effects on wheat plant height (cm) across eight experimental sites during 2022 growing season.
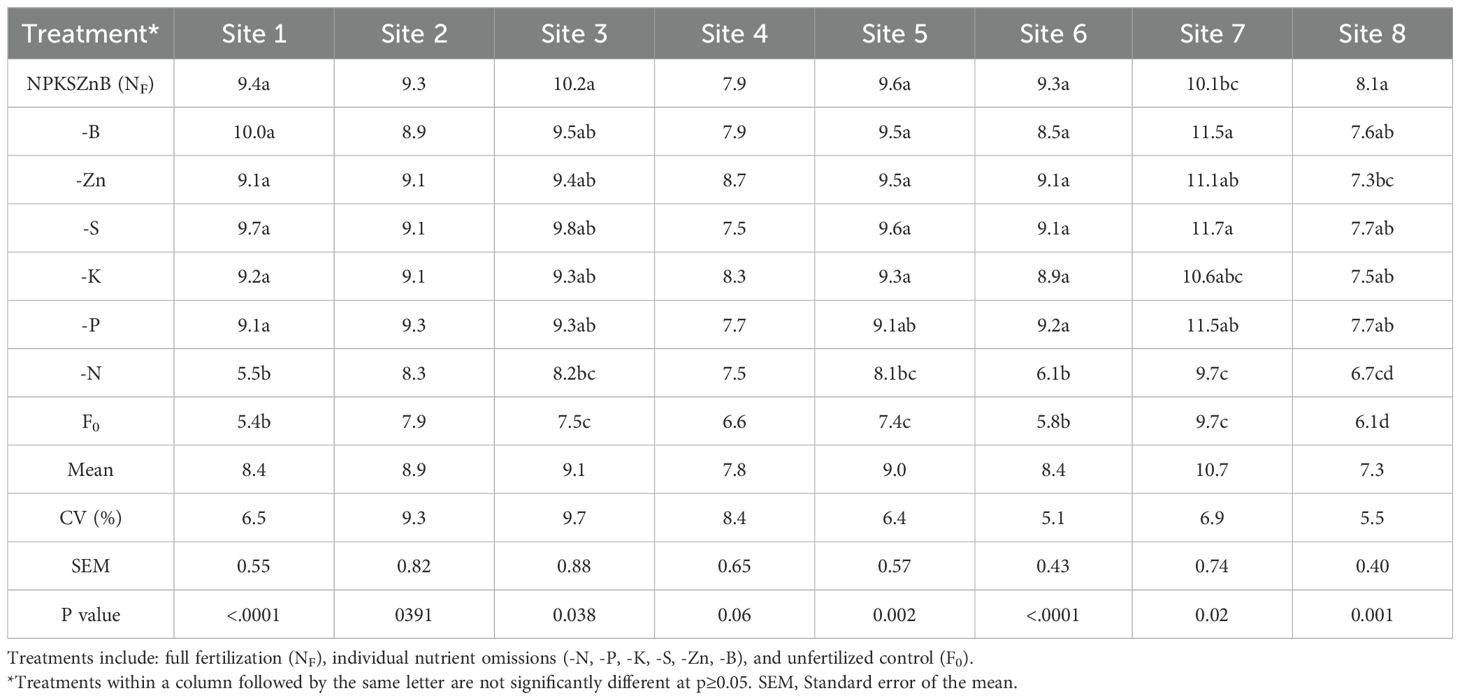
Table 5. Treatment effects on wheat spike length (cm) across eight experimental sites during 2022 growing season.
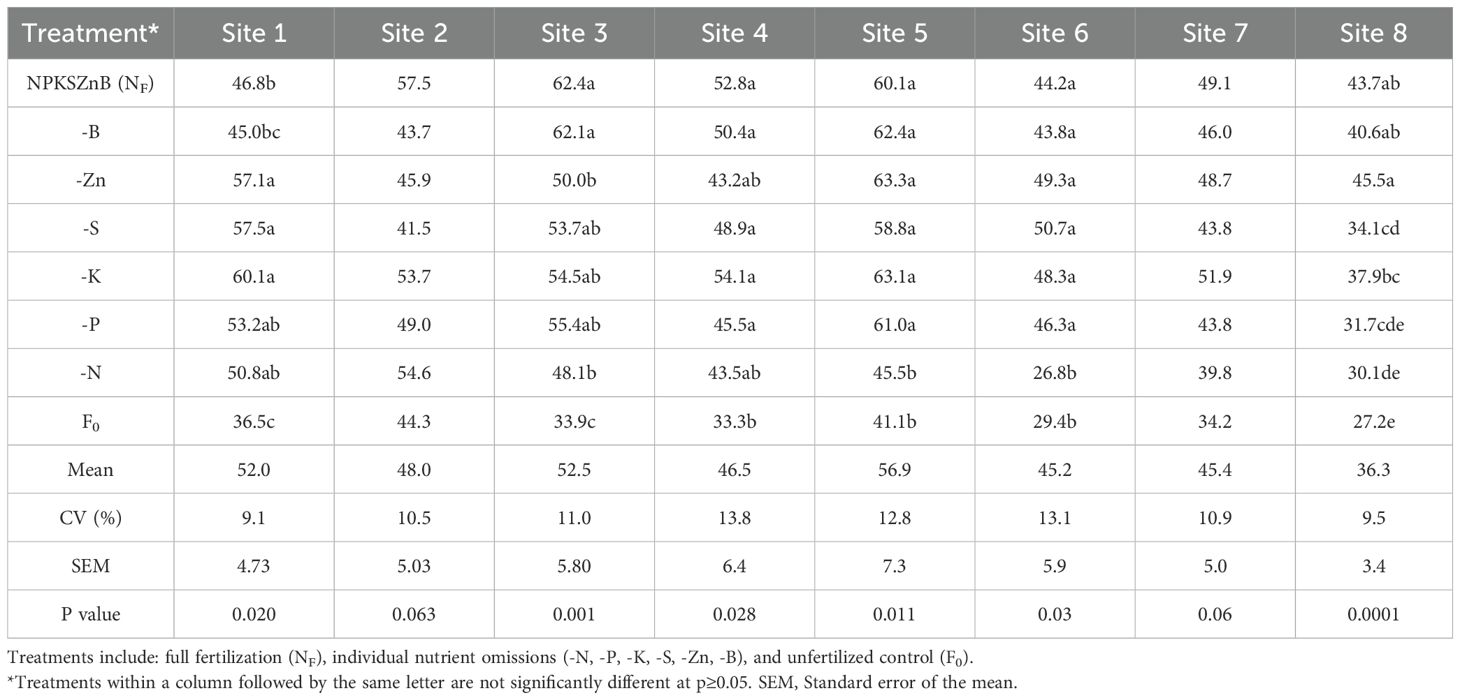
Table 6. Treatment effects on wheat seed number per spike across eight experimental sites during 2022 growing season.
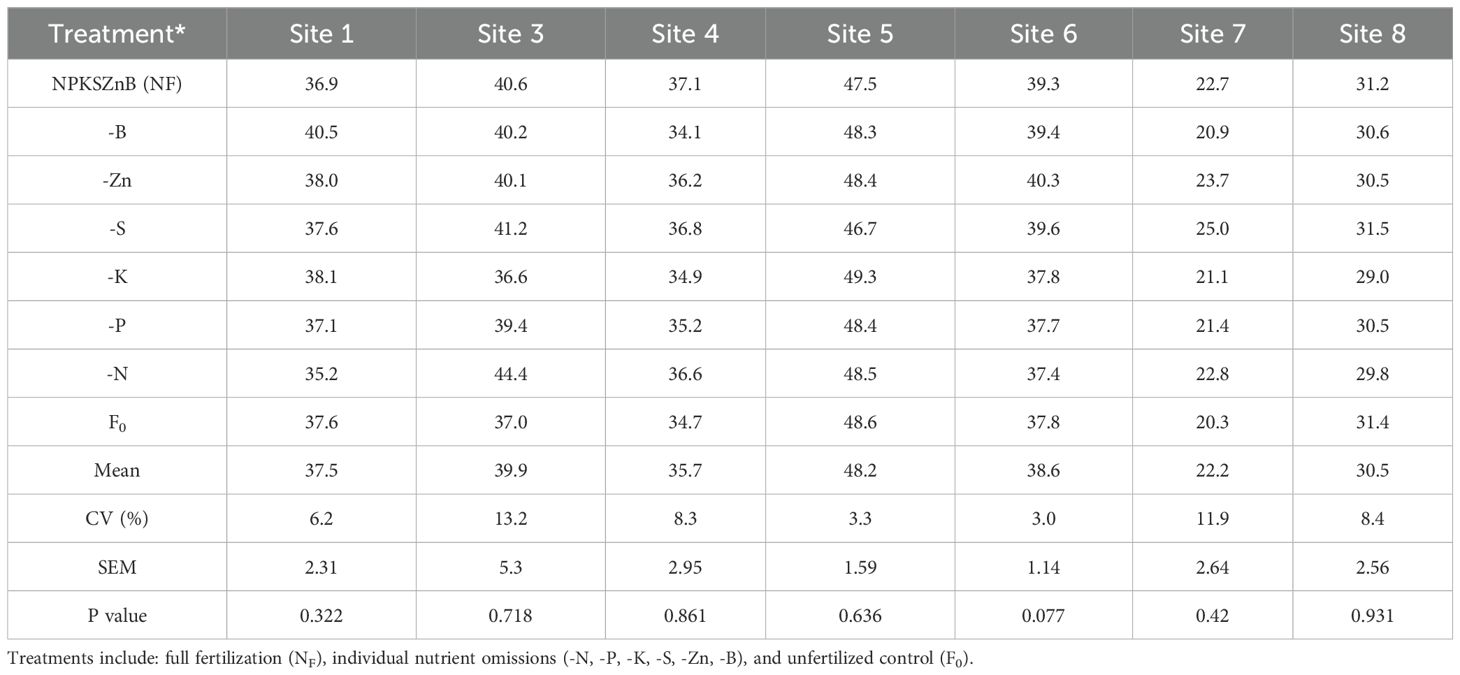
Table 7. Treatment effects on wheat thousand seed weight (g) across eight experimental sites during 2022 growing season.
3.3 Grain yield and dry biomass
All testing sites showed significant (p < 0.05) treatment effects on grain yield and dry biomass (Tables 8, 9). The -N and F0 treatments consistently and significantly reduced both parameters across all sites, with -N causing average yield and biomass losses of 56.5% and 56.9%, respectively, relative to NF. While the -P treatment significantly affected yield and biomass in 50% of sites (mean reduction: 13.6%), -K effects were limited to a single site. No significant impacts (p > 0.05) were observed for -S, -Zn, or -B treatments in any location.
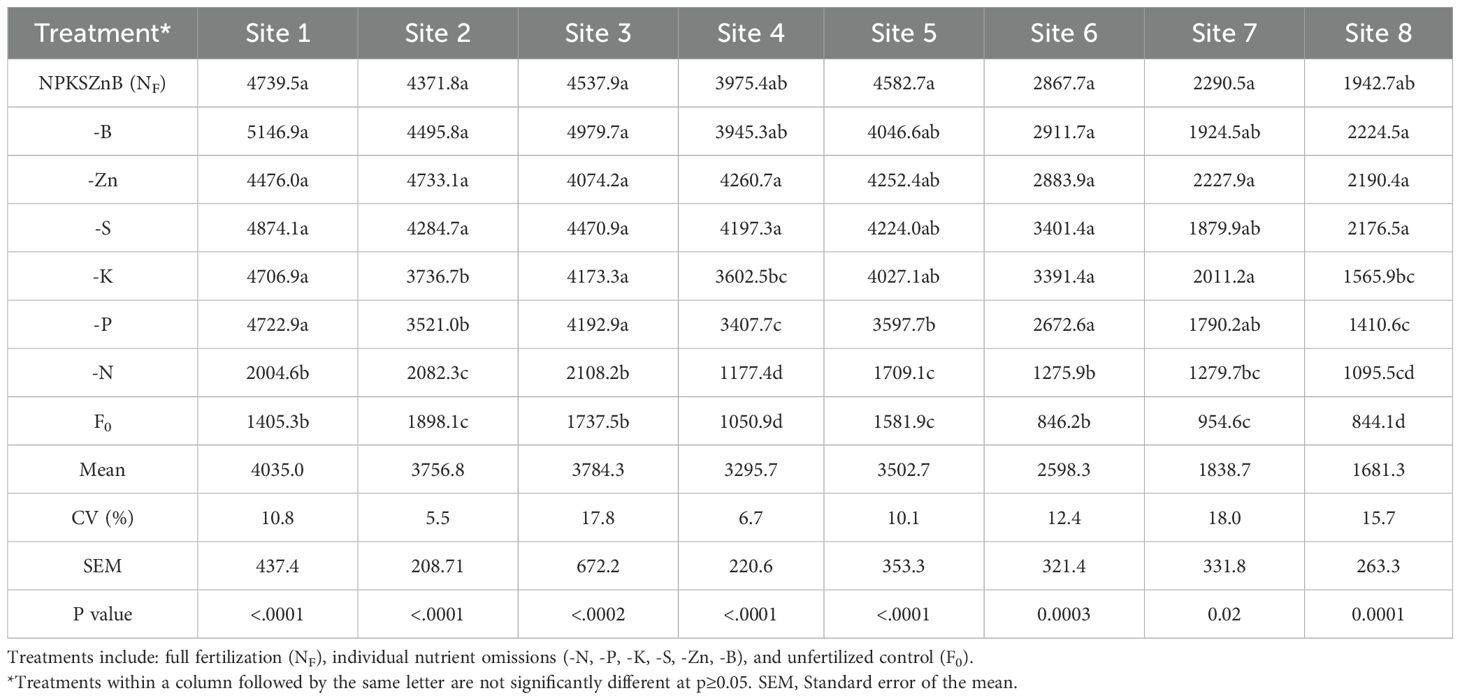
Table 8. Treatment effects on wheat grain yield (kg ha-1) across eight experimental sites during 2022 growing season.
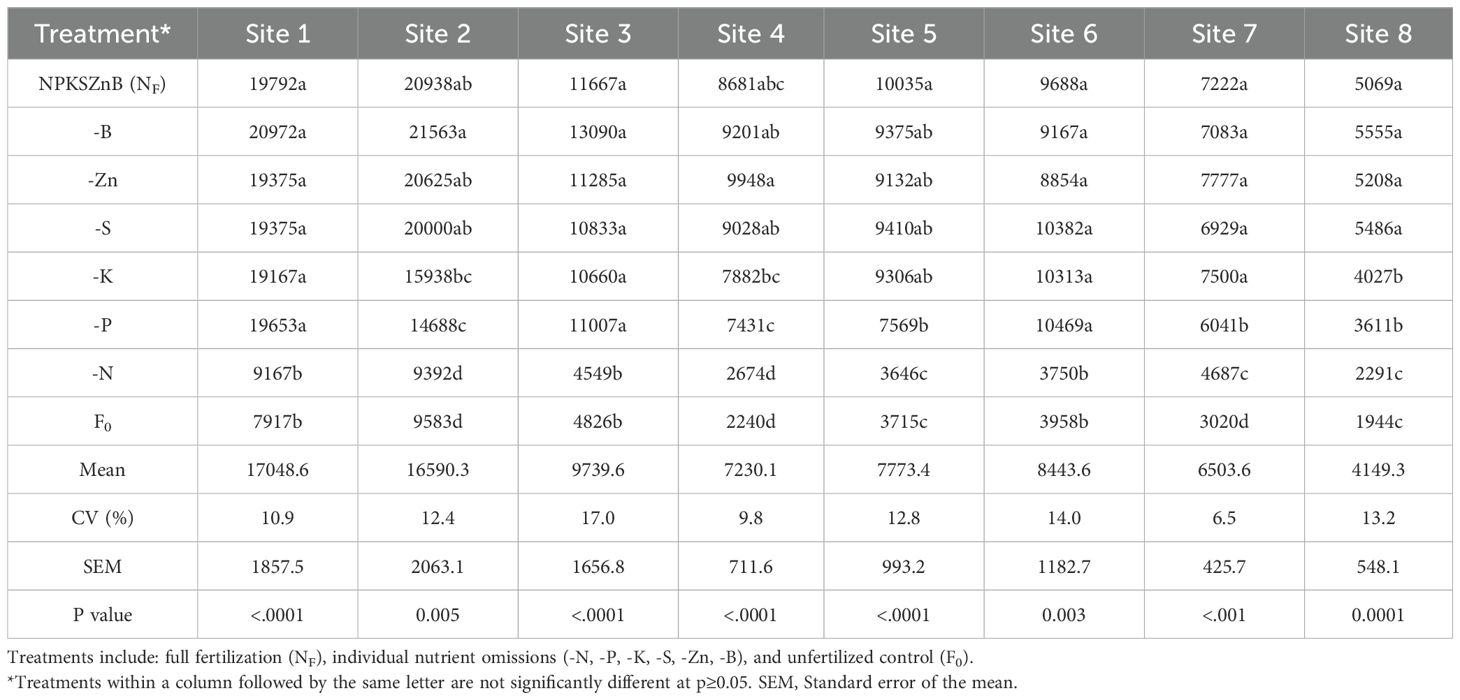
Table 9. Treatment effects on wheat aboveground dry biomass (kg ha-1) across eight experimental sites during 2022 growing season.
3.4 Yield response
The -N and F0 treatments demonstrated the most substantial and consistent yield reductions across all experimental sites (Table 10, Figure 3). Nitrogen omission (-N) resulted in yield responses ranging from 847 to 2,874 kg ha-1 (mean = 2,072 kg ha-1). Phosphorus omission (-P) effects were more variable, with yield responses ranging from 17 to 851 kg ha-1 (mean = 499 kg ha-1). Potassium omission showed particularly wide variation, yielding responses between -524 and 557 kg ha-1 (mean = 261.7 kg ha-1). Negative mean yield responses to -S, -Zn, and -B treatments at most sites indicated these nutrients were present at sufficient or potentially supra-optimal levels, where additional fertilization could potentially induce phytotoxicity and yield depression.

Table 10. Wheat grain yield response (kg ha-1) to nutrient omission treatments across eight experimental sites during 2022 growing season.
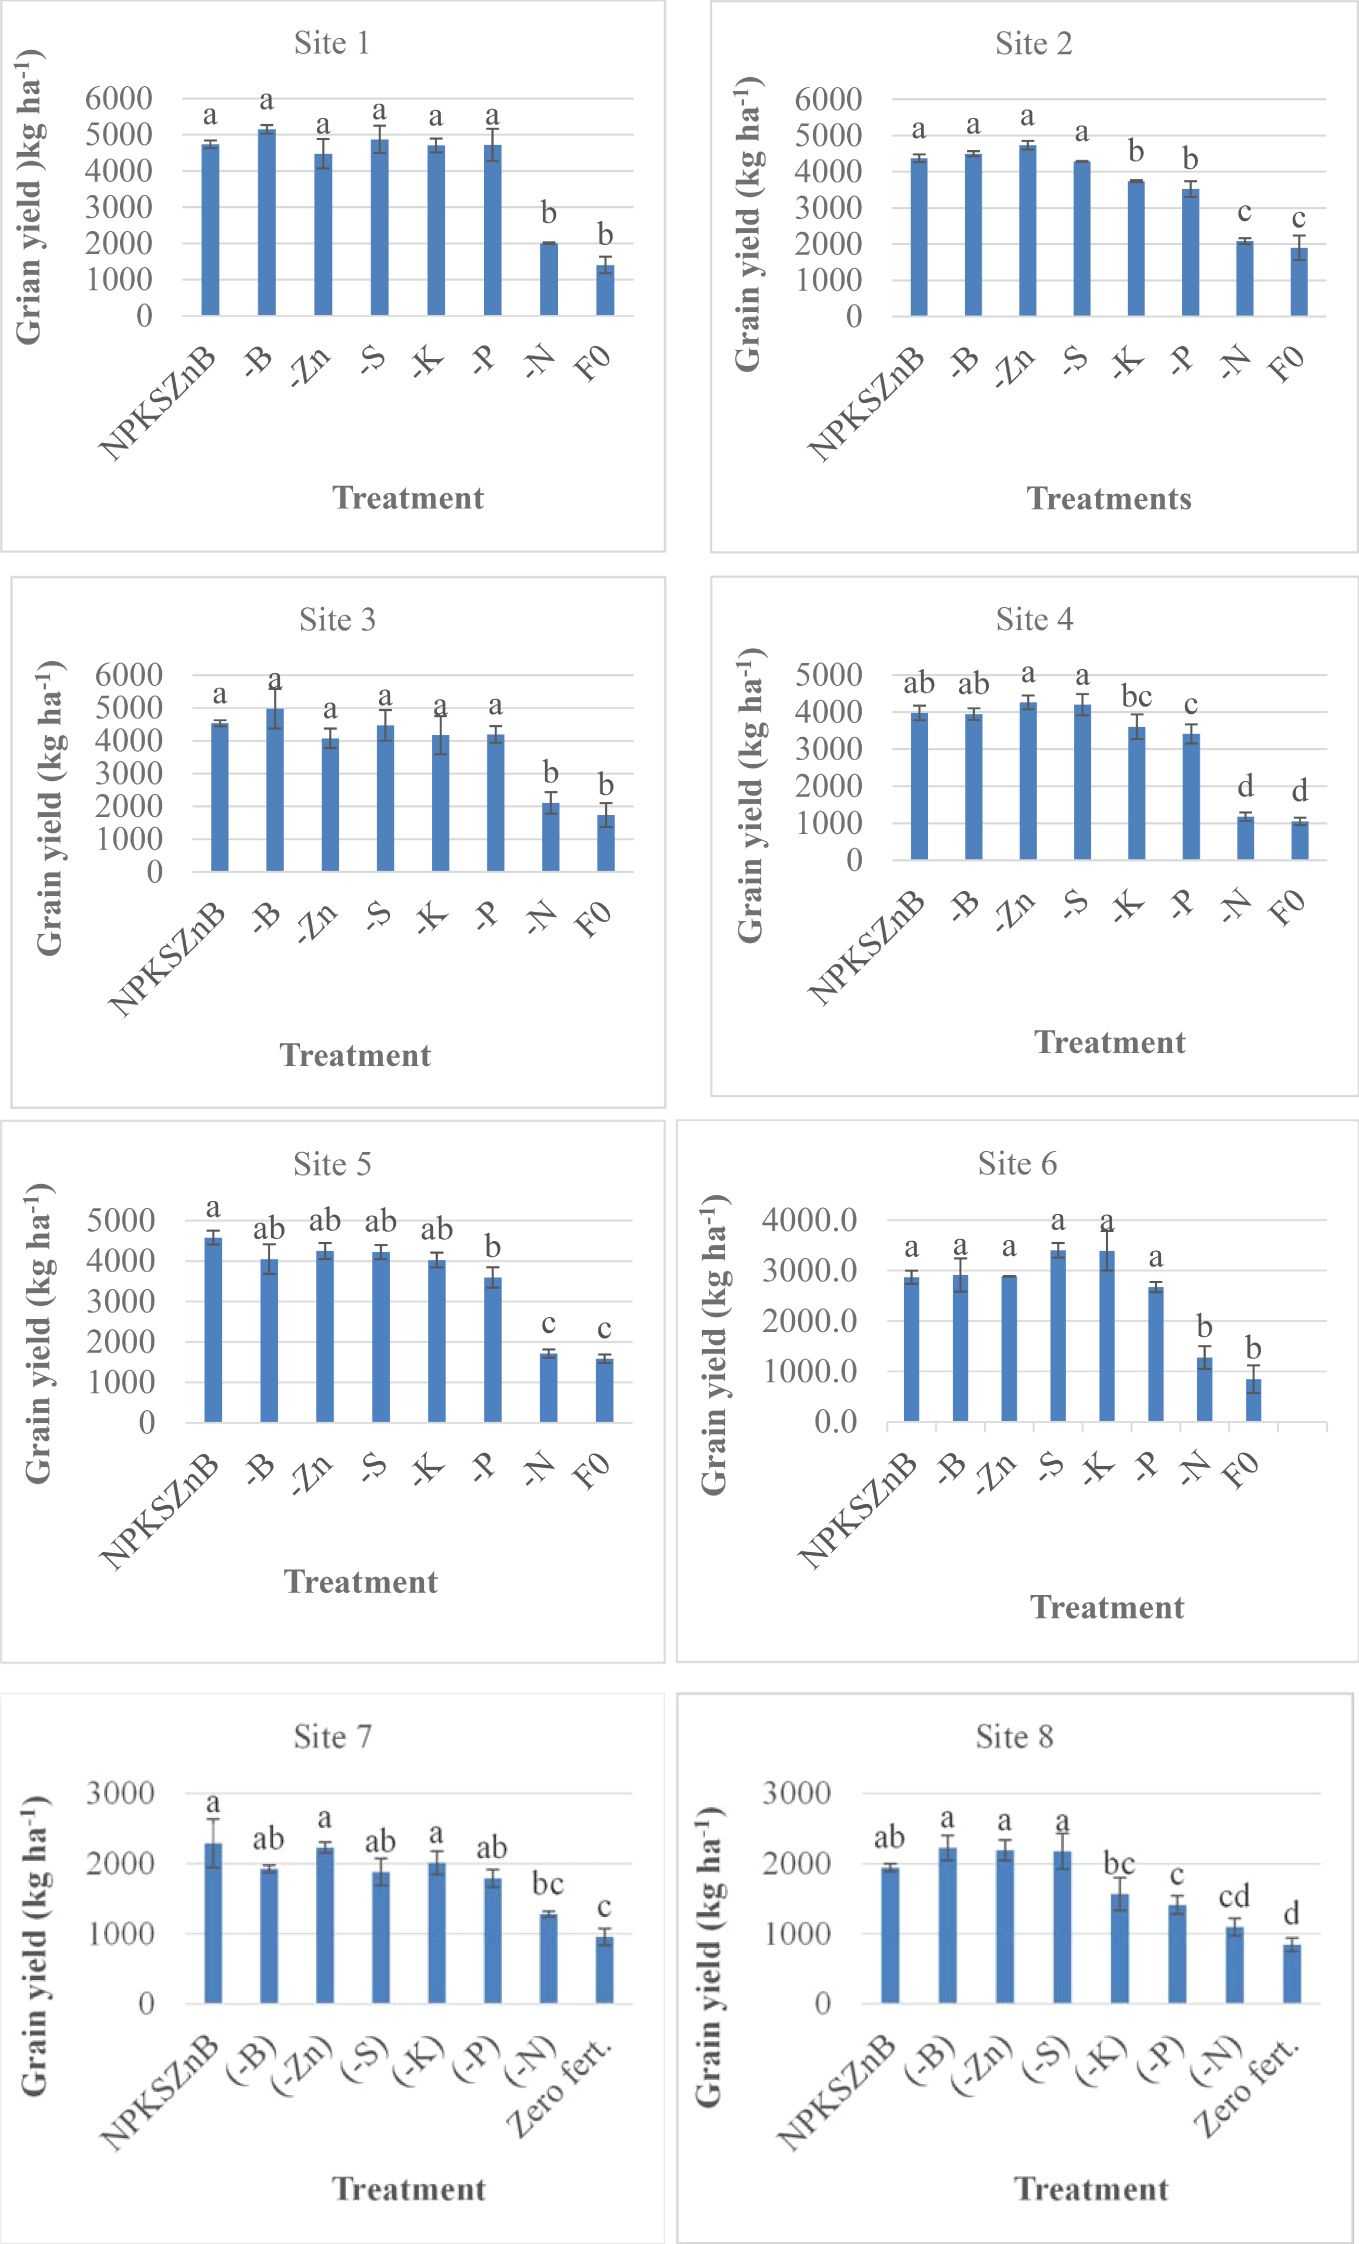
Figure 3. Wheat grain yield response to nutrient omission treatments across eight experimental sites in Farta and Lay Gayint districts during the 2021 growing season. Bars represent treatment means ± standard error (n = 3 replicates per site). Letters above bars indicate significant differences (Duncan's Multiple Range Test, p < 0.05) within each site.
3.5 Agronomic use efficiency
The agronomic use efficiency (AE; kg grain yield per kg applied nutrient) of N (AEN), P (AEP), and K (AEK) varied significantly across testing sites (Table 11). AEN ranged from 6.1 to 20.8 kg kg-1 (mean: 13.1 kg kg-1), while AEP exhibited a broader range (0.8–42.5 kg kg-1, mean: 22.2 kg kg-1) and AEK showed lower but consistent efficiency (0.6–12.7 kg kg-1, mean: 5.2 kg kg-1). The overall trend (AEP > AEN > AEK) suggests that P fertilization generated the highest yield response per unit applied, followed by N and then K, highlighting differential nutrient utilization efficiencies in the studied wheat systems.
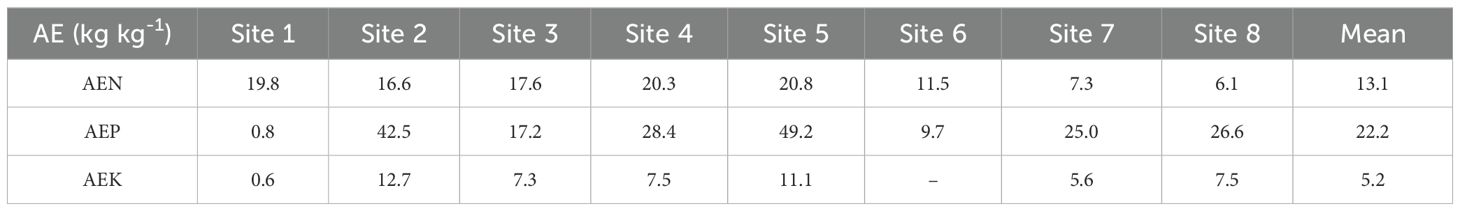
Table 11. Agronomic efficiency (kg grain kg-1 nutrient applied) of N (AEN), P (AEP), and K (AEK) for wheat across eight experimental sites in Farta and Lay Gayint districts during 2022 growing season.
3.6 The soil indigenous nutrient supply
Analysis of relative yield data revealed significant variation in indigenous nutrient supply across the study sites. The soil indigenous N supply ranged from 29.6% to 56.5% (mean: 45.0%), demonstrating substantial N deficiency, while P supply showed higher values (72.6% to 99.6%, mean: 87.0%) (Figure 4). These results clearly indicate that N was the most limiting nutrient for wheat production in the study area. In contrast, indigenous supplies of K, S, Zn, and B consistently exceeded 90%, confirming their adequate availability to support optimal wheat growth and yield under prevailing soil conditions.
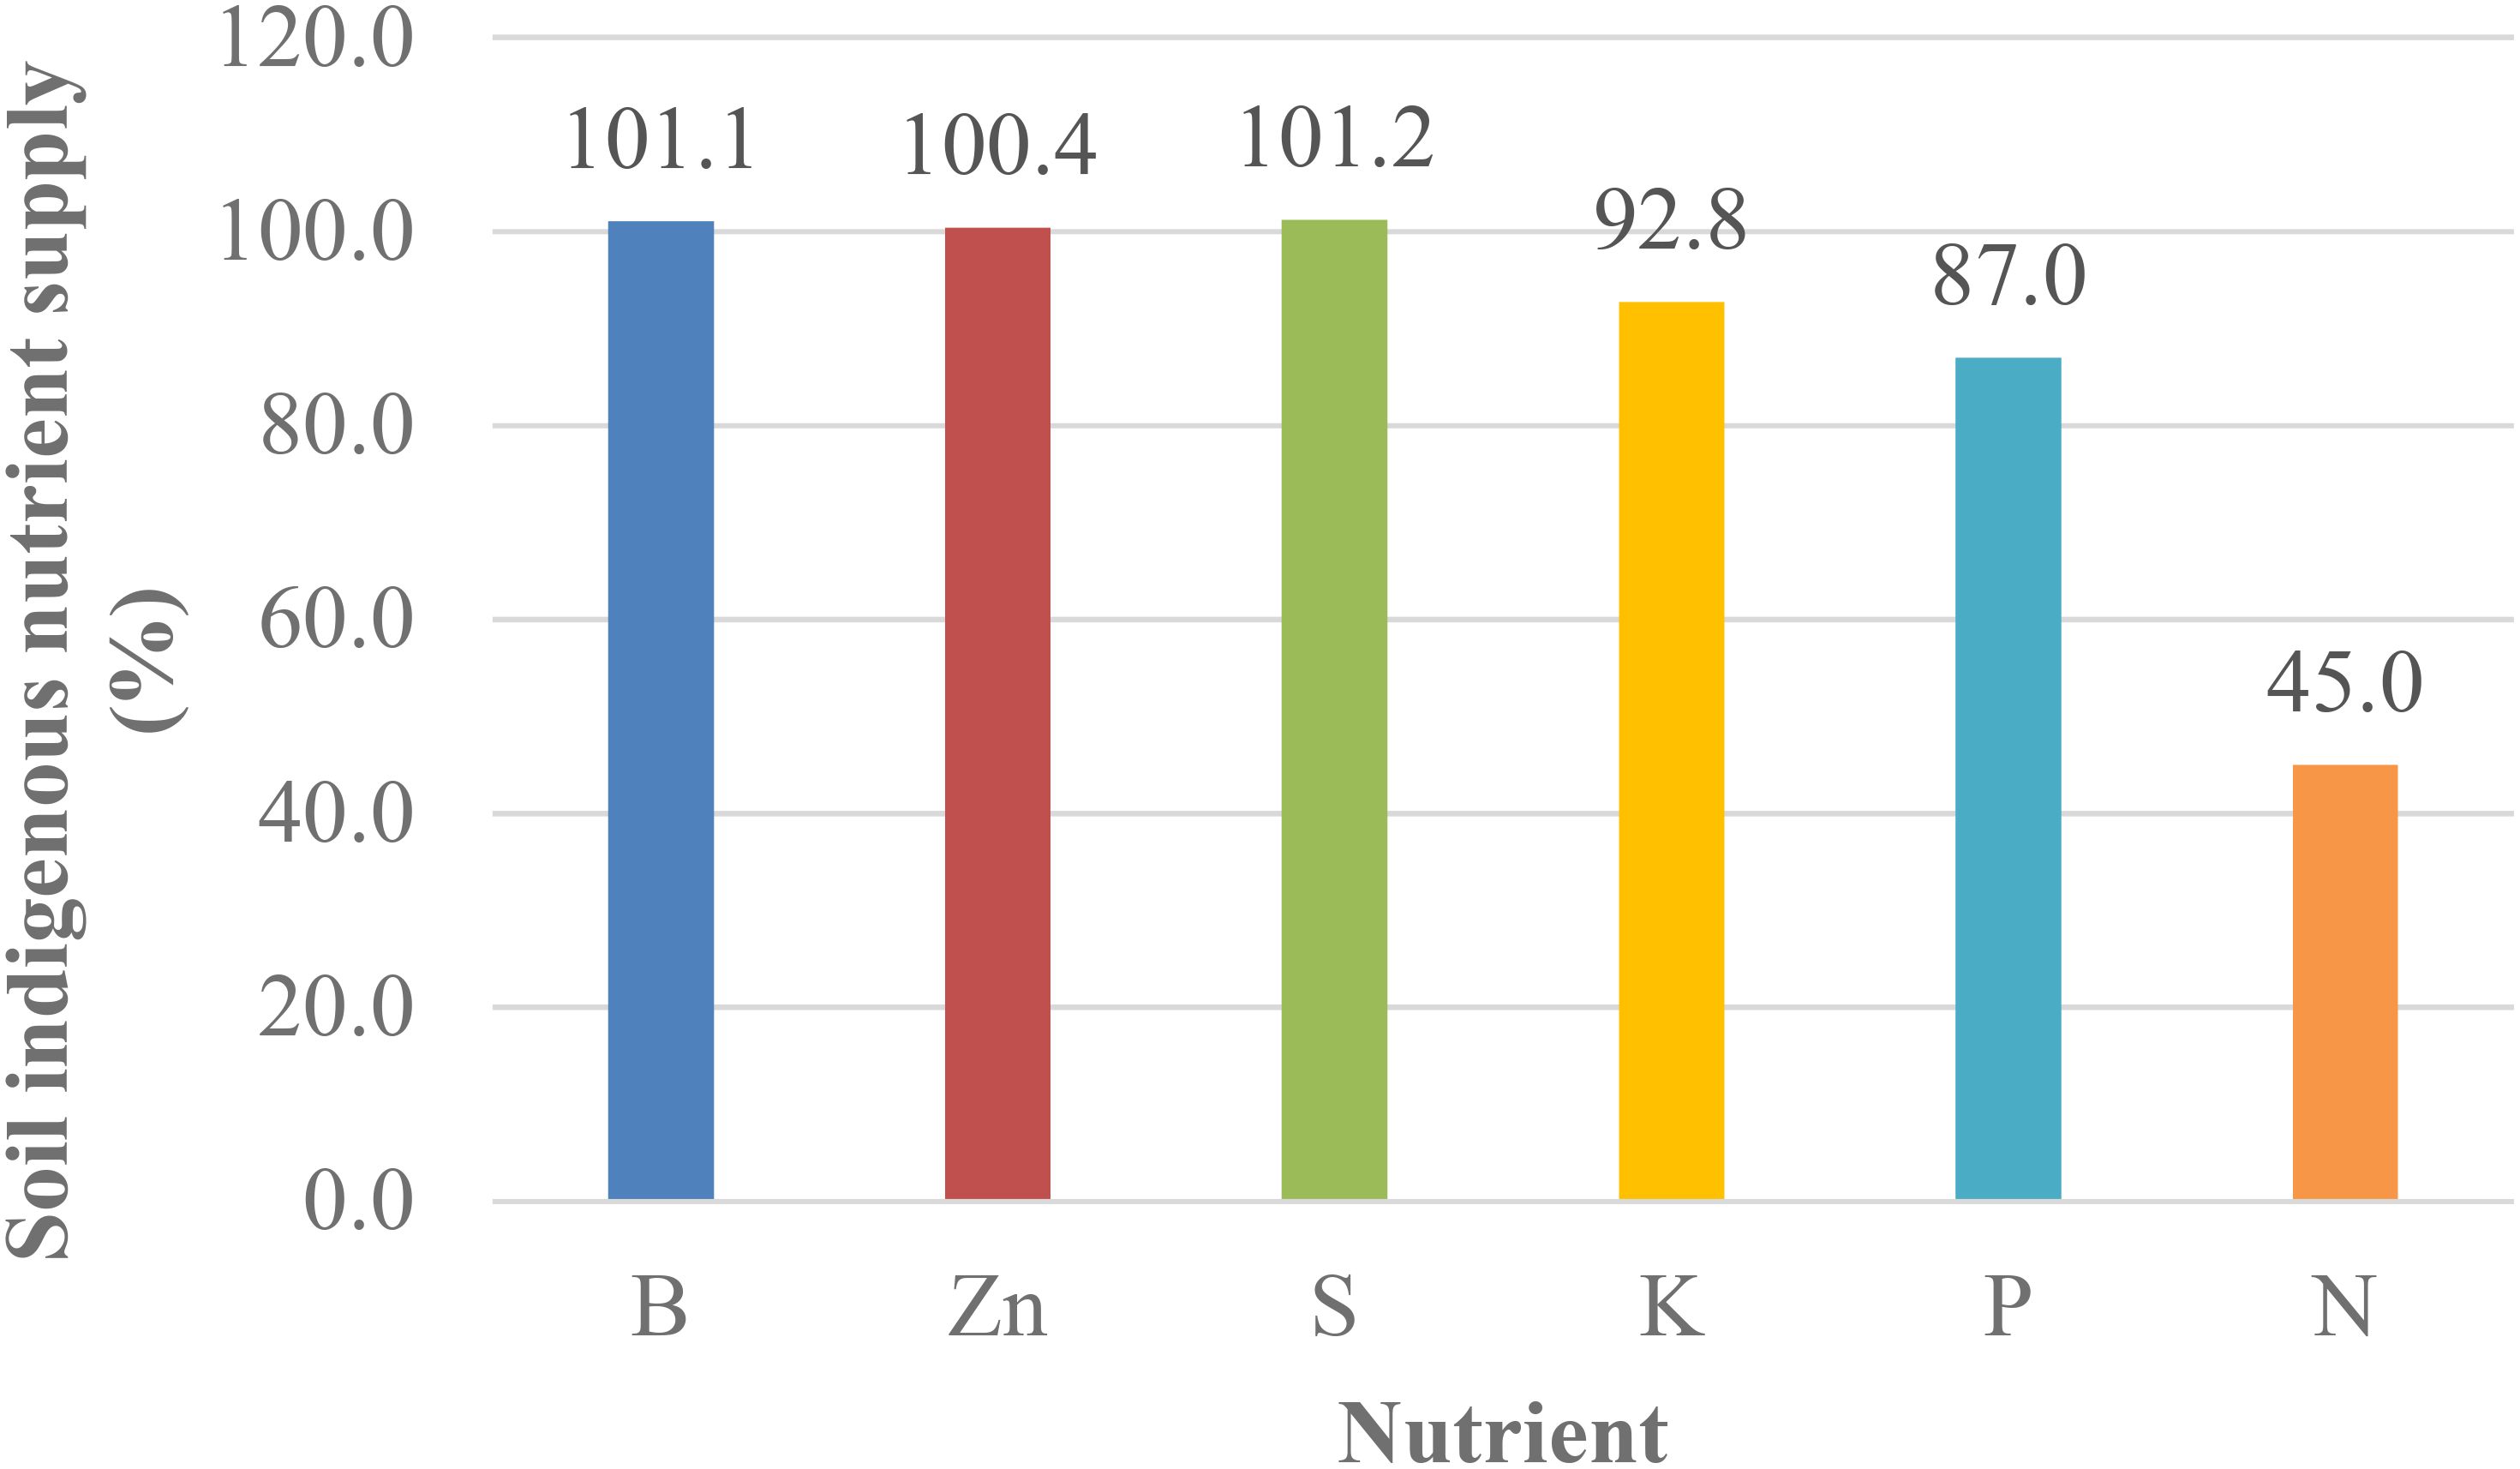
Figure 4. Soil Indigenous Nutrient Supplying (SINS) capacity for wheat production across eight experimental sites in Farta and Lay Gayint district in the 2021 growing season. Values represent mean relative grain yield in omission plots for (a) N, (b) P, (c) K, (d) Zn, and (e) B.
3.7 Yield gaps
The yield gap analysis revealed substantial differences in productivity losses across nutrient omission treatments (Figure 5). The most severe yield reduction (63.0% mean loss) occurred in the F0 treatment, followed closely by N omission (-N) at 53.9%. Phosphorus omission (-P) resulted in a moderate 11.9% yield loss, while -K, -S, -Zn, and -B showed negligible impacts on productivity. These findings demonstrate that N represents the primary yield-limiting factor for wheat cultivation in the study area, with P emerging as the secondary constraint. The minimal yield gaps observed for other nutrients confirm their adequate soil availability for optimal crop performance.
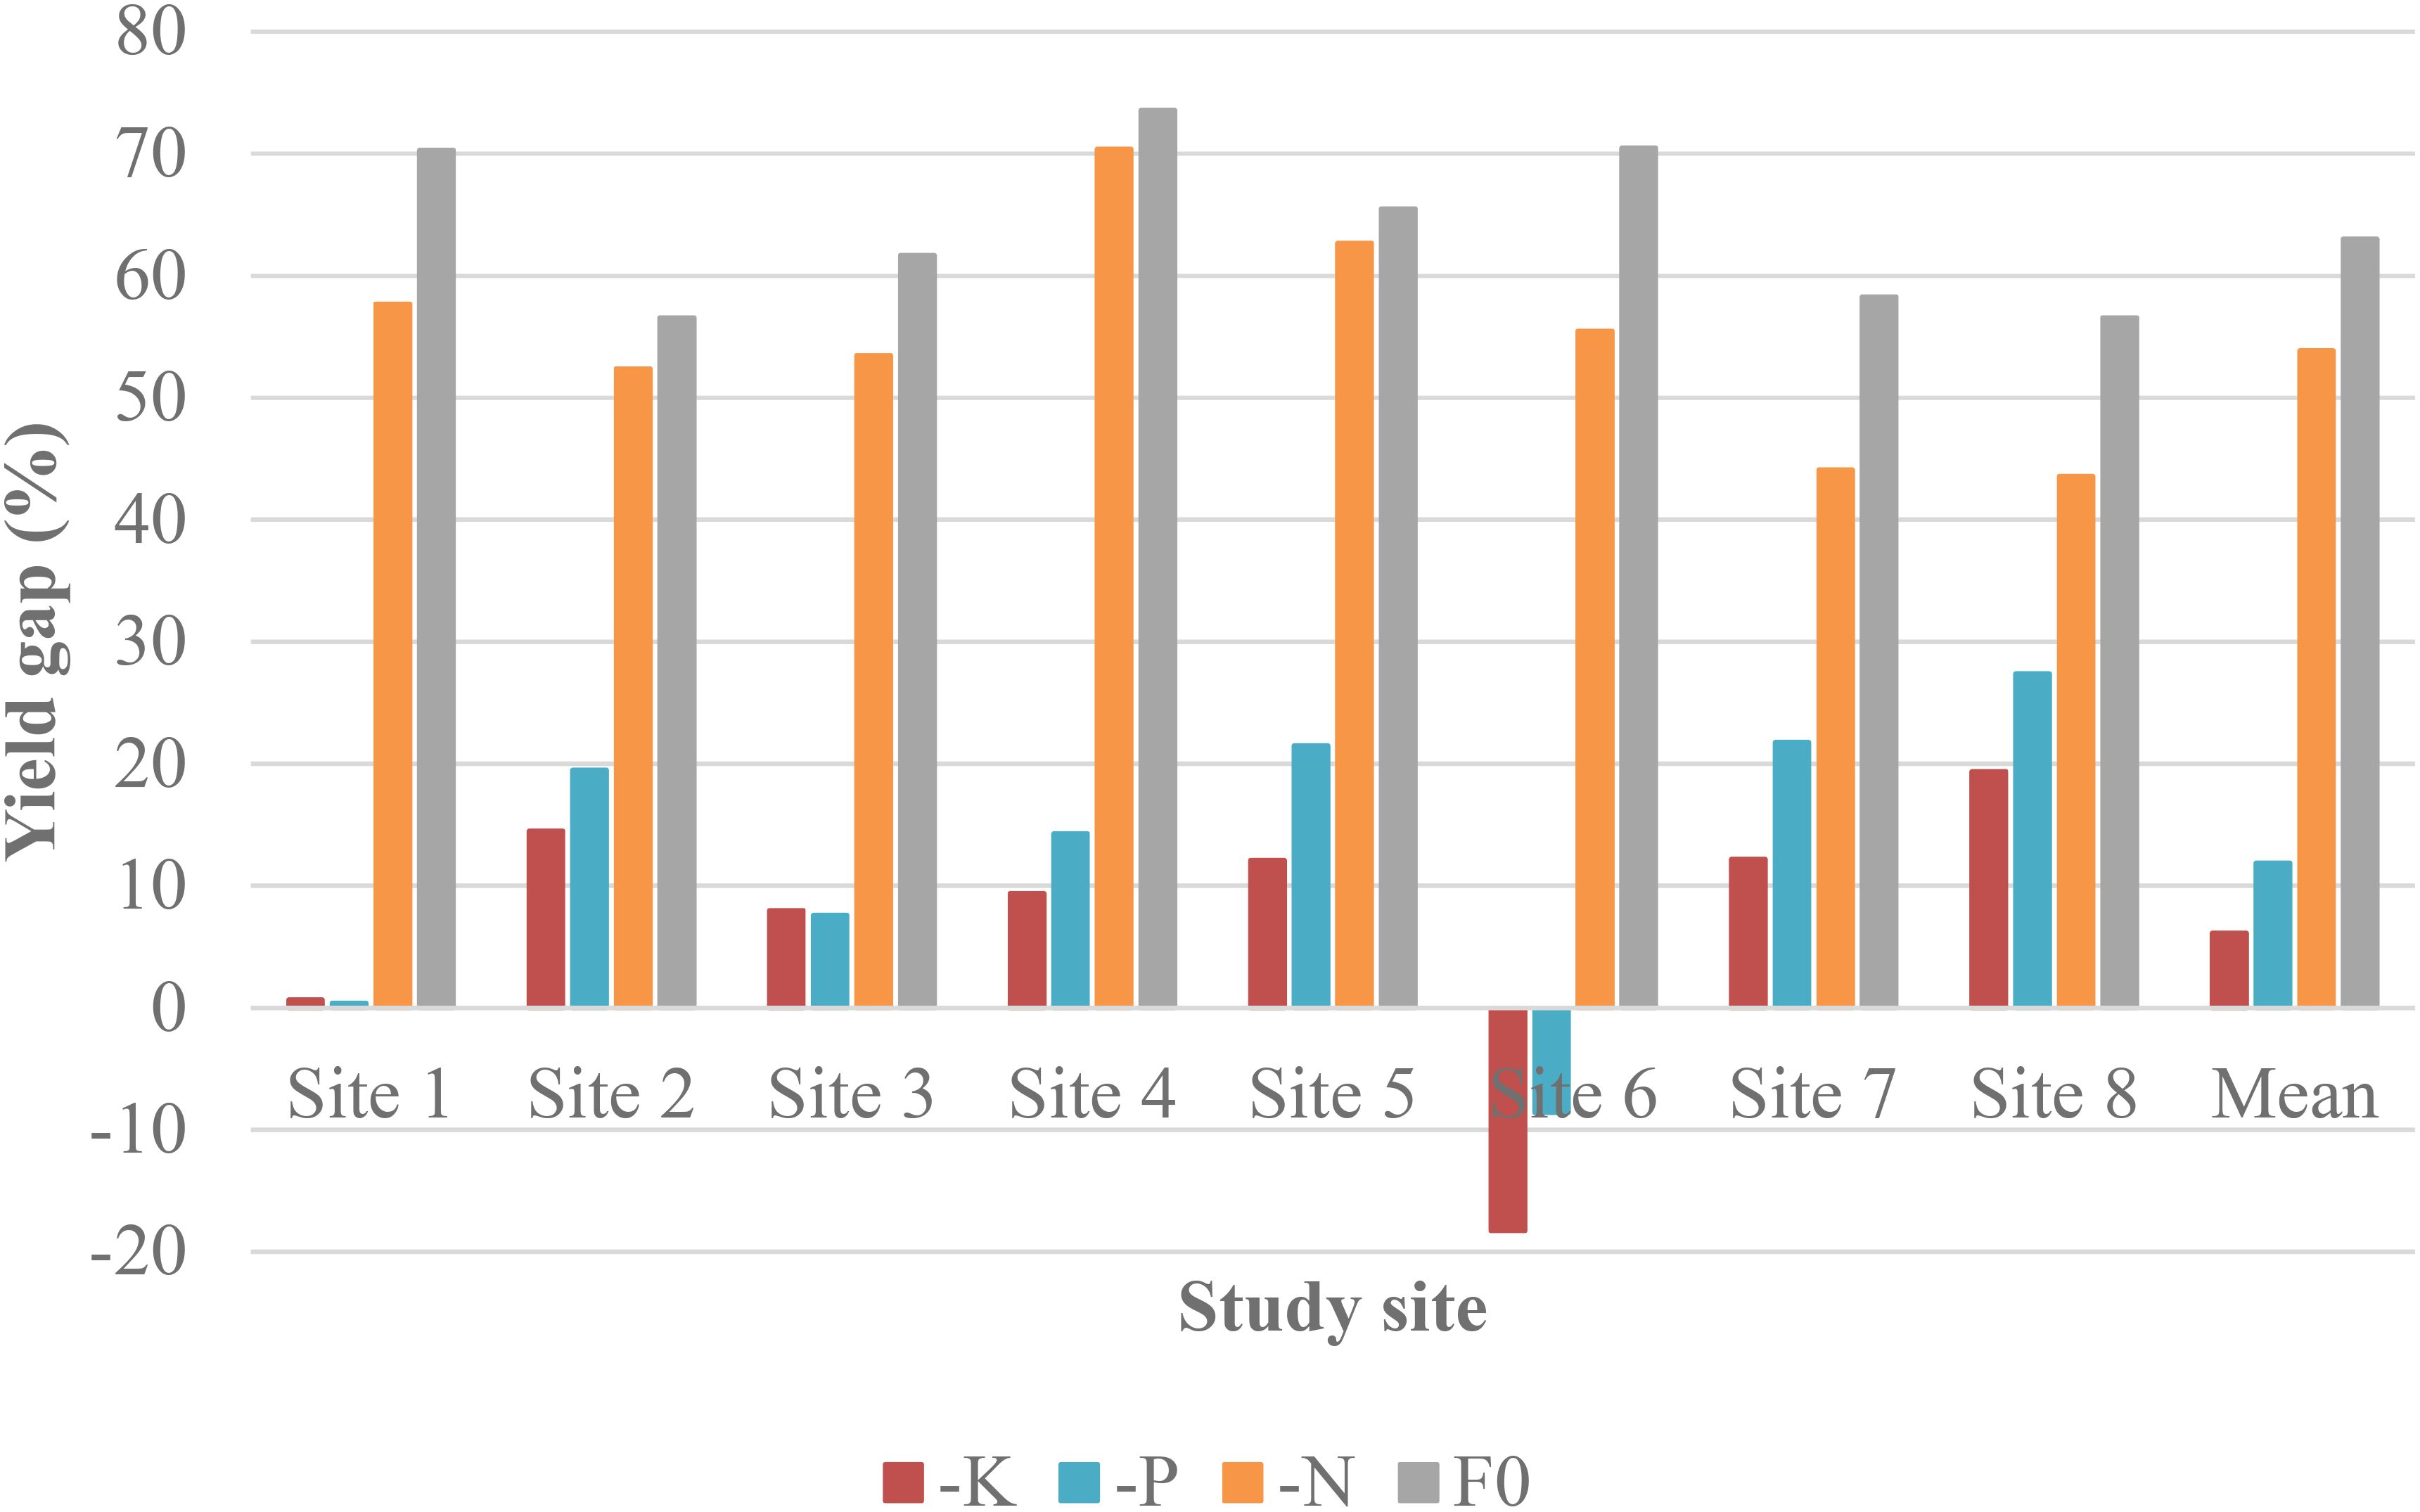
Figure 5. Wheat yield gaps attributed to nutrient omissions treatments across eight experimental sites in the 2021 growing season: (a) N omission (-N), (b) P omission (-P), (c) K omission (-K), and (d) zero-fertilization control (F0). Values represent mean yield differences (%) relative to the full fertilization (NF) (NPKSZnB).
4 Discussion
4.1 Soil characteristics of the testing sites
The study sites exhibited medium to slightly acidic pH ranges (5.3-6.4), consistent with previous findings for Luvisols in the study area (G/Selassie, 2002; Beyene et al., 2023). Various study reports also revealed soil acidity problems in the study areas (Abayneh, Draft report, unpublished, 2017 draft; Fekadu et al., 2017), attributable primarily to basic cation leaching from intensive rainfall, erosion on cultivated slopes, and inadequate conservation practices (Abebe, 1998). Soil N content showed medium levels, likely reflecting organic matter depletion from crop residue removal, intensive tillage, and limited organic inputs. The available P levels exhibited significant spatial variability across testing sites (range: 6.4-36.8 mg kg-1), underscoring the need for site-specific P management strategies. Our observed mean available P level (11.2 mg kg-1) in Lay Gayint district was comparable to values reported by Fekadu et al. (2017) for similar soils (6–10 mg kg-1). A notable discrepancy emerged in K status, with our study showing high exchangeable K levels contrasting with previous reports of K deficiency in the region (Abayneh, 2017; Fekadu et al., 2017). Zinc concentrations were consistent with regional benchmarks (Abayneh, 2017), while B availability showed marked differences, with the present study results indicating sufficient levels compared to earlier findings of widespread deficiency (Abayneh, 2017).
4.2 Yield response of wheat to N, P, K, S, Zn and B
The observed yield responses strongly correlated with soil indigenous nutrient supply, demonstrating an inverse relationship between response magnitude and native soil nutrient availability. Maximum yield response (mean 2071.9 kg kg-1) was recorded from N omission (-N), confirming severe N deficiency across the testing sites. The recorded yield response to N application might be resulted from significant N loss through leaching under the study area’s high rainfall regime (>1200 mm) and depletion of organic matter through repeated tillage. These findings align with Limin et al. (2013), who reported comparable N response ranges (800–2400 kg ha-1, mean: 1700 kg ha-1). The yield enhancement from N fertilization reflects its fundamental physiological roles in wheat growth, including: stimulating vegetative growth and tiller development, enhancing photosynthetic capacity, and facilitating protein and carbohydrate synthesis (Havlin et al., 1999). This response pattern underscores the importance of N as the primary limiting nutrient for wheat production in the study area. Phosphorus omission (-P) showed significant but variable yield responses (16.6-850.8 kg ha-1, mean: 499.1 kg ha-1) at 50% of sites, consistent with regional studies (Dargie et al., 2022; Bazie et al., 2024). Notably, K, S, Zn, and B omissions showed minimal yield impacts, corroborating findings from multiple Ethiopian studies (Getinet et al., 2024; Abdulkadir et al., 2016). The consistent pattern across studies establishes N and P as primary limiting factors for wheat production in Ethiopian highlands, while other nutrients remain non-limiting under current management systems.
4.3 Soil indigenous nutrient supply
The soil indigenous nutrient supply (SINS), defined as the total nutrient uptake in an omission plot (Janssen et al., 1990), was estimated using relative yield percentages. Higher relative yields reflect greater SINS and soil fertility, while lower values indicate reduced SINS and poorer fertility. As a key indicator of soil fertility, SINS enables site-specific fertilizer recommendations (Dobermann et al., 2002, 2003; Cui et al., 2008). In this study, indigenous N supply ranged from 29.6 to 56.5% (mean = 45.0%), suggesting poor soil N status. In contrast, indigenous P supply (72.6–99.6%; mean = 87.0%) indicated favorable P availability, aligning with findings by Limin et al. (2013), who reported mean relative yields of 85% (P) and 90% (K) in similar soils.
4.4 Agronomic use efficiency of wheat
The agronomic N use efficiency (AEN) in this study (6.1–20.8 kg kg-1; mean = 13.1 kg kg-1) was below the global average (18 kg kg-1; Ladha et al., 2005), indicating opportunities for improved N management. Similar findings were reported by Dargie et al. (2022) (1.3–15.2 kg kg-1) across diverse soils and by Duan et al. (2014) (1.1–19.0 kg kg-1) in rice-wheat systems. AEN variability reflects management practices and soil N supply, with studies demonstrating potential increases (e.g., 10.5–28.7 kg kg-1; Belete et al., 2018) through optimized N splitting. While Limin et al. (2013) reported lower AEN (mean = 9.4 kg kg-1) in North China, Dobermann (2007) noted that cereals in developing countries typically achieve 10–30 kg kg-1, with well-managed systems exceeding 25 kg kg-1 under low N inputs. For P, our AEP range (0.8–42.5 kg kg-1) aligned with Dargie et al. (2022) (1.2–49 kg kg-1). AEK values (0.6–12.7 kg kg-1) were consistent with Limin et al. (2013) (mean = 6.5 kg kg-1) but lower than reports from Vertisols (18.0 kg kg-1; Birhane et al., 2017).
5 Conclusions
This study demonstrates that nitrogen (N) availability is the primary constraint to wheat productivity, as evidenced by significant yield reductions (mean response: 2,071.9 kg ha-1; yield gap: 53.9%) and critically low indigenous soil supply (mean: 45.0%) across all test sites, coupled with suboptimal agronomic efficiency (mean AEN: 13.1 kg kg-1). Phosphorus (P) emerged as a secondary limiting factor, showing variable but substantial yield responses (mean: 499.1 kg ha-1; yield gap: 11.9%) in 50% of sites, despite relatively adequate soil indigenous supply (mean: 87.0%). In contrast, potassium (K), sulfur (S), zinc (Zn), and boron (B) proved non-limiting, with soil indigenous supplies exceeding 90% and negligible yield gaps, indicating these nutrients currently require no supplemental fertilization. These findings establish a clear nutrient management priority: targeted N optimization and site-specific P applications are essential to enhance wheat production in the study area. While this single-season study identified key yield-limiting nutrients (N, P) in the study area, interannual climatic variability may influence nutrient response dynamics. We recommend multi-year trials to validate the temporal stability of soil indigenous nutrient supply (SINS) values, quantify weather-mediated nutrient use efficiency variations, particularly for P which showed site-specific responses, and develop climate-adaptive fertilizer recommendations.
Data availability statement
The raw data supporting the conclusions of this article will be made available by the authors, without undue reservation.
Author contributions
AA: Conceptualization, Data curation, Formal analysis, Funding acquisition, Investigation, Methodology, Resources, Software, Supervision, Visualization, Writing – original draft, Writing – review & editing. DG: Data curation, Methodology, Supervision, Conceptualization, Formal analysis. GA: Data curation, Methodology, Investigation, Resources, Supervision, Writing – review & editing. WW: Conceptualization, Data curation, Investigation, Methodology, Writing – review & editing. TG: Data curation, Methodology, Supervision, Writing – review & editing.
Funding
The author(s) declare that financial support was received for the research and/or publication of this article. The research work was financed by the Ethiopian Institute of Agricultural Research (EIAR).
Acknowledgments
The authors gratefully acknowledge the Ethiopian Institute of Agricultural Research (EIAR) for financial support through the Capacity Sharing for Development (CapSha) Project. We extend our sincere appreciation to the Fogera National Rice Research and Training Center (FNRRTC) for providing essential logistical support throughout the research. Special thanks are due to the participating farmers who generously contributed their land and time to enable this study.
Conflict of interest
The authors declare that the research was conducted in the absence of any commercial or financial relationships that could be construed as a potential conflict of interest.
Generative AI statement
The author(s) declare that no Generative AI was used in the creation of this manuscript.
Publisher’s note
All claims expressed in this article are solely those of the authors and do not necessarily represent those of their affiliated organizations, or those of the publisher, the editors and the reviewers. Any product that may be evaluated in this article, or claim that may be made by its manufacturer, is not guaranteed or endorsed by the publisher.
Abbreviations
ANOVA, Analysis of Variance; AE, Agronomic use efficiency; AEN, Agronomic use efficiency of nitrogen; AEP, Agronomic use efficiency of phosphorus; AEK, Agronomic use efficiency of potassium; CSA, Central Statistics Agency of Ethiopia; DST, Decision Support Tool; DMRT, Duncan’s Multiple Range Test; FAO, Food and Agricultural Organization; NOTs, Nutrient Omission Trials; SAS, Statistical Analysis Software; SINS, Soil Indigenous Nutrient Supply.
References
Abayneh E. (2017). Characterization and mapping of soils of farta woreda. Draft report. November 2017 (Addis Ababa, ETHIOPIA).
Abdulkadir B., Kassa S., Desalegn T., Tadesse K., and Haileselassie M. (2016). Soil fertility management studies on wheat in Ethiopia: A review. Ethiopian J. Natural Resour. 16, 1–23.
Abera W., Tamene L., Tesfaye K., Daniel J., Hugo D., Erkossa T., et al. (2023). A data-mining approach for developing site-specific fertilizer response functions across the wheat-growing environments in Ethiopia. Exp. Agriculture. 58, 1–16. doi: 10.1017/S0014479722000047
Alemayehu G., Tadesse W., and Asfaw S. (2019). Agro-ecological zones and their impact on crop productivity in the highlands of Ethiopia. J. Agric. Sci. 14, 235–244.
Anteneh A. and Asrat D. (2020). Wheat production and marketing in Ethiopia: review study. Cogent Food Agric. 6, 1778893. doi: 10.1080/23311932.2020.1778893
Bazie Z., Amare T., Alemu E., Agegnew G., Desta G., Tenagne A., et al. (2024). Identifying limiting nutrient(s) for better bread wheat and tef productivity in acidic soils of north-west Amhara, Ethiopia. Agrosystems Geosciences Environ. 7, e20516. doi: 10.1002/agg2.20516
Belete F., Dechassa N., Molla A., and Tana T. (2018). Effect of split application of different N rates on productivity and nitrogen use efficiency of bread wheat (Triticum aestivum L.). Agric. Food Secur 7, 92. doi: 10.1186/s40066-018-0242-9
Beyene S., Regassa A., Mishra B. B., and Haile M. (Eds.) (2023). The soils of Ethiopia (Berlin/Heidelberg, Germany: Springer).
Birhane H., Mamo T., and Teka K. (2017). Optimum potassium fertilization level for growth, yield and nutrient uptake of wheat (Triticum aestivum) in Vertisols of Northern Ethiopia. Cogent Food Agric. 3, 1347022. doi: 10.1080/23311932.2017.1347022
Craswell E. T. and Godwin D. C. (1984). “The efficiency of nitrogen fertilizers applied to cereals grown in different climates,” in Advances in plant nutrition. Eds. Tinker P. B. and Lauchli A. (Praeger Scientific, New York, NY).
CSA (2022). Report on crop and livestock product utilization (private peasant holdings, meher season) (Addis Ababa, Ethiopia: The Federal Democratic Republic of Ethiopia).
Cui Z., Zhang F., Chen X., Miao Y., Li J., Shi L., et al. (2008). On-farm estimation of indigenous nitrogen supply for site-specific nitrogen management in the North China plain. Nutr. Cycl Agroecosyst 81, 37–47. doi: 10.1007/s10705-007-9149-8
Dargie S., Girma T., Chibsa T., Kassa S., Boke S., Abera A., et al. (2022). Balanced fertilization increases wheat yield response on different soils and agroecological zones in Ethiopia. Exp. Agric. 58, e23. doi: 10.1017/S0014479722000151
Dobermann A. (2007). “Nutrient use efficiency. Measurement and management,” in Fertilizers best management practices. Eds. Kraus A., Isherwood K., and Heffer P. (Proceeding of International fertilizer Industry Association, Brussels, Belgium), 1–22.
Dobermann A., Witt C., Abdulrachman S., Gines H. C., Nagarajan R., Son T. T., et al. (2003). Estimating indigenous nutrient supplies for site-specific nutrient management in irrigated rice. Agron. J. 95, 924–935. doi: 10.2134/agronj2003.9240
Dobermann A., Witt C., Dawe D., Abdulrachman S., Gines H. C., Nagarajan R., et al. (2002). Site-specific nutrient management for intensive rice cropping systems in Asia, Field Crops Research. Field Crops Research. 74, 37–66. doi: 10.1016/S0378-4290(01)00197-6
Duan Y. H., Shi X. J., Li S. L., Sun X. F., and He X. H. (2014). Nitrogen use efficiency as affected by phosphorus and potassium in long-term rice and wheat experiments. J. Integr. Agriculture. 13, 588–596. doi: 10.1016/S2095-3119(13)60716-9
Effa K., Muleta D. F., Nigussie M., Geleti D., Abebe N., Dechassa N., et al. (2023). The irrigated wheat initiative of Ethiopia: a new paradigm emulating Asia’s green revolution in Africa. Environment Dev. Sustainability. doi: 10.1007/s10668-023-03961-z
Erkossa T., Laekemariam F., Abera W., and Tamene L. (2022). Evolution of soil fertility research and development in Ethiopia: From reconnaissance to data-mining approaches. Exp. Agriculture. 58, 1–13. doi: 10.1017/S0014479721000235
EthioSIS (2014). Soil fertility status and fertilizer recommendation atlas for amhara regional state, Ethiopia (Addis Ababa: Ethio SIS).
FAO (2006). Plant nutrition for food security: A guide for integrated nutrient management (Rome, Italy: FAO).
FAOSTAT (2020). Database of agricultural production (Rome: Food and Agriculture Organization of the United Nations). Available at: http://faostat.fao.org/default.aspx.
Fekadu E., KIbret K., Bedadi B., and Melese A. (2017). Characterization and classification of soils of Yikalo Subwatershed in Lay Gayint District, Northwestern Highlands of Ethiopia. Eurasian J. Soil Sci. 2018 7, 151–166. doi: 10.18393/ejss.376267
G/Selassie Y. (2002). Selected chemical and physical characteristics of soils of adet research center and its testing sites in north-western Ethiopia. Ethiop J. Natl. Resour 4, 199–215.
Getinet H., Abera K., and Lulie B. (2024). Identifying limiting nutrients for wheat production through omission plot experiment on nitisols of east gojjam zone, north western Ethiopia. Am. J. Appl. Sci. Res. 10. doi: 10.11648/j.ajasr.20241003.12
Global yield gap atlas (GYGA). Available online at: https://www.yieldgap.org/gygaviewer/index.html (Accessed 26 Feb 2025).
Gorfu A., Taa A., Tanner D. G., and Mwangi W. (1991). On-farm research to derive fertilizer recommendations for small-scale bread wheat production: methodological issues and technical results. Research report no. 14 (Addis Ababa, Ethiopia: IAR), 37p.
Havlin J. L., Beaton J. D., Tisdale S. L., and Nelson W. L. (1999). Soil fertility and fertilizers: an introduction to nutrient management. 6th Edition (Upper Saddle River: Prentice Hall).
Hazelton P. and Murphy B. (2007). What do all the numbers mean? A guide to the interpretation of soil test results. 2nd ed (CSIRO Publishing), 152.
Janssen B. H., Guiking F. C. T., van der Eijk D., Smaling E. M. A., Wolf J., and van Reuler H. (1990). A system for quantitative evaluation of the fertility of tropical soils. Geoderma 46, 299–318. doi: 10.1016/0016-7061(90)90021-Z
Jones J. B. (2003). Agronomic handbook: Management of crops, soils, and their fertility (Boca Raton, FL: CRC Press LLC), 482.
Ladha J. K., Pathak H., Krupnik T. J., Six J., and van Kessel C. (2005). Efficiency of fertilizer nitrogen in cereal production: Retrospects and prospects. Adv. Agr 87, 85–156. doi: 10.1016/S0065-2113(05)87003-8
Landon J. R. (1991). Booker tropical soil manual: A handbook for soil survey and agricultural land evaluation in the tropics and subtropics. Booker tate limited (Harlow: Oxon, Longman Scientific & Technical), 474 p.
Limin C., Ping H., Mirasol F. P., Adrian M. J., Jiyun J., Xinpeng X., et al. (2013). Establishing a scientific basis for fertilizer recommendations for wheat in China: Yield response and agronomic efficiency. Field Crops Res. 140, 1–8. doi: 10.1016/j.fcr.2012.09.020
Mengel K. and Kirkby E. A. (1996). Principles of plant nutrition (New Delhi: Panama Publishing Corporation), 314.
Sanchez P. A. (2002). Soil fertility and hunger in Africa. Policy forum. 295, 2019–2020. doi: 10.1126/science.1065256
Sileshi G. W., Kihara J., Tamene L., Vanlauwe B., Phiri E., and Jama B. (2022). Unravelling causes of poor crop response to applied N and P fertilizers on African soils (Experimental Agriculture). doi: 10.1017/s0014479721000193
Silva J. V., Pytrik R., Frédéric B., Jaleta M., Tesfaye K., and Martin K. (2021). Wheat yield gaps across smallholder farming systems in Ethiopia. Agron. Sustain. Dev. 41, 12. doi: 10.1007/s13593-020-00654-z
Sisay M. G., Tsegaye E. A., Tolossa A. R., Jan N., Amaury F., Eric V. R., et al. (2023). Soil forming factors of high-altitude mountains along the east-africa rift valley: the case of the mount guna volcano (Ethiopia). doi: 10.20944/preprints202312.0311.v1
Stoorvogel J. J., Smaling E. M. A., and Janssen. B. H. (1993). Calculating soil nutrient balances in Africa at different scales. Fertil. Res. 35, 227–235. doi: 10.1007/BF00750641
Tadesse W., Gashaw A., and Mohammed H. (2019). Wheat productivity under smallholder farming systems in Ethiopia: Challenges and opportunities. Afr. J. Agric. Res. 14, 647–657.
Tadesse W. and Solomon G. (2018). Agricultural extension services and infrastructure development in Farta District. Ethiopian J. Rural Dev. 7, 55–66.
Taye A. (2017). Impact of climate and topography on agriculture in the Amhara region. J. Ethiopian Climate Stud. 3, 100–110.
Tefera M., Haile G., and Yilma Z. (2019). Soil erosion and conservation in the Ethiopian highlands: The case of Mount Guna. Environ. Res. J. 14, 250–260.
Xu X., He P., Pampolino M. F., Johnston A. M., Qiu S., Zhao S., et al. (2014). Fertilizer recommendation for maize in China based on yield response and agronomic efficiency. Field Crops Res. 157, 27–34. doi: 10.1016/j.fcr.2013.12.013
Yirga C. and Alemu D. (2016). Adoption of crop technologies among smallholder farmers in Ethiopia: implications for research and development. Ethiop. J. Agric. Sci., 1–16.
Yirga C., Tesfaye A., Agegnehu G., Keneni G., Kassa B., and Asefa G. (2002). “Crop-livestock farming systems of the highlands of Welmera Wereda: the case of Welmera Goro bench-mark site,” in Towards farmers’ Participatory research: attempts and achievements in the central highlands of Ethiopia. Proceedings of client-oriented research evaluation workshop, 16–18 October 2001. Eds. Keneni G., Gojjam Y., Bedane K., Yirga C., and Dibabe A. (Holetta Agricultural Research Center, Holetta, Ethiopia), 147–174.
Keywords: site-specific, yield gap, yield-limiting nutrient, yield response, wheat
Citation: Asfaw AG, Gelagil DB, Abebe GY, Woldie WG and Getahun TM (2025) Yield-limiting nutrients for wheat (Triticum aestivum L.) production in Farta to Lay Gayint districts of the Amhara Region in Northwest Ethiopia. Front. Agron. 7:1541332. doi: 10.3389/fagro.2025.1541332
Received: 07 December 2024; Accepted: 15 April 2025;
Published: 27 May 2025.
Edited by:
Marloes van Loon, Wageningen University and Research, NetherlandsReviewed by:
Blessing Nyamasoka-Magonziwa, University of Zimbabwe, ZimbabweSuresh Kumar Malhotra, ICAR- Directorate of Knowledge Management in Agriculture, India
Copyright © 2025 Asfaw, Gelagil, Abebe, Woldie and Getahun. This is an open-access article distributed under the terms of the Creative Commons Attribution License (CC BY). The use, distribution or reproduction in other forums is permitted, provided the original author(s) and the copyright owner(s) are credited and that the original publication in this journal is cited, in accordance with accepted academic practice. No use, distribution or reproduction is permitted which does not comply with these terms.
*Correspondence: Abebe Getu Asfaw, YWJlZ2V0dTNAZ21haWwuY29t