 Elizabeth Oys
 Fernanda Souza Krupek1,2
 Christopher Proctor
 Katja Koehler-Cole
 Andrea Basche
- 1Department of Agronomy and Horticulture, University of Nebraska-Lincoln, Lincoln, NE, United States
- 2Department of Horticulture and Crop Science, The Ohio State University, Wooster, OH, United States
- 3Nebraska Extension, University of Nebraska-Lincoln, Mead, NE, United States
Over the last several decades, the intensive production of corn (Zea mays L.) and soybeans (Glycine max L.) in the United States has included the widespread use of herbicide-tolerant crops, contributing to soil management with reduced tillage. The continuous use of herbicides with the same modes of action has led to the accelerated development of herbicide resistance in weed populations, particularly from the Amaranthaceae family. Integrated weed management tools, such as the use of cover crops, have increasingly been recognized as cultural approaches with the potential to reduce herbicide-driven selection pressure. We utilized six multi-year (4–7 years) cover crop research trials in corn-based crop rotations to measure germinable weed seedbanks, aboveground weed density, and biomass. This included four on-farm and two university research experiments across eastern and central Nebraska, with histories of no tillage or reduced tillage. Three sites showed increases in Amaranthaceae family (pigweed) seedbank densities under cover crops (137%–355%) compared to the no cover crop check, but no differences in total weed seed bank densities were found. Cover crops reduced aboveground total weed density and biomass at the two sites; however, increases from the pigweed seedbank were not observed at any site. Multivariate analyses revealed that the species composition of the seedbanks under cover crops was distinct from that of the check at the two sites, suggesting that cover crops may influence weed seedbank composition over time. This work underscores the value of exploring integrated weed management, as well as monitoring weed populations in the soil seedbank and aboveground emerged species, particularly in cropping systems with reduced soil disturbance. We encourage more research on the multi-year use of integrated weed management approaches, such as cover crops, to better understand the complexity of how such approaches shift weed communities, especially with respect to herbicide-resistant weeds.
1 Introduction
Corn (Zea mays L.) and soybeans (Glycine max L.) are the most widely grown field crops in the United States and their production is concentrated in the Upper Midwestern “Corn Belt.” Globally, the United States accounts for 31% of the production of both corn and soybeans (USDA and FAS, 2022), and this intensive production has led to advanced systems for pest management. Approximately 85% of all corn and 96% of all soybeans planted in the Corn Belt are genetically engineered (GE) hybrids or cultivars with stacked tolerance traits for herbicide and insect resistance (USDA ERS, 2022). The continuous use of herbicides in the same mode or site of action to complement these trait platforms reduces herbicide diversity and increases the risk of herbicide resistance (HR) development in weeds (Jhala et al., 2014). Instances of multiple resistance, in which weed populations are resistant to more than one unique site of action, are particularly troubling because they further reduce viable herbicide options.
Herbicide-resistant weeds have been a global challenge for decades, and the rate of HR has accelerated since the introduction of GE herbicide-tolerant crops, such as glyphosate-tolerant (RoundUp Ready) crops, in the mid-1990s (Peterson et al., 2018). Glyphosate has become the most widely used herbicide, and its use has increased approximately 100-fold since its release to farmers in 1974 (Myers et al., 2016). Herbicide resistance reports in the Corn Belt have surmounted to 236 since 1985, 81 of which were Amaranthaceae weeds primarily found in corn and soybean systems (Heap, 2025), with glyphosate resistance comprising 38% of the Amaranthaceae resistance. Over the last several decades, increased reliance on glyphosate has also decreased its weed control efficacy across dozens of experiments (Landau et al., 2023).
The utilization of herbicide-tolerant crops has also enabled growers to shift away from mechanical weed management, and no-tillage and reduced-tillage systems have been widely adopted, especially in dryland acres, due to concerns of soil erosion and maintenance of soil moisture (Bekele, 2020). The most recent Census of Agriculture calculated that 4.1 million hectares of cropland in Nebraska were under no-tillage practices and an additional 2.1 million hectares were under reduced or conservation tillage practices (USDA and NASS, 2024). Eliminating or reducing tillage shifts weed management to depend primarily on cultural and chemical methods such as crop rotation and the use and proper timing of herbicides (Huggins and Reganold, 2008), and shifting selection pressures towards herbicides increases the risk of HR over time (Owen, 2016).
The rapid spread of HR weeds has increased interest and attention towards integrated weed management approaches, in which multiple cultural, mechanical, biological, and chemical weed control tactics are integrated into a single weed management program (Gage and Schwartz-Lazaro, 2019). Although integrated weed management tactics span a wide range of options and complexity, cover cropping is a soil conservation tool that can be adapted to meet different production systems and goals. According to a national survey of cover crop users in 2019, 64% of surveyed farmers had herbicide-resistant weeds on their farms, with 91% reporting improvements in weed control during the growing season following a cereal rye cover crop (Smith, 2020). Cover crops are a cultural and biological approach that provides a method of weed suppression through mechanisms such as allelopathy, interplant competition, and microenvironmental changes, which potentially impact weed density or biomass while the cover crop is living and after termination, and the effects may persist into subsequent growing seasons (Kruidhof et al., 2008; Liebman et al., 2021a; Osipitan et al., 2018; Rueda-Ayala et al., 2015). Integrating targeted herbicide management with cover crops in corn-soybean systems has shown potential for effective aboveground weed management (Grint et al., 2022; Yenish et al., 1996; Bunchek et al., 2020).
Much of the prior research has focused on cover crop-weed interactions at or above the soil surface, in which biomass production is generally understood to be critical for maximizing antagonistic effects between plant species and reducing aboveground weed pressure. However, little is known about the ability of cover crops to alter weed seedbanks and their environment, influencing weed survival, dormancy, and germination, which are influenced by multiple factors other than cover crop biomass alone (Sias et al., 2021). To better understand these processes both at the on-farm (e.g., production scale) and on-station (e.g., small-plot trial) levels, we conducted an in-depth assessment of weed communities, measuring both weed seedbanks and aboveground weeds, at six sites in eastern and central Nebraska with multiple years of cover cropping and reduced or no tillage history. The objectives of our study were to 1) quantify and characterize the germinable weed seedbank size and composition, and 2) measure and characterize aboveground weed density and biomass in six multi-year experiments across eastern and central Nebraska in the Western US Corn Belt. We hypothesized that cover crops would reduce both weeds found in the soil seedbank, as well as aboveground in-season weed density and biomass.
2 Materials and methods
2.1 Experimental sites and management
Six multi-year experiments across eastern and central Nebraska in 2021 were used in this study. Cover crop experiments were initiated in 2014 at the University of Nebraska, Lincoln South-Central Agriculture Laboratory (SCAL) and the Eastern Nebraska Research, Extension, and Education Center (ENREEC). Four other locations were commercial on-farm sites in eastern and central Nebraska, initiated in 2016 or 2017 in Colfax, Greeley, Howard, and Merrick Counties. On-farm studies were initiated in partnership with the Natural Resources Conservation Service (USDA-NRCS) as part of the Soil Health Initiative (SHI), launched in 2016 to conduct field-scale cover crop trials for soil conservation purposes (Krupek et al., 2019).
The university experimental station sites utilized a randomized complete block design with cover crop treatments of cereal rye (Secale cereale L.), hairy vetch (Vicia villosa Roth), and no cover crop (check) at SCAL (n = 3 replicates), and cereal rye (S’ cereale L.) and no cover crop (check) at ENREEC (n = 3 replicates). On-farm locations utilized treatments of a multi-species cover crop mix consisting of 8 to 12 species depending on the site (Table 1) and no cover crop (n = 4 replicates). The spatial scales for plots differed between on-farm and research stations, where on-farm plots were at least 16 hectares and research station plots were at least 0.004 hectares (Table 1). Cover crops were planted in late summer or fall at all sites and terminated with herbicides in spring before cash crop planting (Supplementary Table S1). The research stations had a crop rotation history consisting of a corn–soybean rotation since the establishment of the trials, whereas on-farm locations were primarily corn–soybean rotations but were diversified with a small grain or cool-season legume in 2020, followed by late summer planted cover crop mixes prior to data collection in 2021 (Table 1). All sites were under no-tillage, except for the Merrick County location, which utilized strip tillage. Such differences in field history allowed us to quantify weed dynamics in cover crops versus checks (no cover crops) across a diversity of scenarios, highlighting possible alternatives for the incorporation of cover crops into cropping systems in Eastern and Central Nebraska. In 2021, five of the six sites grew corn, and the Greeley County location grew soybeans as cash crops (Table 1, Supplementary Table S1).
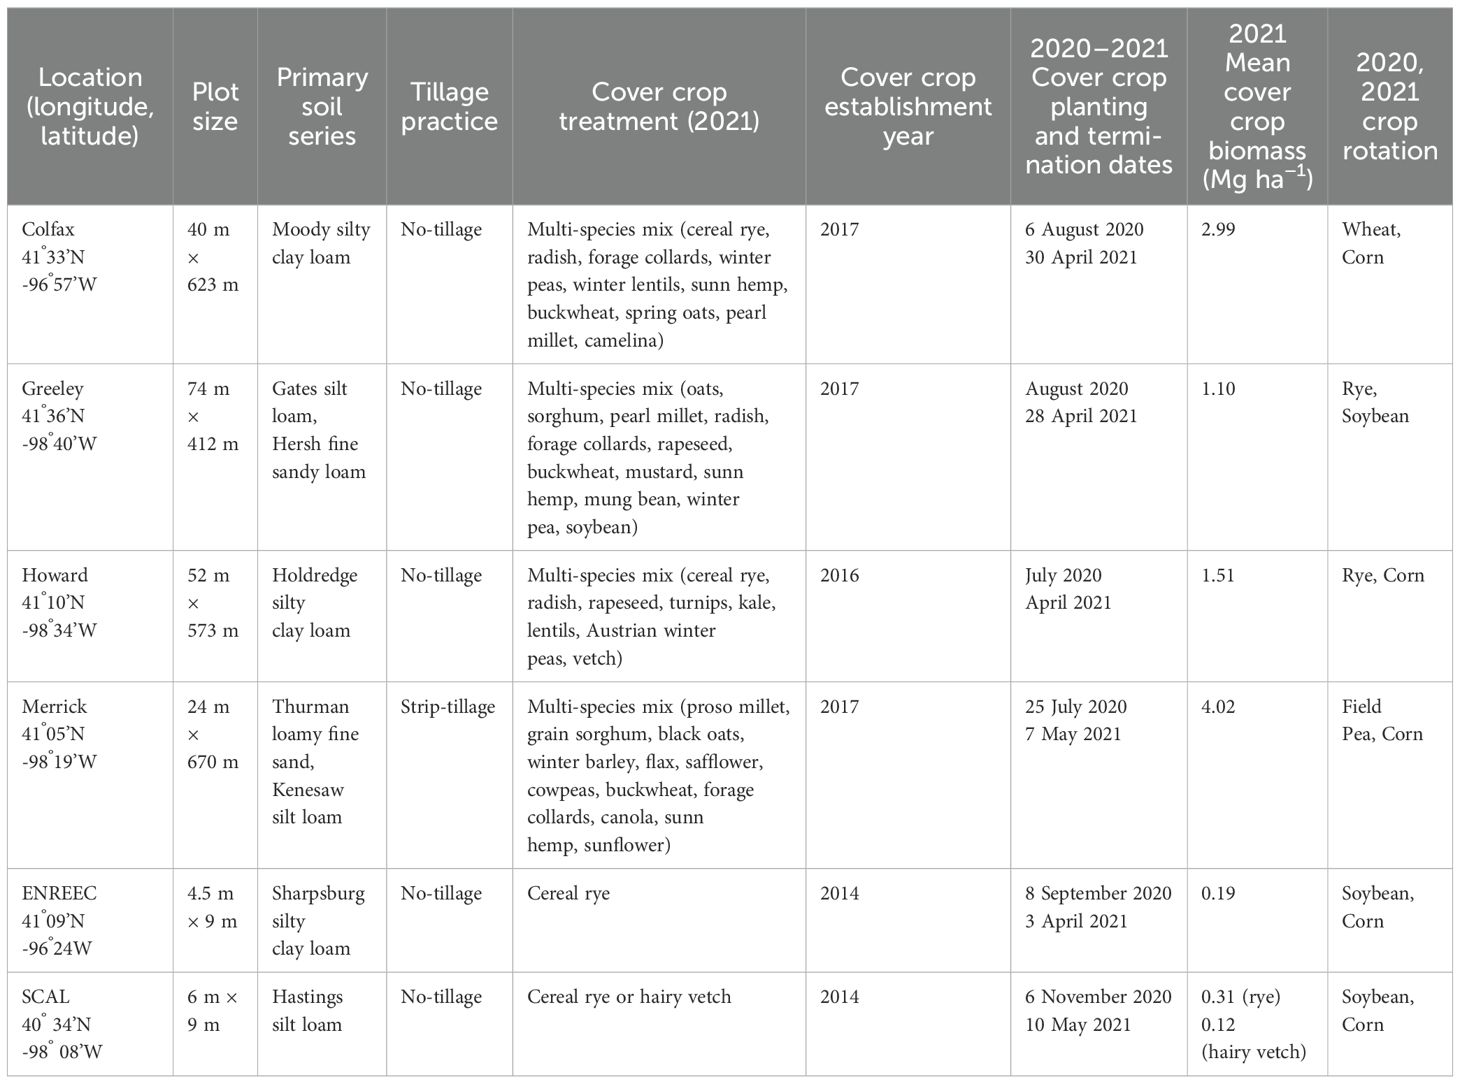
Table 1. Site and management information for the four on-farm and two university experiments.
2.2 Weed seedbank assessment
2.2.1 Soil seedbank sampling
In no-tillage systems, approximately 74% of the weed seedbank is concentrated in the upper 5 cm of the soil profile in silty loam soils (Buhler et al., 1997; Clements et al., 1996). Larger seeded species can emerge from greater burial depths, but emergence typically does not occur at depths greater than 8 cm (Grundy et al., 2003). Therefore, we assumed that the germinable seedbank would be no deeper than 10 cm at our sites with no tillage and strip tillage. Additional literature shows that mixing 20 soil subsamples into one composite sample will provide a sufficient estimation of the fields’ seedbank density (Gross, 1990), assuming average seedbank densities under row-cropped systems (Nichols et al., 2020b). Thus, to account for the spatial distribution of weeds (Cardina et al., 1997) and the number of subsamples (Colbach et al., 2000), we collected 20 random soil subsamples at a 10-cm depth which were composited for soil seedbank germination. The composite samples were stored in air-tight plastic bags in coolers before being transported to a refrigerator for 12 h–48 h at 0°C, prior to greenhouse processing.
Seedbank sampling was conducted in April 2021, at least three days before cover crop termination and cash crop planting. At SCAL and ENREEC, a JMC® soil probe (PN031 JMC 91-cm or 36-inch sampler) was used to collect 1,583 cm3 of soil volume per composite sample. At the four on-farm locations, 8,260 cm3 of soil volume per composite sample was used to account for greater plot size and spatial variability than expected in the research station plots.
2.2.2 Germination of the soil seedbank
This study utilized the germination method for seedbank quantification, which allows for a more precise assessment of seedbank composition by identifying viable seedlings by species (Gross, 1990). Composite soil samples were sieved through a wire screen (MTN Gearsmith ½” Classifier Sifting Pan) with a sieve size of 1.61 cm2 to remove any live plant matter (e.g., roots, foliage), insects, and disaggregate large soil clods. After sieving, each sample was thoroughly mixed and laid into growing trays (27.8 cm W × 54.5 cm L × 6.2 cm D). The soil within the trays was approximately three cm depth. Trays were watered twice daily and monitored to prevent oversaturated soil conditions that might induce seed decay over time. Greenhouse temperatures were typically maintained at approximately 25°C, but mid-summer daytime highs increased the maximum greenhouse temperatures up to 40°C. Trays received 11 h–16 h of natural sunlight daily and were supplemented with timed grow lights after sunset for 6 h–8 h depending on the time of the year.
Germinated seedlings were identified by species, counted, and discarded to allow seedlings to emerge without shading effects from other weeds. Identification was performed daily when germination rates were high and less frequent (i.e., once per week) as germination rates slowed. Approximately five days after seedlings ceased to emerge, all trays were dried for five days in the greenhouse, soil was resieved, and watering resumed. Resieving occurred in July and September for a total of three rounds of germination between April and October 2021. After the third round of germination, few seedlings germinated, and soil was disposed five days after the last weed emerged in early November 2021. The identified weed species were classified according to Gleason and Cronquist (1991).
2.3 Aboveground cover crop and weed sampling
The aboveground weed biomass and density were monitored during the 2021 growing season. Prior to cover crop termination in early spring 2021, the cover crop biomass was collected. At the research stations, cover crop biomass was obtained randomly two times per replicate in a 0.45 m2 quadrat. At on-farm sites, cover crop biomass was obtained two to three times per replicate (an approximate rate of one sample per hectare) using 0.5 m2 quadrats. All biomass samples were dried at 50°C until a constant weight was achieved, and then weighed and converted to Mg dry plant matter (DM) ha−1.
Aboveground weed observations were taken two times during the growing season: 1) after cash crop emergence (VE stages for corn and soybean) but before post-emergence (POST) herbicide applications were made (‘early sampling’), and 2) 3–4 weeks after POST and before canopy closure (‘late sampling’). The herbicides applied at each site are shown in Supplementary Table S1. Weed density and biomass samples were collected three times per replicate during both assessments (Supplementary Table S2).
Weed density was calculated by counting the number of weeds that emerged in a quadrat (0.25 m2 at research stations, 1 m2 at on-farm sites). Weed biomass was collected in a separate quadrat at least one meter north (early sampling) or south (late sampling), so that weed density data would not be affected by the removal of weed seedlings. Weed biomass was obtained by clipping seedlings at the soil surface and drying the biomass at 50°C for five days until a constant weight was achieved and converted to grams DM m−2. Once samples were obtained, the locations of the weed density quadrates were marked with flags and GPS points to return to the exact location for the late sampling period. Samples were categorized by pigweeds, grasses, and all other broadleaves, with the total representing the sum of the three categories.
2.4 Data analysis
For seedbank size, composition, and diversity indices, as well as aboveground weed analyses, we considered significance at p <0.1 level to assess treatment differences. Given the larger nature of the experimental units included in on-farm research, it is common to consider greater value range for significance because there is expected to be greater variability (University of Nebraska Extension, 2023). Additionally, a greater statistically significant cutoff range is accepted in weed science to consider biologically relevant results in scenarios such as larger experimental units (Onofri et al., 2010).
2.4.1 Seedbank size and composition
All statistical data analyses were conducted using R 4.1.2 (R Core Team, 2022). Seedbank density data (e.g., total seedbank density and subcategory densities of pigweeds, grasses, and all other broadleaves) were converted to estimates of seeds m-2 based on the number of subsamples and subsample equipment size and analyzed using a univariate approach. The initial distribution of the measured seedbank density data exhibited overdispersion and skewness. Therefore, we utilized a generalized linear mixed-effects model (Bolker et al., 2009) with a log-linked negative binomial distribution using the glmer.nb function from the lme4 package (Bates et al., 2015). Treatment, site, and their interactions were considered fixed effects, and replicates nested with site were included as random effects to account for variability between replicates within each site. Because the site had a significant effect and there were confounding differences in field history, management, and herbicides, the results are reported on an individual site basis. Pairwise comparisons were conducted by calculating the least-squares means and contrasts were determined using the emmeans package (Lenth et al., 2021). 2.4.2 Nonmetric multidimensional scaling
Using a multivariate approach, seedbank community composition was compared between treatments within each site using non-metric multidimensional scaling (NMDS) with the vegan package (Oksanen et al., 2019). NMDS analysis helps to visually display similarities among treatment communities in the ordination space. The distance between points, calculated using Bray-Curtis distances, represents the dissimilarity among the treatment communities. Stress values were used to assess goodness-of-fit, and hulls were added to the plots to show possible overlap among the treatment communities. This helps visualize whether communities within each treatment are unique from one another. Species that made up less than 0.1% of the total seedbank at each site were removed prior to NMDS (Poos and Jackson, 2012).
2.4.3 Seedbank community analyses
Species richness, evenness, and Shannon diversity were used as diversity and population metrics and were analyzed using the vegan package (Oksanen et al., 2019). Species richness refers to the total number of species present, whereas evenness refers to the distribution of individuals of each species present in the community, with values ranging from 0 to 1. Shannon diversity, interpreted as the effective number of species in a community, was determined using the exponential of Shannon diversity (Hill, 1973; Jost, 2006), with the following equation:
Where S represents species richness, i represents one unique species from the community, and pi represents relative abundance of the ith species. Species evenness was determined as , also known as Pielou’s evenness. Metrics were assessed using a linear mixed-effects model with the lme4 package (Bates et al., 2015), and pairwise comparisons were performed using the emmeans package (Lenth et al., 2021).
2.4.4 Aboveground weed analyses
Weed density data were converted to estimates of weeds m−2 and weed biomass data were converted to estimates of grams DM m−2 before analyses. Both datasets of weed density and weed biomass exhibited right skewness due to inflation of counts of zero weeds or measurements of zero grams DM. In response, the data were ln(x + 1) transformed before being analyzed using a linear mixed-effect model, which was fit using the lmer function from the lme4 package (Bates et al., 2015). The main effects and all two- and three-way interactions between the treatment, site, and sampling period were used as fixed effects. Replicate nested within site and treatment nested within replicates and sites were included as random effects to account for variability between replicates and within replicates, respectively, with the residual variance accounting for the variation due to repeated measures over two different sampling periods. No correlation structure was included or necessary because there were only two sampling periods. Pairwise comparisons were conducted by calculating the least-squares means and contrasts were determined using the emmeans package (Lenth et al., 2021).
3 Results
3.1 Germinable weed seedbank size and composition
A total of 6,561 seedlings emerged from the seedbank germination assessment. Seedbank density ranged from 165 seedlings m−2 in the check at the Colfax County site to 4,180 seedlings m−2 in the cover crop at the Merrick County site (Figure 1). A total of 57 different species were identified, with large variability between sites. The most abundant weeds were summer annual weeds, with relatively similar abundances of C3 and C4 plants. Palmer amaranth (Amaranthus palmeri S. Watson) made up 20.1% of the total seedlings counted across all sites, followed by green foxtail (Setaria viridis (L.) P. Beauv.) at 13.1% (Table 2). The cover crop treatments had no influence on the total seedbank density at any site. However, when looking at different weed species, we found more pigweed species in the cover crop treatments than in the check treatments in Merrick County (p = 0.004), Greeley County (p = 0.05), and SCAL [cereal rye (p = 0.03) and hairy vetch cover crop (p = 0.09) treatments] (Figure 1). This represented 355%, 243%, 180%, and 137% increases from the check, respectively. A complete distinction (separation) of treatment species communities was observed in the NMDS analysis at the Merrick and Greeley County sites, where cover crop communities were primarily based on Amaranthus spp. Across most sites, the NMDS reflected that the cover crop community composition leaned towards Amaranthus spp., as found in the models, but no other trends towards one specific species or weed family were observed consistently across all sites (Figure 2). There were no statistical differences between cover crops and control treatments for species richness, evenness, and Shannon diversity, except for a reduction in evenness in the cover crop at the Merrick County site (Table 3).
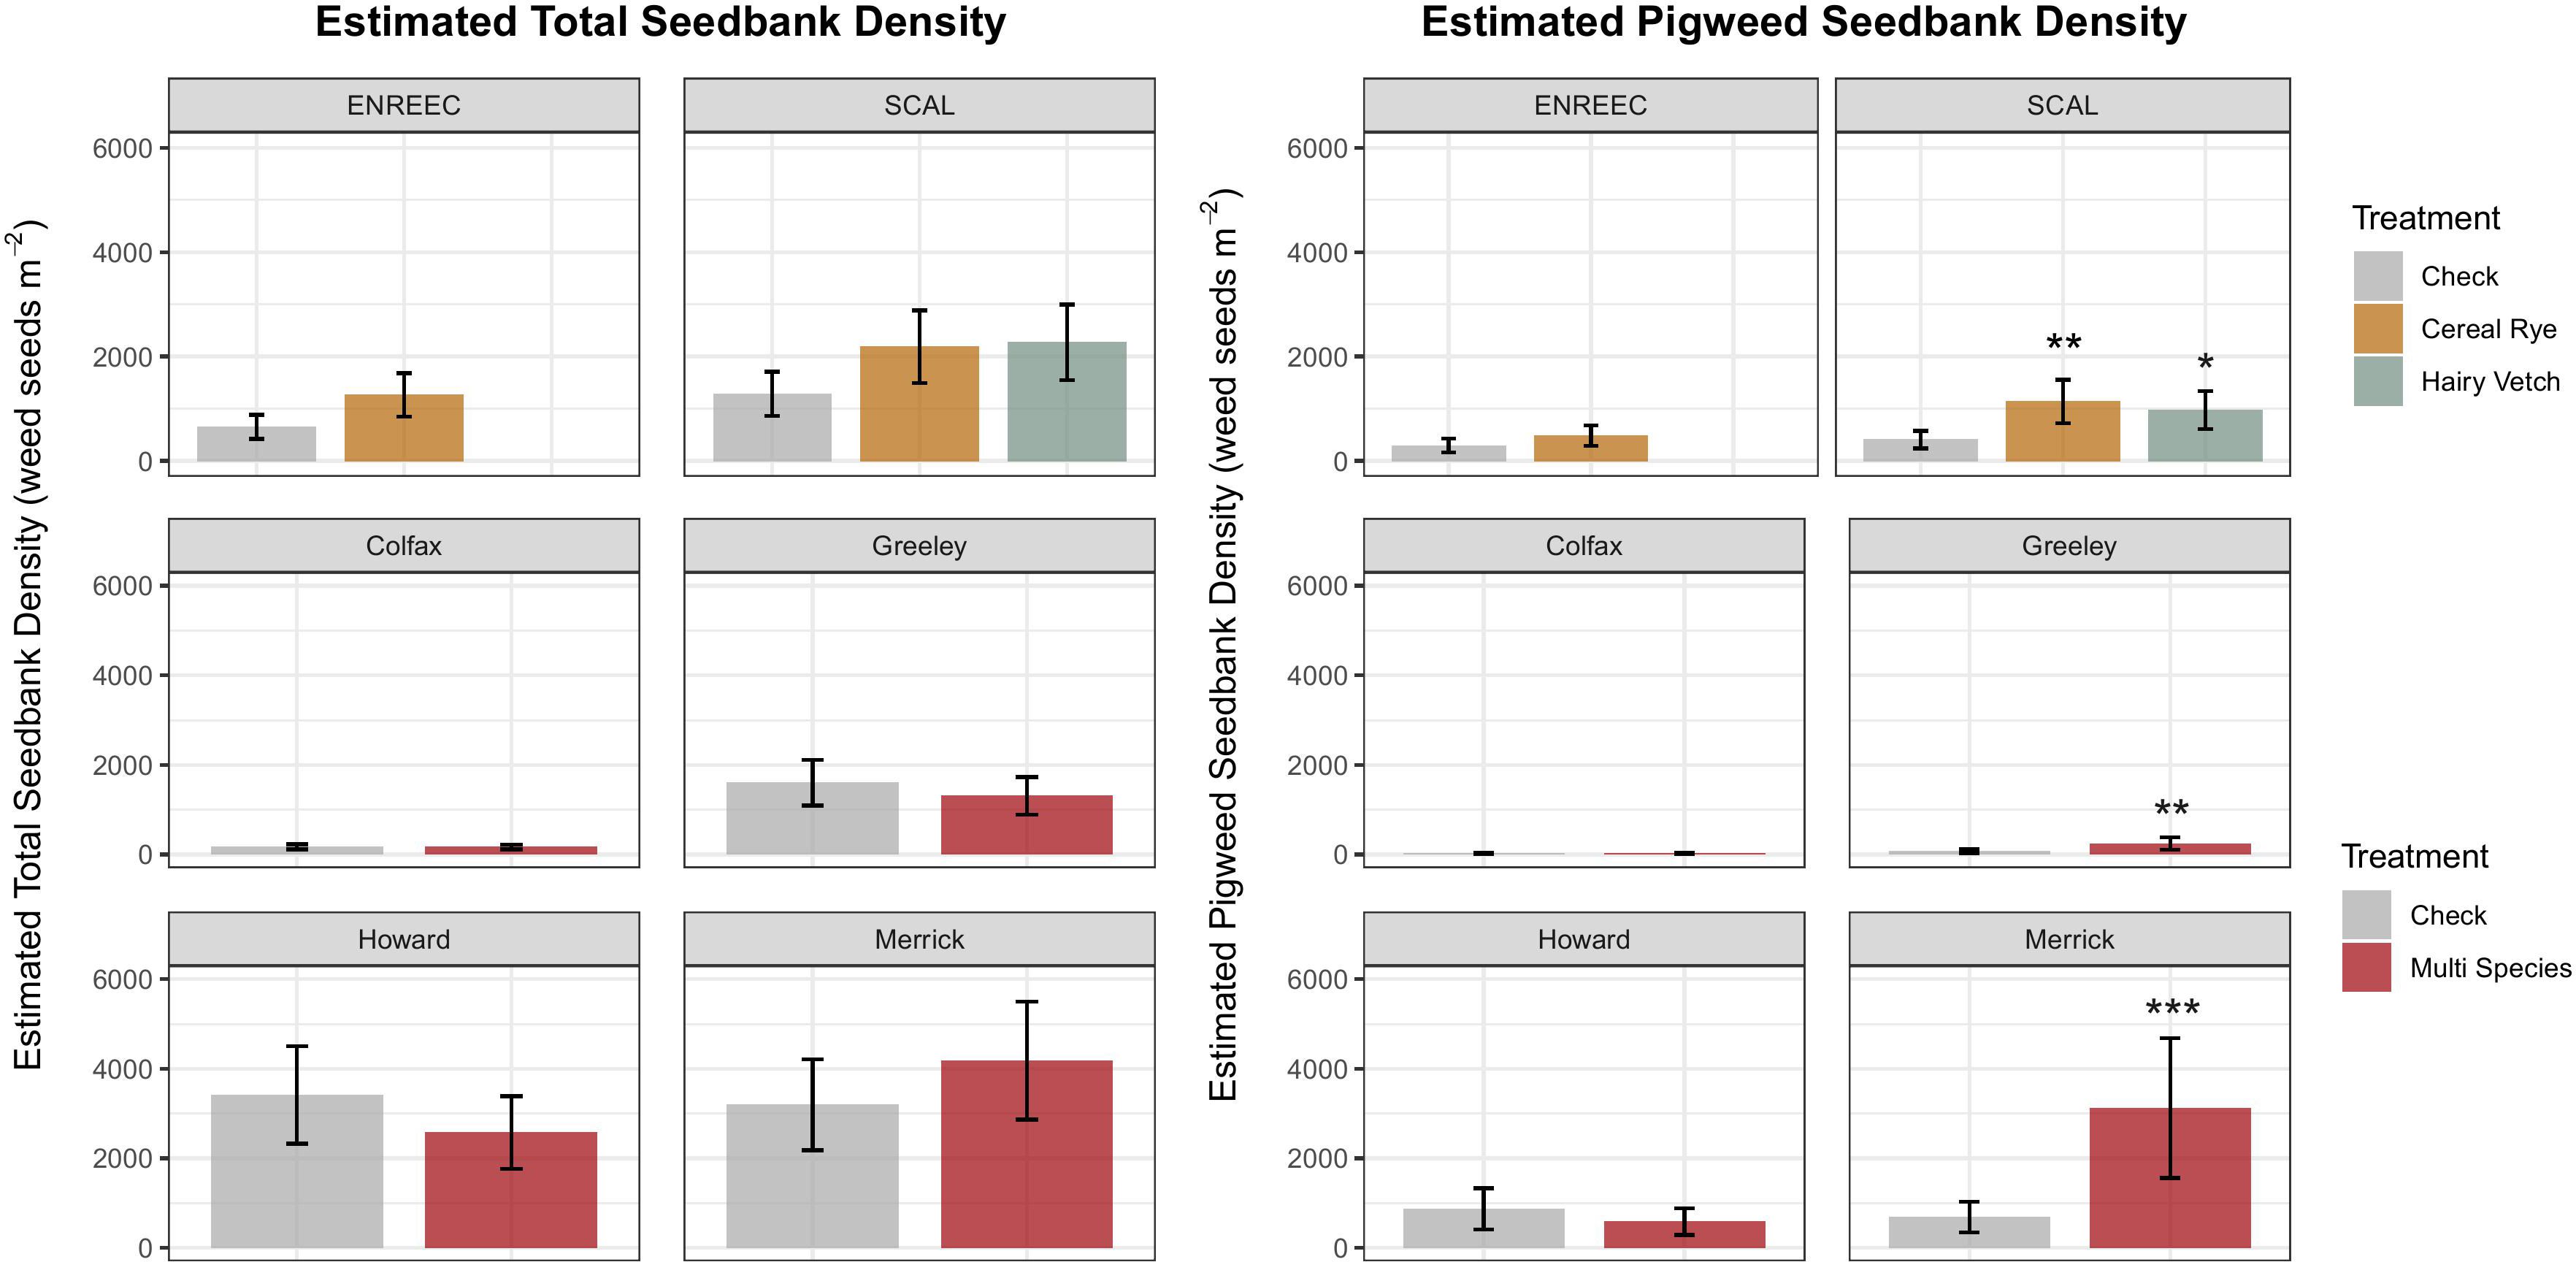
Figure 1. Total density of weed seeds and pigweed seeds emerging from the greenhouse study and six sites included in the analysis. Treatments differing from the check at a level of p<0.10 indicated by *p <0.05 indicated by **p <0.01 indicated by ***. Cover crops planted at the on-farm experiments included mixtures of multiple species as described in Table 1.

Table 2. Species composition and associated characteristics of emerged weeds expressed as percent of the total emerged weed seeds across all six sites included in the analysis.
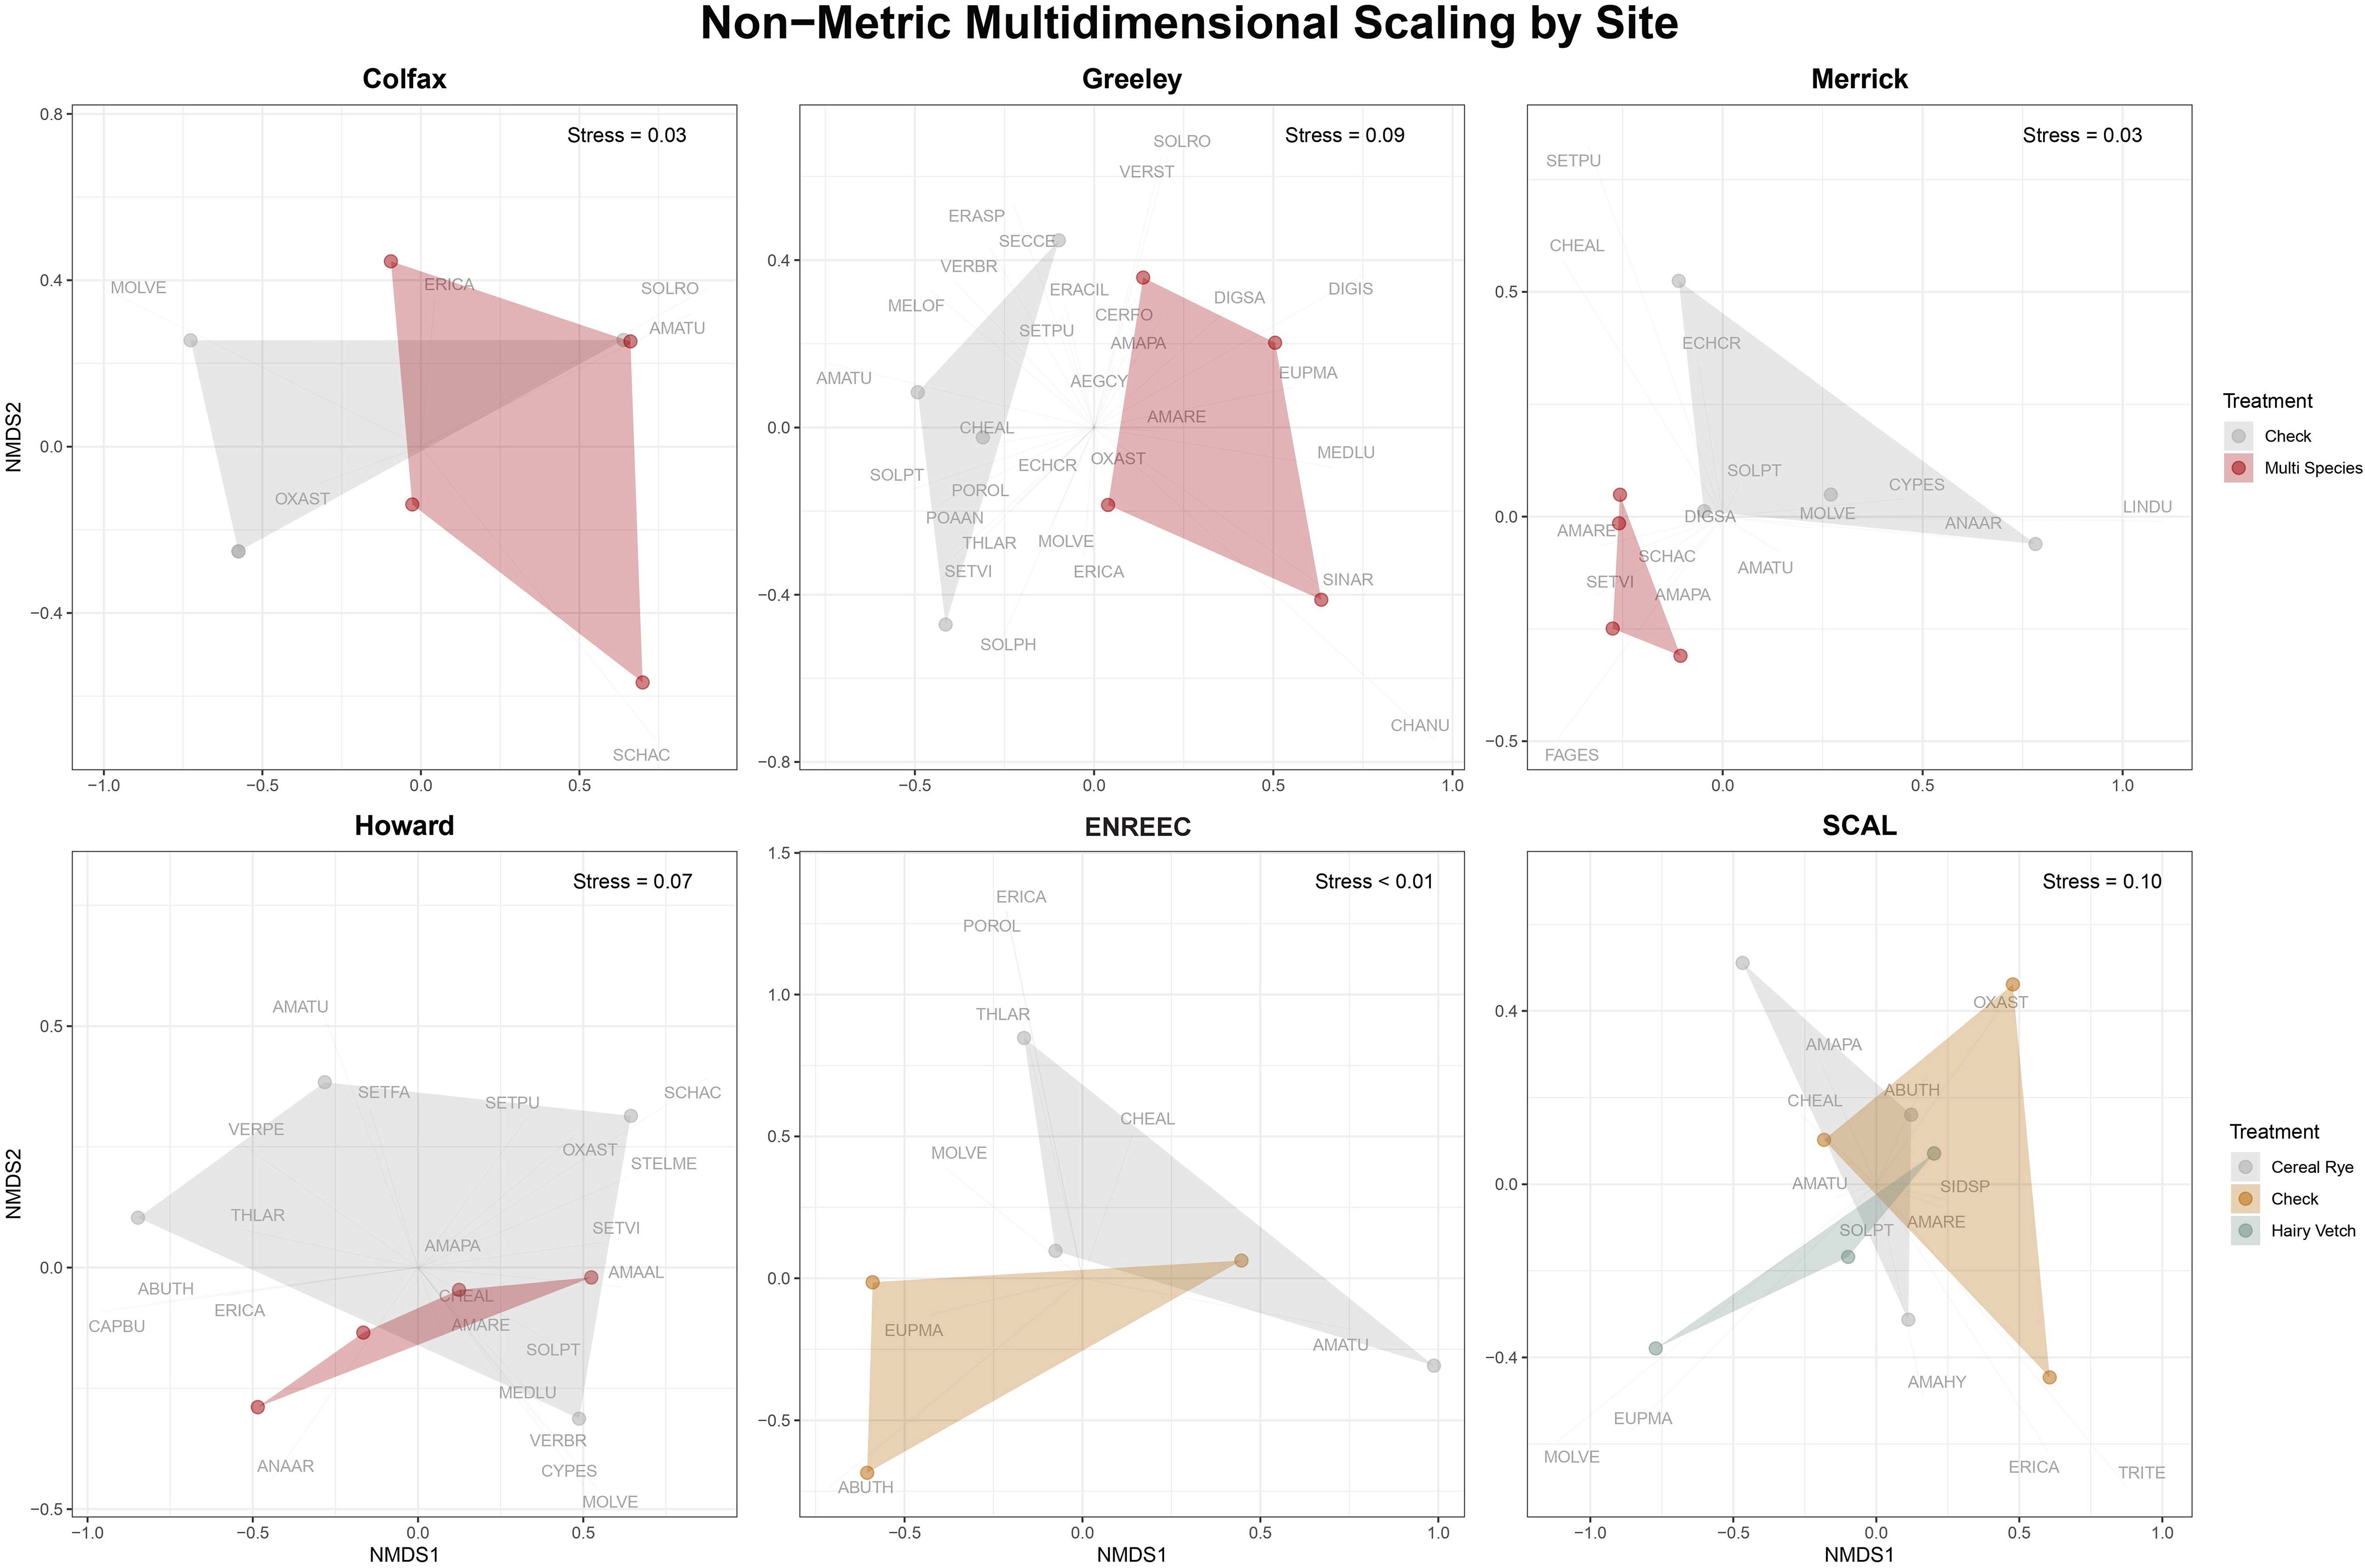
Figure 2. Non-Metric Multidimensional Scaling (NMDS) analysis broken out by the six sites included in the analysis. Overlap in the polygons represents similar weed species communities identified in the weed seedbank study (4/6 sites), while separation of polygons represents distinct weed species identified (2/6 sites). Weed species codes are found in Table 1.

Table 3. Diversity indices calculated for the six sites included in the analysis.
3.2 In-season aboveground assessments
3.2.1 Cover crop biomass
The amount of cover crop biomass at termination ranged from 0.11 Mg ha−1 to 4.02 Mg ha−1 (Table 1). On-farm locations with multi-species cover crop mixes accumulated more total biomass than research station locations with monocultures of rye and vetch, partly because the farms planted in late July and early August following small grain harvest, whereas the research stations planted in September and October (Table 1). Between September 2020 and August 2021, the average temperatures were similar or slightly cooler than the 30-year average, while precipitation between September and December 2020 was below normal. All experimental locations were classified as having moderate to severe drought conditions over multiple consecutive months during the fall of 2020 (National Drought Mitigation Center, 2024). Heavy precipitation occurred in March across all sites; however, in general, the growing season precipitation was less than the 30-year average at two sites during and near normal at four sites during the study period (HPRCC, 2022; Supplementary Table S3).
3.2.2 Weed density and biomass
The weed density measurements taken during the early and late growing seasons were site-specific. Despite increases in pigweed seed densities in the cover crop treatments at Merrick, Greeley, and SCAL, no differences in emerged pigweed densities were observed at any of the six sites compared with the control (Figure 3). At the Greeley County location, total weed densities (Figure 4) decreased in the cover crop treatment during early- (p = 0.05, -87%) and late season samples (p = 0.05, −89%). Late season total weed density reduction in the cover crop treatment also occurred in ENREEC (p = 0.09, −73%). In Greeley County, total weed density reductions in the cover crop treatment were primarily driven by reductions in emerged grasses in the early (p = 0.05, −90%) and late-season samples (p = 0.09, −88%) (Supplementary Figure S1).
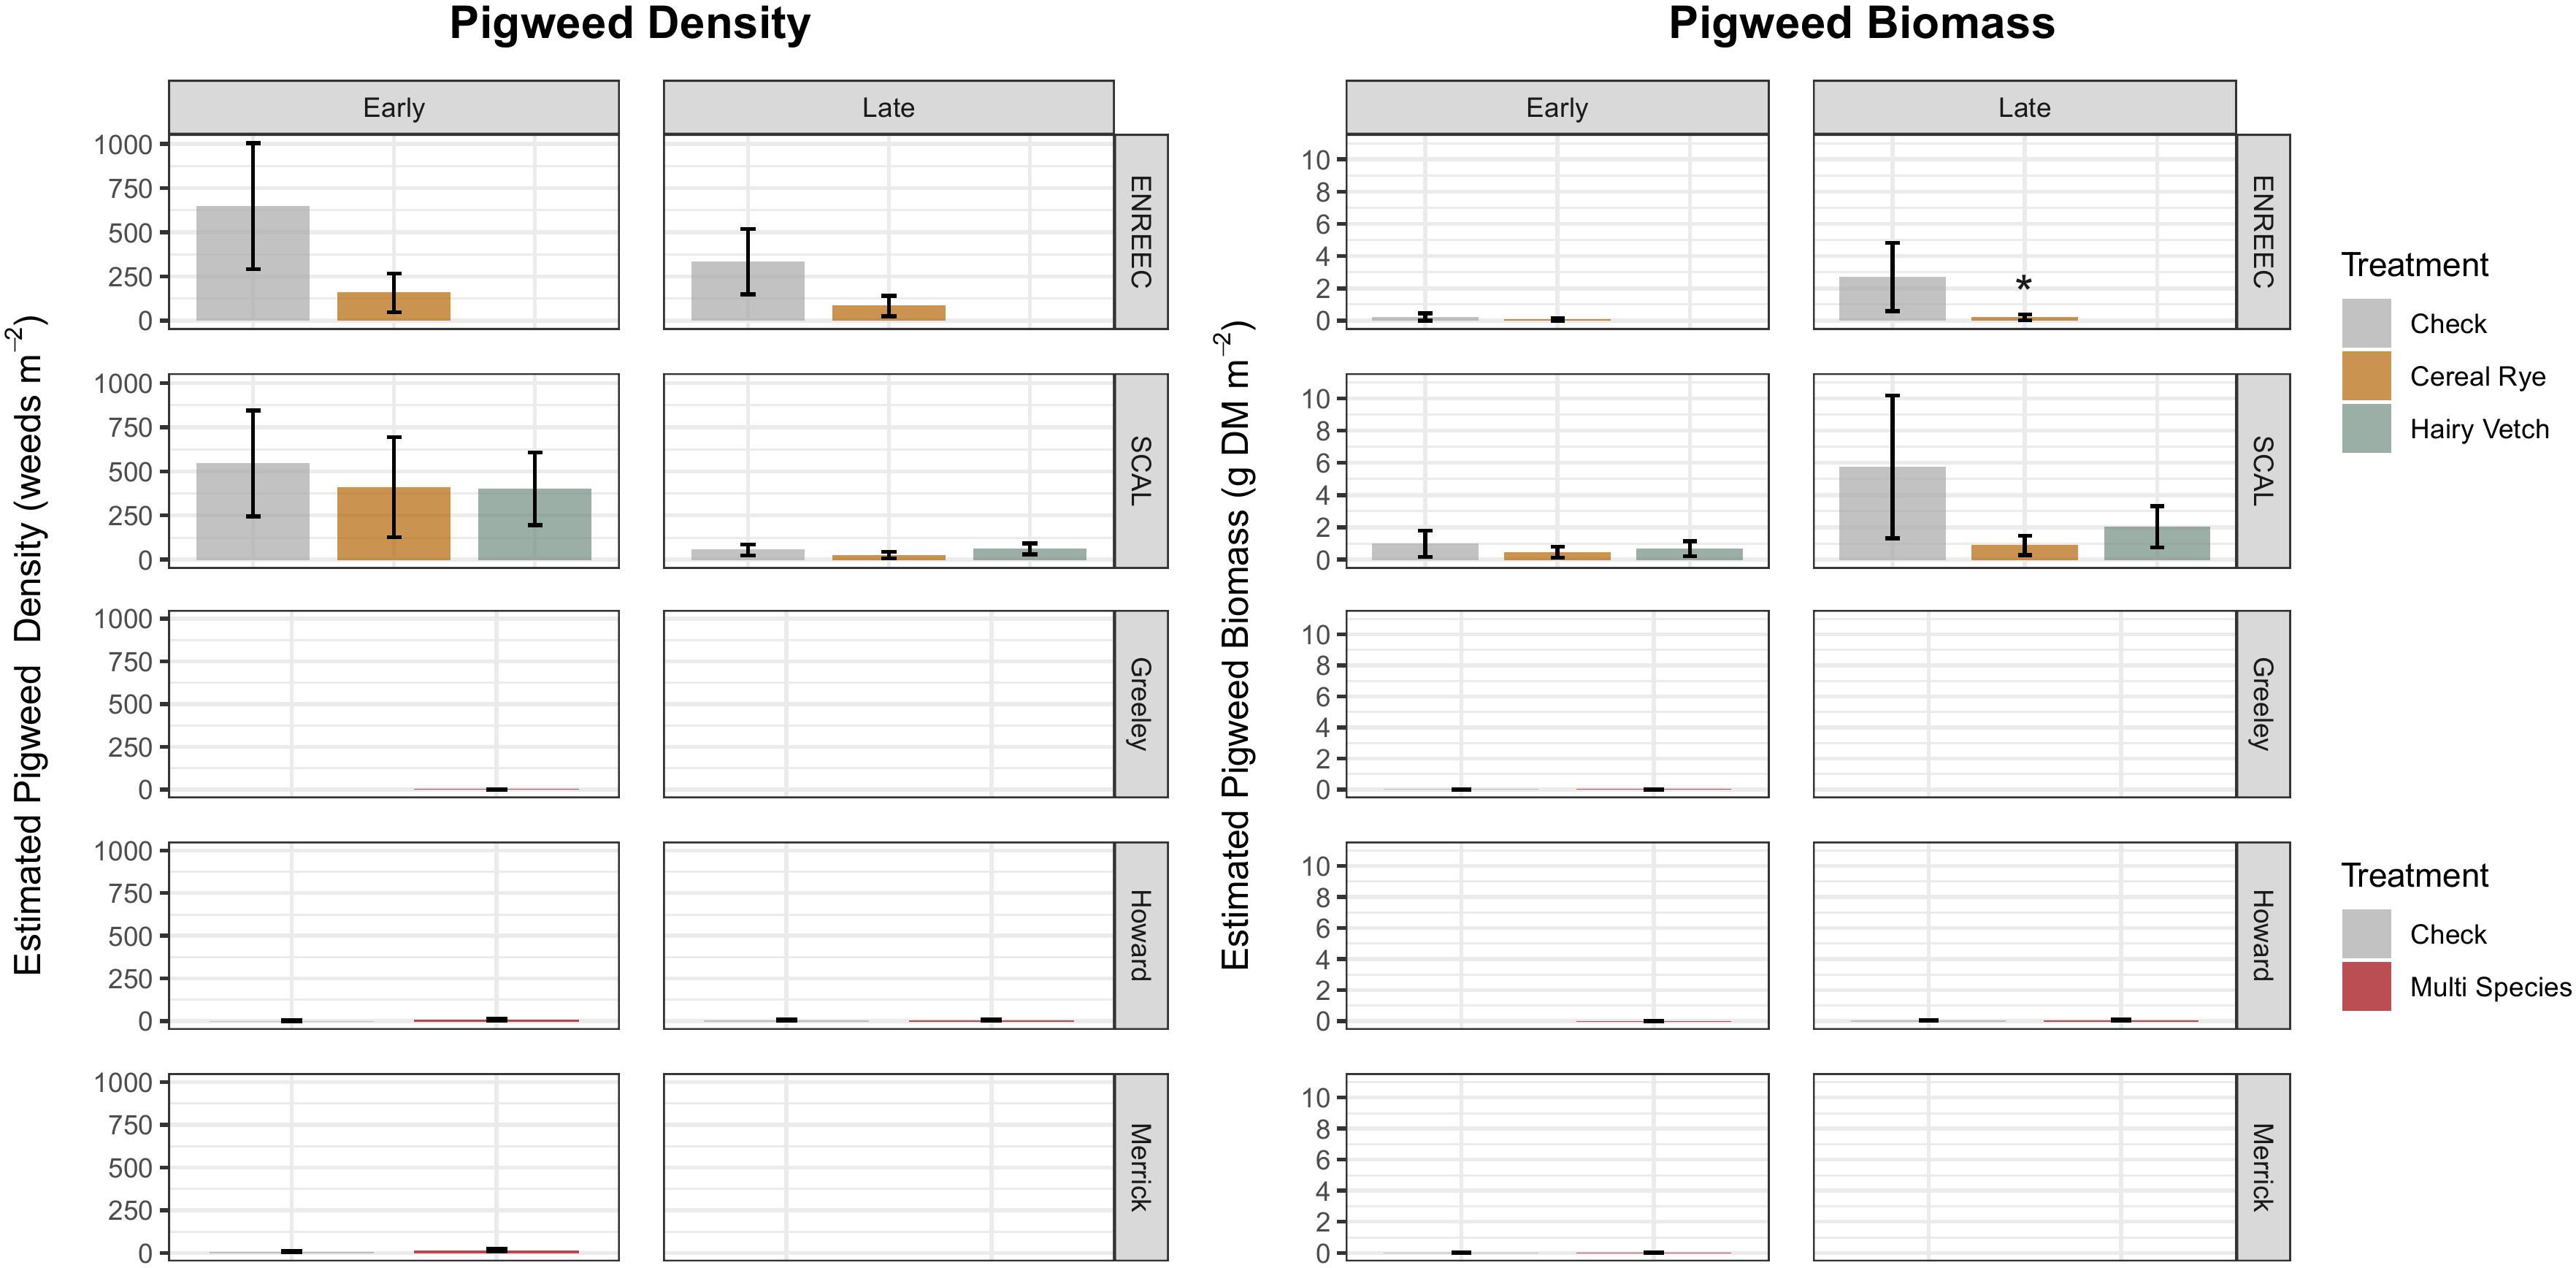
Figure 3. Aboveground total pigweed biomass and density from two sampling periods at experimental sites. Colfax County does not appear in this figure because no weeds were counted aboveground either sampling period at this site. Treatments differing from the check at a level of p <0.10 indicated by *.
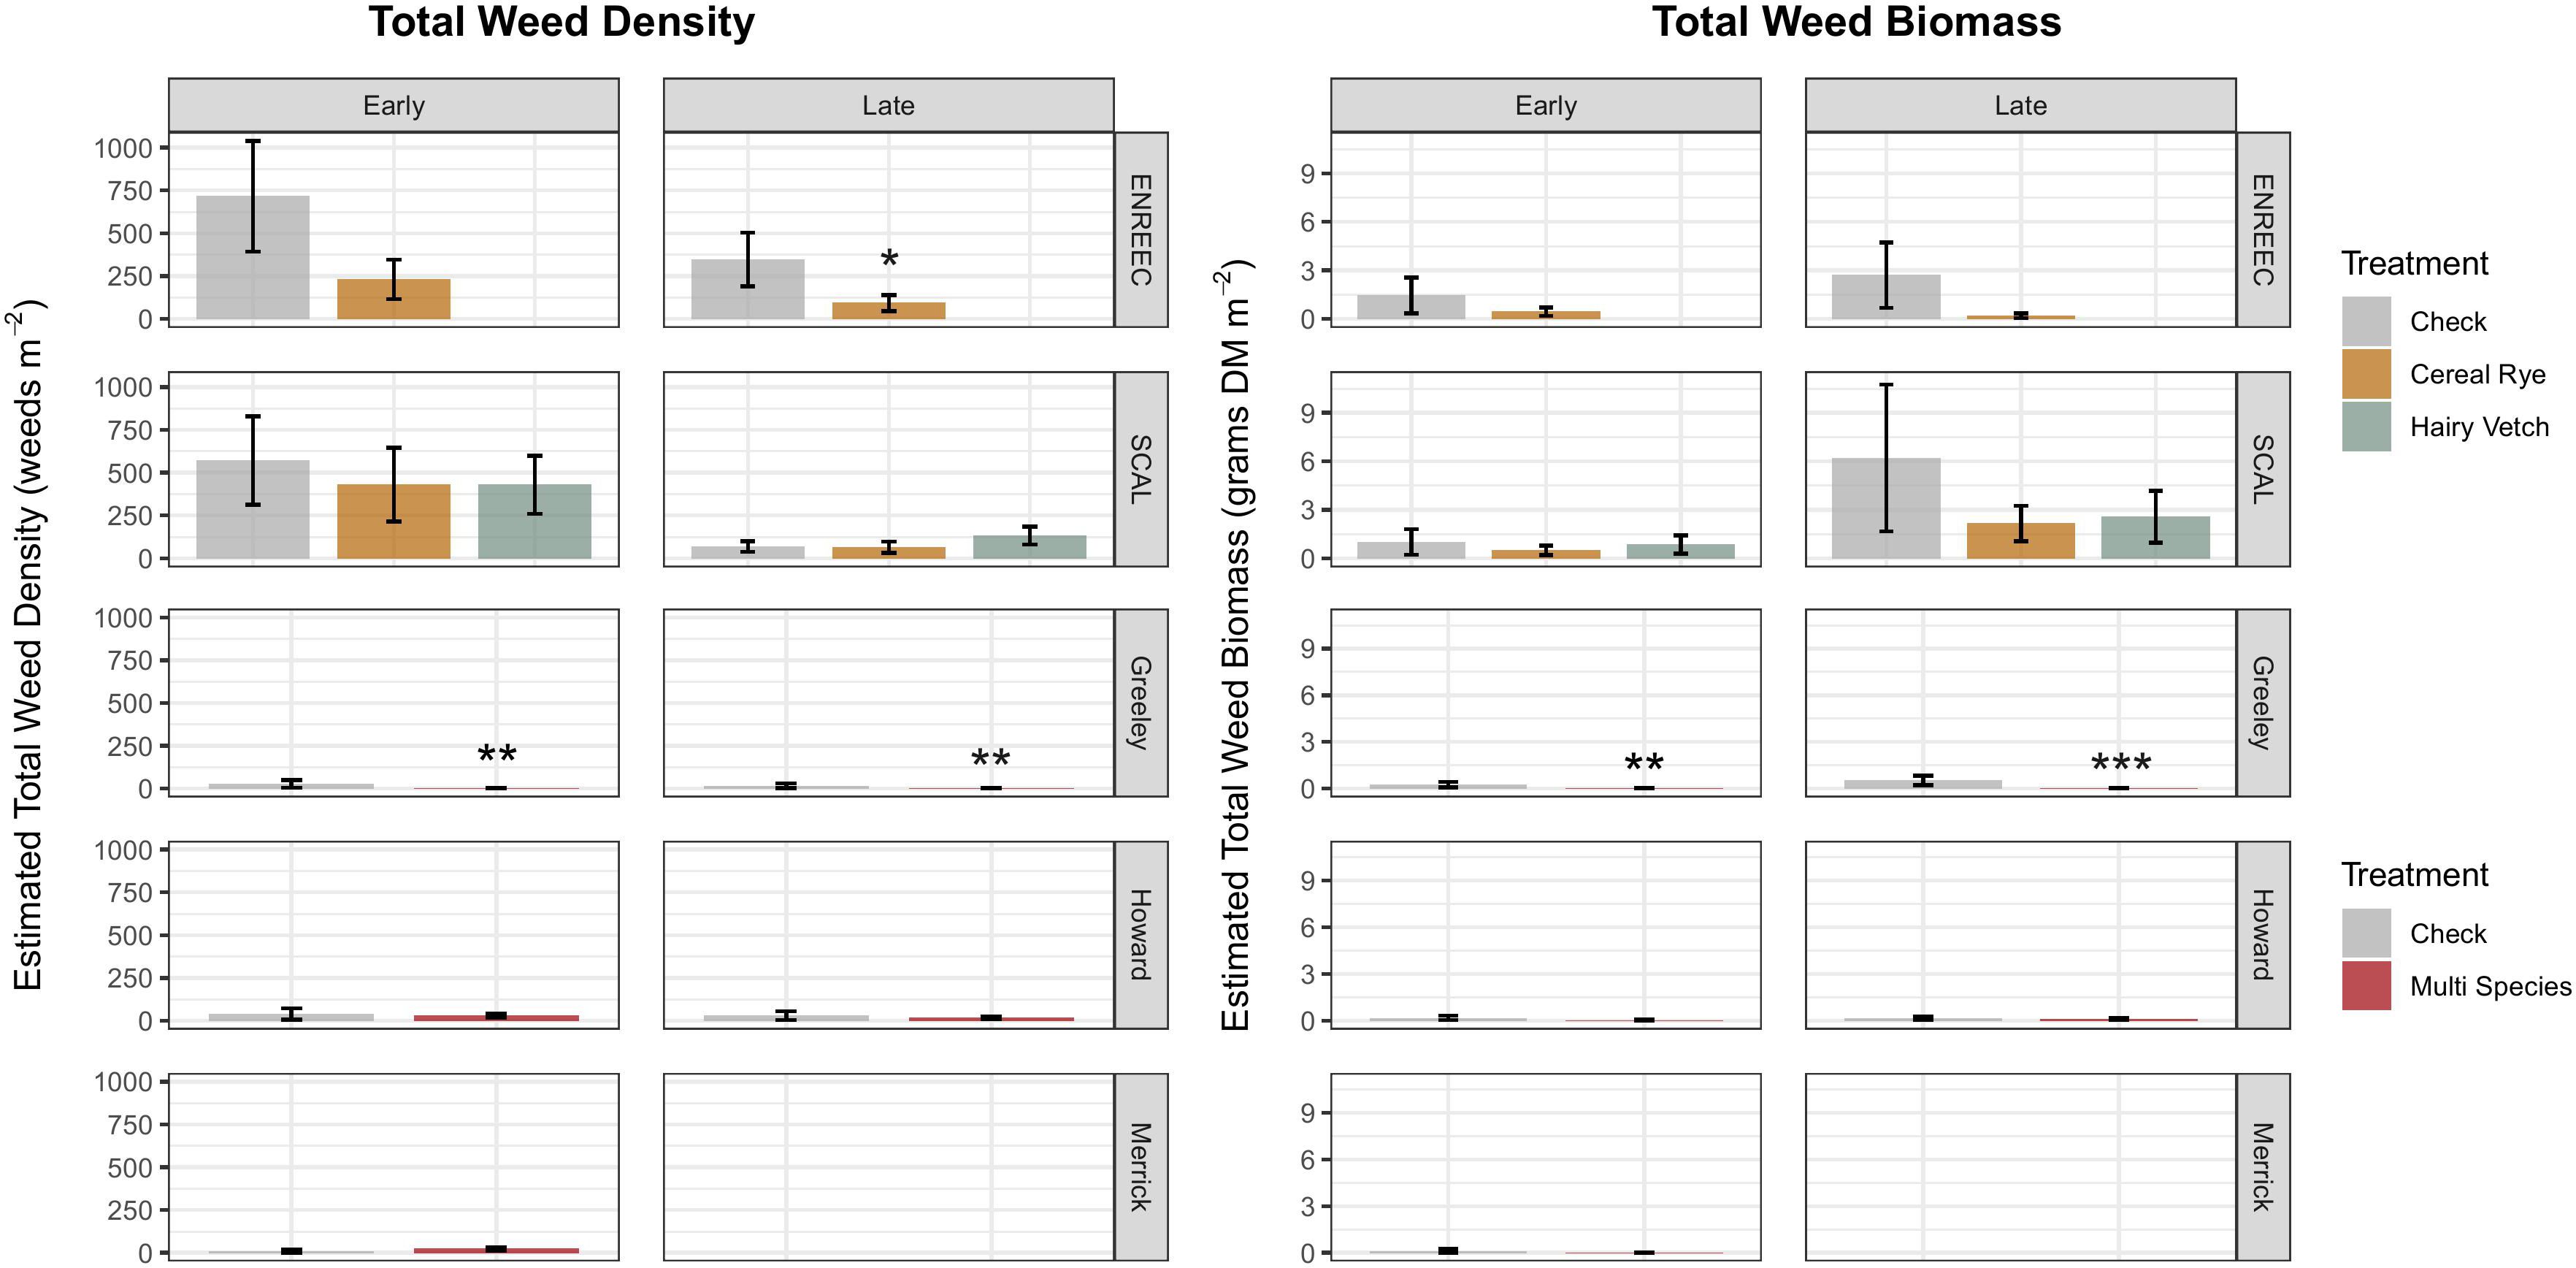
Figure 4. Total aboveground weed biomass and density by site and sampling period (early cash crop growing season before post-emergence herbicide application, and late growing season, after post-emergence herbicide application). Colfax County does not appear in this figure because no weeds were counted aboveground either sampling period at this site. Treatments differing from the check at a level of p <0.10 indicated by *p <0.05 indicated by **p <0.01 indicated by ***.
The weed biomass results were also site-specific. Despite the seedbank results, pigweed biomass did not increase at any of the sites or sampling periods; instead, pigweed biomass decreased under cover crops at the ENREEC site later in the season (Figure 3) (p = 0.09, −93%). Total weed biomass was significantly reduced in the cover crop treatment at the Greeley County location during both the early (p = 0.06, −97%) and late (p = 0.008, −99%) sampling periods (Figure 4). Howard County also observed reductions in the total weed biomass during the early season sample period (p = 0.1, −88%). The reductions in total biomass in Greeley County was driven by a reduction in grass biomass (Supplementary Figure S3) during the early (p = 0.02, −98%) and late (p = 0.06, −96%) sampling periods, as well as a reduction in broadleaf biomass during the late growing season (p = 0.005, 99%) (Supplementary Figure S4). At the Howard County site, there were reductions in early season grasses in the cover crop treatment (p = 0.09, −88%), which drove the significant reductions in total weed biomass, and at the Merrick County site, there were reductions in early season broadleaves (p = 0.08, −99%) (Supplementary Figure S4).
4 Discussion
4.1 Shifts in weed seedbank composition after multiple years of cover crop use
Cover crops did not influence the total weed seedbank density at any site, a finding that has been reported in similar cover crop seedbank studies (Alonso-Ayuso et al., 2018; Buchanan et al., 2016). However, other studies have observed reductions in the total weed seedbank density with the use of cover crops, especially when cover crops are used long-term (Moonen and Bàrberi, 2004; Nichols et al., 2020a). While the total weed seedbank density was unchanged, we observed increases in pigweeds in the cover crop treatments at the three sites. While this was not our expected finding, recent work in Kansas similarly found that when seeds of two pigweed species—palmer amaranth (A. palmeri S. Watson) and waterhemp (Amaranthus tuberculatus (Moq.) J. D. Sauer) were buried under cereal rye cover crop and no cover crop treatments, cereal rye treatment increased waterhemp seed viability (Woitaszewski, 2023). Furthermore, two of the three locations where we found increased pigweed species in the soil seedbank (the Greeley and Merrick County sites), where the only sand was found in the soil texture series. Benvenuti (2007) found that seed burial was greater in the soil profile after one year in sandy soil than in clay soil. Taken together, these results suggest that there may be physical or biochemical processes occurring in the soil that contribute to pigweed species viability when cover crops are present.
Although not directly measured in our experiment, prior research indicates that increased vegetative cover and reduced tillage may increase weed seed predator activity (Sarabi, 2019), which could contribute to lower weed seedbank populations and ultimately weed emergence. Additionally, any of the known processes that limit weed emergence when cover crops are present could result in reduced weed seedling germination, leading to a larger pigweed seedbank size over time compared to the control treatment. Some of these well-documented weed suppression processes under cover crops could include allelopathy (specifically in cereal rye, which was included as a cover crop or cash crop at all experimental locations), physical shading, and reduced light transmittance, which affects the soil temperature and photosensitive germination of pigweeds (Teasdale, 1993; Kunz et al., 2016; Weaver and McWilliams, 1980). Reduced sunlight and decreased temperatures at the soil surface, even at lower levels of cover crop biomass, explain the reduced waterhemp (A. tuberculatus) germination in a recent experiment (Nunes et al., 2024).
4.2 Cover crops reduced aboveground weed density and biomass at some sites with no differences in pigweed prevalence
Significant reductions in the total aboveground weed density and biomass occurred at three of the six sites, with reductions of up to 99%. The lack of consistent results could be attributed to the potential differences in the natural spatial distribution of emerged weeds (Cardina et al., 1997), combined with the spatial variability within replicates, especially at on-farm sites. Reductions in weed density and biomass observed across sites occurred even with the range of cover crop growth (from 0.11 Mg ha−1 to 4.02 Mg ha−1) being lower than estimates for significant reductions in weed biomass to occur which has been reported to be >5 Mg ha−1 of cover crop growth for this region (Nichols et al., 2020b). Similarly, a field experiment conducted at two sites in Wisconsin, USA, utilizing different levels of cereal rye cover crops, calculated a dose response of 5.2 Mg ha−1 required to reduce waterhemp by 50% (Nunes et al., 2024). Although greater cover crop biomass is frequently discussed in the literature as a critical factor affecting aboveground weeds (Blanco-Canqui and Jhala, 2024), another recent experiment on a corn–soybean rotation in Italy found that aboveground cover crop biomass was not the most important predictor of weed suppression (Adeux et al., 2023). Additionally, our work underscores that a number of other aboveground and/or belowground processes may occur, which affect how cover crops shift weed communities. Aboveground processes could include cover crop-induced environmental changes, such as delayed weed emergence. Belowground processes could include changes in soil aeration and oxygen content that impact weed seed emergence as well as increased weed seed predation (Liebman et al., 2021a; Sias et al., 2021; Sarabi, 2019). Despite the increases in the pigweed seedbanks at the three sites, there were no aboveground differences between cover crops and check treatments for pigweed density or biomass, except for a significant reduction in pigweed density in the cover crop at one site (ENREEC experiment station) during the late growing season. Considering the above- and belowground results found in our analysis, cover crops may suppress pigweed seed germination and therefore prevent aboveground weed emergence.
4.3 The role of diversity in weed seedbank composition
While weed seedbank diversity showed non-significant increases under cover crops, the multivariate NMDS analysis revealed that when cover crops were used over multiple years, they were capable of shifting the overall composition of seedbanks to the point where communities were distinct from no cover crop controls. With respect to the weed diversity metrics, we may not have seen statistical differences because the large numbers of Amaranthus spp. present in the seedbank may have caused the Shannon diversity metric to become insensitive to less common species. The relative simplicity of crop rotations (corn–soybean-based) at all sites may also override the benefits of weed diversity induced by cover crops alone (Weisberger et al., 2019). However, we do believe that our study results suggest a shift toward distinct and potentially more diverse weed communities when cover crops are used over multiple years. In a multi-year experiment in Italy in a corn–soybean rotation, a triticale cover crop was found not only to reduce weed seedbank density but also to increase the diversity of the seedbank (Raimondi et al., 2024). Cropping system diversification, such as extended crop rotations or the use of cover crops, has been found to diversify the weed seedbank (Liebman et al., 2021b), as well as diversify selection pressures that aid in the mitigation of aggressive weed species (Liebman and Gallandt, 1997; Liebman et al., 2021a; Palmer and Maurer, 1997). Diverse weed communities are also linked to improvements in crop yield and a reduced risk of developing HR (Adeux et al., 2019). Diverse weed populations with greater species evenness also lead to reduced interplant competition and are less susceptible to being overcome by a few aggressive or possibly HR species (Smith et al., 2010; Storkey and Neve, 2018). Additionally, increasing diversity may be an indication of ecological succession; however, these changes are difficult to detect in agroecosystems because they are highly disturbed environments (Gliessman, 2014a, b). Although high weed diversity could be perceived as a risk from an agronomic perspective, it may assist in strategies to reduce risks for developing HR, such as being able to rotate and diversify herbicide modes of action or sites of action. Therefore, we emphasize the significance of analyzing weed seedbank composition and related diversity metrics in weed seedbank research.
4.4 Study limitations
The herbicides utilized for pre-emergence, cover crop termination, and post-emergence weed control at all six sites (Supplementary Table S1) would certainly have affected our observations of the aboveground weed density and biomass. However, herbicide use at each site did not differ between the cover crop and no cover crop treatments. Therefore, the multi-year presence of a cover crop was the major difference between the areas of the field sampled, and our primary objective was to understand the impact of multi-year cover crop use on weeds in different environments with relatively similar management practices, including the four commercial farms. Accounting for all variables in herbicide efficacy across large-scale sites (e.g., soil type, soil pH, and organic matter) influencing herbicide residual activity (Moomaw et al., 1992) was outside the scope of our study. The active ingredients in pre-emergence residual herbicides utilized at three of the sites (Supplementary Table S1) including flumioxazin, S-metolachlor, and saflufenacil, have been shown to reduce green pigweed (Amaranthus powellii S. Watson) emergence in soybean experiments from 17% to 81% eight weeks after planting (Aicklen et al., 2022) and therefore may have had an impact on in-season weed emergence at our sites. While residual herbicides may be physically intercepted by cover crop residue before reaching the soil (Price and Kelton, 2013), there is also evidence of synergism between cover crop residue and residual herbicides in reducing weed emergence (Teasdale et al., 2005). Our in-season aboveground weed biomass and densities did not demonstrate any reduced herbicide activity in the cover crop treatments; these treatments led to reductions at some sites (Figure 4), including those where we observed that the Amaranthus spp. seedbank increased and residual herbicides were applied. Combined with pre-emergence herbicides as a chemical tool, cover crops as a biological tool have been shown to reduce chemical selection pressure for weed resistance, particularly Palmer amaranth (A. palmeri S. Watson), by 98%, while also improving yield (Hand et al., 2021). These combinations of weed control tools are critical for diversifying selection pressures on weeds and for delaying the onset of HR (Liebman and Gallandt, 1997).
Additionally, because we did not sample seedbanks prior to the first year of cover crop establishment, we cannot be certain of the seedbank trajectory and rates of withdrawal or addition over time. Because the germination method for assessing seedbanks was utilized rather than the elutriation method, it is possible that some weeds may not have emerged over the seven months in the greenhouse and three re-sieving processes because of their sensitivity to the germination method (such as not breaking dormancy due to temperature, aged seeds, etc.). Furthermore, the germination method can bias estimates for species responsive to particular conditions. For example, our method may have underestimated species with long seed dormancies or seeds that were not sufficiently stratified by the previous winter (Gross, 1990). This may have resulted in a greater number of summer annual weeds present, resulting in non-significant treatment differences in the seedbank diversity indices. However, we believe our experiment captured the majority of viable weed seeds because of our initial soil sampling depth, the length of the experiment, and the range of both winter and summer annual species that emerged. Although we only evaluated aboveground weed density and biomass in one year, there was generally similar weather over the cover crop growing period at all sites (drier than normal conditions overall with drought conditions in fall, and some wetter conditions in spring), which still produced a range of cover crop biomass across sites. As a result, we believe that the most important driving factor was the presence or absence of cover crops over the medium term (4–7 years) at the experimental locations.
5 Conclusion
In this study, we assessed the soil weed seedbank at six locations where fall-planted cover crops had been grown for 4–7 years, followed by an in-season assessment of aboveground weeds from the same four on-farm and two experimental station sites. We hypothesized that cover crops would reduce weeds in the soil seedbank and aboveground during the growing season. The results were more nuanced; compared to no cover crop treatments, soils managed with cover crops saw no change in the total weed seeds in the seedbank, but Amaranthus spp. seeds increased at three of the six sites. At two sites, we found that seedbank composition was completely distinct when comparing the cover crop to the no cover crop check. Furthermore, we found that five of the six sites had slight increases in the total weed seedbank diversity under cover crops, when taken together this may suggest that cover crops are shifting or differentiating weed communities. Aboveground, we found that cover crops decreased total weed density and/or biomass at three of the six sites, while at all sites, Amaranthus spp. were suppressed or unchanged compared to no cover crop check treatments. This underscores the complexity and value of examining both above and belowground weed dynamics to obtain a holistic picture of how cover crop management may shift weed communities. Cover crops are a recognized and growing method to diversify cropping systems, and are known to have important impacts on reducing selection pressures and altering the prevalence of competitive weeds. We encourage further assessment of long-term and belowground weed impacts on cover crops to understand how they may impact important weed communities, including weed species prone to herbicide resistance, such as pigweeds. This is especially important in environments where chemically based weed control predominates, such as reduced tillage management.
Data availability statement
The datasets presented in this study can be found in online repositories. The names of the repository/repositories and accession number(s) can be found below: UNL Data Repository, https://doi.org/10.71964/115.
Author contributions
EO: Conceptualization, Data curation, Formal analysis, Funding acquisition, Investigation, Methodology, Project administration, Visualization, Writing – original draft, Writing – review & editing. FK: Conceptualization, Investigation, Methodology, Supervision, Writing – original draft, Writing – review & editing. CP: Methodology, Writing – review & editing. KK-C: Methodology, Writing – review & editing. AB: Conceptualization, Formal analysis, Funding acquisition, Investigation, Methodology, Project administration, Supervision, Writing – original draft, Writing – review & editing.
Funding
The author(s) declare that financial support was received for the research and/or publication of this article. Financial support for this research was provided by the Natural Resources Conservation Service (USDA-NRCS) under agreement no. 68-6526-17-005.
Acknowledgments
We would like to acknowledge the support of the four on-farm collaborators who participated in this research. We would also like to thank the two reviewers whose comments improved the clarity of our manuscript.
Conflict of interest
The authors declare that the research was conducted in the absence of any commercial or financial relationships that could be construed as a potential conflict of interest.
Generative AI statement
The author(s) declare that no Generative AI was used in the creation of this manuscript.
Publisher’s note
All claims expressed in this article are solely those of the authors and do not necessarily represent those of their affiliated organizations, or those of the publisher, the editors and the reviewers. Any product that may be evaluated in this article, or claim that may be made by its manufacturer, is not guaranteed or endorsed by the publisher.
Supplementary material
The Supplementary Material for this article can be found online at: https://www.frontiersin.org/articles/10.3389/fagro.2025.1575785/full#supplementary-material
References
Adeux G., Rodriguez A., Penato C., Antichi D., Carlesi S., Sbrana M., et al. (2023). Long-term cover cropping in tillage-based systems filters weed community phenology: A seedbank analysis. Field Crops Res. 291, 108769. doi: 10.1016/j.fcr.2022.108769
Adeux G., Vieren E., Carlesi S., Bàrberi P., Munier-Jolain N., and Cordeau S. (2019). Mitigating crop yield losses through weed diversity. Nat. Sustainability 2, 1018–1026. doi: 10.1038/s41893-019-0415-y
Aicklen I. K., Soltani N., Tardif F. J., Robinson D. E., Laforest M., and Sikkema P. H. (2022). Control of multiple-herbicide-resistant green pigweed (Amaranthus powellii) with preemergence and postemergence herbicides in ontario soybean production. Agronomy 12, 2075. doi: 10.3390/agronomy12092075
Alonso-Ayuso M., Gabriel J. L., García-González I., Del Monte J. P., and Quemada M. (2018). Weed density and diversity in a long-term cover crop experiment background. Crop Prot. 112, 103–111. doi: 10.1016/j.cropro.2018.04.012
Bates D., Mächler M., Bolker B. M., and Walker S. C. (2015). Fitting linear mixed-effects models using lme4. J. Stat. Software 67. doi: 10.18637/jss.v067.i01
Bekele D. (2020). The effect of tillage on soil moisture conservation: A review. Int. J. Res. Stud. Agric. Sci. 6. doi: 10.20431/2454-6224.0610004
Benvenuti S. (2007). Natural weed seed burial: effect of soil texture, rain and seed characteristics. Seed Sci. Res. 17, 211–219. doi: 10.1017/S0960258507782752
Blanco-Canqui H. and Jhala A. J. (2024). Planting green and ecosystem services in row crop production systems. CABI Rev. 19. doi: 10.1079/cabireviews.2024.0029
Bolker B. M., Brooks M. E., Clark C. J., Geange S. W., Poulsen J. R., Stevens M. H. H., et al. (2009). Generalized linear mixed models: a practical guide for ecology and evolution. Trends Ecol. Evol. 24, 127–135. doi: 10.1016/j.tree.2008.10.008
Buchanan A. L., Kolb L. N., and Hooks C. R. R. (2016). Can winter cover crops influence weed density and diversity in a reduced tillage vegetable system? Crop Protection 90(December 2016), 9–16. doi: 10.1016/j.cropro.2016.08.006
Buhler D. D., Hartzler R. G., Forcella F., Science S. W., Jun N. M., Buhler D. D., et al. (1997). Implications of Weed Seedbank Dynamics to Weed Management Published by : Weed Science Society of America and Allen Press Linked references are available on JSTOR for this article : Implications of weed seedbank dynamics to weed management. Weed Sci. 45, 329–336. doi: 10.1017/S0043174500092948
Bunchek J. M., Wallace J. M., Curran W. S., Mortensen D. A., VanGessel M. J., and Scott B. A. (2020). Alternative performance targets for integrating cover crops as a proactive herbicide-resistance management tool. Weed Sci. 68, 534–544. doi: 10.1017/wsc.2020.49
Cardina J., Johnson G. A., and Sparrow D. H. (1997). The nature and consequence of weed spatial distribution. Weed Sci. 45, 364–373. doi: 10.1017/s0043174500092997
Clements D. R., Benoit D. L., Murphy S. D., and Swanton C. J. (1996). Tillage effects on weed seed return and seedbank composition. Weed Sci. 44, 314–322. doi: 10.1017/S0043174500093942
Colbach N., Dessaint F., and Forcella F. (2000). Evaluating field-scale sampling methods for the estimation of mean plant densities of weeds. Weed Res. 40, 411–430. doi: 10.1046/j.1365-3180.2000.00203.x
Gage K. L. and Schwartz-Lazaro L. M. (2019). Shifting the paradigm: An ecological systems approach to weed management. Agric. (Switzerland) 9, 1–17. doi: 10.3390/agriculture9080179
Gleason H. and Cronquist A. (1991). Manual of Vascular Plants of Northeastern United States and Adjacent Canada. 2nd ed (New York: The New York Botanical Garden Press).
Gliessman S. (2014a). “Chapter 17: agroecosystem diversity,” in Agroecology: The Ecology of Sustainable Food Systems, 3rd ed (Boca Raton: CRC Press), 203–219.
Gliessman S. (2014b). “Chapter 18: disturbance, succession, and agroecosystem management,” in Agroecology: The Ecology of Sustainable Food Systems, 3rd ed (Boca Raton: CRC Press), 221–236.
Grint K. R., Arneson N. J., Arriaga F., DeWerff R., Oliveira M., Smith D. H., et al. (2022). Cover crops and preemergence herbicides: An integrated approach for weed management in corn-soybean systems in the US Midwest. Front. Agron. 4, 888349. doi: 10.3389/fagro.2022.888349
Gross K. L. (1990). A comparison of methods for estimating seed numbers in the soil. J. Ecol. 78, 1079–1093. doi: 10.2307/2260953
Grundy A. C., Mead A., and Burston S. (2003). Modelling the emergence response of weed seeds to burial depth: Interactions with seed density, weight and shape. J. Appl. Ecol. 40, 757–770. doi: 10.1046/j.1365-2664.2003.00836.x
Hand L. C., Randell T. M., Nichols R. L., Steckel L. E., Basinger N. T., and Culpepper A. S. (2021). Cover crops and residual herbicides reduce selection pressure for Palmer amaranth resistance to dicamba-applied postemergence in cotton. Agron. J. 113, 5373–5382. doi: 10.1002/agj2.v113.6
Heap I. (2025). The International Herbicide-Resistant Weed Database. Available online at: https://www.weedscience.org/Home.aspx (Accessed March 5, 2025).
Hill M. O. (1973). Diversity and evenness: a unifying notation and its consequences. Ecology 54, 427–432. doi: 10.2307/1934352
HPRCC (2022). Station tool. Available online at: https://hprcc.unl.edu/.
Huggins B. D. R. and Reganold J. P. (2008). No-till: the quite revolution. Scietific Am. 299, 70–77. doi: 10.1038/scientificamerican0708-70
Jhala A., Sandell L., Knezevic S., Kruger G., and Wilson R. (2014). Herbicide-Resistant Weeds in Nebraska (Lincoln, NE: University of Nebraska - Lincoln Extension, EC1278). Available at: http://extensionpublications.unl.edu/assets/pdf/ec1278.pdf (Accessed September 8, 2023).
Kruidhof H. M., Bastiaans L., and Kropff M. J. (2008). Ecological weed management by cover cropping: Effects on weed growth in autumn and weed establishment in spring. Weed Res. 48, 492–502. doi: 10.1111/j.1365-3180.2008.00665.x
Krupek F., Basche A., Redfearn D., and Thompson L. (2019). Farmers find solutions through Nebraska Soil Health Initiative (Lincoln, NE: Nebraska Cropwatch). Available at: https://cropwatch.unl.edu/2019/farmers-find-solutions-through-nebraska-soil-health-initiative (Accessed April 1, 2022).
Kunz C., Sturm D. J., Varnholt D., Walker F., and Gerhards R. (2016). Allelopathic effects and weed suppressive ability of cover crops. Plant Soil Environ. 62, 60–66. doi: 10.17221/612/2015-PSE
Landau C., Bradley K., Burns E., Flessner M., Gage K., Hager A., et al. (2023). The silver bullet that wasn’t: Rapid agronomic weed adaptations to glyphosate in North America. PNAS nexus 2, pgad338. doi: 10.1093/pnasnexus/pgad338
Lenth R. V., Buerkner P., Herve M., Love J., Miguez F., Riebl H., et al (2021). Emmeans: estimated marginal means, aka least-squares means version 1.7.4-1. https://cran.r-project.org/web/packages/emmeans/emmeans.pdf.
Liebman M., Basche A. D., Nguyen H. T. X., and Weisberger D. A. (2021a). How can cover crops contribute to weed management? A modelling approach illustrated with rye (Secale cereale) and Amaranthus tuberculatus. Weed Res. 61 (1), 1–11. doi: 10.1111/wre.12508
Liebman M. and Gallandt E. R. (1997). “Many little hammers: ecological management of crop-weed interactions,” in Ecology in Agriculture. Ed. Jackson L. E. (San Diego: Academic Press) 61 (1), 291–343. doi: 10.1016/b978-0-12-378260-1.x5000-3
Liebman M., Nguyen H. T. X., Woods M. M., Hunt N. D., and Hill J. D. (2021b). Weed seedbank diversity and sustainability indicators for simple and more diverse cropping systems. Weed Res. 61, 164–177. doi: 10.1111/wre.12466
Moomaw R. S., Klein R. N., Martin A. R., Roeth F. W., Shea P. J., Wicks G. A., et al. (1992). Factors that affect soil-applied herbicides (Lincoln, NE: Nebraska Extension NebGuide G92-1081-A). Available at: https://digitalcommons.unl.edu/cgi/viewcontent.cgi?article=2219&context=extensionhist (Accessed April 1, 2022).
Moonen A. C. and Bàrberi P. (2004). Size and composition of the weed seedbank after 7 years of different cover-crop-maize management systems. Weed Res. 44, 163–177. doi: 10.1111/j.1365-3180.2004.00388.x
Myers J. P., Antoniou M. N., Blumberg B., Carroll L., Colborn T., Everett L. G., et al. (2016). Concerns over use of glyphosate-based herbicides and risks associated with exposures: A consensus statement. Environ. Health 15, 1–13. doi: 10.1186/s12940-016-0117-0
National Drought Mitigation Center (2024). Data Download: Weeks in Drought. Available online at: https://droughtmonitor.unl.edu/DmData/DataDownload/WeeksInDrought.aspx (Accessed December 20, 2024).
Nichols V., English L., Carlson S., Gailans S., and Liebman M. (2020a). Effects of long-term cover cropping on weed seedbanks. Front. Agron. 2. doi: 10.3389/fagro.2020.591091
Nichols V., Martinez-Feria R., Weisberger D., Carlson S., Basso B., and Basche A. (2020b). Cover crops and weed suppression in the U.S. Midwest: A meta-analysis and modeling study. Agric. Environ. Lett. 5 (1), p.e20022. doi: 10.1002/ael2.20022
Nunes J. J., Arneson N. J., Smith D., Ruark M., Conley S., and Werle R. (2024). Elucidating waterhemp (Amaranthus tuberculatus) suppression from cereal rye cover crop biomass. Weed Sci. 72, 284–295. doi: 10.1017/wsc.2024.21
Oksanen A. J., Blanchet F. G., Friendly M., Kindt R., Legendre P., Mcglinn D., et al. (2019). “Vegan,” in Encyclopedia of Food and Agricultural Ethics (Dordrecht, The Netherlands: Springer Nature), 2395–2396. doi: 10.1007/978-94-024-1179-9_301576
Onofri A., Carbonell E. A., Piepho H. P., Mortimer A. M., and Cousens R. D. (2010). Current statistical issues in Weed Research. Weed Res. 50, 5–24. doi: 10.1111/j.1365-3180.2009.00758.x
Osipitan O. A., Dille J. A., Assefa Y., and Knezevic S. Z. (2018). Cover crop for early season weed suppression in crops: Systematic review and meta-analysis. Agron. J. 110, 2211–2221. doi: 10.2134/agronj2017.12.0752
Owen M. D. K. (2016). Diverse approaches to herbicide-resistant weed management. Weed Sci. 64, 570–584. doi: 10.1614/WS-D-15-00117.1
Palmer M. W. and Maurer T. A. (1997). Does diversity beget diversity? A case study of crops and weeds. J. Vegetation Sci. 8, 235–240. doi: 10.2307/3237352
Peterson M. A., Collavo A., Ovejero R., Shivrain V., and Walsh M. J. (2018). The challenge of herbicide resistance around the world: a current summary. Pest Manage. Sci. 74, 2246–2259. doi: 10.1002/ps.4821
Poos M. S. and Jackson D. A. (2012). Addressing the removal of rare species in multivariate bioassessments: The impact of methodological choices. Ecol. Indic. 18, 82–90. doi: 10.1016/j.ecolind.2011.10.008
Price A. J. and Kelton J. A. (2013). Integrating herbicides in a high-residue cover crop setting. In Herbicides-current research and case studies in use. IntechOpen.. doi: 10.5772/56142
Raimondi G., Loddo D., Giannini V., and Borin M. (2024). Unveiling the impact of winter cover crops and weedy fallow on the soil seedbank. Eur. J. Agron. 160, 127309. doi: 10.1016/j.eja.2024.127309
R Core Team (2022). R: A language and environment for statistical computing (Vienna, Austria: R Foundation for Statistical Computing). Available at: https://www.R-project.org/ (Accessed February 1, 2022).
Rueda-Ayala V., Jaeck O., and Gerhards R. (2015). Investigation of biochemical and competitive effects of cover crops on crops and weeds. Crop Prot. 71, 79–87. doi: 10.1016/j.cropro.2015.01.023
Sarabi V. (2019). Factors that influence the level of weed seed predation: A review. Weed Biol. Manage. 19, 61–74. doi: 10.1111/wbm.12186
Sias C., Wolters B. R., Reiter M. S., and Flessner M. L. (2021). Cover crops as a weed seed bank management tool: A soil down review. Ital. J. Agron. 16. doi: 10.4081/ija.2021.1852
Smith M. (2020). 2019–2020 Annual Report - Cover Crop Survey. Available online at: https://www.sare.org/wp-content/uploads/2019-2020-National-Cover-Crop-Survey.pdf (Accessed December 20, 2021).
Smith R. G., Mortensen D. A., and Ryan M. R. (2010). A new hypothesis for the functional role of diversity in mediating resource pools and weed-crop competition in agroecosystems. Weed Res. 50, 37–48. doi: 10.1111/j.1365-3180.2009.00745.x
Storkey J. and Neve P. (2018). What good is weed diversity? Weed Res. 58, 239–243. doi: 10.1111/wre.12310
Teasdale J. R. (1993). Interaction of light, soil moisture, and temperature with weed suppression by hairy vetch residue. Weed Sci. 41, 46–51. doi: 10.1017/S0043174500057568
Teasdale J. R., Pillai P., and Collins R. T. (2005). Synergism between cover crop residue and herbicide activity on emergence and early growth of weeds. Weed Sci. 53, 521–527. doi: 10.1614/WS-04-212R
University of Nebraska Extension (2023). 2023 On-Farm Research Results. Available online at: https://on-farm-research.unl.edu/results-pdfs/2023research-results.pdf (Accessed December 1, 2024).
United States Department of Agriculture (USDA) - Economic Research Service (ERS) (2022). Adoption of Genetically Engineered Crops in the US. Available online at: https://www.ers.usda.gov/data-products/adoption-of-genetically-engineered-crops-in-the-united-states (Accessed February 1, 2022).
United States Department of Agriculture (USDA) Foreign Agricultural Service (FAS) (2022). Production Assessment Division – Commodity Explorer. Available online at: https://ipad.fas.usda.gov/cropexplorer/cropview/commodityView.aspx?cropid=2222000&sel_year=2022&rankby=Production (Accessed February 1, 2022).
United States Department of Agriculture (USDA) National Agricultural Statistics Service (NASS) (2024). USDA Census 2022. Available online at: https://www.nass.usda.gov/AgCensus/ (Accessed February 1, 2022).
Weaver S. E. and McWilliams E. (1980). 44. Amaranthus retroflexus L., A. powellii S. Wats. andA. hybridus L. Can. J. Plant Sci. 60, 1215–1234. doi: 10.4141/cjps80-175
Weisberger D., Nichols V., and Liebman M. (2019). Does diversifying crop rotations suppress weeds? A meta-analysis. PLoS One 14, 1–12. doi: 10.1371/journal.pone.0219847
Woitaszewski L. (2023). Cover crop management strategies for driver weeds in Kansas. Manhattan, KS: Kansas State University. Available at: https://krex.k-state.edu/handle/2097/43287 (Accessed September 9, 2023).
Keywords: cover crops, herbicide resistance management, weed seedbanks, aboveground weed communities, integrated weed management
Citation: Oys E, Krupek FS, Proctor C, Koehler-Cole K and Basche A (2025) Exploring how multi-year cover crop use alters above and belowground weed communities in limited tillage corn–soybean systems. Front. Agron. 7:1575785. doi: 10.3389/fagro.2025.1575785
Received: 12 February 2025; Accepted: 23 April 2025;
Published: 27 May 2025.
Edited by:
Garima Singh, Pachhunga University College, IndiaReviewed by:
Ioannis Roussis, Agricultural University of Athens, GreeceMarcelo L. Moretti, Oregon State University, United States
Copyright © 2025 Oys, Krupek, Proctor, Koehler-Cole and Basche. This is an open-access article distributed under the terms of the Creative Commons Attribution License (CC BY). The use, distribution or reproduction in other forums is permitted, provided the original author(s) and the copyright owner(s) are credited and that the original publication in this journal is cited, in accordance with accepted academic practice. No use, distribution or reproduction is permitted which does not comply with these terms.
*Correspondence: Andrea Basche, YWJhc2NoZTJAdW5sLmVkdQ==