 Xuhua Hu1,2
 Chiara Corbari
 Yufeng Luo
- 1State Key Laboratory of Water Resources Engineering and Management, Wuhan University, Wuhan, Hubei, China
- 2Department of Civil and Environmental Engineering, Politecnico di Milano, Milan, Italy
- 3Department of Hydraulic Engineering Technical Research, Inner Mongolia Water Conservancy Research Institute, Hohhot, China
- 4United Nations Educational, Scientific and Cultural Organization (UNESCO) Multisectoral Regional Office for East Asia, Beijing, China
Introduction: Rising rice demand has intensified pressure on irrigation water resources in China. Improving rainfall water use is an important way to reduce the pressure on irrigation water and avoid wasting water. Cumulative precipitation forecasts are expected to better match rice water needs with rainfall. Their accuracy and effectiveness for rice irrigation scheduling have not been evaluated.
Methods: In this study, cumulative precipitation forecasts with 3, 5, and 7 days of lead time were defined to improve the use of precipitation forecast. On this basis, these cumulative precipitation forecasts and the daily precipitation forecasts have been applied for irrigation forecast using rules at a China-wide scale. The quality of cumulative precipitation forecast and daily precipitation forecast were compared, and their effects on irrigation compared with conventional flood irrigation evaluated.
Results: The results showed that the precipitation forecasts from public weather forecasts had a clear seasonal and spatial pattern in the different rice cropping regions. They had better performance in inland gently sloping regions than in highland or coastal regions. Percentage correct (PC), defined as the proportion of forecast precipitation grades, correctly predicted compared to measured rainfall data, which ranged from 0.413 to 0.758. Precipitation amount correct rate (PAC), defined as the ratio of correctly predicted precipitation amount to observed amount, was higher for cumulative forecasts than that for the daily forecasts. All forecasts granted a higher precipitation utilization efficiency (PUE) of the paddy field when compared against conventional irrigation, with the 7-day cumulative precipitation forecast reaching an average PUE of 0.603. Generally, the volume of the water used for irrigation and the drainage one was reduced when employing the cumulative precipitation forecast and the number of irrigation and drainage actions. These reduction effects intensified with longer cumulative forecast horizons. The best performance was obtained for the 7-day cumulative precipitation forecasts, which allowed reducing the irrigation water by 20.81% and the number of irrigation actions by 25.80%. Irrigation scheduling based on cumulative precipitation forecasts had a small effect on yield, approximately 0.01%.
Discussion: The improved irrigation efficiency observed with cumulative precipitation forecasts, especially the 7-days forecast, suggests that integrating cumulative precipitation predictions into irrigation decisions can significantly reduce water use without compromising rice yield.
1 Introduction
Rice is one of the most important grains and has grown over a vast area in China (Song et al., 2017; Halder et al., 2020; Hu et al., 2021; Wei et al., 2022). Its cultivation process consumes a huge amount of water, which mainly comes from irrigation and rainfall (Tuong et al., 2005; Humphreys et al., 2006; Bouman et al., 2007; Reavis et al., 2024). Although rice is mostly grown in areas with abundant rainfall, the water available for agricultural irrigation has been declining in recent years, as industrial, urban, and ecological water demand has been increasing, and the pressure on water use has been increasing (Xiong et al., 2010; Sutcliffe et al., 2021). To ensure food security, water conservation is needed in rice production in China (Yao et al., 2012). Improving the management of rice irrigation during cultivation and increasing the utilization of precipitation can reduce water stress in agriculture.
Rainfall is one of the main sources of water in paddy fields in China, apart from irrigation supplements (Chen et al., 2021; Zhao et al., 2023). Investigating temporal and spatial variation patterns in precipitation forecast accuracy could theoretically enhance the transferability of irrigation management methods. Maximizing rainfall utilization significantly aids in conserving irrigation water. Irrigation forecasts that consider future rainfall can enhance water management for farmland and reduce rainwater wastage (Linker and Sylaios, 2016; Corbari et al., 2019; Zimit et al., 2023; Zhao et al., 2023). Despite advancements in precipitation forecasting skills, they still have a lot of uncertainties, and their application in paddy field irrigation management remains limited (Kirthiga et al., 2024; Hsu and Lin, 2024). It is critical to analyze the accuracy of precipitation forecasts and make them more compatible with irrigation management. When using rainfall forecasts for irrigation management, it is important to consider not only the accuracy of short-term forecasts but also the spatial and temporal variation patterns to better understand and utilize the forecasts (Evans et al., 2020; Chen et al., 2024).
Critical limitations persist in effectively operationalizing rainfall forecasts, particularly in view of their inherent spatiotemporal uncertainties, into irrigation decision frameworks. Studies on improving water use efficiency in irrigation management primarily focus on optimizing irrigation methods (Kisi et al., 2021; Gao et al., 2024), reducing unnecessary water loss (Mohammadi et al., 2019; Paria et al., 2025; Gebru et al., 2025), and refining rainfall forecasts (Kirthiga et al., 2024; Collins et al., 2024). Some studies also explore the potential of using short-term weather forecasts to enhance irrigation water-saving efficiency. For example, Ravazzani et al. (2017) combined numerical rainfall forecast with a hydrological simulation model to predict soil moisture content and crop water demand in northern Italy. Chen et al. (2021) applied machine learning algorithms to reduce the uncertainty of rainfall forecasts in irrigation decision-making. Much of this research focuses on integrating weather forecast with various tools; there is limited attention given to improving the utilization of rainfall forecasts. Rainfall forecast is more challenging than predicting other weather variables such as temperature and wind speed (Scheuerer and Hamill, 2015; Calvo-Olivera et al., 2024). Therefore, it is important to enhance our understanding of rainfall forecast and explore better ways to leverage it. Optimizing irrigation management by integrating its variation patterns and formulating more scientifically reasonable irrigation plans can effectively improve rainfall utilization efficiency and save irrigation water (Kharrou et al., 2011; Saccon, 2018).
The potential risks of cumulative rainfall forecasts for irrigation are not yet fully understood (Cai et al., 2011; Hsu and Lin, 2024; Collins et al., 2024). Public weather forecasts in China, which have the advantages of easy access, simplicity of use, and wide coverage, have already been applied in water-saving irrigation. They provided significant utility to Chinese irrigation managers and farmers (Cao et al., 2019; Liu et al., 2020; Fan et al., 2021). The rainfall forecast accuracy of some scattered stations of public weather forecast in China has been analyzed (Cao et al., 2019; Chen et al., 2023). The analysis of spatial differences focuses on numerical weather forecast (Xu et al., 2018; Liu et al., 2021). There is no systematic study on the accuracy of public precipitation forecast in entire China and an analysis on its spatio-temporal variations. In addition, previous studies have mostly focused on the use of daily precipitation forecast for irrigation scheduling (Ajaz et al., 2024; Chen et al., 2023). Daily precipitation forecast is possible to forecast a continuous rainfall of 2 or more days into multiple rainfall (Li et al., 2020). For irrigation advice, the accuracy of cumulated precipitation forecasts should be analyzed considering multiple days, to be consistent with sustained multi-day rainfall and the irrigation water management in China.
This paper analyzed the performance of precipitation forecast of public weather forecast with 7 days lead time and its spatio-temporal variations within rice growth period in China. Cumulative precipitation forecasts are used to predict the total amount of rainfall for a complete rainfall event. Three time scales were considered: 3, 5, and 7 days. The accuracy of precipitation forecasts was evaluated by comparing them with observed rainfall data. Based on this, a simple decision rule-based method for rice irrigation scheduling using precipitation forecast information was developed. The impact of various cumulative precipitation forecasts on irrigation scheduling has been evaluated by using conventional flood irrigation as comparison. The objectives of this work are (1) to evaluate the quality and spatio-temporal variations of short-term precipitation forecasts in Chinese public weather forecast against ground observed rainfall data, (2) to explore the skill of cumulative precipitation forecasts and compare them with the quality of the daily forecasts, and (3) to analyze whether cumulative precipitation forecasts can be better utilized in irrigation to meet the need for optimizing irrigation scheduling.
2 Materials and methods
2.1 Study area
China has widely distributed rice cropping areas. Mei et al. (1988) divided rice areas into six rice cropping regions according to the ecological environment, socio-economic conditions, and characteristics of rice cultivation in China. These are South China double rice cropping region (RI), Central China double and single rice cropping region (RII), Southwestern plateau region of single and double rice cropping (RIII), North China single rice cropping region (RIV), Northeast China early maturing and single rice cropping region (RV), and Northwest China single rice cropping region in dry areas (RVI). A total of 156 meteorological stations in six rice cropping regions with different rice types were selected for analysis (Figure 1; Supplementary Table A1).
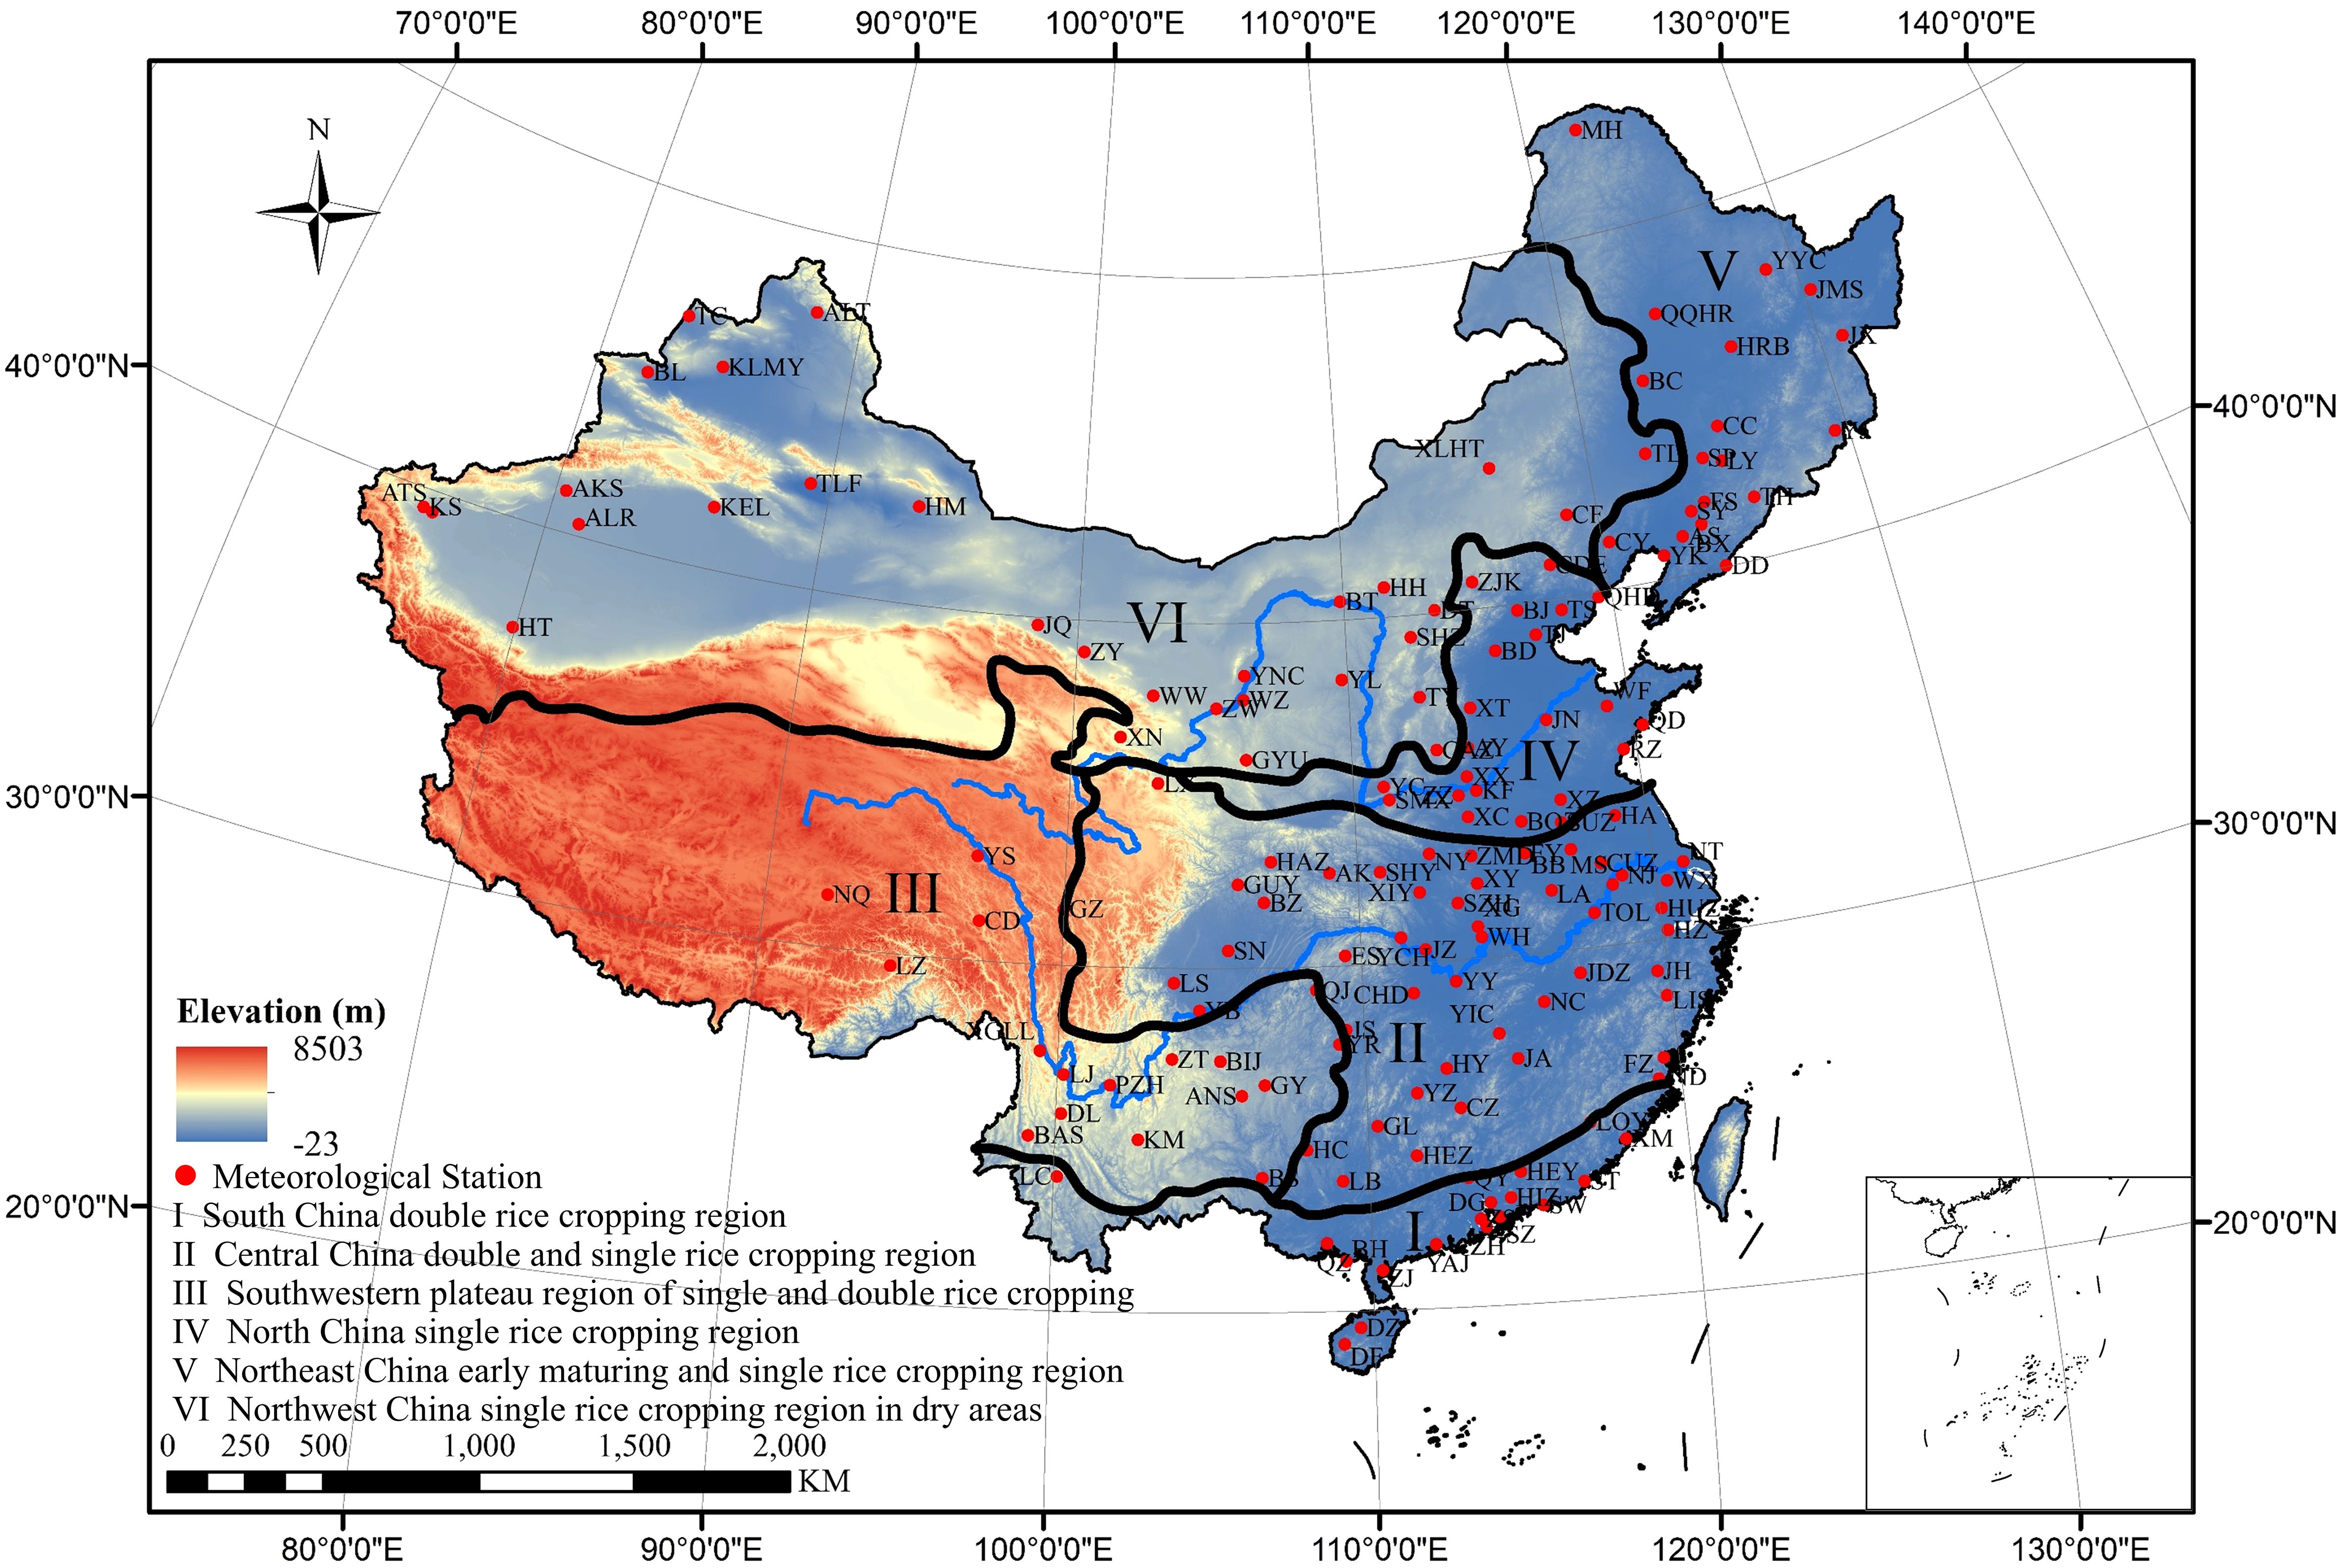
Figure 1. Map of rice cropping regions and meteorological stations in China.
2.2 Datasets
2.2.1 Weather forecast data and observed meteorological data
Data of 156 meteorological stations covering the whole of China from 2012 to 2020 were collected. The daily observed meteorological data were obtained from the China Meteorological Data Service Center (https://data.cma.cn), including daily average air temperature, maximum air temperature, minimum air temperature, average relative humidity, average wind speed, precipitation and sunshine duration. According to the daily observed precipitation, the daily precipitation grade is categorized into seven levels: no rain (NR), light rain (LR), moderate rain (MR), heavy rain (HR), storm (ST), heavy storm (HS), and severe storm (SS) (Table 1).
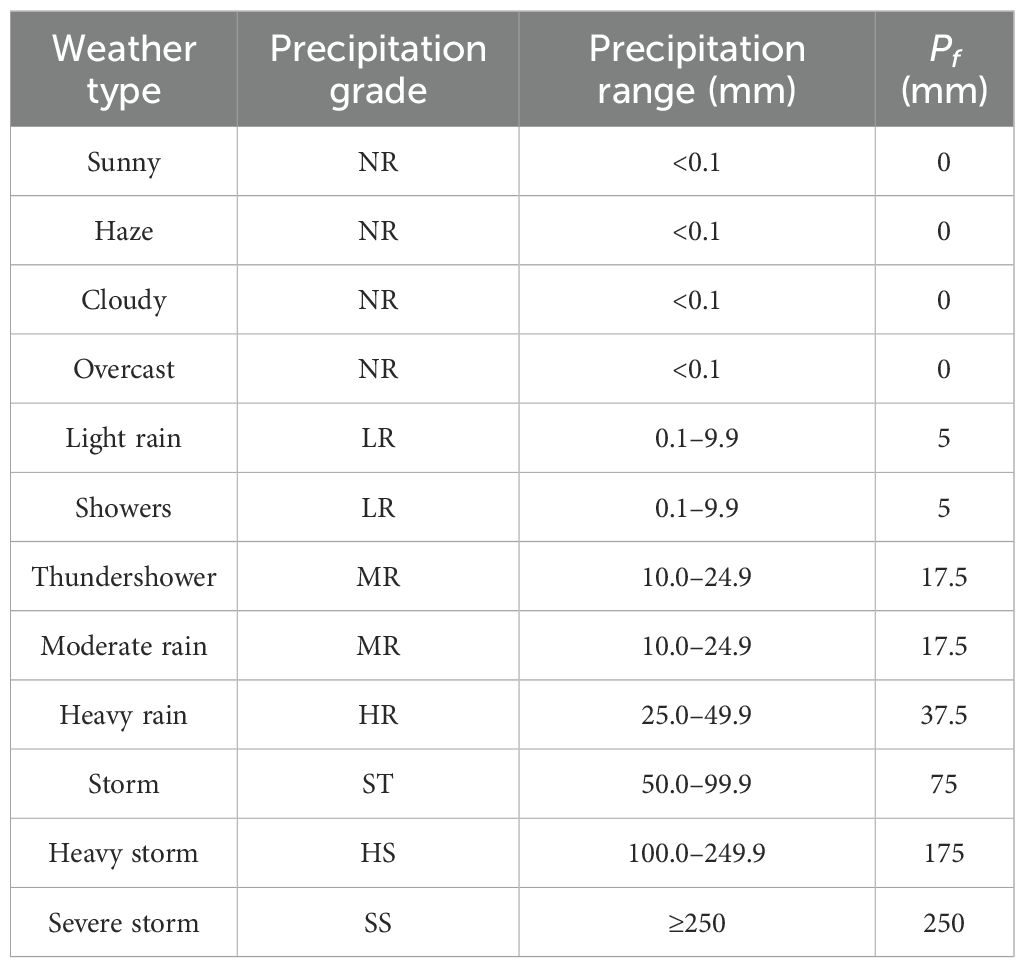
Table 1. Weather types and their corresponding precipitation grade, precipitation ranges, and Pf values.
Weather forecast data for the same period were obtained from China Weather (http://www.weather.com.cn). Daily weather forecast data contain daily minimum air temperature, maximum air temperature, precipitation, and weather type information with 7 days lead time. With reference to the China Meteorological Administration (CMA) standards (CMA, 2012), the forecast precipitation was set to the median value of the precipitation range corresponding to each weather type. Although some weather types share the same precipitation range, they are still considered as different types due to different statistical properties (Table 1). The formula for determining the forecasted precipitation (Pf) is given as Equation 1:
where j denotes the simple weather type included in the composite weather type Ω, and g is the number of simple weather forecast types included in the composite weather type Ω.
2.2.2 Rice irrigation management and crop phenology
The conventional irrigation for paddy rice in most areas of China is flood irrigation (Mao, 2002; Dong et al., 2020). The water control criteria are slightly different, but not much different in each region. The criteria for water level in each rice growth stage of conventional flood irrigation are shown in Table 2 (Guo, 2005). Conventional flood irrigation management for paddy rice is governed by specific criteria related to field water levels, which include the minimum water level (hmin), the maximum water level (hmax), and the maximum allowable water level after rainfall (Hp). Irrigation is triggered when the water level in the field falls below the minimum threshold (hmin), and water is applied until the upper threshold (hmax) is reached. Additionally, drainage is initiated whenever the water level exceeds Hp to prevent waterlogging and protect the crop.
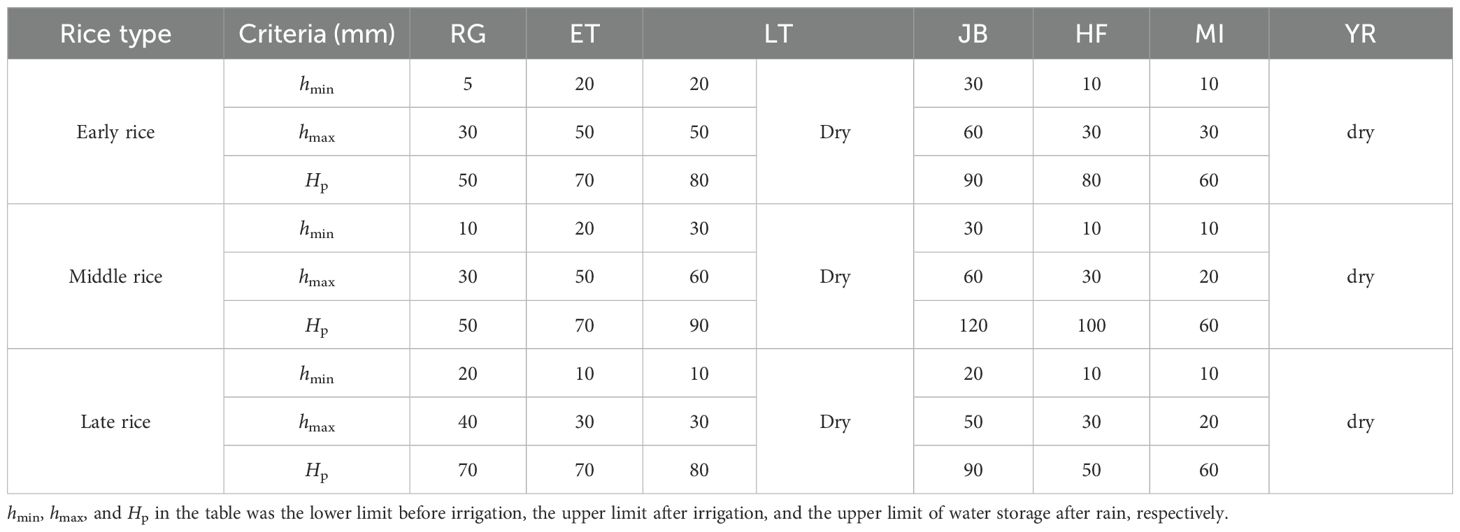
Table 2. Criteria of water level in paddy field for each rice type.
In this study, the analyses have been carried out on a large scale, considering the entire Chinese territory, and detailed information crop growth stage, sowing, and harvesting periods are not available. Thus, the growth stages division and the crop coefficients (Kc) used in this paper were obtained as the average of the representative stations in each rice cropping region (Chen et al., 2023). The rice growth stage is usually divided into seven stages, including the stages of returning green (RG), early tillering (ET), late tillering (LT), jointing–booting (JB), heading flowering (HF), milk-ripe (MI), and yellow-ripe (YR). The rice growth stages division and Kc values are reported in Table 3. Rice needs to be sun-dried at the end of tillering stage to control ineffective tillering. Paddy fields are sun-dried for the last 5 days at the end of tillering stage and fall-dried at the YR stage. Each rice cropping region has different types of rice. Rice was classified into 11 possible combinations of regions and rice types in Table 3.
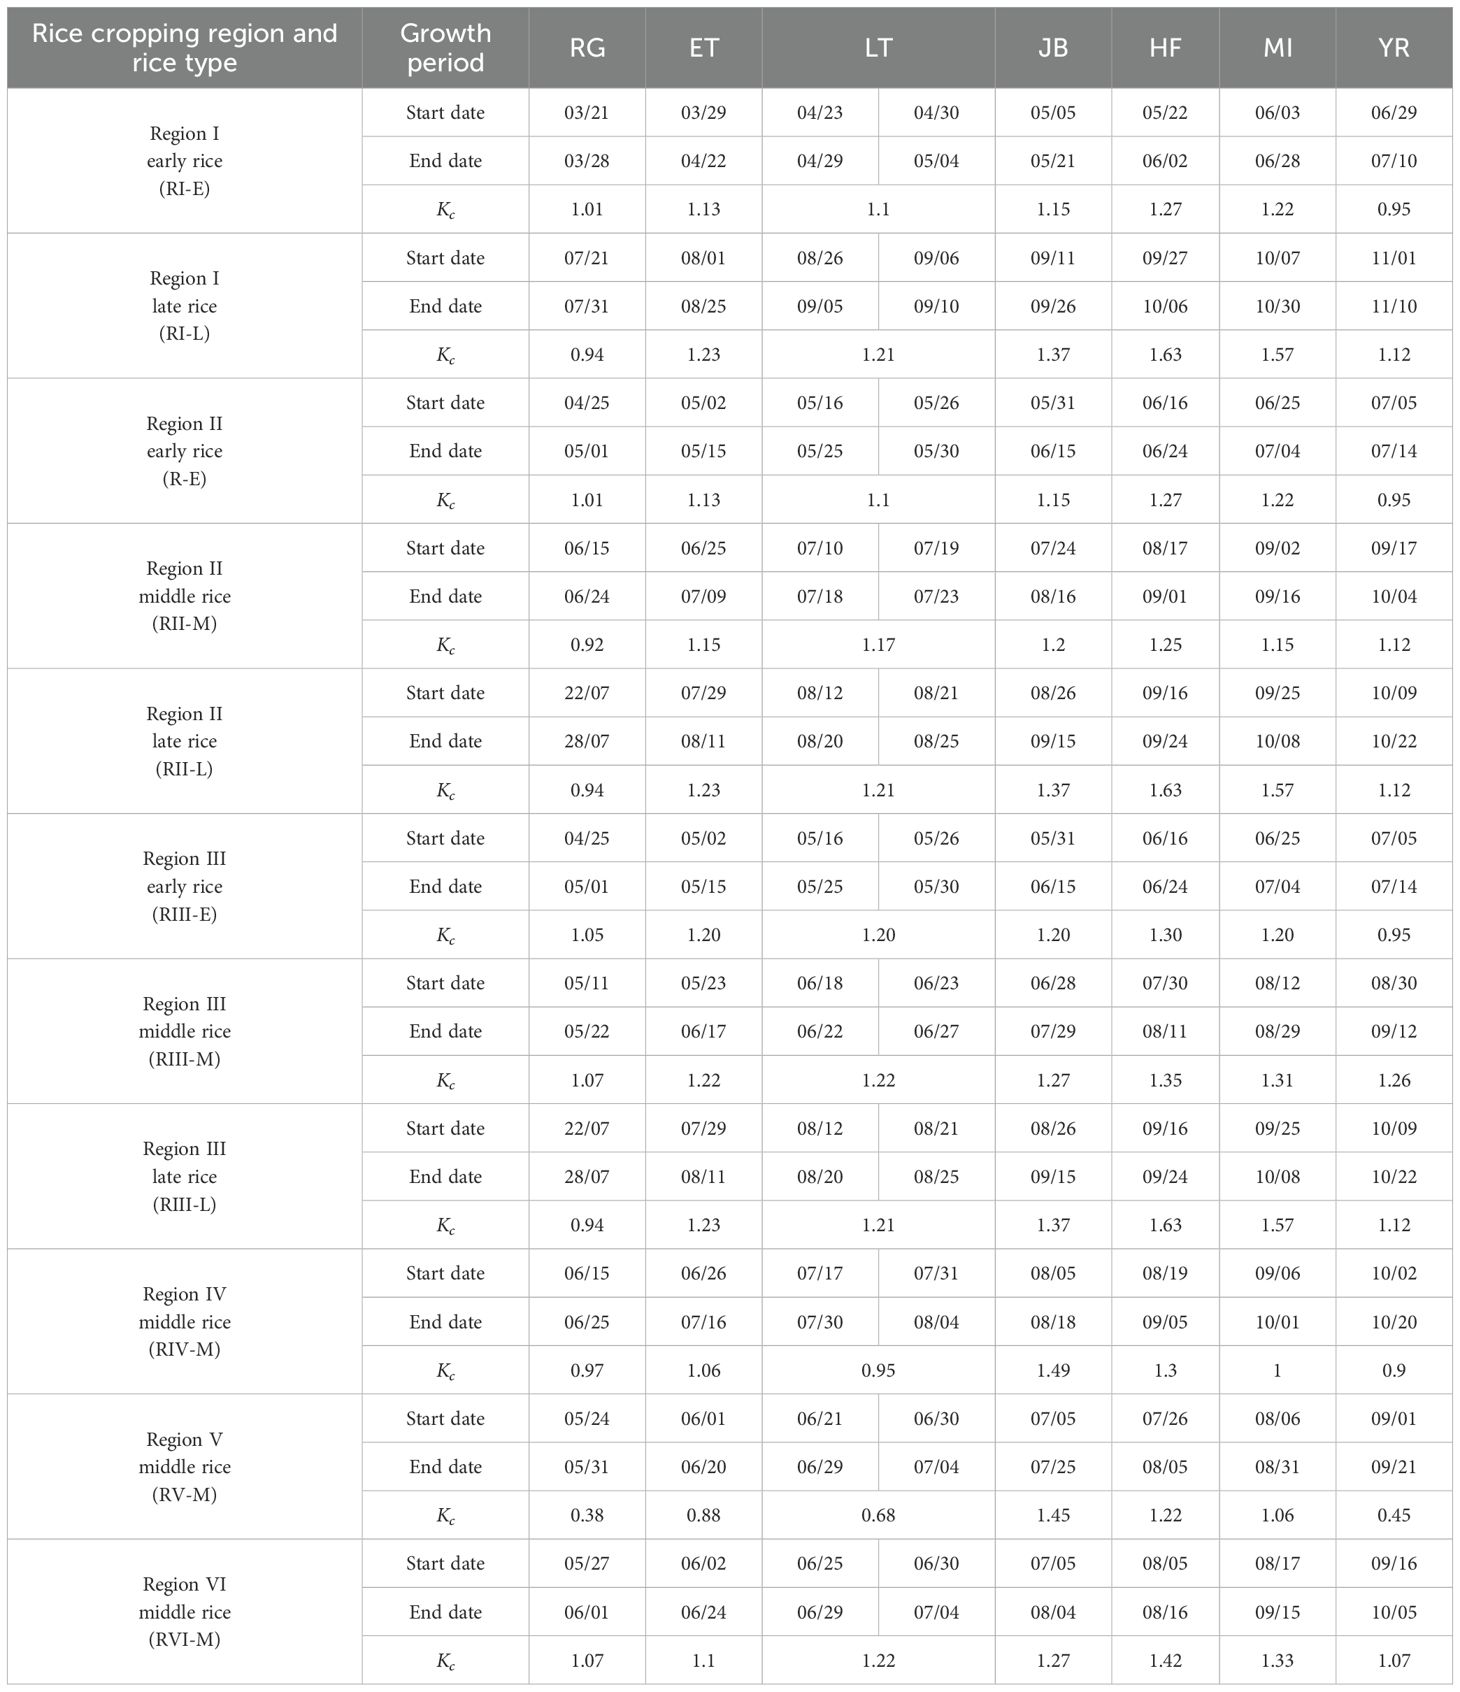
Table 3. Growth stage duration and recommended Kc of paddy field water level for each rice cropping region.
2.3 Evaluation of precipitation forecasts
2.3.1 Statistical indexes
The quality of precipitation grade forecast was evaluated by using Percentage Correct (PC), Threat Score (TS), Missing Alarm Rate (MAR), and False Alarm Rate (FAR), which were calculated by Equations 1–5 (Donaldson et al., 1975; Wilks, 2006):
where Ak is the number of days in which both prediction and observation fall within the specified k range, Bk is the number of days in which observations fall within k but forecasts do not, Ck is the number of days in which forecasts fall within k but observations do not, and Dk is the number of days in which both forecast and observation are outside the k range.
A linear regression model was developed to analyze the trends of PC in China, with time (t) as the independent variable and PC as the dependent variable. The regression equation is as Equation 6:
where PCslope represents the slope of the equation, indicating the linear trend of the time series; t refers to the year; and b is the regression constant. The series exhibits a positive trend when PCslope is >0, and it exhibits a negative trend when PCslope is <0. The magnitude of the trend increases with the absolute value of PCslope.
The evaluation of precipitation grade forecasts does not fully reflect the accuracy of cumulative precipitation forecasts. Calculating the ratio of correctly forecasted precipitation to observed precipitation can be used to analyze the accuracy of cumulative precipitation forecasts. Forecast precipitation amount correct rate was calculated according to the following Equation 7:
where PAC, which the forecast precipitation amount correct rate during rice growth period, is defined as the ratio of correctly predicted precipitation amount to observed amount; P is the amount of observed precipitation during rice growth period, mm; and Pf is the amount of forecast precipitation during rice growth period, mm.
Pearson correlation coefficient indicates the degree of correlation between two sets of data (Sun and Qin, 2016). It was used to analyze the relationship between PAC and irrigation variables. The formula is as Equation 8 (Kang et al., 2017):
where is the correlation coefficient between x and y, while is the ETo value in i year, and y is the meteorological variable value in i year. and are the average values of x and y; N is the number of samples. X and Y are positively related when r>0. X and Y have a negative correlation when r<0. The greater the absolute value of the number, the greater the strength of the correlation between the two variables. SPSS software was used for statistical analysis. The significance of correlation coefficient was tested by t-test and p-value <0.05 was considered statistically significant (Hu et al., 2021).
2.3.2 ROC curve
The timeliness of precipitation forecasts is examined by analyzing the precipitation forecasts with 7 days lead time through the receiver operating characteristic (ROC) curve. The performances will be analyzed in a confusion matrix. ROC is an effective method for rating binary classification based on performance, allowing to discriminate the information data (Aburas et al., 2017). Public weather forecasts for each precipitation grade are also a binary classification process; thus, ROC can be applied to rainfall forecast quality testing. The true positive rate (TPR) and the false positive rate (FPR) are calculated as Equations 9, 10 (Fawcett, 2006).
ROC graph is a two-dimensional graph in which TPR is plotted on the Y-axis and FPR is plotted on the X-axis. The ROC curve is fitted according to these points. When ROC is located above the diagonal line, it indicates that the TPR is greater than FPR. In this case, the area under the curve (AUC) is >0.5, indicating positive forecast significance.
2.3.3 Precipitation utilization efficiency
Based on the historical meteorological data and rice irrigation rules, the water management process of paddy fields under conventional flood irrigation was modeled. This model incorporated irrigation decisions informed by precipitation forecasts to estimate the drainage water from paddy fields. The precipitation utilization efficiency for paddy field was calculated according to the following Equation 11:
where PUE is the precipitation utilization efficiency of the paddy field, and D is the amount of drainage during rice growth period, mm.
2.4 Construction of precipitation predictions with various time scales
Due to the chaotic nature of the atmosphere, daily precipitation forecast skills become worse as the lead time increases (Liu et al., 2023). This does not suggest that the valuable information decreases. For rice, minor exposure to drought and flooding has less impact on its yield (Cao et al., 2019; Anupoju and Kambhammettu, 2020; Malumpong et al., 2021). Irrigation determination can depend on multi-day precipitation forecast. Two types of precipitation forecast are proposed: one is the daily precipitation forecast with different lead times, and the other one is the cumulative precipitation forecast over varying time scales. The skill of cumulative precipitation forecast has been compared to the quality of 1-day forecast. This has allowed understanding whether cumulative precipitation forecasts can be better utilized in irrigation to meet the need to optimize irrigation management.
Daily precipitation forecasts are precipitation forecasts with day 1 to day 7 lead time and represent each day’s independent forecasted precipitation. Cumulative precipitation forecasts are precipitation forecasts from 1 to m days and represent the total amount of forecast precipitation for the corresponding time scale. Cumulative precipitation forecasts have been set for three time horizons: 3, 5, and 7 days.
2.5 Irrigation scheduling
2.5.1 Water balance equation of paddy field
Irrigation scheduling is determined using the water balance method. The water balance equation for paddy fields is expressed as Equation 12:
where Hi represents the water level or the soil water storage in the crop root zone of a paddy field at the end of day i, mm/day; Hi–1 represents the water level or the soil water storage in the crop root zone of a paddy field at the end of day i–1, mm/day; ETci is the actual crop evapotranspiration on day i, mm/day; Ii is the irrigation amount on day i, mm/day; P0i is the precipitation on day i, mm/day; Si is the deep percolation on day i, mm/day; and Dri is the drainage on day i, mm/day.
ETc is estimated following the methodology developed by the Food and Agriculture Organization (FAO) of the United Nations, reported in the FAO-56 (Allen et al., 1998), Equation 13:
where Kc is single crop coefficient from Table 3, Ks is water stress coefficient, and ETo is reference evapotranspiration, mm/day.
The formula for calculating Ks suggested by FAO-56 is Equation 14:
where Dw is the depletion of water content in the rhizosphere (i.e., water deficit relative to field holding capacity), mm; TAW is the total effective water in the rhizosphere, mm; RAW is the effective water readily taken up by the crop from the rhizosphere, mm; and Ks = 1, when there is no soil water stress.
The Penman–Monteith method recommended by FAO is the most widely used ETo calculation method. This study uses it to calculate ETo, and the formula is as Equation 15 (Allen et al., 1998):
where ETo represents the daily reference evapotranspiration, mm day−1; Rn represents the net radiation at the crop surface (MJ m−2 d−1); G represents the soil heat flux (MJ m−2 d−1); γ represents the psychometric constant (kPa °C−1); T represents the average air temperature (°C); U2 represents the mean wind speed at 2 m above the ground surface (m s−1); es represents the saturation vapor pressure (kPa); ea represents the actual vapor pressure (kPa); and Δ represents the slope of the saturation vapor pressure curve (kPa °C−1).
2.5.2 Determination of irrigation and drainage
In the conventional irrigation scheduling, whether irrigation or drainage action is taken depends only on Hi–1. When Hi–1 for paddy field reaches hmin, an irrigation event occurs, and the water level is replenished to hmax. In addition, drainage events take place whenever Hi−1 is beyond Hp. Otherwise, no action is taken. The amounts of irrigation and drainage water are generally calculated by Equation 16:
To isolate the effect of precipitation forecasts on irrigation and drainage management, only the precipitation inputs to the water balance equation are forecast values, while other variables are measured values. ETc, calculated from observed weather data according to the method described in Section 2.5.1, was the input for evapotranspiration. The rules for determination of irrigation and drainage are given as follows:
1. The irrigation and drainage amounts based on daily precipitation forecast are calculated by Equation 17:
where Hf,i is the forecasted water level on day i based on daily forecast precipitation, mm; Pf,i is forecast precipitation on day i. Irrigation or drainage action does not occur when the above conditions are not met.
2. The irrigation and drainage amounts based on cumulative precipitation forecast are calculated by Equation 18:
where Hf,i+m−1 is the forecasted water level on the end of day i+m−1 based on cumulative forecast precipitation, mm; Pf,m is cumulative precipitation forecast for the next m days, mm; ETc,m is cumulative evapotranspiration for the next m days, mm; and Sm is cumulative deep percolation for the next m days, mm. Irrigation or drainage action does not occur when the above conditions are not met.
The irrigation scheduling based on the actual observed precipitation as input was used as a control group to evaluate the effect of different precipitation forecast inputs on irrigation volumes and timing.
2.6 Crop water production function
In irrigation optimization, crop water production functions (CWPFs) are commonly used to relate yield reductions at specific periods of crop growth to water deficit (Zhang and Oweis, 2007; Wu et al., 2022). The Jensen model (Jensen, 1968) was used in this study to quantify the effect of the proposed determination of irrigation and drainage on crop yield based on precipitation forecasts. The model is expressed as Equation 19:
where Ya represents the crop yield under water stress conditions, Ym represents the crop yield under non-stressed conditions, ETa,i represents the actual crop evapotranspiration during growth stage i under water stress conditions, ETm,i represents the actual crop evapotranspiration during growth stage i under non-stressed conditions, λi is water stress sensitivity index for growth stage I, and n refers to the total number of growth stages. In this study, the λi values for the three rice types are sourced from Luo (2003) as shown in Table 4.
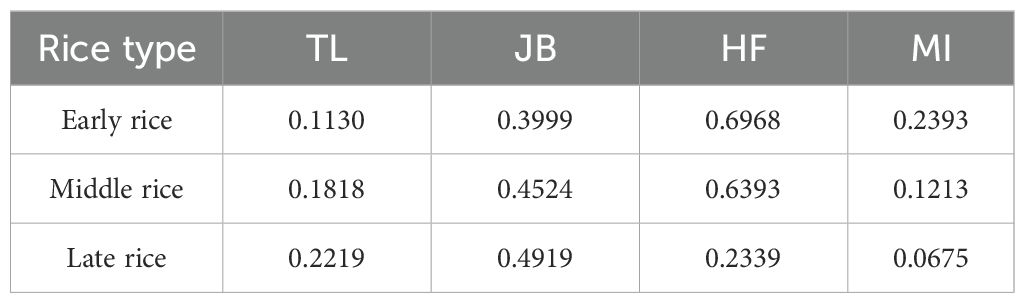
Table 4. The water stress sensitivity index at each growth stage over rice growth period for early rice, middle rice, and late rice.
3 Results
3.1 Spatio-temporal variation in daily precipitation forecast accuracy
The accuracy of daily precipitation forecasts from public weather forecasts with 7 days lead time was analyzed for the six rice cropping regions. Figure 2 shows multi-year average PC in the six rice cropping regions. The PC gradually decreased as the lead time increased, in all rice cropping region. Early and late rice had the highest PC in RII. The highest PC was obtained in RVI for middle rice, and it could reach 0.758 for day 2 lead time. The day 7 precipitation forecast for RI-E has the lowest PC value, at 0.413. Average PC in RVI was the highest at 0.727. RIII had the lowest average PC, followed by RI with 0.498 and 0.519.
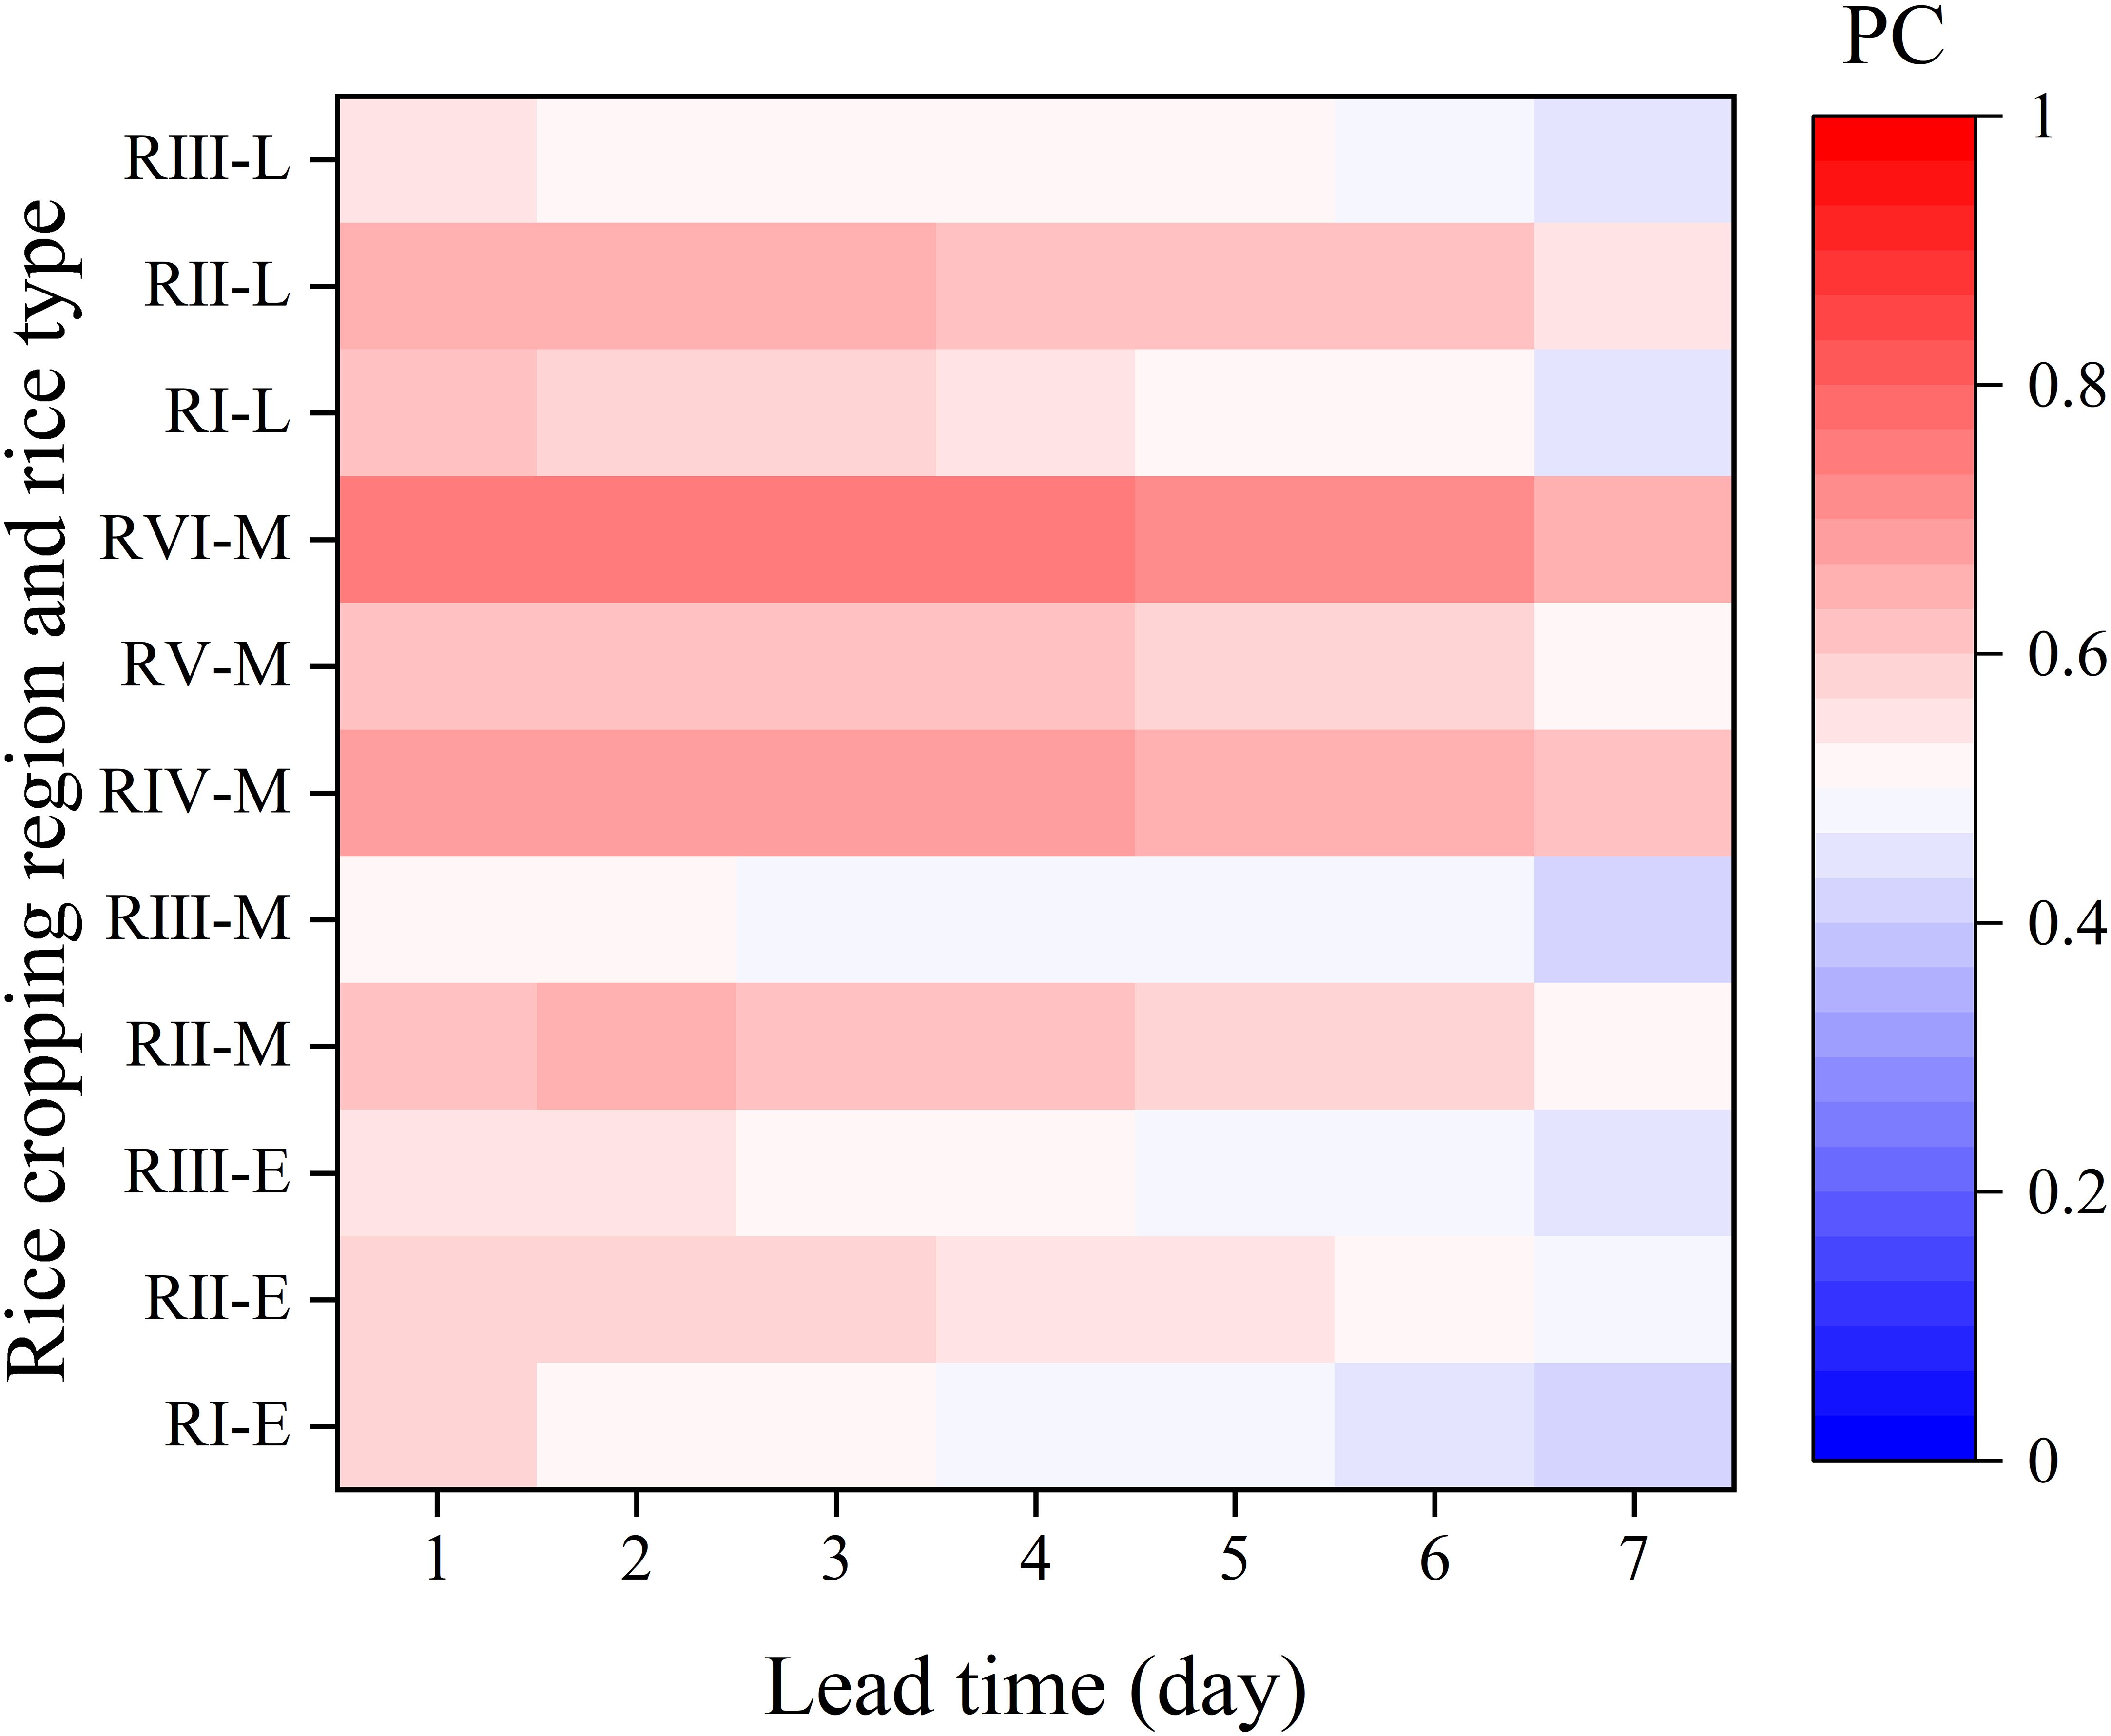
Figure 2. The multi-year average PC of daily precipitation forecast with 7 days lead time for each rice type at each rice cropping region.
From 2012 to 2020, the precipitation forecast with day 1 lead time has shown the best performance in terms of PC trends, with an upward trend in most rice cropping regions (Figure 3). The rainfall forecasts with other lead times performed on average and even showed a downward trend. Trust in rainfall forecasts still tends to be more in favor of trusting day 1 forecasts.
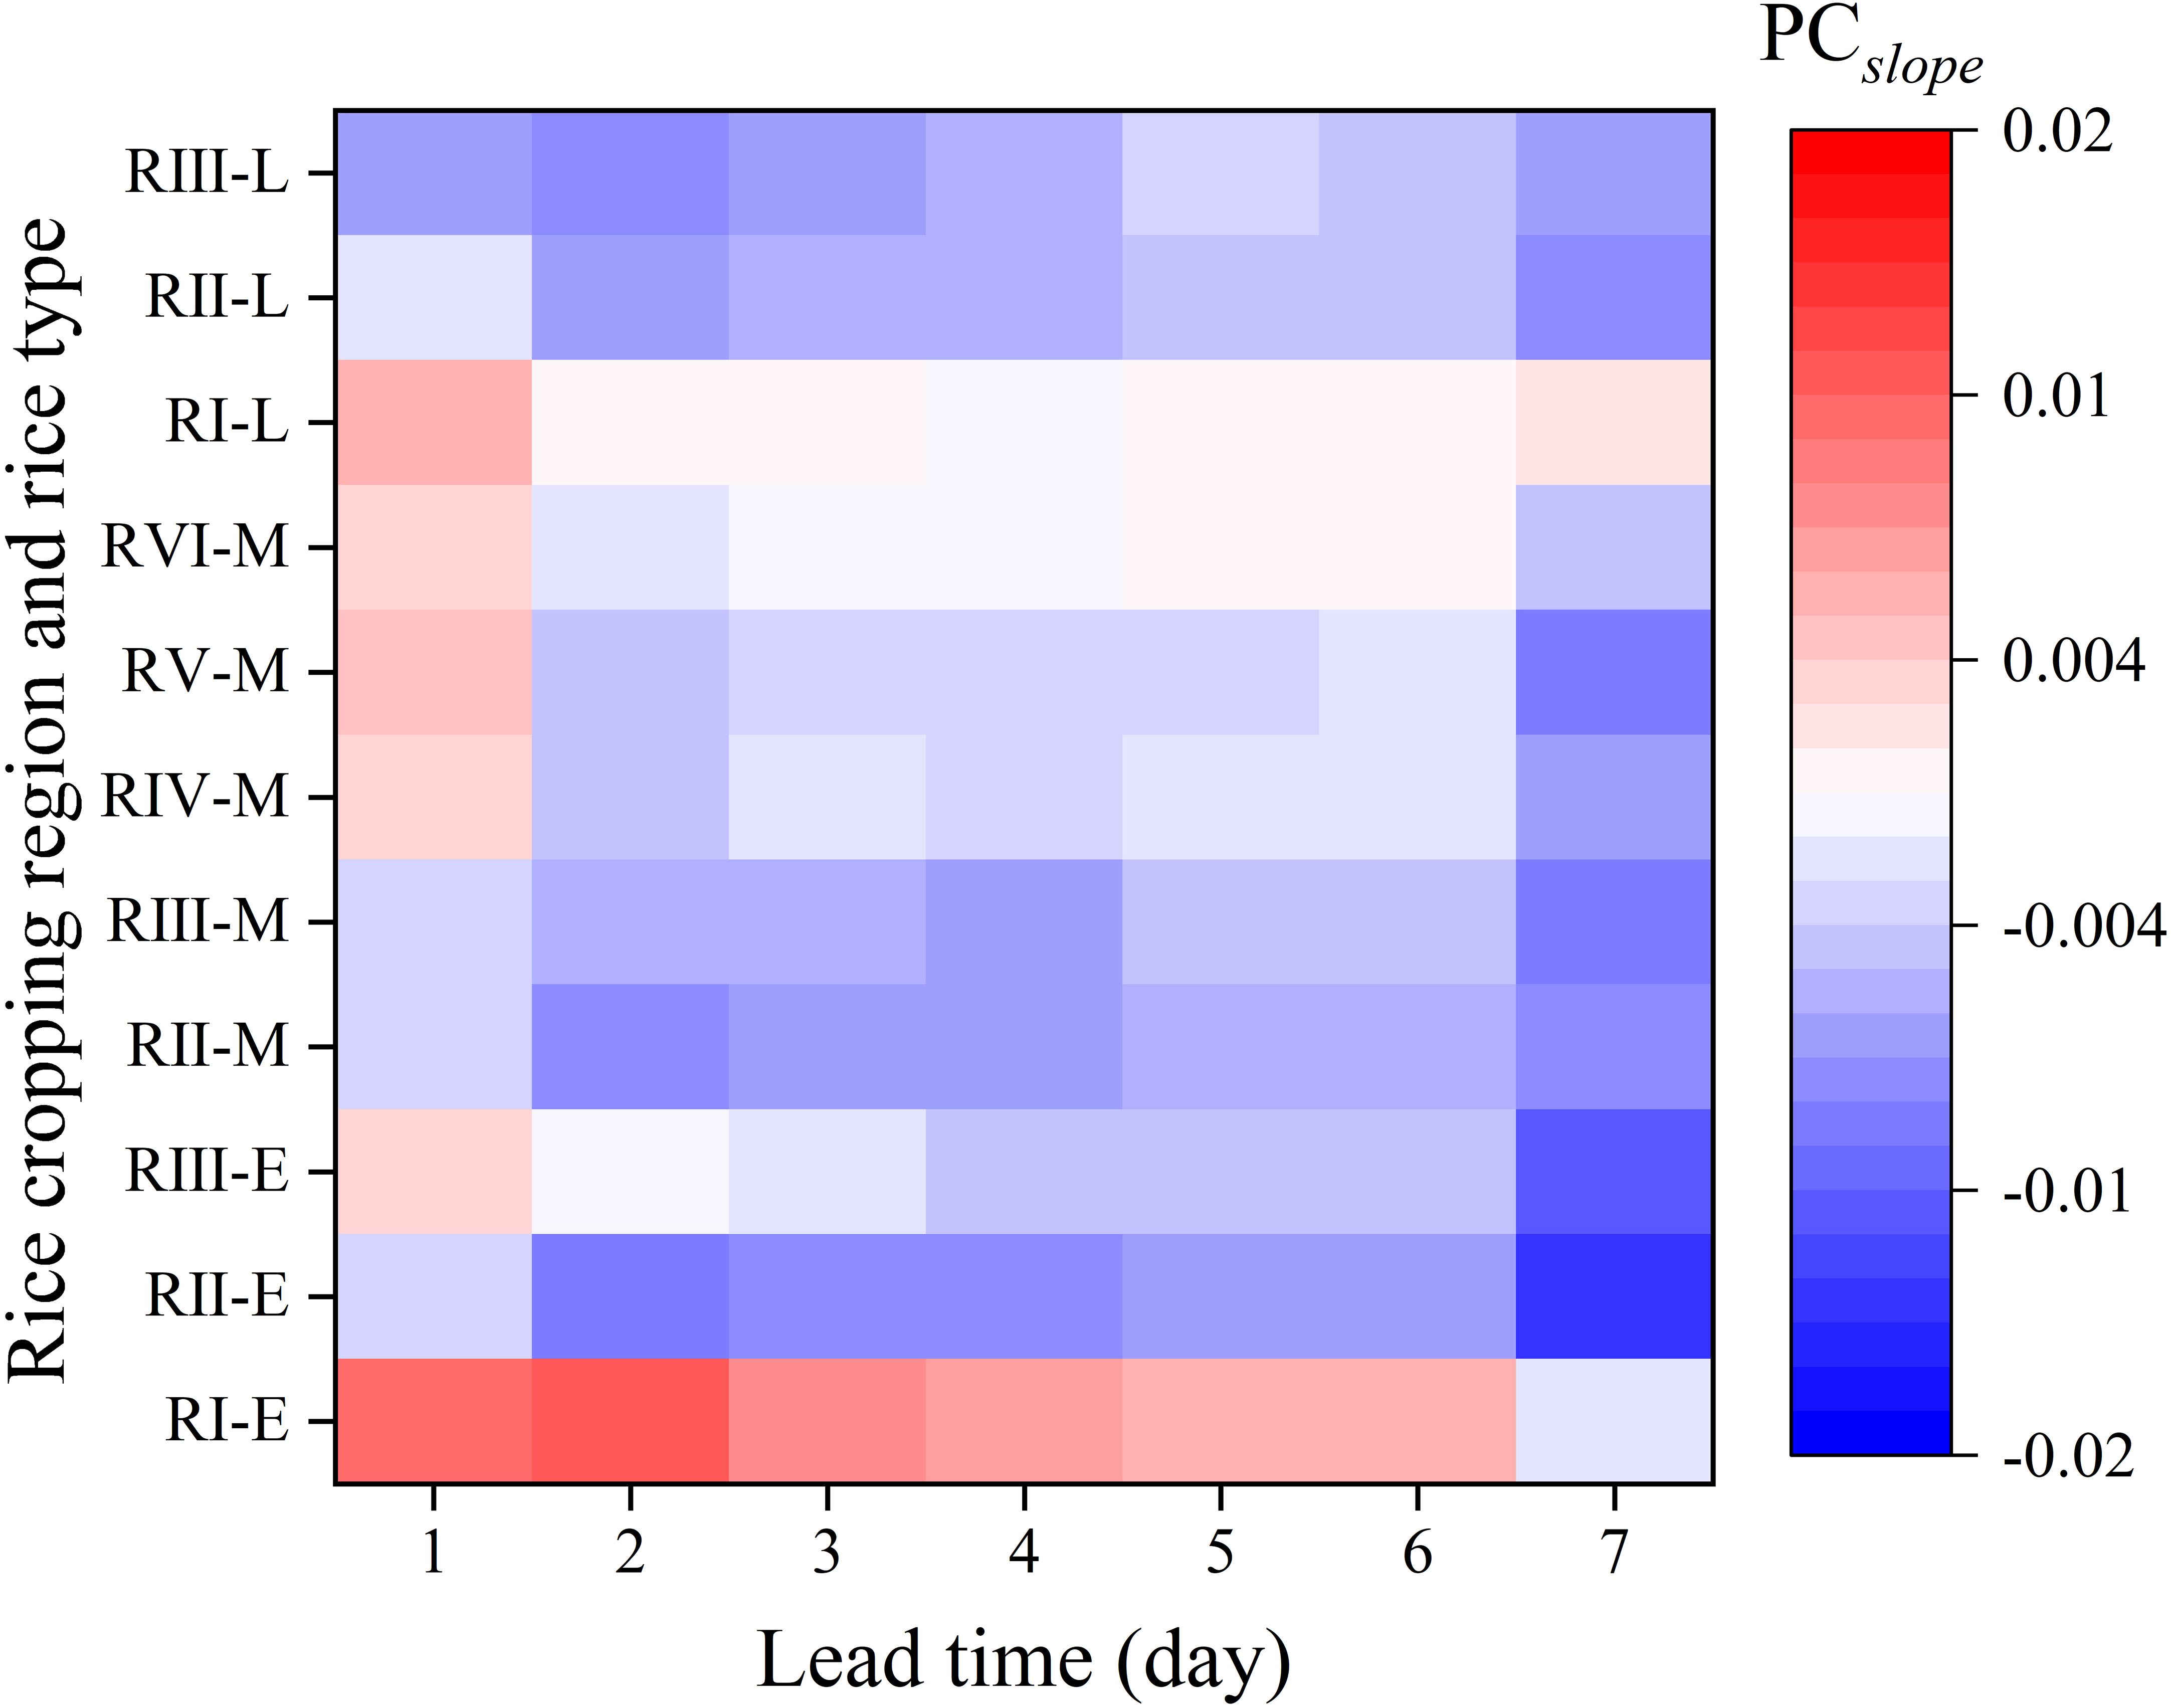
Figure 3. The trend of multi-year PC of daily precipitation forecast with 7 days lead time for each rice type at each rice cropping region.
TS, FAR, and MAR results for each region are shown in Figures 4–6, respectively. TS of every forecast precipitation grade for each rice cropping region shows a decreasing trend with the lead time increases (Figure 4). This indicates that as the lead time increases, the quality of precipitation forecasts becomes worse and less credible. The range of TS of forecasts without rain was 0.28–0.76, while the range of TS of forecasts with rain was 0.10–0.44. The performance of the forecast without rain was much better than that with rain. The lowest TS was found in MR, followed by HR. When forecast with rains, LR has the highest TS, followed by HS and ST. This indicates that among the rainfall forecasts, the smaller and larger precipitation can be forecasted more accurately, while the intermediate precipitation showed higher forecast errors. Among all the rice cropping regions, RVI-M had the highest average TS of 0.35 and the best forecast quality. RI-E had the lowest average TS of 0.25 and the worst average forecast quality. RIII had the worst performance in the NR forecast. In conclusion, precipitation forecast accuracy was the highest for middle rice, second highest for late rice, and the worst accuracy was obtained for early rice.
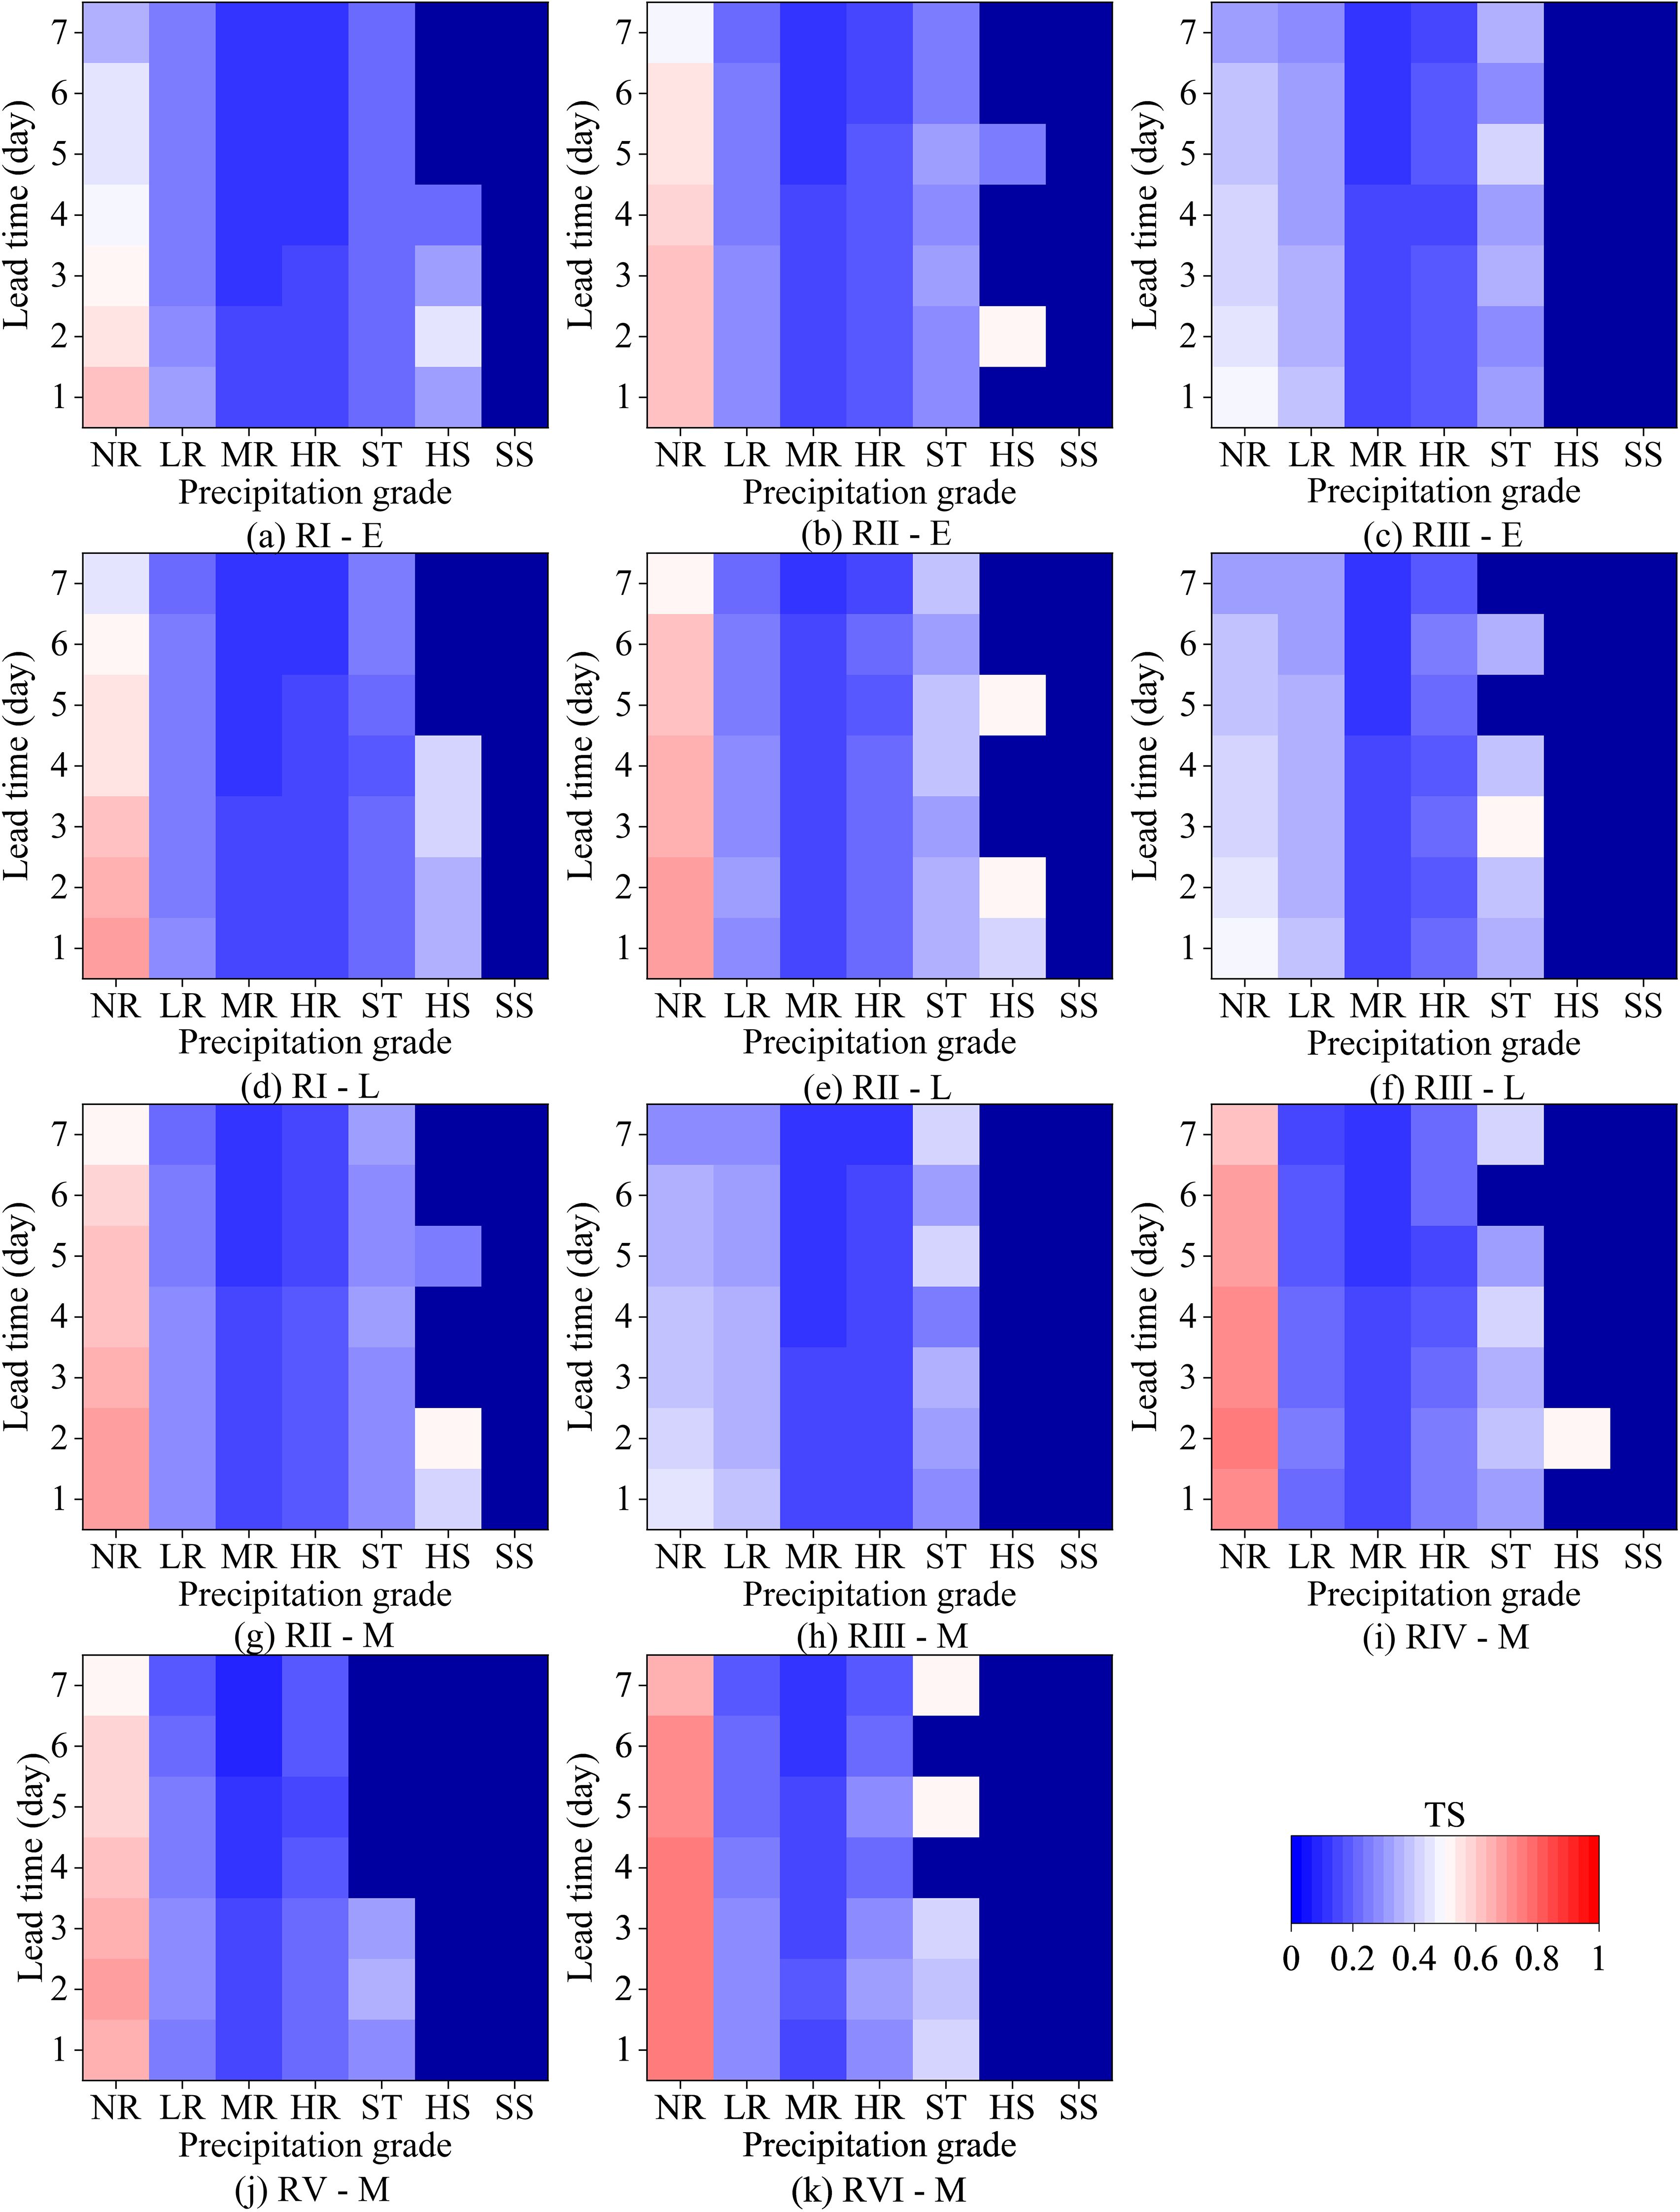
Figure 4. The multi-year average TS of daily precipitation forecast with 7 days lead time for each rice type in each rice cropping region. (a) RI–E, (b) RII–E, (c) RIII–E, (d) RI–L, (e) RII–L, (f) RIII–L, (g) RII–M, (h) RIII–M, (i) RIV–M, (j) RV–M, (k) RVI–M.

Figure 5. TThe multi-year average FAR of daily precipitation forecast with 7 days lead time for each rice type in each rice cropping region. (a) RI–E, (b) RII–E, (c) RIII–E, (d) RI–L, (e) RII–L, (f) RIII–L, (g) RII–M, (h) RIII–M, (i) RIV–M, (j) RV–M, (k) RVI–M.
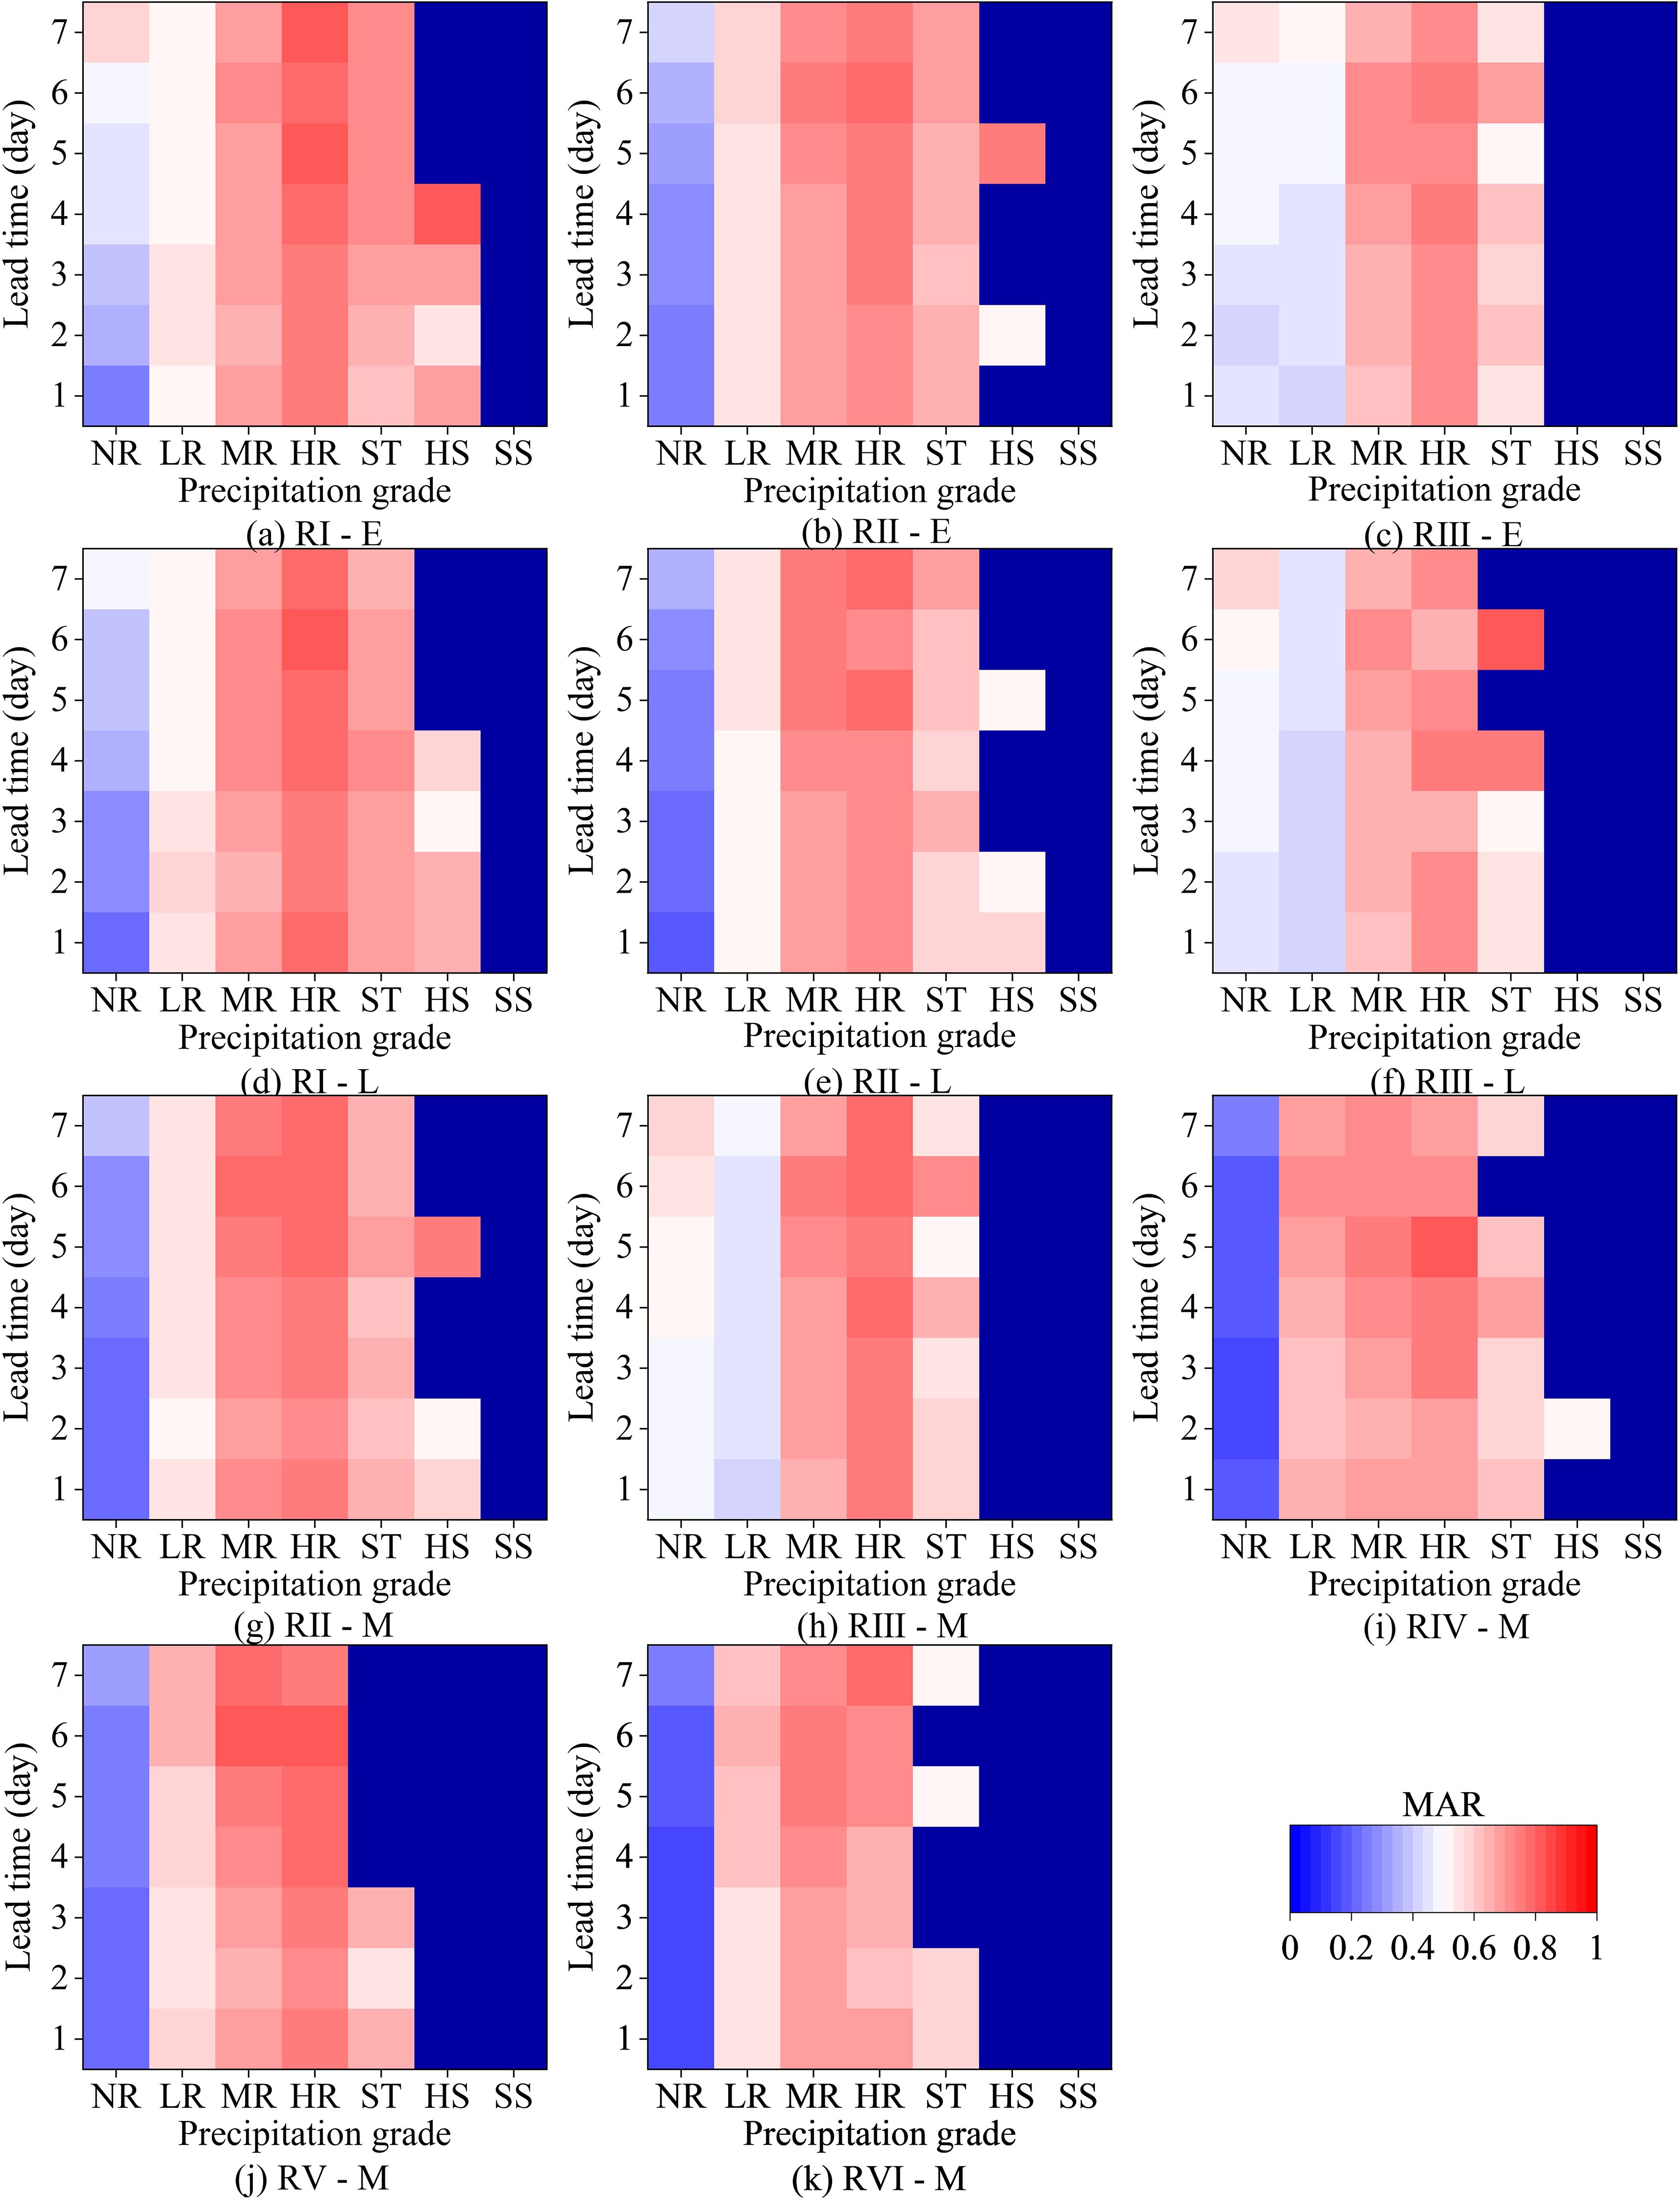
Figure 6. The multi-year average MAR of daily precipitation forecast with 7 days lead time for each rice type in each rice cropping region. (a) RI–E, (b) RII–E, (c) RIII–E, (d) RI–L, (e) RII–L, (f) RIII–L, (g) RII–M, (h) RIII–M, (i) RIV–M, (j) RV–M, (k) RVI–M.
There was an overall increasing trend in FAR and MAR for every precipitation grade forecast for each rice cropping region as the lead time increased (Figures 5, 6). MAR and FAR ranged from 0.15 to 0.60 and 0.12 to 0.40 for the no-rainfall forecasts and 0.40 to 0.83 and 0.48 to 0.84 for the with-rainfall forecasts, respectively. MAR and FAR for the no-rainfall forecasts were much smaller than those for the with-rainfall forecasts at all grades. The comparison between FAR and MAR shows that the no-rain forecasts are more likely to missing rather than false alarms. Precipitation forecasts are more likely to false alarms rather than missing alarms. MR has the largest FAR among all the rice cropping regions and rice types and is the most prone to false alarms, while HR has the largest MAR among all the rice cropping regions and rice types and is the most prone to false alarms. The FAR and MAR of LR, ST, and HS are relatively smaller. The LR is more prone to false alarms, while ST is more prone to false alarms. That is more obvious when the forecast lead time is longer. Among all the rice cropping regions, it is also RVI-M that has the lowest average MAR and FAR of 0.54 and 0.53 and has the best prediction quality. RI-E has the highest average MAR and FAR of 0.62 and 0.61, so the average forecast quality is the worst.
In summary, there are large spatial variations in forecast accuracy between different rice cropping regions. The factors affecting the occurrence and development of rainfall are numerous and complex, and the process and effects of storm clouds are difficult to be precisely quantified. Precipitation grade forecast in RVI performs the best. Most area in RVI belongs to the arid and semi-arid regions of China. The average annual precipitation is <400 mm or even 100 mm (Feng et al., 2024). The arid regions have less continuous precipitation and higher accuracy of precipitation grade forecast. The performance of RI and RIII is the worst. RI is a coastal area, where the quality of precipitation forecasts is poorer, probably due to the influence of sea weather such as typhoons (Liu et al., 2023; Gao et al., 2023), and RIII is a highland area, where precipitation forecasts are poorer due to the influence of complex terrain (Guo et al., 2021). Other rice cropping regions are mainly inland that have relatively good forecast quality.
3.2 Accuracy analysis of cumulative precipitation forecasts with different time scales
ROC curves for the cumulative precipitation forecasts with three time scales and daily precipitation forecasts with 7 days lead time for different regions and rice types are shown in Figure 7. These ROC curves for the daily and cumulative precipitation forecasts are obtained by fitting the points in ROC space for each site in each year. The cumulative precipitation forecast combines the forecasted precipitation on the next m days, which leads to the accumulation of forecast errors. From Figure 7, ROC curves are above the diagonal lines. The AUC values are >0.5, indicating that the TPRs are greater than the FPRs. All the forecasts have a positive predictive value. With the increase in the lead time, the curve moves closer to the diagonal line and the AUC tends to decrease. The AUC value of the cumulative precipitation forecast does not decrease significantly compared with that of the daily forecast.
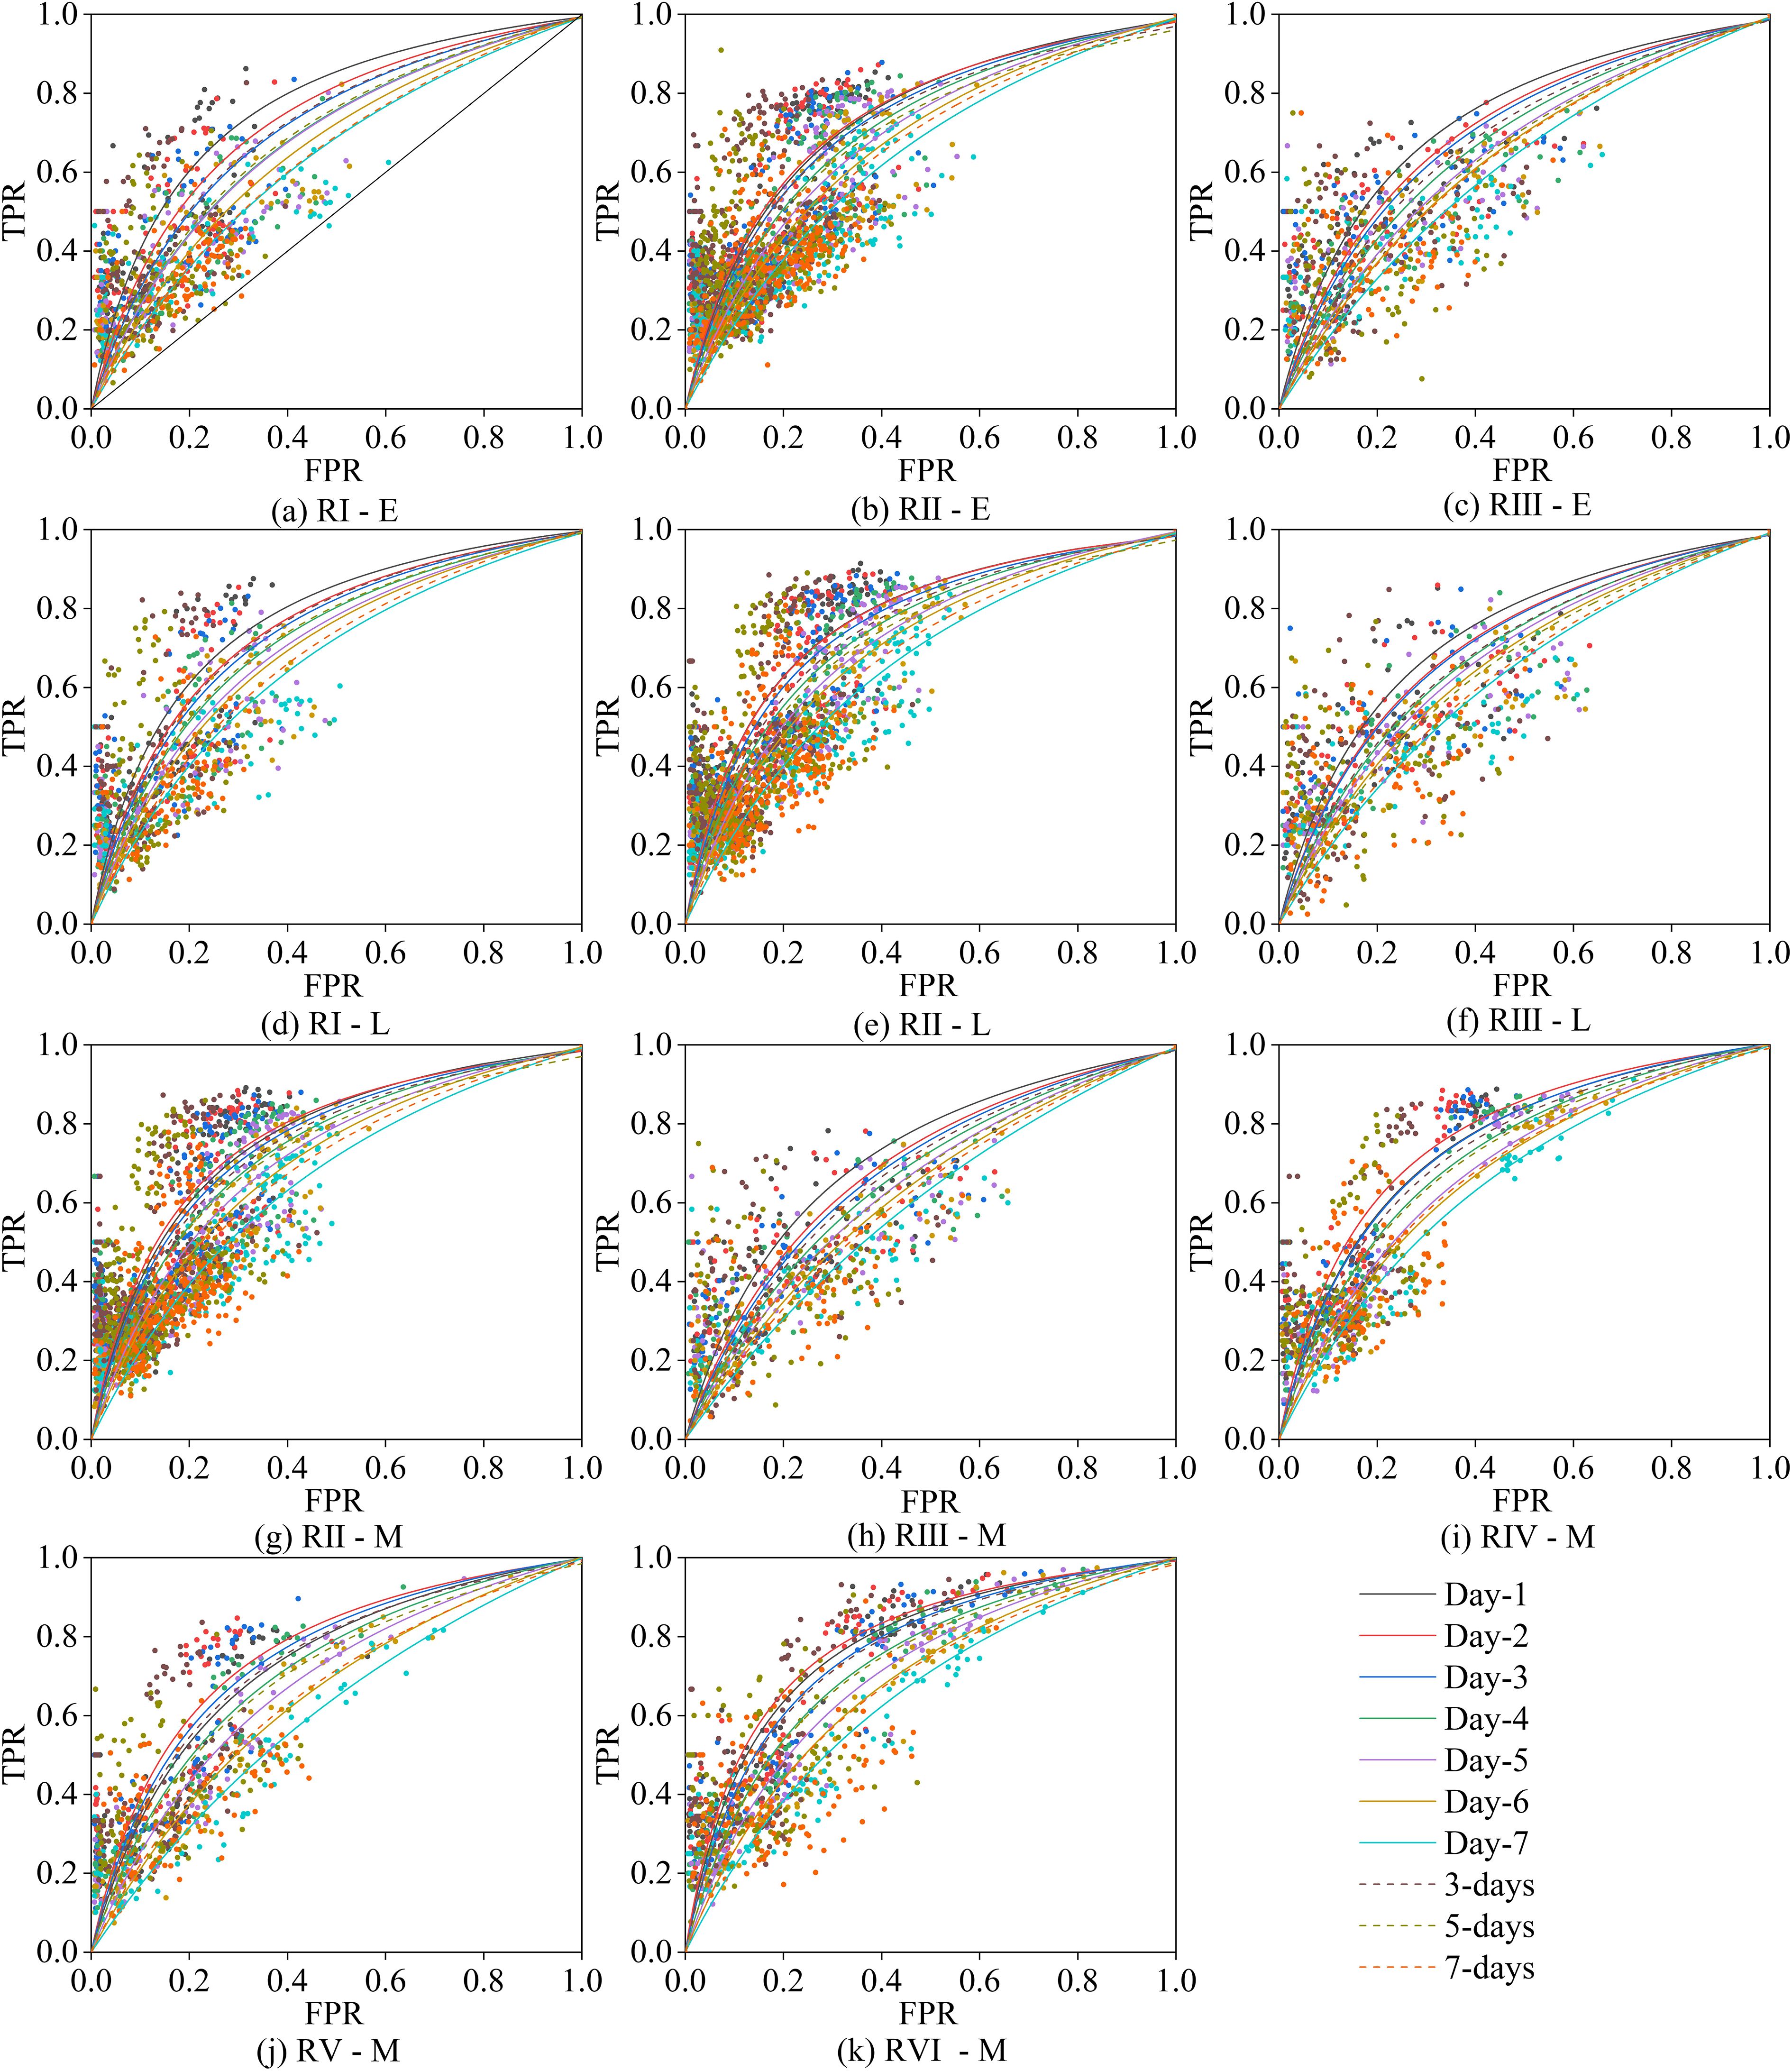
Figure 7. ROC curves for daily and cumulative precipitation forecasts in each region with each rice type. (a) RI–E, (b) RII–E, (c) RIII–E, (d) RI–L, (e) RII–L, (f) RIII–L, (g) RII–M, (h) RIII–M, (i) RIV–M, (j) RV–M, (k) RVI–M.
For early rice, the ROC curves for daily precipitation forecast for day 1 lead time are at the upper left in RI and RIII. In RII, the ROC curve for day 2 lead time forecast was slightly higher than that for day 1. The ROC curves for 3- and 7-day cumulative precipitation forecasts were slightly higher than daily precipitation forecasts for day 3 and day 7 lead time in RI, but lower than daily precipitation forecasts for day 3 and day 6 lead time in RII and RIII. ROC curves for 5-day cumulative precipitation forecasts were higher than daily precipitation forecasts for day 4 lead time in RI, but lower than daily precipitation forecasts for day 4 and day 5 lead times in RII and RIII, respectively.
For late rice, the ROC curves for daily forecasts for day 1 lead time are at the upper left. The best performance of daily forecasts is at day 1. The ROC curve for 3-day cumulative precipitation forecast is second only to day 2 in RI, and smaller than day 3 in RII and RIII. The ROC curve for the 5-day cumulative precipitation forecast is also the best in RI, second only to day 3. It is smaller than day 4 and day 6 in RII and RIII, respectively. The ROC curves for 7-day cumulative precipitation forecasts were all between the ROC curves for day 6 and day 7.
For middle rice, the ROC curve for the forecast lead time of day 1 is at the upper left in RIII, while the rest of the region is best on day 2. The ROC curves of the 3-day cumulative precipitation forecasts are smaller than those of day 3. The ROC curves of the 5-day cumulative precipitation forecasts are in between the ROC curves of day 4 and day 5 except for a little less than that of day 5 in RIII. ROC curves for the 7-day cumulative precipitation forecast are higher than these for day 6 in RIV and RV, while the rest of the regions are between the ROC curves of day 6 and day 7.
Overall, the ROC curves for day 1 or day 2 are significantly higher than the others, indicating that the AUC values for day 1 or day 2 are higher and the accuracy of the precipitation forecasts is higher. Day 7 has the lowest ROC curve, and the accuracy of the forecasts for day 7 is lower. The AUC value of the 3-day cumulative precipitation forecast is slightly lower than that of the daily precipitation forecast with day 3 lead time. The AUC value for the 5-day cumulative precipitation forecast is slightly smaller than the daily precipitation forecast with day 4 lead time but larger than the daily precipitation forecast with day 5 lead time. The cumulative precipitation forecast AUC value for 7 days is slightly smaller than the daily precipitation forecast with day 6 lead time but larger than the daily precipitation forecast with day 7 lead time.
The AUC of ROC curves for m-day cumulative precipitation forecasts are mostly larger than those for day m daily precipitation forecasts. This indicates that the cumulative errors of the precipitation grade forecast relative to the daily precipitation forecasts do not lead to a significant degradation of the precipitation rating performance. ROC curves are always above the diagonal line, and the AUC values are all >0.5, which indicates that the TPRs are greater than the FPRs, and they still have positive forecast value. The cumulative precipitation forecasts can provide better support when cumulative precipitation is used. The ROC curve for cumulative precipitation forecasts does not show more advantages because it ignores a part of the precipitation included in the forecast when the observed and forecast precipitation levels are different.
The PACs for the different precipitation forecasts in each rice cropping region are shown in Figure 8. The PAC of the cumulative precipitation forecasts is significantly improved compared to the 1-day daily precipitation forecasts. The average PAC of 1-day precipitation forecasts and 3-, 5-, and 7-day cumulative precipitation forecasts are 46.36%, 62.80%, 65.03%, and 66.59%, respectively. The 3-, 5-, and 7-day cumulative precipitation forecasts are, on average, 16.43%, 18.66%, and 20.22% more accurate than the 1-day forecasts. In most of the regions, the longer is the cumulative forecast days, the higher is the proportion of precipitation accurately predicted. The 7-day cumulative precipitation forecast of RIII-L has the highest accuracy of 77.84%. The 7-day cumulative precipitation forecast of RIV-M has the highest improvement over the 1-day forecast, with an improvement of 21.53%. Although RIII does not forecast precipitation grades very well, its PAC is higher than that of other regions.
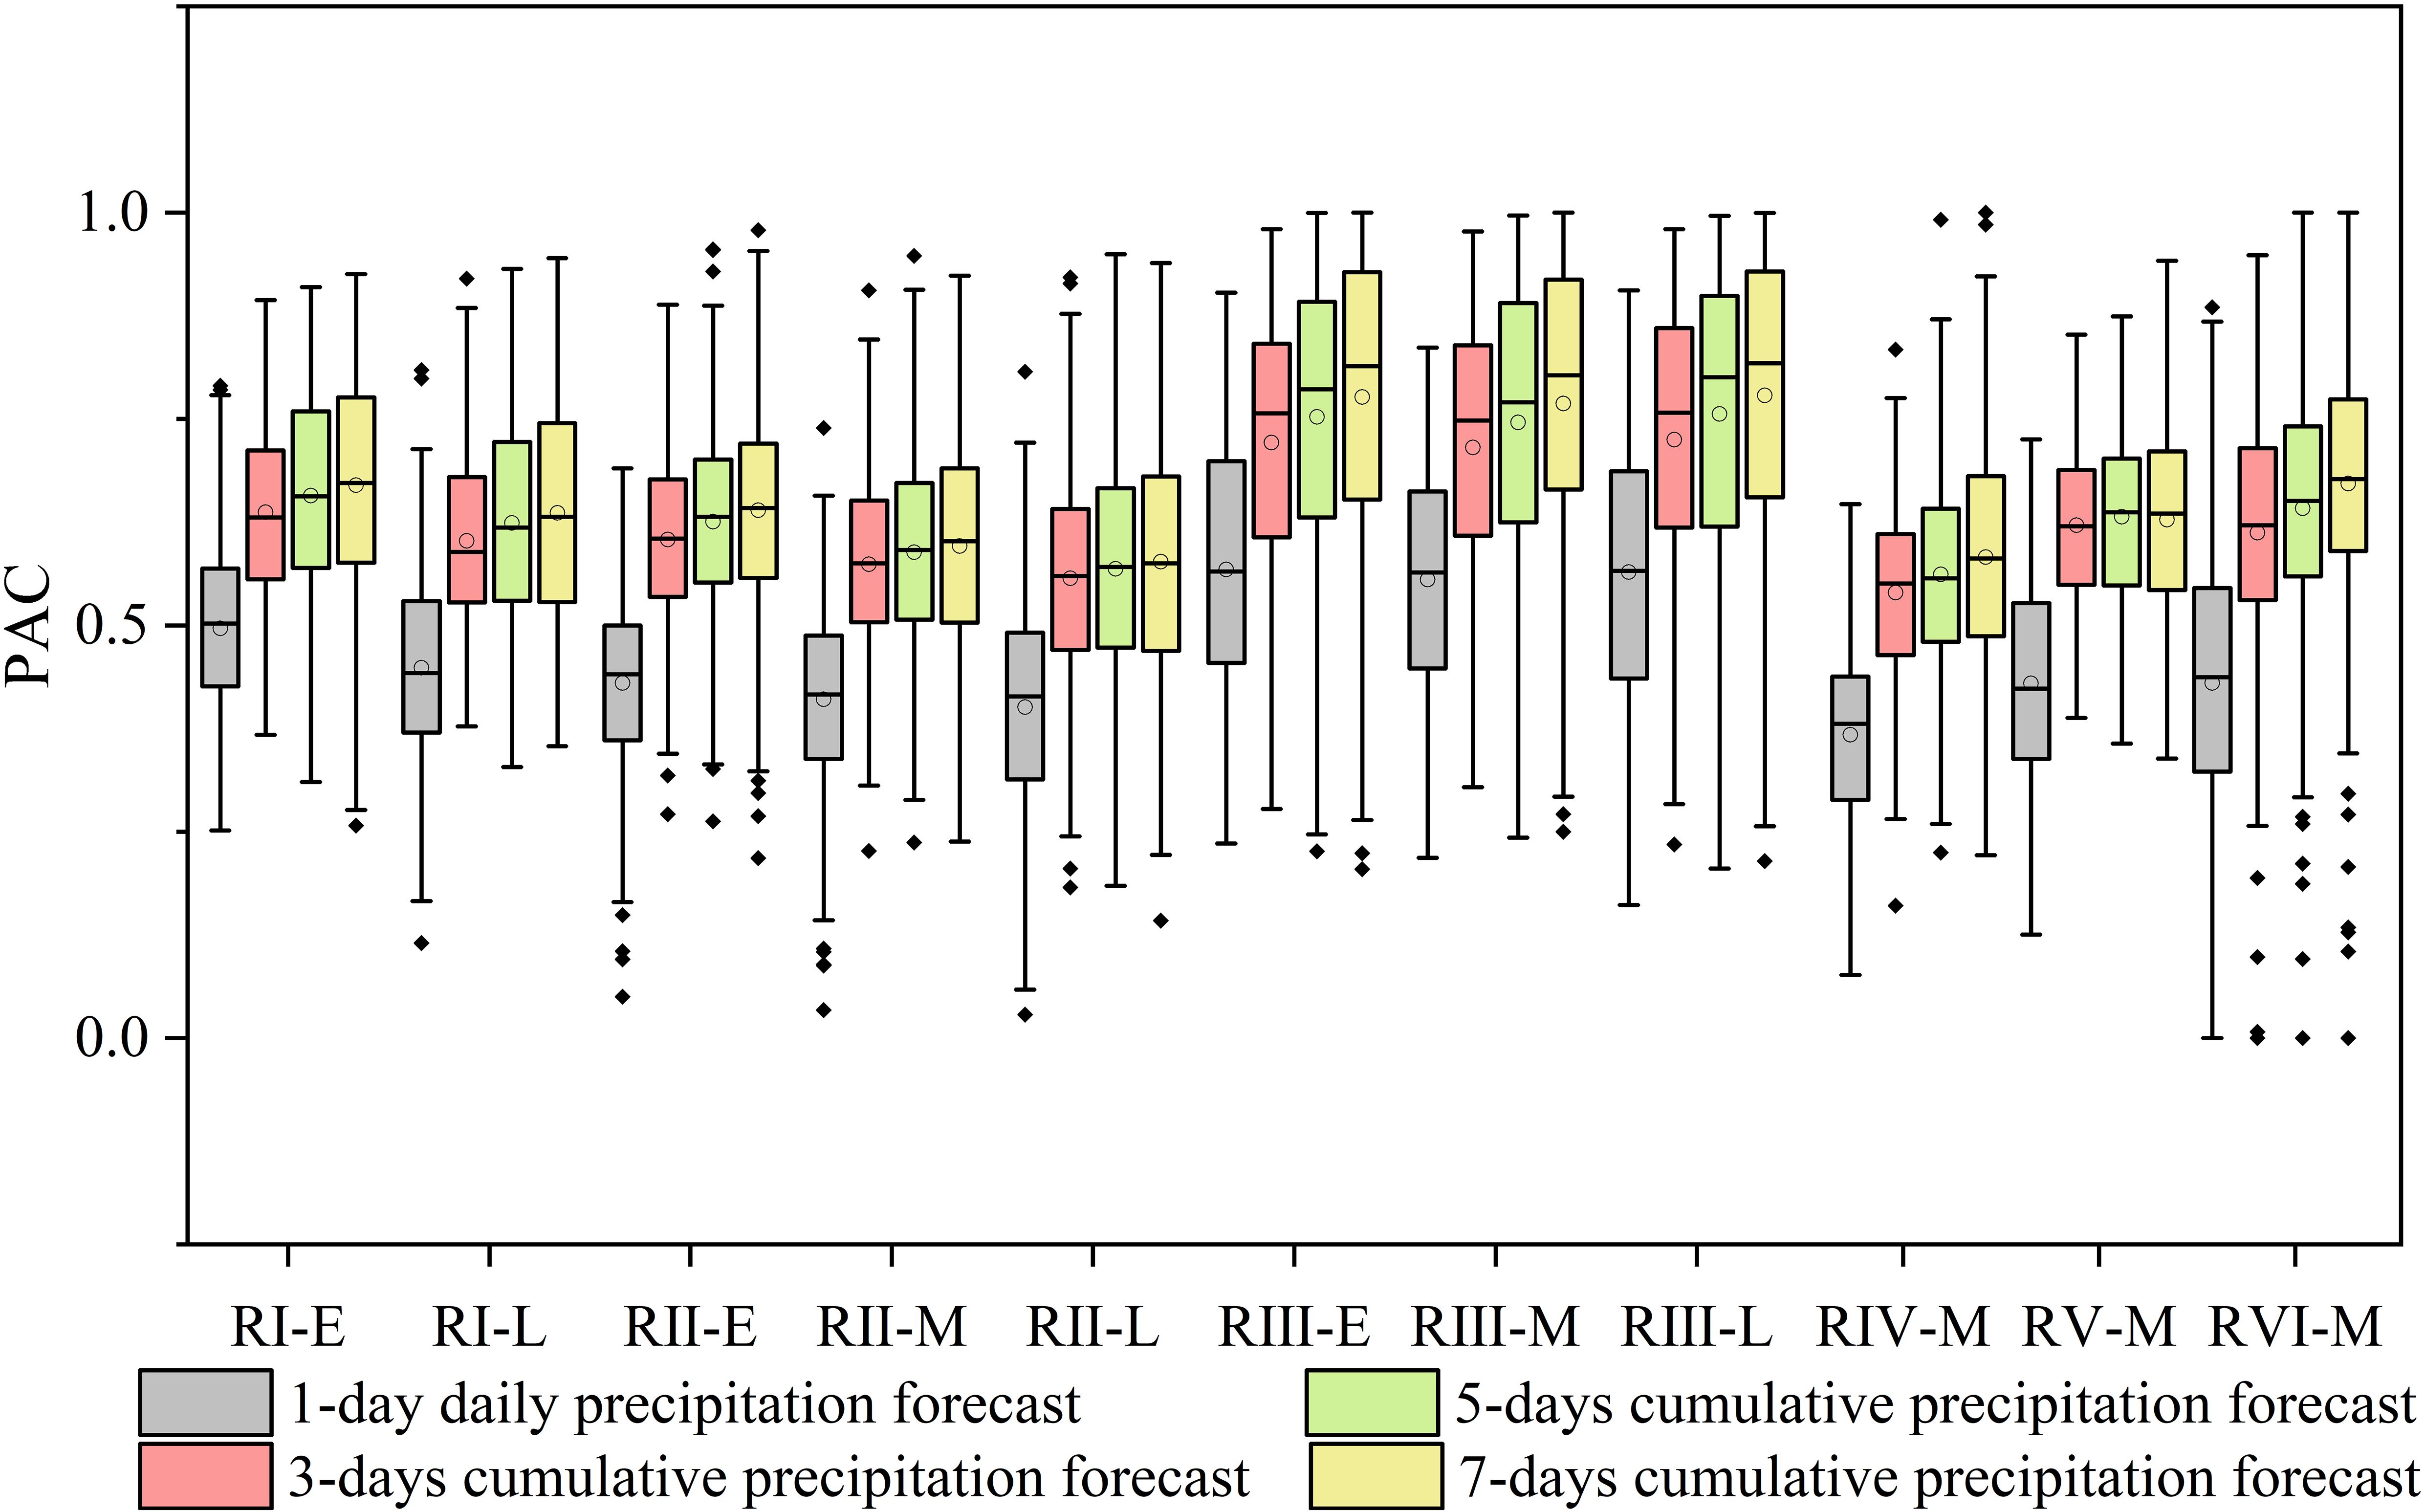
Figure 8. PAC for daily and cumulative precipitation forecasts in each region with each rice type.
The results show that the PAC increased with the expansion of time scales. This suggests that public weather forecasts may be more accurate for cumulative precipitation than for daily precipitation. The longer the cumulative time, the higher the tolerance to precipitation forecast errors and the higher the accuracy of precipitation amount forecasts. Meteorological conditions change rapidly, and daily precipitation forecasts are susceptible to sudden weather events and may be less accurate. Cumulative precipitation forecasts include rainfall over multiple days or even longer time periods, which might be useful for medium- and long-term planning and decision-making and are more suitable for farmland irrigation. Due to the persistence of rainfall, a single rainfall event may span over two or even more days and the generally shorter time error of rainfall forecasts (Meynecke et al., 2006; Fraga et al., 2019). The cumulative precipitation forecast, which groups rainfall over multiple days instead of providing daily totals, is more forgiving of rain events that spread across several days and allows for better handling of timing errors in rainfall predictions. It is better than daily precipitation forecast for precipitation amount.
3.3 Effect of cumulative precipitation forecast on rice irrigation scheduling
Figure 9 shows the PUE of each irrigation scheduling without the rainfall forecast and with different precipitation forecasts for each rice cropping region. The 1-precipitation forecasts and 3-, 5-, and 7-day cumulative precipitation forecasts led to an increase in PUE in comparison to the conventional irrigation scheduling without precipitation forecast. The average PUE obtained for the four forecasts is equal to 0.577, 0.590, 0.598, and 0.603, respectively. They were improved by 3.16%, 5.50%, 6.97%, and 7.79%, respectively. The irrigation scheduling based on the cumulative precipitation forecast allowed improving the efficiency utilization when compared to the daily precipitation forecast, with the 7-day cumulative precipitation forecast being the most effective and the 5-day cumulative precipitation forecast the second most performing. By making the full use of forecast information, the precipitation allows filling the gaps of the future knowledge of rice water demand and therefore effectively reduces the amount of irrigation. The observed precipitation was also fully utilized to potentially guarantee the store of rainwater for the future and to reduce the amount of drainage. PUE of RIII-L was the largest, with an average value of 0.712, followed by RIII-M and RVI-M. PUE of RI-E was the smallest, with an average value of only 0.450. This is in line with the results from Section 3.2, where the greater the PAC, the larger the PUE.
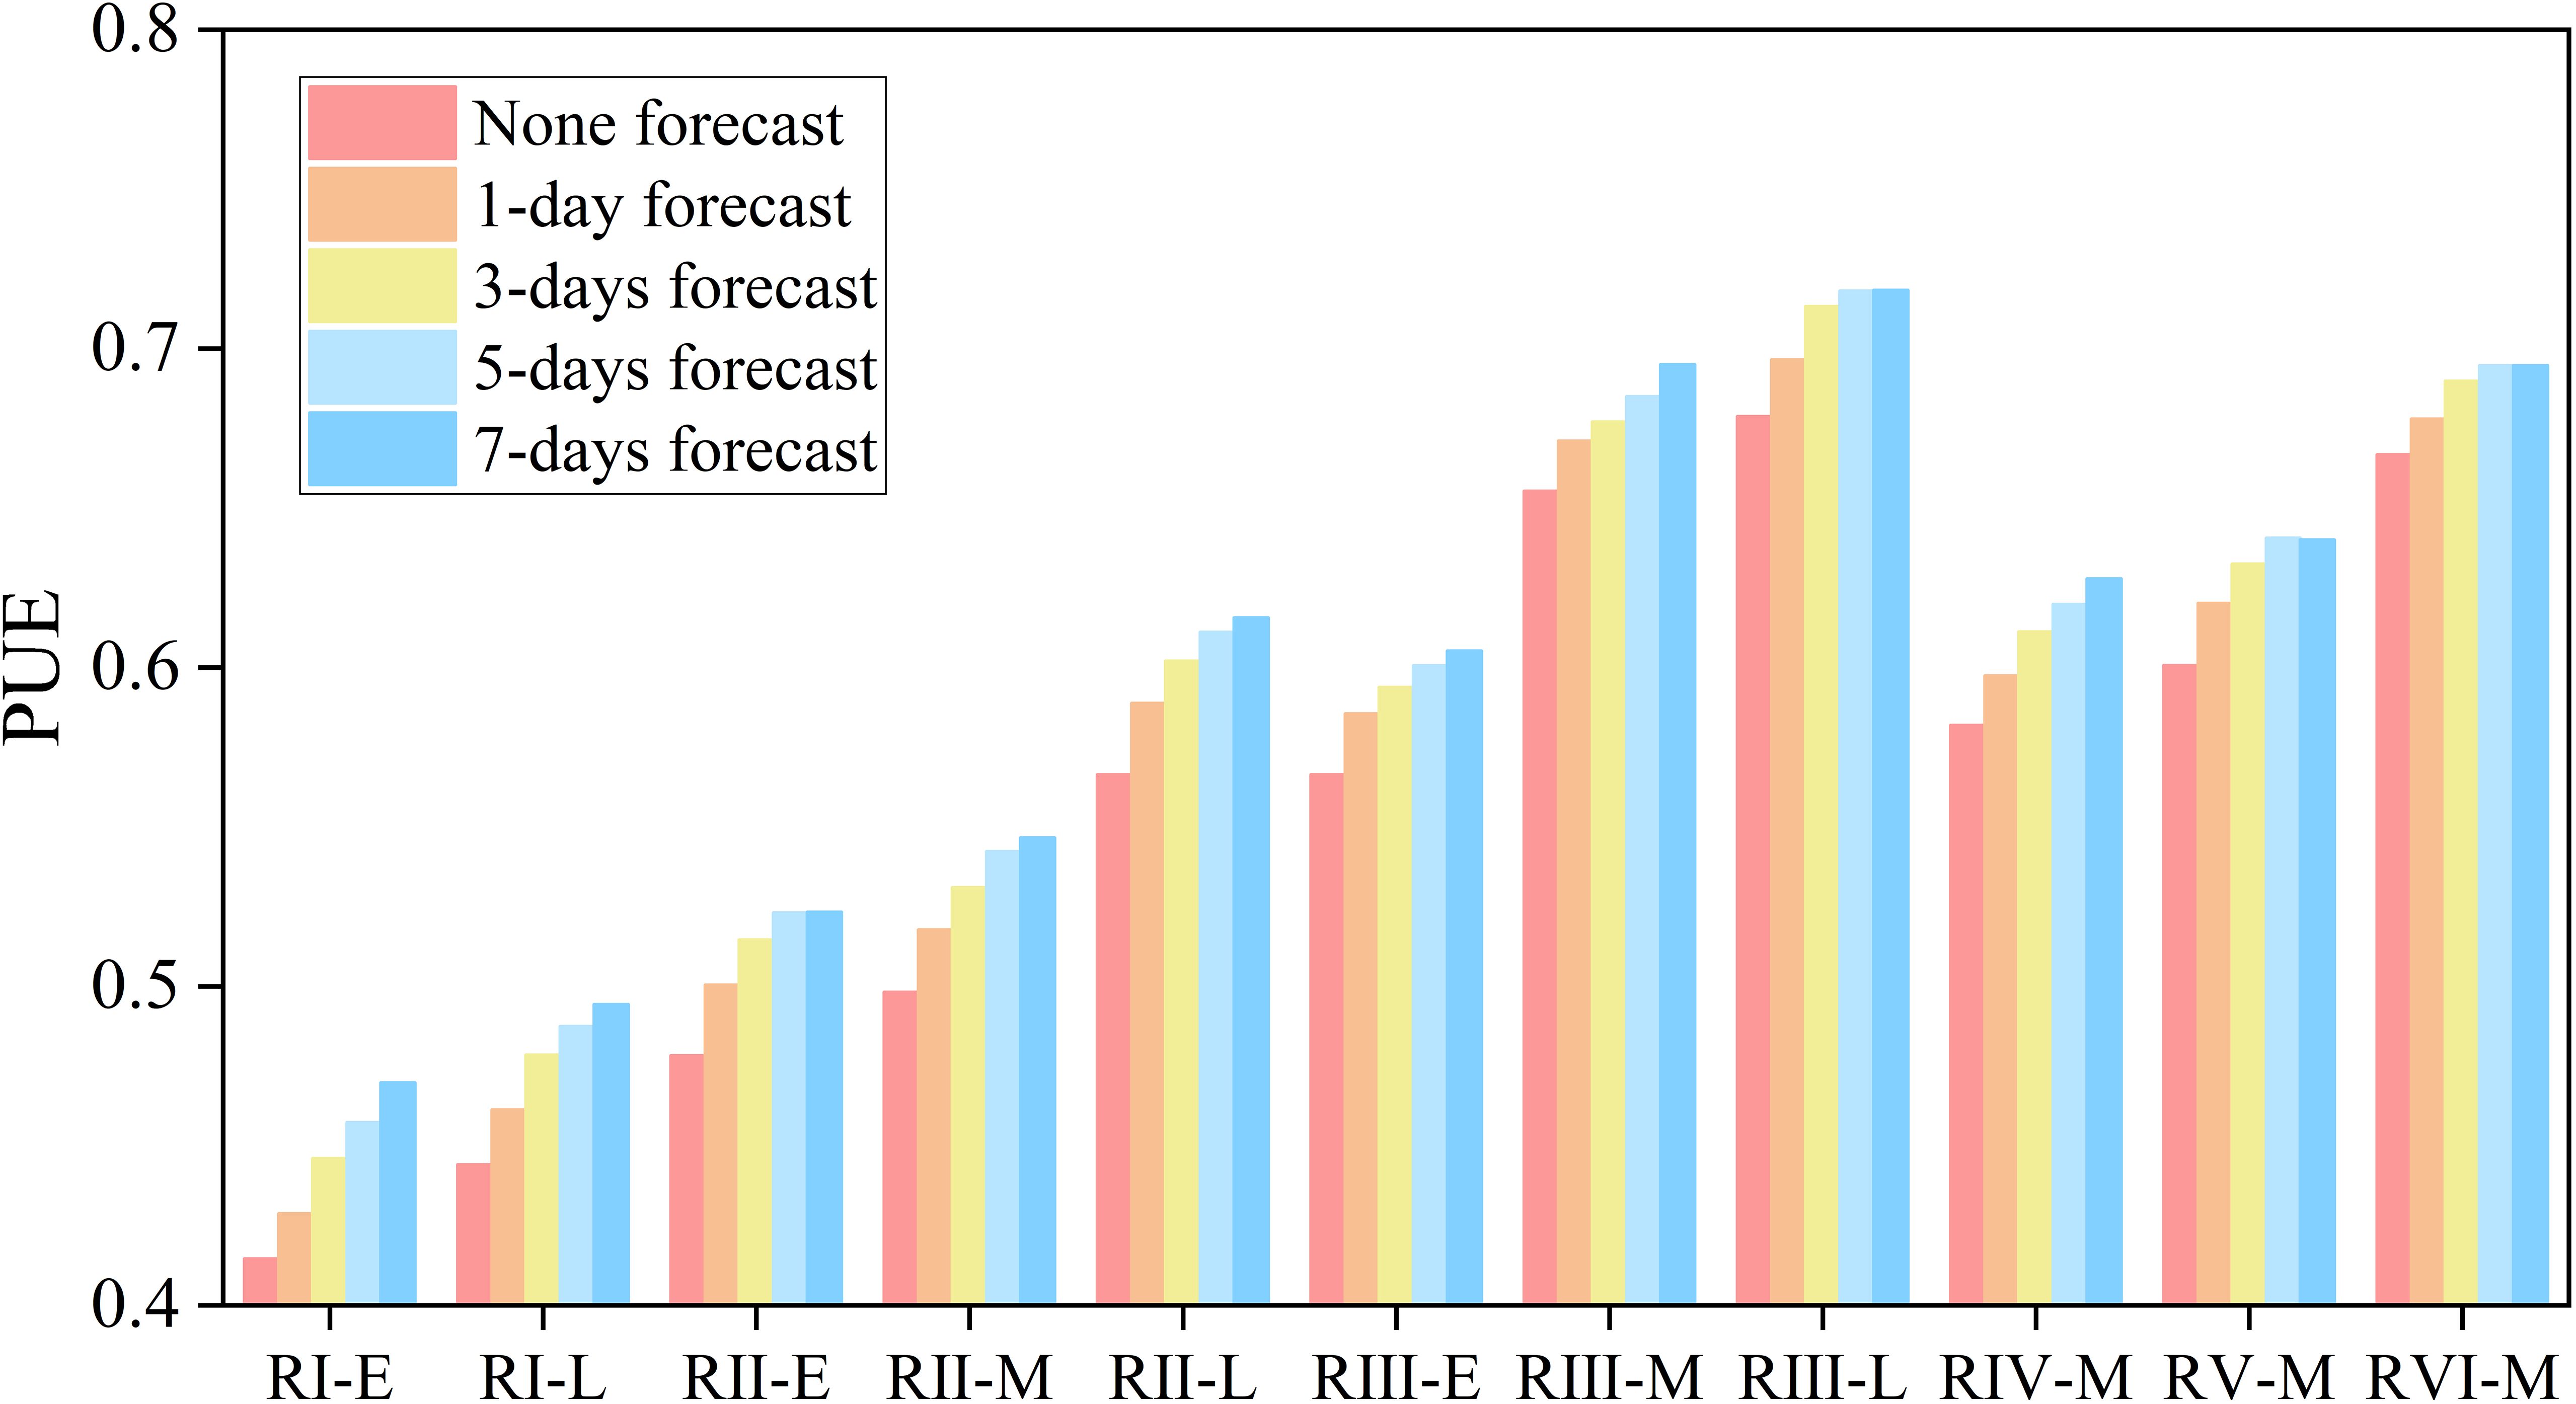
Figure 9. Average PUE for each irrigation scheduling with none forecast or precipitation forecasts with different lead times in each rice cropping region.
Figure 10 shows the effect of using daily precipitation forecasts and cumulative precipitation forecasts on irrigation scheduling. All the irrigation scheduling based on precipitation forecasts have the effect of reducing irrigation and drainage water compared with the conventional irrigation scheduling. The reduction rates of irrigation under 1-day daily precipitation forecasts and cumulative precipitation forecasts of 3, 5, and 7 days were 3.33%, 6.25%, 8.06%, and 9.68%, respectively. The rates of decrease in the drainage were 3.56%, 6.95%, 9.44% and 10.50%. Consideration of future precipitation can effectively reduce the amount of water for irrigation and drainage. The longer the cumulative time of precipitation forecast, the more obvious the water saving effect.

Figure 10. Effect of irrigation scheduling with different precipitation forecasts on (a) irrigation water, (b) drainage water, (c) number of irrigation action and (d) number of drainage action in each rice cropping region.
Most of all rice types of RI to RIV had the highest reduction in irrigation water and the best water saving effect for the 7-day cumulative precipitation forecast. RV-M had the highest reduction in irrigation for 5-day cumulative forecast. RVI-M had a similar effect for 5 and 7 days, both of which were very good. The irrigation saving rate based on 1-day precipitation forecasts varied little, mostly approximately 2.22%–4.67%, except for RVI-M, which was the smallest at 0.55%. As the cumulative number of days of precipitation forecast increased, the irrigation reduction gradually increased. The highest irrigation reduction rate and best water saving was achieved using 7-day cumulative precipitation forecasts. No matter which rainfall forecast was used for irrigation scheduling, R-E had the best effect and the highest water saving rate, with 20.81% irrigation reduction with 7-day cumulative precipitation forecasts. RVI-M had the worst performance.
The effect of using a cumulative precipitation forecast on drainage reduction was basically the same for each rice type in each region, with the maximum value approximately 12% for each rice type in each region. RII-E, RIII-L, and RVI-M had the highest drainage reduction in using 5-day cumulative precipitation forecast, while all other rice types had the highest drainage reduction with 7-day cumulative rainfall forecast. The highest reduction in drainage was observed in all the other rice. The 5-day cumulative precipitation forecast was the most effective forecast in reducing drainage for RIII-L, where it was able to reduce drainage by 12.79%. The smallest reduction was observed for RVI-M.
Each of the irrigation scheduling based on precipitation forecasts had the effect of reducing the number of irrigation and drainage actions during the rice growth period. The use of the cumulative precipitation forecast was more significant for reducing the number of drainage actions, more than reducing the volume of water. For RIV-M, it was able to reduce up to 29.71% with 7-day cumulative precipitation forecasts. The highest percentage reduction in the number of irrigation actions was observed in RI-E, which was reduced by 25.80% with 7-day cumulative precipitation forecasts. For most of the regions and rice type, the longer the cumulative days, the more the reduction in the number of irrigation and drainage actions. RVI-M had the weakest effect in reducing the number of both irrigation and drainage actions. Multi-day cumulative precipitation forecasts could be effective for improving the match between rainfall and irrigation demand.
Irrigation scheduling informed by cumulative precipitation forecasts exerted a negligible effect on crop yield, with all yield differences remaining below 0.01% (Figure 11). The use of 7-day cumulative precipitation forecast would have the greatest impact on yield. It was greatest in RVI, reducing yield by 0.006%. A timely correction of the irrigation management process is possible because the irrigation can be performed daily, with no restrictions on the number or frequency of irrigation actions.
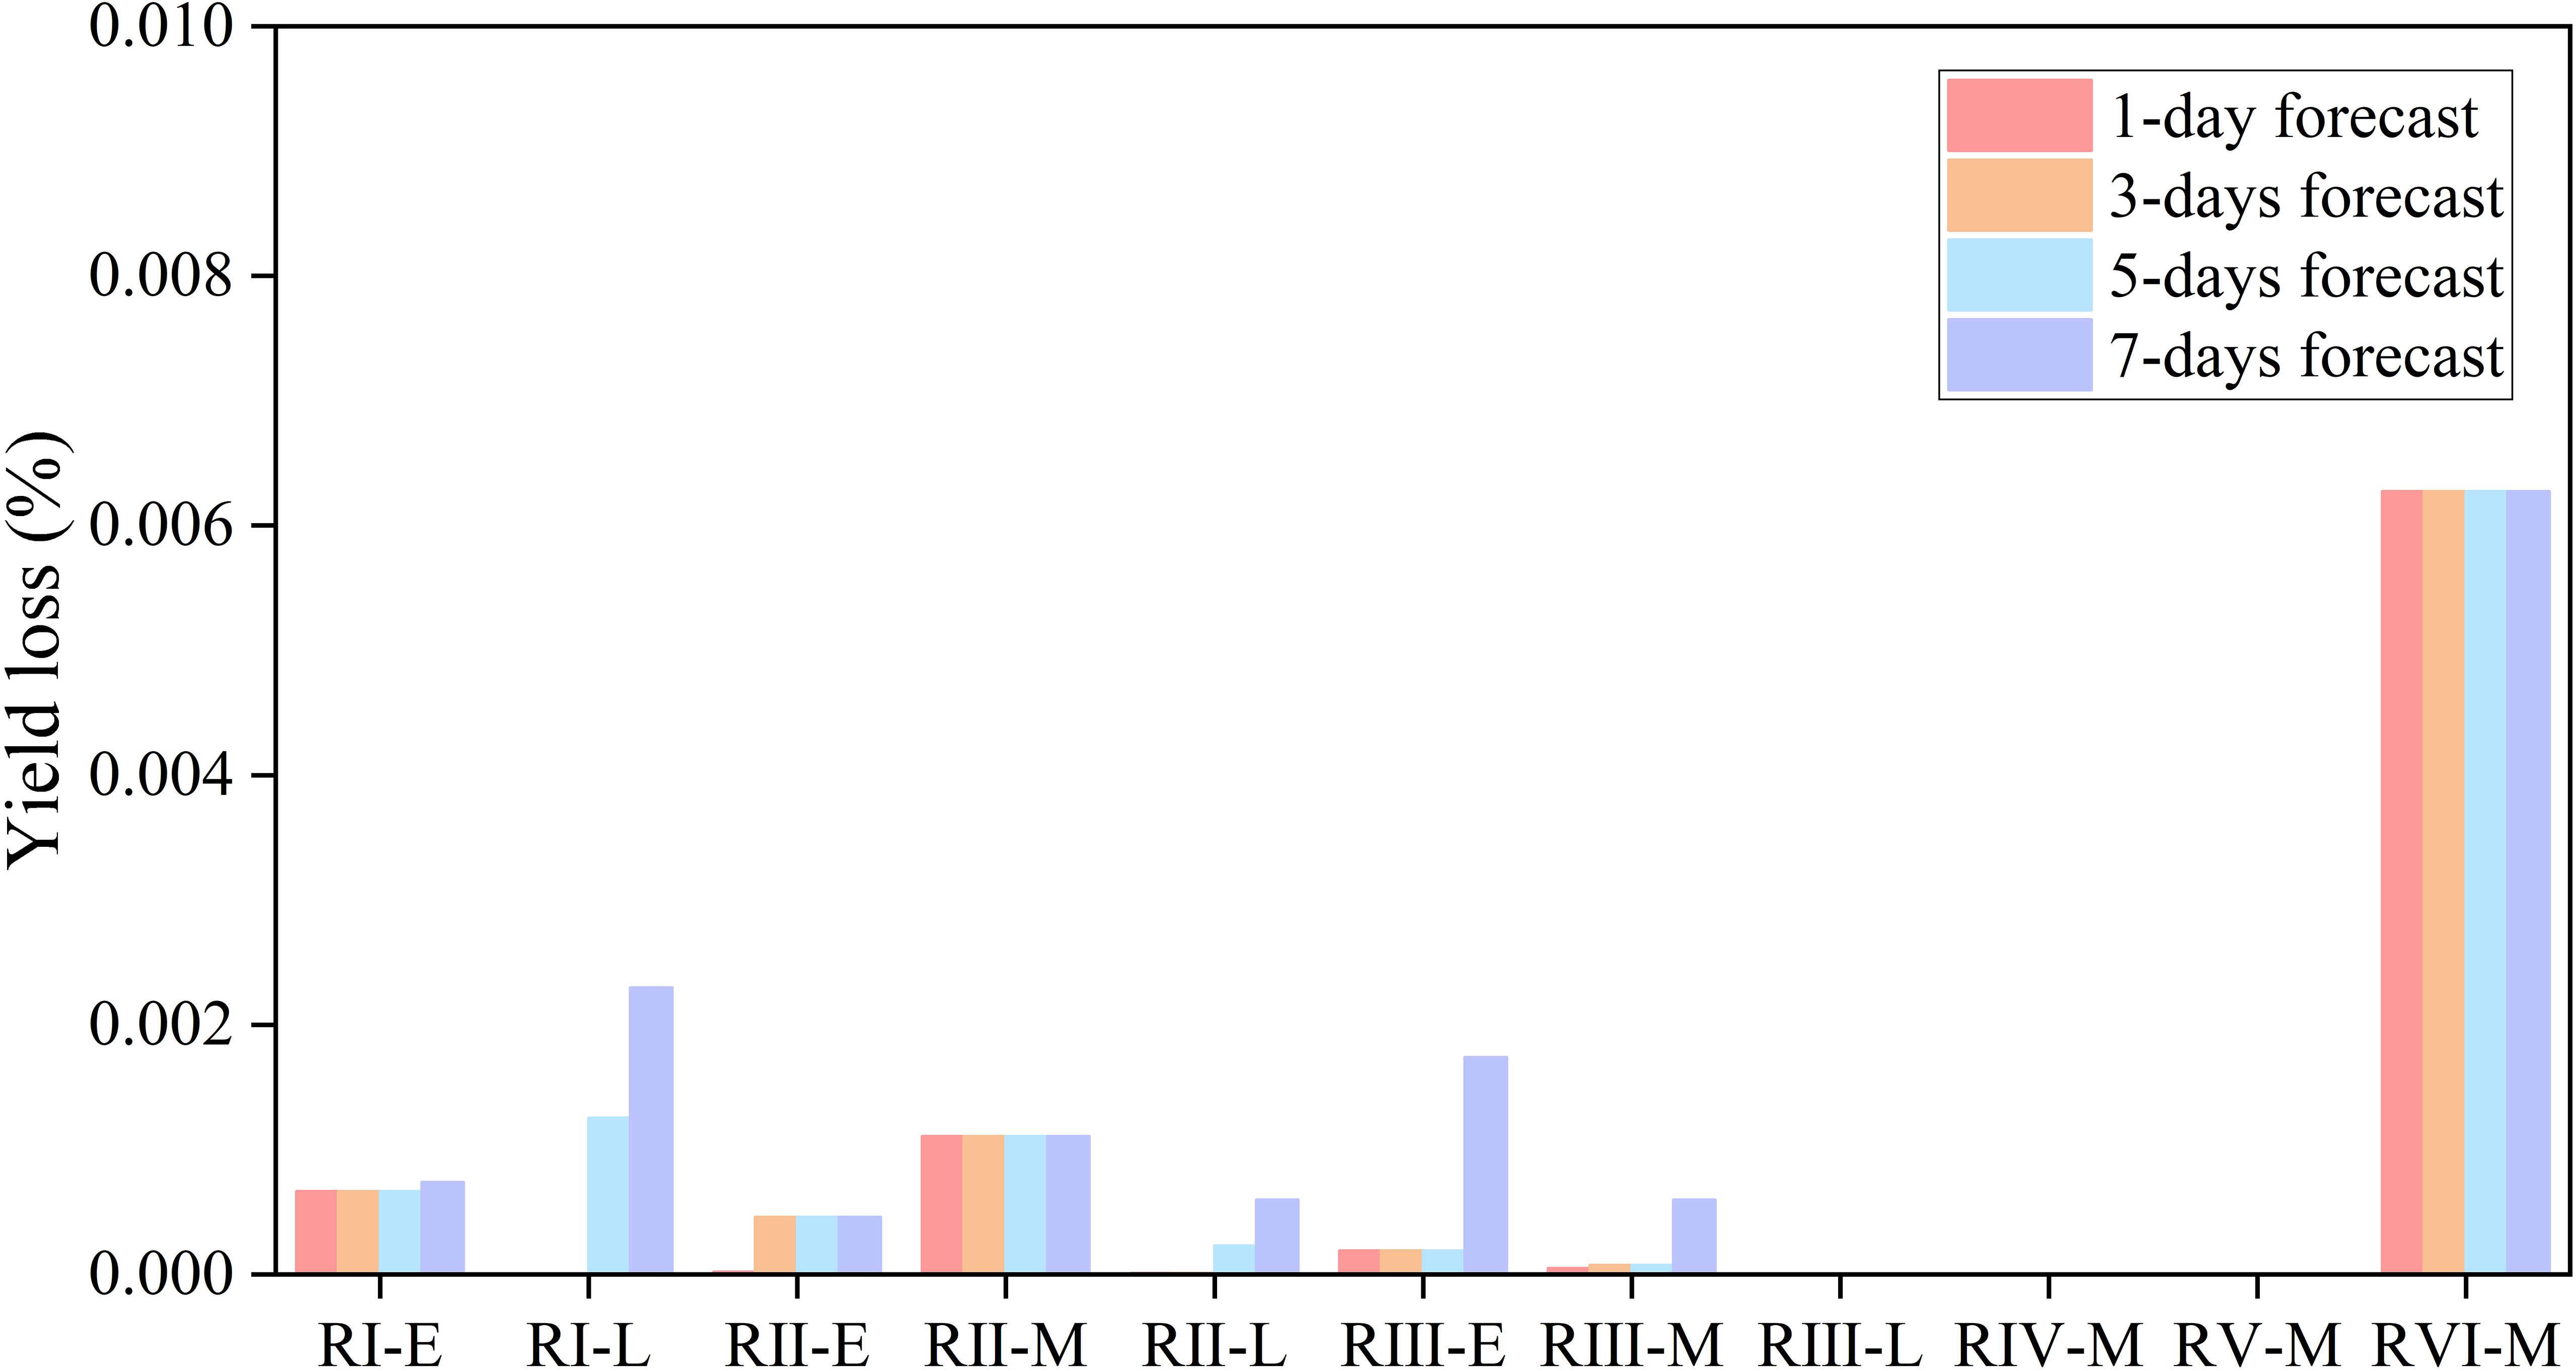
Figure 11. Effect of irrigation scheduling with different precipitation forecasts on rice yield in each rice cropping region.
Errors in cumulative precipitation forecasts do not greatly affect crop yield, but they do reduce the flexibility to minimize the number of irrigation and drainage operations. The cumulative precipitation forecast, because of greater uncertainty, leads to a greater number of days in which the moisture condition of the paddy field exceeds the optimal upper and lower limits and also has a greater impact on yield relative to the daily precipitation forecast.
The correlation coefficients between PAC and irrigation variables (Table 5) show that PAC is negatively correlated with irrigation variables in most of the cases. The higher the PAC of precipitation forecast, the lesser the irrigation water volume, drainage water volume, number of irrigation action, and drainage action. These findings suggest that improved forecast can enhance water-saving outcomes in irrigation management.

Table 5. Correlation coefficients between PAC and irrigation variables.
4 Discussion
This study investigated the spatio-temporal variations in the accuracy of public precipitation forecasts and the effect of public precipitation forecasts on paddy field irrigation in China. The validity of cumulative precipitation forecasts and their impact on rice irrigation scheduling were discussed.
Although earlier studies have explored the accuracy of public weather forecasts in China at some stations, they have not clarified their regional differences and temporal variations (Yang et al., 2016; Liu et al., 2020; Chen et al., 2021). This study fills this specific gap. Between 2012 and 2020, precipitation forecasts accuracy remained relatively stable, exhibiting minimal variation over the period. The quality of forecasts deteriorates as the lead time increases. There are some regional differences in the accuracy of precipitation grade forecasts, which is poorer in highlands and coastal areas.
Previous studies have mostly focused on evaluating the forecast accuracy of precipitation grades forecasts (Cao et al., 2019; Chen et al., 2023), while ignoring the accuracy of precipitation amount forecasts. The results of this work demonstrate that a poor forecast of precipitation grade may also result in an accurate forecast of precipitation amount. Figure 8 shows that cumulative precipitation forecasts are better than daily forecasts for precipitation. Cumulative precipitation forecasts offer greater tolerance for timing discrepancies. The discrepancy could be reduced if the precipitation grade is converted to a forecast of precipitation amount. Part of the reason is that when the precipitation grade forecast is incorrect, such as predicting moderate rain as heavy rain, the forecasted precipitation still includes a portion of the actual precipitation. When a rainfall forecast has only a short timing error, such as 1 day difference, cumulative precipitation forecasts may still consider it an accurate prediction.
Precipitation amount forecast is the key to directly affect the amount and timing of irrigation. Cao et al. (2019) proposed a new method for irrigation decision-making focused on the total rainfall in consecutive 3 days. Pirone et al. (2023) used both temporal and spatial information to propose a fast and convenient approach to short-term precipitation prediction based on machine learning. Liu et al. (2023) evaluated the daily precipitation forecasts with lead times ranging from 1 to 30 days and the cumulative precipitation forecasts over 1–30 days in nine major river basins in China. Changes in precipitation forecasts capability at different time scales reveal the potential value of cumulative precipitation forecasts. It makes better use of future precipitation and reduces the amount of irrigation and drainage water and the number of irrigation and drainage actions, resulting in better rainfall utilization. For example, the 7-day cumulative precipitation forecast reduces the amount of irrigation water by 20.81%, the amount of drainage water by 11.65%, the number of irrigation actions by 25.8%, and the number of drainage actions by 23.35% in RI-E.
The errors in the precipitation forecasts are impacting the irrigation strategies (Zimit et al., 2023; Bista et al., 2024). In addition to improving precipitation forecasts (Senocak et al., 2023), better irrigation decisions may be possible by considering their error variability characteristics or combining them with crop growth (Schepen et al., 2024). Differences in the water saving efficiency of different rice types in the same rice cropping region can be attributed to the greater uncertainty in the distribution of rainfall during the rice growth period (Cao et al., 2019). The performance of cumulative precipitation forecasts also varies across regions, which can be attributed to the effect of spatial differences in the quality of precipitation forecasts. Combining weather forecasts with crop growth models has become a valuable method for irrigation decision to improve crop irrigation water use in agriculture (Kirthiga et al., 2024). How to develop flexible irrigation strategies based on spatial differences in public precipitation forecasts and combined with crop growth models is the next research objective.
5 Conclusions
This study analyzes the spatio-temporal variations in the accuracy of precipitation forecasts from public weather forecasts in China, comparing the predictive effects of daily precipitation forecasts and cumulative precipitation forecasts with different rice types over six rice cropping regions, and exploring the effects of daily precipitation forecasts and cumulative precipitation forecasts on paddy field irrigation. The results provide a clearer understanding of the spatio-temporal variations of precipitation forecasts in public weather forecasts in China and the relationship between them and paddy field irrigation, which supports the improvement of the efficiency of irrigation management. The main findings are as follows.
The accuracy of the daily precipitation forecast decreases with the increase in the forecast’s lead time. Day 1 precipitation forecast had the highest PC of 0.754 at RVI. Only the day 1 forecast PC showed a generally increasing trend in most regions over the years. The overall forecasts are best for NR, better for LR and HS, and better for ST. MR is most likely to be false alarmed, and HR is most likely to be missing alarmed. RVI is best for daily precipitation grade forecast, and RI and RIII are the worst.
Cumulative precipitation forecasts do not show any decrease in the forecast of precipitation grades relative to the daily forecasts. ROC curves were kept at a good level. The cumulative precipitation forecasts of 3, 5, and 7 days have improved the PAC of precipitation forecasts by 16.43%, 18.66%, and 20.22%, respectively, regarding the precipitation forecasts of 1 day. The PAC of 7-day cumulative precipitation forecasts in RIII-L is the largest, reaching 0.778. It provides qualified precipitation information when using multi-day cumulative precipitation forecast.
Cumulative precipitation forecasts had a positive effect on irrigation scheduling in all rice cropping regions. As the cumulative days of precipitation forecast increases, the PUE of irrigation scheduling becomes greater. The average values of PUE of daily precipitation forecasts with 1 day lead time and cumulative precipitation forecasts with 3, 5, and 7 days lead time are 0.58, 0.59, 0.60, and 0.60, respectively. It is also significantly helpful in reducing irrigation water, drainage water, the number of irrigation, and drainage actions. The amount of irrigation and number of irrigation actions were reduced the most in RI-E. The 7-day cumulative precipitation forecast reduced the irrigation water by 20.81% and the number of irrigations by 25.80%. The reduction in drainage water and number of drainage actions was similar in each region, with the 7-day cumulative precipitation forecast reducing the drainage by 10.50% and the number of drainage actions by 23.07% on average. There was no significant impact on yield.
Data availability statement
The raw data supporting the conclusions of this article will be made available by the authors, without undue reservation.
Author contributions
XH: Writing – original draft, Data curation, Conceptualization. CC: Writing – review & editing, Validation. EL: Writing – review & editing, Formal analysis, Visualization. YX: Validation, Writing – review & editing, Visualization. SK: Writing – review & editing, Investigation, Supervision. YC: Methodology, Supervision, Writing – review & editing. YL: Conceptualization, Writing – review & editing.
Funding
The author(s) declare that financial support was received for the research and/or publication of this article. This work was supported by the National Natural Science Foundation of China (52379046), the Water Resources S&T Project of Inner Mongolia Autonomous Region, China (No. NSK 2021-01), Science and Technology Plan Project of Zhejiang Province Water Conservancy Department (RC2462), and the program of China Scholarship Council, China.
Acknowledgments
The observed meteorological data obtained from the China Meteorological Data Service Center (https://data.cma.cn) and the weather forecast data obtained from China Weather (http://www.weather.com.cn) are gratefully acknowledged.
Conflict of interest
The authors declare that the research was conducted in the absence of any commercial or financial relationships that could be construed as a potential conflict of interest.
The handling editor JF declared a past co-authorship with the author YC.
Generative AI statement
The author(s) declare that no Generative AI was used in the creation of this manuscript.
Publisher’s note
All claims expressed in this article are solely those of the authors and do not necessarily represent those of their affiliated organizations, or those of the publisher, the editors and the reviewers. Any product that may be evaluated in this article, or claim that may be made by its manufacturer, is not guaranteed or endorsed by the publisher.
Supplementary material
The Supplementary Material for this article can be found online at: https://www.frontiersin.org/articles/10.3389/fagro.2025.1598811/full#supplementary-material
References
Aburas M. M., Ho Y. M., Ramli M. F., and Ashaari Z. H. (2017). Improving the capability of an integrated CA–Markov model to simulate spatio–temporal urban growth trends using an Analytical Hierarchy Process and Frequency Ratio. Int. J. Appl. Earth Obs. Geoinf. 59, 65–78. doi: 10.1016/j.jag.2017.03.006
Ajaz A., Berthold T. A., Xue Q., Jain S., Masasi B., and Saddique Q. (2024). Free weather forecast and open-source crop modeling for scientific irrigation scheduling: proof of concept. Irrig. Sci. 42, 179–195. doi: 10.1007/s00271-023-00881-8
Allen R. G., Pereira L. S., Raes D., and Smith M. (1998). “Crop evapotranspiration–guidelines for computing crop water requirements,” in FAO Irrigation & Drainage Paper 56 (Rome: Food and Agriculture Organization of the United Nations), 300.
Anupoju V. and Kambhammettu B. V. N. P. (2020). Role of deficit irrigation strategies on ET partition and crop water productivity of rice in semi–arid tropics of south India. Irrig. Sci. 38, 415–430. doi: 10.1007/s00271-020-00684-1
Bista S., Baniya R., Sharma S., Ghimire G. R., Panthi J., Prajapati R., et al. (2024). Hydrologic applicability of satellite-based precipitation estimates for irrigation water management in the data-scarce region. J. Hydrol. 636, 131310. doi: 10.1016/j.jhydrol.2024.131310
Bouman B. A. M., Humphreys E., Tuong T. P., and Barker R. (2007). Rice and water. Adv. Agron. 92, 187–237. doi: 10.1016/S0065-2113(04)92004-4
Cai X., Hejazi M. I., and Wang D. (2011). Value of probabilistic weather forecasts: Assessment by real-time optimization of irrigation scheduling. J. Water Resour. Plan Manag. 137, 391–403. doi: 10.1061/(ASCE)WR.1943-5452.0000126
Calvo-Olivera C., Guerrero-Higueras Á.M., Lorenzana J., and García-Ortega E. (2024). Real-time evaluation of the uncertainty in weather forecasts through machine learning-based models. Water Resour. Manage. 38, 2455–2470. doi: 10.1007/s11269-024-03779-y
Cao J., Tan J., Cui Y., and Luo Y. (2019). Irrigation scheduling of paddy rice using short–term weather forecast data. Agr. Water Manage. 213, 714–723. doi: 10.1016/j.agwat.2018.10.046
Chen M., Cui Y., Wang X., Xie H., Liu F., Luo T., et al. (2021). A reinforcement learning approach to irrigation decision–making for rice using weather forecasts. Agr. Water Manage. 250, 106838. doi: 10.1016/j.agwat.2021.106838
Chen S., Feng Y., Mao Q., Li H., Zhao Y., Liu J., et al. (2024). Improving the accuracy of flood forecasting for Northeast China by the correction of global forecast rainfall based on deep learning. J. Hydrol. 640, 131733. doi: 10.1016/j.jhydrol.2024.131733
Chen M., Linker R., Lyu X., and Luo Y. (2023). Irrigation forecasting for paddy rice using the ACOP–Rice model and public weather forecasts. Irrig. Sci. 42, 197–228. doi: 10.1007/s00271-023-00904-4
Collins B., Lai Y., Grewer U., Attard S., Sexton J., and Pembleton K. G. (2024). Evaluating the impact of weather forecasts on productivity and environmental footprint of irrigated maize production systems. Sci. Total. Environ. 954, 176368. doi: 10.1016/j.scitotenv.2024.176368
Corbari C., Salerno R., Ceppi A., Telesca V., and Mancini M. (2019). Smart irrigation forecast using satellite LANDSAT data and meteo–hydrological modeling. Agr. Water Manage. 212, 283–294. doi: 10.1016/j.agwat.2018.09.005
Donaldson R. J., Dyer R. M., and Kraus M. J. (1975). An objective evaluator of techniques for predicting severe weather events. Ninth Conference on Severe Local Storms (Norman, OK: American Meteorology Society), 321326. Available at: http://refhub.elsevier.com/S0378-3774(21)00103-7/sbref7 (Accessed May 10, 2024).
Dong B., Mao Z., Cui Y., Luo Y., and Li Y. (2020). Controlled irrigation for paddy rice in China. Irrig. Drain. 69, 61–74. doi: 10.1002/ird.2519
Evans F. H., Guthrie M. M., and Foster I. (2020). Accuracy of six years of operational statistical seasonal forecasts of rainfall in Western Australia, (2013 to 2018). Atmos. Res. 233, 104697. doi: 10.1016/j.atmosres.2019.104697
Fan J., Wu L., Zheng J., and Zhang F. (2021). Medium–range forecasting of daily reference evapotranspiration across China using numerical weather prediction outputs downscaled by extreme gradient boosting. J. Hydrol. 601, 126664. doi: 10.1016/j.jhydrol.2021.126664
Fawcett T. (2006). An introduction to ROC analysis. Pattern Recognit. Lett. 27, 861–874. doi: 10.1016/j.patrec.2005.10.010
Feng S., Zhao W., Yan J., Xia F., and Pereira P. (2024). Land degradation neutrality assessment and factors influencing it in China’s arid and semiarid regions. Sci. Total. Environ. 925, 171735. doi: 10.1016/j.scitotenv.2024.171735
Fraga I., Cea L., and Puertas J. (2019). Effect of rainfall uncertainty on the performance of physically based rainfall–runoff models. Hydrol. Process. 33, 160–173. doi: 10.1002/hyp.13319
Gao Z., Yan X., Dong S., Luo N., and Song S. (2023). Object–based evaluation of rainfall forecasts over eastern China by eight cumulus parameterization schemes in the WRF model. Atmos. Res. 284, 106618. doi: 10.1016/j.atmosres.2023.106618
Gao R., Zhuo L., Duan Y., Yan C., Yue Z., Zhao Z., et al. (2024). Effects of alternate wetting and drying irrigation on yield, water-saving, and emission reduction in rice fields: A global meta-analysis. Agr. For. Meteorol. 353, 110075. doi: 10.1016/j.agrformet.2024.110075
Gebru M., Tadesse T., and Berhe M. (2025). Reliability of irrigation water and farm-level productivity: Evidence from semi-arid farming systems in northern Ethiopia. Agr. Syst. 223, 104193. doi: 10.1016/j.agsy.2024.104193
Guo X., Cui P., Chen X., Li Y., Zhang J., and Sun Y. (2021). Spatial uncertainty of rainfall and its impact on hydrological hazard forecasting in a small semiarid mountainous watershed. J. Hydrol. 595, 126049. doi: 10.1016/j.jhydrol.2021.126049
Halder D., Saha J. K., and Biswas A. (2020). Accumulation of essential and non–essential trace elements in rice grain: Possible health impacts on rice consumers in West Bengal, India. Sci. Total. Environ. 706, 135944. doi: 10.1016/j.scitotenv.2019.135944
Hsu C. C. and Lin Y. P. (2024). Incorporating long-term numerical weather forecasts to quantify dynamic vulnerability of irrigation supply system: A case study of Shihmen Reservoir in Taiwan. Agr. Water Manage. 306, 109178. doi: 10.1016/j.agwat.2024.109178
Hu X., Chen M., Liu D., Li D., Jin L., Liu S., et al. (2021). Reference evapotranspiration change in Heilongjiang Province, China from 1951 to 2018: The role of climate change and rice area expansion. Agric. Water Manage. 253, 106912. doi: 10.1016/j.agwat.2021.106912
Humphreys E., Lewin L. G., Khan S., Beecher H. G., Lacy J. M., Thompson J. A., et al. (2006). Integration of approaches to increasing water use efficiency in rice-based systems in southeast Australia. Field Crop Res. 97, 19–33. doi: 10.1016/j.fcr.2005.08.020
Jensen M. E. (1968). “Water consumption by agricultural plants,” in Water Deficit and Plant Growth. Ed. Kozlowski T. T. (Academic Press, New York), 1–22. Available at: https://eprints.nwisrl.ars.usda.gov/id/eprint/742/1/92.pdf (Accessed May 10, 2024).
Kang C. H., Zhang Y., Wang Z., Liu L., Zhang H., and Jo Y. (2017). The driving force analysis of NDVI dynamics in the trans-boundary tumen river basin between 2000 and 2015. Sustainability 9, 2350. doi: 10.3390/su9122350
Kharrou M. H., Er-Raki S., Chehbouni A., Duchemin B., Simonneaux V., Le Page M., et al. (2011). Water use efficiency and yield of winter wheat under different irrigation regimes in a semi-arid region. Agr. Sci. China 2, 273–282. doi: 10.4236/as.2011.23036
Kirthiga S. M., Narasimhan B., and Balaji C. (2024). Enhancing irrigation water productivity using short-range ensemble weather forecasts at basin scale: A novel framework for regions with high hydro-climatic variability. J. Hydrol. 639, 131610. doi: 10.1016/j.jhydrol.2024.131610
Kisi O., Khosravinia P., Heddam S., Karimi B., and Karimi N. (2021). Modeling wetting front redistribution of drip irrigation systems using a new machine learning method: Adaptive neuro-fuzzy system improved by hybrid particle swarm optimization–Gravity search algorithm. Agric. Water Manage. 256, 107067. doi: 10.1016/j.agwat.2021.107067
Li C., Zhao T., Shi C., and Liu Z. (2020). Evaluation of daily precipitation product in China from the CMA global atmospheric interim reanalysis. J. Meteorol. Res-Prc. 34, 117–136. doi: 10.1007/s13351-020-8196-9
Linker R. and Sylaios G. (2016). Efficient model–based sub–optimal irrigation scheduling using imperfect weather forecasts. Comput. Electron. Agric. 130, 118–127. doi: 10.1016/j.compag.2016.10.004
Liu S., Li W., and Duan Q. (2023). Spatiotemporal variations in precipitation forecasting skill of three global subseasonal prediction products over China. J. Hydrometeorol. 24, 2075–2090. doi: 10.1175/JHM-D-23-0071.1
Liu B., Liu M., Cui Y., Shao D., Mao Z., Zhang L., et al. (2020). Assessing forecasting performance of daily reference evapotranspiration using public weather forecast and numerical weather prediction. J. Hydrol. 590, 125547. doi: 10.1016/j.jhydrol.2020.125547
Liu Y., Zhang T., Duan H., Wu J., Zeng D., and Zhao C. (2021). Evaluation of forecast performance for four meteorological models in summer over Northwestern China. Front. Earth Sci. 9. doi: 10.3389/feart.2021.771207
Luo J. (2003). Water saving Irrigation Theories and Techniques (Wuhan, China: Wuhan University Press), 87–92.
Malumpong C., Ruensuk N., Rossopa B., Channu C., Intarasathit W., Wongboon W., et al. (2021). Alternate Wetting and Drying (AWD) in Broadcast rice (Oryza sativa L.) Management to Maintain Yield, Conserve Water, and Reduce Gas Emissions in Thailand. Agr. Res. 10, 116–130. doi: 10.1007/s40003-020-00483-2
Mao Z. (2002). Water efficient irrigation and environmentally sustainable irrigated rice production in China (New Delhi, India: International Commission on Irrigation and Drainage), 1–15. Available at: https://www.icid.org/wat_mao.pdf (Accessed May 10, 2024).
Mei F., Wu X., Yao C., Li L., Wang L., and Chen Q. (1988). Rice cropping regionalization in China. Chin. J. Rice Sci. 3, 97–110. doi: 10.16819/j.1001-7216.1988.03.001
Meynecke J. O., Lee S. Y., Duke N. C., and Warnken J. (2006). Effect of rainfall as a component of climate change on estuarine fish production in Queensland, Australia. Estuarine. Coastal. Shelf. Sci. 69, 491–504. doi: 10.1016/j.ecss.2006.05.011
Mohammadi A., Rizi A. P., and Abbasi N. (2019). Field measurement and analysis of water losses at the main and tertiary levels of irrigation canals: Varamin Irrigation Scheme, Iran. Global Ecol. Conserv. 18, e00646. doi: 10.1016/j.gecco.2019.e00646
Paria A., Giri A., Dutta S., and Neogy S. (2025). Smart irrigation for coriander plant: Saving water with AI and IoT. Water Resour. Manage., 1–17. doi: 10.1007/s11269-025-04112-x
Pirone D., Cimorelli L., Del Giudice G., and Pianese D. (2023). Short-term rainfall forecasting using cumulative precipitation fields from station data: a probabilistic machine learning approach. J. Hydrol. 617, 128949. doi: 10.1016/j.jhydrol.2022.128949
Ravazzani G., Corbari C., Ceppi A., Feki M., Mancini M., Ferrari F., et al (2017). From (cyber) space to ground: new technologies for smart farming. Hydrol. Res. 48 (3), 656–672. doi: 10.2166/nh.2016.112
Reavis C. W., Reba M. L., and Runkle B. R. (2024). The effects of alternate wetting and drying irrigation on water use efficiency in Mid-South rice. Agr. For. Meteorol. 353, 110069. doi: 10.1016/j.agrformet.2024.110069
Saccon P. (2018). Water for agriculture, irrigation management. Appl. Soil. Ecol. 123, 793–796. doi: 10.1016/j.apsoil.2017.10.037
Schepen A., Sexton J., Philippa B., Attard S., Robertson D. E., and Everingham Y. (2024). Downscaled numerical weather predictions can improve forecasts of sugarcane irrigation indices. Comput. Electron. Agr. 221, 109009. doi: 10.1016/j.compag.2024.109009
Scheuerer M. and Hamill T. M. (2015). Statistical postprocessing of ensemble precipitation forecasts by fitting censored, shifted gamma distributions. Mon. Weather. Rev. 143, 4578–4596. doi: 10.1175/MWR-D-15-0061.1
Senocak A. U. G., Yilmaz M. T., Kalkan S., Yucel I., and Amjad M. (2023). An explainable two-stage machine learning approach for precipitation forecast. J. Hydrol. 627, 130375. doi: 10.1016/j.jhydrol.2023.130375
Song Y., Wang Y., Mao W., Sui H., Yong L., Yang D., et al. (2017). Dietary cadmium exposure assessment among the Chinese population. PloS One 12, e0177978. doi: 10.1371/journal.pone.0177978
Sun J. and Qin X. (2016). Precipitation and temperature regulate the seasonal changes of NDVI across the Tibetan Plateau. Environ. Earth Sci. 75, 291. doi: 10.1007/s12665-015-5177-x
Sutcliffe C., Knox J., and Hess T. (2021). Managing irrigation under pressure: how supply chain demands and environmental objectives drive imbalance in agricultural resilience to water shortages. Agric. Water Manage. 243, 106484. doi: 10.1016/j.agwat.2020.106484
Tuong T. P., Bouman B. A. M., and Mortimer M. (2005). More rice, less water: integrated approaches for increasing water productivity in irrigated rice–based systems in Asia. Plant Prod. S. 8, 231–241. doi: 10.1626/pps.8.231
Wei J., Cui Y., Luo W., and Luo Y. (2022). Mapping paddy rice distribution and cropping intensity in China from 2014 to 2019 with Landsat images, effective flood signals, and google earth engine. Remote Sens–Basel. 14, 759. doi: 10.3390/rs14030759
Wilks D. S. (2006). Statistical Methods in the Atmospheric Sciences (San Diego: Academic Press). doi: 10.1016/B978-0-12-815823-4.00007-9
Wu X., Shi J., Zhang T., Zuo Q., Wang L., Xue X., et al. (2022). Crop yield estimation and irrigation scheduling optimization using a root-weighted soil water availability based water production function. Field Crop Res. 284, 108579. doi: 10.1016/j.fcr.2022.108579
Xiong W., Holman I., Lin E., Conway D., Jiang J. H., Xu Y. L., et al. (2010). Climate change, water availability and future cereal production in China. Agric. Ecosyst. Environ. 135, 58–69. doi: 10.1016/j.agee.2009.08.015
Xu H., Wu Z., Luo L., and He H. (2018). Verification of high-resolution medium-range precipitation forecasts from Global Environmental Multiscale Model over China during 2009–2013. Atmosphere 9, 104. doi: 10.3390/atmos9030104
Yang Y., Cui Y., Luo Y., Lyu X., Traore S., Khan S., et al. (2016). Short-term forecasting of daily reference evapotranspiration using the Penman-Monteith model and public weather forecasts. Agric. Water Manage. 177, 329–339. doi: 10.1016/j.agwat.2016.08.020
Yao F., Huang J., Cui K., Nie L., Xiang J., Liu X., et al. (2012). Agronomic performance of high–yielding rice variety grown under alternate wetting and drying irrigation. Field Crops Res. 126, 16–22. doi: 10.1016/j.fcr.2011.09.018
Zhang H. and Oweis T. (2007). Water–yield relations and optimal irrigation scheduling of wheat in the Mediterranean region. Agric. Water Manage. 38, 195–211. doi: 10.1016/S0378-3774(98)00069-9
Zhao X., Chen M., Xie H., Luo W., Wei G., Zheng S., et al (2023). Analysis of irrigation demands of rice: Irrigation decision-making needs to consider future rainfall. Agr. Water Manage. 280, 108196. doi: 10.1016/j.agwat.2023.108196
Zimit A. Y., Jibril M. M., Azimi M. S., and Abba S. I. (2023). Hybrid predictive based control of precipitation in a water-scarce region: A focus on the application of intelligent learning for green irrigation in agriculture sector. J. Saudi. Soc. Agric. Sci. 22, 524–534. doi: 10.1016/j.jssas.2023.06.001
Keywords: paddy field, irrigation scheduling, precipitation forecast, water saving, cumulative precipitation forecast
Citation: Hu X, Corbari C, Lin E, Xu Y, Khan S, Cui Y and Luo Y (2025) Analysis of cumulative precipitation forecast accuracy and its impact on rice irrigation scheduling in China. Front. Agron. 7:1598811. doi: 10.3389/fagro.2025.1598811
Received: 25 March 2025; Accepted: 12 May 2025;
Published: 02 June 2025.
Edited by:
Junliang Fan, Northwest A&F University, ChinaCopyright © 2025 Hu, Corbari, Lin, Xu, Khan, Cui and Luo. This is an open-access article distributed under the terms of the Creative Commons Attribution License (CC BY). The use, distribution or reproduction in other forums is permitted, provided the original author(s) and the copyright owner(s) are credited and that the original publication in this journal is cited, in accordance with accepted academic practice. No use, distribution or reproduction is permitted which does not comply with these terms.
*Correspondence: Yufeng Luo, eWZsdW9Ad2h1LmVkdS5jbg==