 Karina M. Torres1†
 Chenjiao Tan2†
 Kayla A. Mollet3
 Allan H. Smith-Pardo4
 Rui Xu2
 Changying Li2
 Silvana V. Paula-Moraes5*
- 1West Florida Research and Education Center, University of Florida, Jay, FL, United States
- 2Agricultural and Biological Engineering Department, Institute of Food and Agricultural Sciences, University of Florida, Gainesville, FL, United States
- 3Department of Agricultural Biology, Colorado State University, Fort Collins, CO, United States
- 4USDA States Department of Agriculture (USDA), Animal and Plant Health Inspection Service (APHIS), Plant Protection and Quarantine (PPQ), Science and Technology (S&T), Plant Identification Technology Laboratory (PITL), Sacramento, CA, United States
- 5Department of Entomology, University of Nebraska-Lincoln, Lincoln, NE, United States
Soybean looper (SBL), Chrysodeixis includens (Walker) (Lepidoptera: Noctuidae: Plusiinae), a major pest native to the Americas, poses considerable management challenges. Sex pheromone trapping in IPM programs represents a tool to detect initial infestations and promote timely management decisions. However, commercial formulations of sex pheromone for SBL are non-specific, leading to the cross-attraction of morphologically similar plusiines, such as cabbage looper (CBL), Trichoplusia ni (Hübner), and gray looper moth (GLM), Rachiplusia ou (Guenée). Current identification methods of plusiine adults are laborious, expensive, and thus inefficient for rapid detection of pests like SBL. This study explores the use of deep learning models and visualization techniques to explain the learned features from forewing patterns as an identification tool for SBL and differentiation from morphologically similar plusiines. A total of 3,788 unique wing images were captured from specimens collected from field and laboratory populations with validated species identification. Five deep learning models were trained on lab-reared specimens with high-quality wing patterns and evaluated for model generalization using field-collected specimens for three classification tasks: classification of SBL and CBL; male and female SBL and CBL; and SBL, CBL, and GLM. Our results demonstrate that deep learning models and the visualization methods are effective tools for identifying plusiine pests, like SBL and CBL, whose wing patterns are difficult to distinguish by the naked human eye. This study introduces a novel application of existing deep learning models and techniques for quickly identifying plusiine pests, with potential uses for pest monitoring programs targeting economic plusiine pests beyond SBL.
1 Introduction
Soybean looper (SBL), Chrysodeixis includens (Walker) (Lepidoptera: Noctuidae: Plusiinae), is a polyphagous economic pest that is widely distributed across its native range of the Americas (Mitchell et al., 1975; Eichlin and Cunningham, 1978). The larvae of SBL feed on over 170 plants from 39 families, including crops such as the common bean, sunflower, tomato, cotton, and peanut (Specht et al., 2015). It is also a major soybean pest (Bortolotto et al., 2015; Huseth et al., 2021; Debnath et al., 2024). In 2023, the total crop losses and management costs of foliar insecticide applications for managing SBL in soybean-producing U.S. states were valued at nearly US$84.0 million, where southern states represented 97% of the economic impact of this pest in soybean production (Musser et al., 2024). Reports of insecticide resistance in SBL populations represent an additional challenge for the management of this pest in the U.S., leading to a growing concern for the continued economic impact of SBL in cultivated systems, especially in soybean (Reisig, 2015; Catchot et al., 2016). Field sampling techniques, such as beat sheet knockdown and sweep netting, are some of the standard methods for infestation estimation of larval defoliators (Pedigo and Rice, 2014), and according to Huseth et al. (2021), management decisions for SBL have been primarily based on defoliation estimation. However, the challenges related to SBL management are due to the larval feeding behavior of initial instars, which is mainly concentrated on the lower canopy of soybeans (Carter and Gillett-Kaufman, 2018). The larval infestation detection is difficult until the later 4–6 instars when 97% of economic damage occurs (Reid and Greene, 1973; Boldt et al., 1975). Curative chemical control is recognized as a challenge for this pest because of lower susceptibility to insecticides in late instars, compromising the efficacy of insecticide applications. In this way, detecting initial infestations of SBL is critical for timing management decisions in IPM programs.
Due to the limitations of larval and defoliation estimations as tools for SBL monitoring, sex pheromone trapping is used to detect adult moths and, consequently, egg and initial larval instars to promote efficient adoption of management measures. In general, traps baited with commercial formulations of sex pheromones have been successfully applied for detection and population monitoring of several pests with the advantages of being inexpensive, reliable, and less labor-intensive (Witzgall et al., 2010). Using flight phenology information combined with moth trapping of target species, sex pheromone trapping represents a proactive IPM approach by triggering timely field sampling and consequent adoption of management decisions before economic damage levels are reached by the pest (Pedigo and Buntin, 1994). However, the commercial formulations of sex pheromone for SBL and other pests of the Plusiinae subfamily are non-specific, resulting in cross-attraction of morphologically similar species (Jones and Duckworth, 2017; Shaw et al., 2021). An inventory performed by Shaw et al. (2021) listed four plusiines cross-attracted in SBL monitoring programs, including Ctenoplusia oxygramma (Geyer); Trichoplusia ni (Hübner), cabbage looper (CBL); Rachiplusia ou (Guenée), gray looper moth (GLM); and Argyrogramma verruca (Fabricius). Of the four plusiines, C. oxygramma was the primary crossed-attracted species in SBL sex pheromone trapping. However, moths of this species can be easily distinguished from the others based on distinct forewing patterns using the naked eye (Lafontaine and Poole, 1991). Most CBL, GLM, and A. verruca represented less than one percent of the cross-attracted moths (Shaw et al., 2021). However, these plusiines overlap in the flight phenology with SBL, especially with CBL and GLM, which are also ranked as secondary pests in soybean and peanut (Sutherland and Greene, 1984; Allen et al., 2021; Huseth et al., 2021). Cross-attracted CBL and GLM in trapping programs for SBL can compromise timely detection and appropriate insecticide selection to control SBL, considering the growing reports of insecticide resistance in SBL (Reisig, 2015; Catchot et al., 2016).
Most plusiine moths are generic in appearance, with small gray or brown-colored bodies and a characteristic metallic stigma on the forewing with intra- and interspecific variation (Eichlin and Cunningham, 1978). Using wing patterns for species identification is challenging due to the subjectivity of interpreting descriptions. Shaw et al. (2021) indicated that the native plusiines from the U.S. cross-attracted to SBL commercial sex pheromone lures are described with ambiguous terminology, abstract characters that appear similar, and highly variable characters, based on descriptions in Lafontaine and Poole (1991). For example, the adults of CBL and GLM are ambiguously described as possessing a “grizzled appearance” by Lafontaine and Poole (1991). The quality of a given specimen and the lighting conditions also influence the presence and integrity of the wing pattern characters required to identify a moth. While alternative identification methods, primarily male genitalia dissections (Eichlin and Cunningham, 1978; Shaw et al., 2021) and DNA analyses (Zink et al., 2023; Gotardi et al., 2024), have been developed to address these challenges, they are costly and time-consuming for rapid management decision-making and forecasting initial infestations of plusiines. Advances in species identification in this group were recently proposed based on geometric morphometric analysis (Smith-Pardo et al., 2025). The wing shapes of the native SBL, invasive Chrysodeixis chalcites (Esper), and potentially other plusiines were distinct using geometric morphometrics for species identification of plusiine pests. However, even though this method represents an alternative for the detection of the invasive C. chalcites in survey programs, it is still time-consuming and inappropriate as a pest monitoring tool in IPM programs.
Recent advancements in computer vision and deep learning methods offer novel capabilities to automate rapid insect identification using images of external morphology (Wäldchen and Mäder, 2018). Convolutional neural networks (CNNs) are particularly powerful tools for image classification and object detection tasks and have demonstrated success in wing-based insect identification at the species level while producing inferences in only a few milliseconds (Chang et al., 2017; Nolte et al., 2024; Spiesman et al., 2024). Because CNNs are designed to process structured grid-like data, they can effectively analyze complex visual features from images, providing taxonomist-level accuracy in distinguishing morphologically similar species (Valan et al., 2019). They have the potential to establish automated identification systems that allow taxonomists to spend their time on conceptually difficult problems beyond simple routine identification (MacLeod et al., 2010; Valan et al., 2019). In this study, we explore the application of CNNs to recognize and distinguish magnified images of the wing patterns of morphologically similar plusiine pests, focusing particularly on identifying the economic pest SBL. Five image classification CNN models, including ResNet50, ShuffleNetv2, MobileNetv3, EfficientNetv2-B0, and YOLOv8s-cls, were trained and evaluated on three different fine-grained image classification tasks (hereafter referred to as classification experiments): the two-species classification of SBL and CBL, the species-sex classification of male and female SBL and CBL, and the three-species classification of SBL, CBL, and GLM. Moreover, the t-SNE algorithm (Maaten and Hinton, 2008) was utilized in this study to visualize the class separability of a model, and the explainable AI technique, GradCAM (Selvaraju et al., 2017), was employed to understand how a model achieves the predictions and identify potential biases. The goal of this study is to provide a foundation for future automated plusiine identification and increase the applicability of pheromone trapping for rapid SBL detection in IPM programs.
2 Materials and methods
2.1 Forewing image datasets
A total of 3,788 unique forewing images from 2,082 specimens of SBL, CBL, and GLM were captured in this study. Both left and right forewings of each specimen were used when possible. For specimens where one wing was considerably damaged, only the wing with higher quality was used in the dataset. As a result, not all specimens contributed two forewing images to the datasets. The specimens were derived from field collections and laboratory colonies, and the wing images were divided into three datasets based on specimen quality and source (Table 1; Figure 1).
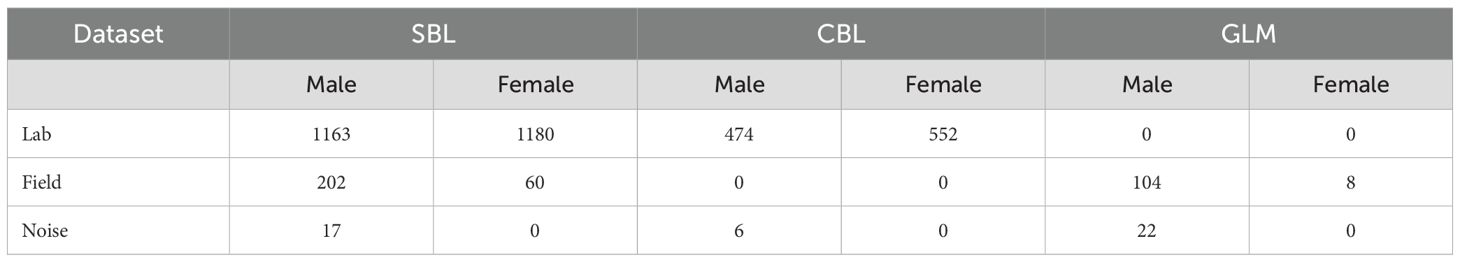
Table 1. Number of unique forewing images of Chrysodeixis includens (SBL) and Trichoplusia ni (CBL) by sex in each dataset.
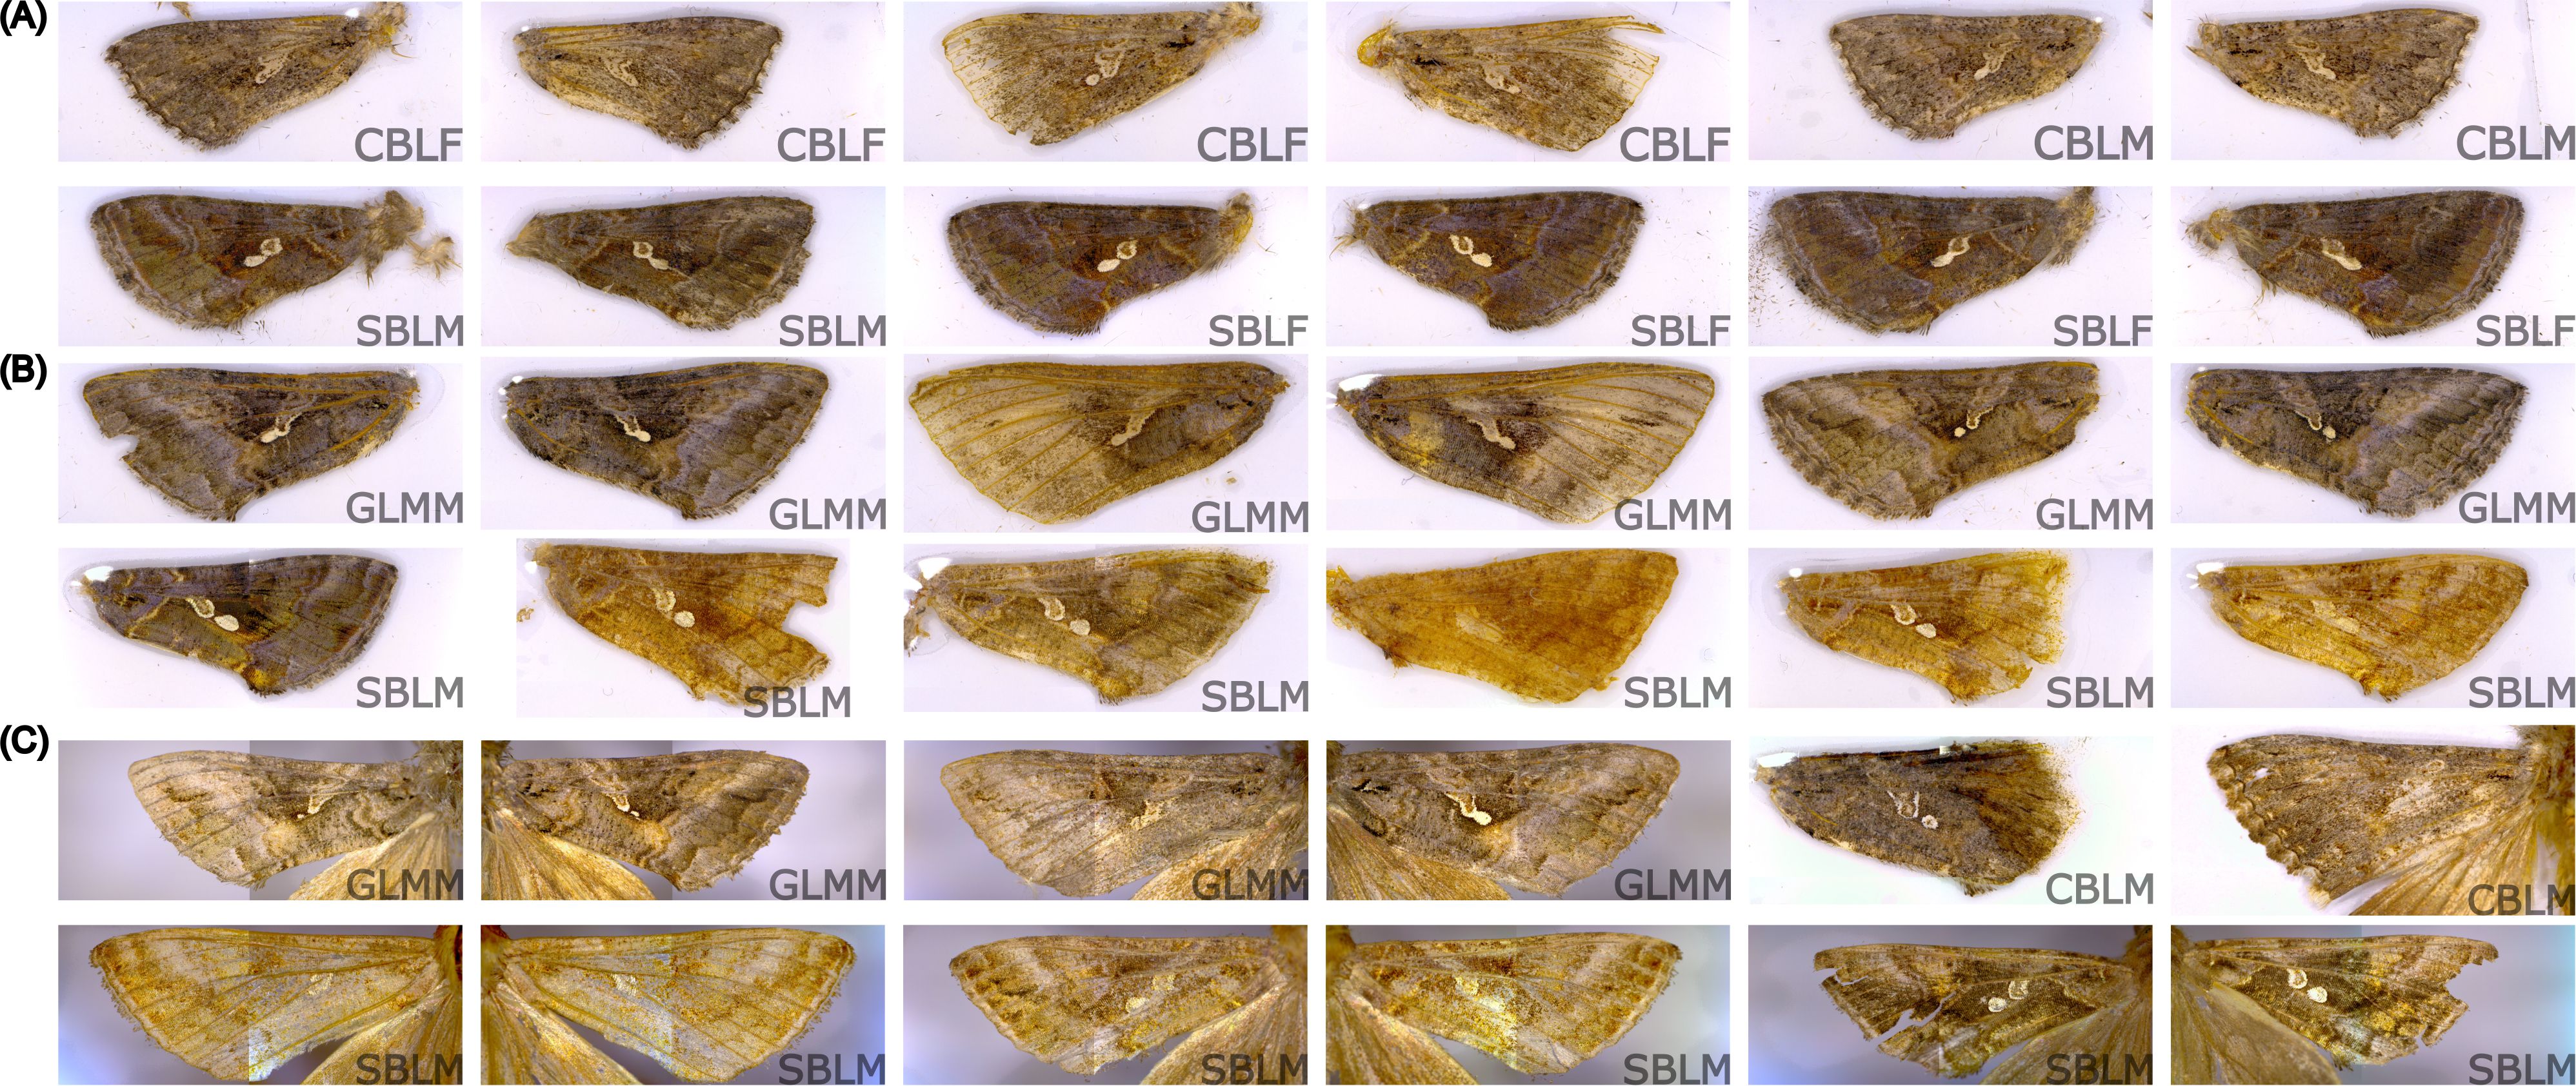
Figure 1. Forewing images of male (-M) and female (-F) Chrysodeixis includens (SBL), Trichoplusia ni (CBL), and Rachiplusia ou (GLM) from the lab dataset (A), field dataset (B), and noise dataset (C), indicating the intraspecific variation in wing patterns and the influence of lighting conditions on wing pattern appearances.
The “lab” dataset comprised 1,026 CBL and 2,343 SBL wing images. The specimens were sourced from Benzon Research Inc. (Carlisle, PA, USA) and reared in the Entomology Lab at the West Florida Research and Education Center (WFREC), University of Florida, Jay, FL. The adult specimens were transferred to a -80°C freezer within one to two days of emergence to preserve the integrity of the wing scales.
The “field” dataset included 262 SBL and 112 GLM wing images of field- and trap-collected specimens from traps baited with sex pheromone lures of SBL in four commercial fields in Escambia and Santa Rosa counties, FL, between 2017 and 2024 and specimens collected from 15 bucket traps and three Trécé delta traps (Trécé Inc Pherocon VI trap, Adair, OK). In addition, SBL and CBL moths cross-attracted in 25 traps lured for the invasive C. chalcites and 25 traps lured with Autographa gamma (Linnaeus) in the USDA/APHIS survey program were included. The traps were distanced at least 100m apart along the edges of various crop fields. Soybean looper larvae and pupae were collected from soybean fields using drop cloth sampling and reared individually in the Entomology Lab, WFREC/UF. All specimens recovered from the field and traps were initially screened and identified as belonging to the Plusiinae subfamily. Specimens of C. oxygramma, cross-attracted during the trapping, were separated based on the distinct wing pattern using the naked eye (Shaw et al., 2021). Molecular species identification of the remaining plusiine specimens was performed at the Pest Identification Technology Laboratory (PITL), USDA/APHIS, Fort Collins, CO. First, real-time PCR using the methods described in Zink et al. (2023) was carried out to separate SBL. Next, the specimens that were not confirmed to be SBL by real-time PCR underwent cytochrome c oxidase 1 (CO1) barcoding (Madden et al., 2019) using primers LepF1 and Lep R1 (Hebert et al., 2004). Sanger sequencing was performed at Azenta (Azenta US, Inc., South Plainfield, New Jersey, USA) using an Applied Biosystems 3730XL DNA sequencer and at PITL using an Applied Biosystems SegStudio Genetic Analyzer.
The “noise” dataset consisted of 17 SBL, 6 CBL, and 22 GLM wing images from a collection of plusiines validated by male genitalia dissection in the Entomology Lab, WFREC/UF. Additionally, two specimens of CBL in the noise dataset were collected from Trécé delta trapping in 2019 at the Entomology Laboratory, WFREC/UF.
For all specimens in the lab and field datasets, the right, left, or both forewings were removed, and the sex was recorded. The forewings of each specimen were prepared on a microscope slide with a clean piece of clear packing tape (Office Depot LLC, Boca Raton, FL) to secure and flatten the wings. Unlike the specimens in the lab and field datasets, the wings of the pinned specimens from the noise dataset were not removed. The pinned specimens were mounted on a piece of Styrofoam for stability. The resulting images included additional “noisy” features, such as different background colors, inconsistent lighting, blurriness (i.e., the whole wing not in focus), and other insect parts (Figure 1C). The objective of the noise dataset was to challenge the model by introducing irrelevant information or obscuring features that could be important for the model predictions. Each forewing was imaged individually using the ZEISS Smartzoom 5 imaging system (Carl Zeiss Microscopy LLC, White Plains, NY) in the Entomology Laboratory, WFREC/UF. This system automatically and systemically applies a preset optimal image condition for every image taken, allowing the standardization and replication of subjects for imaging. Automatic image adjustments included color saturation, noise filtering, sharpening, brightness and contrast, and a Realtime High Dynamic Range (HDR) filter. Preliminary trials indicated that a magnification of 54.4x was appropriate to obtain high-resolution patterns of the wings while maintaining low data sizes for model training (Figures 1, 2A). To prepare the images for the models, all images were downsized to 640x640 pixels, and a white padding was applied (Figure 2B).
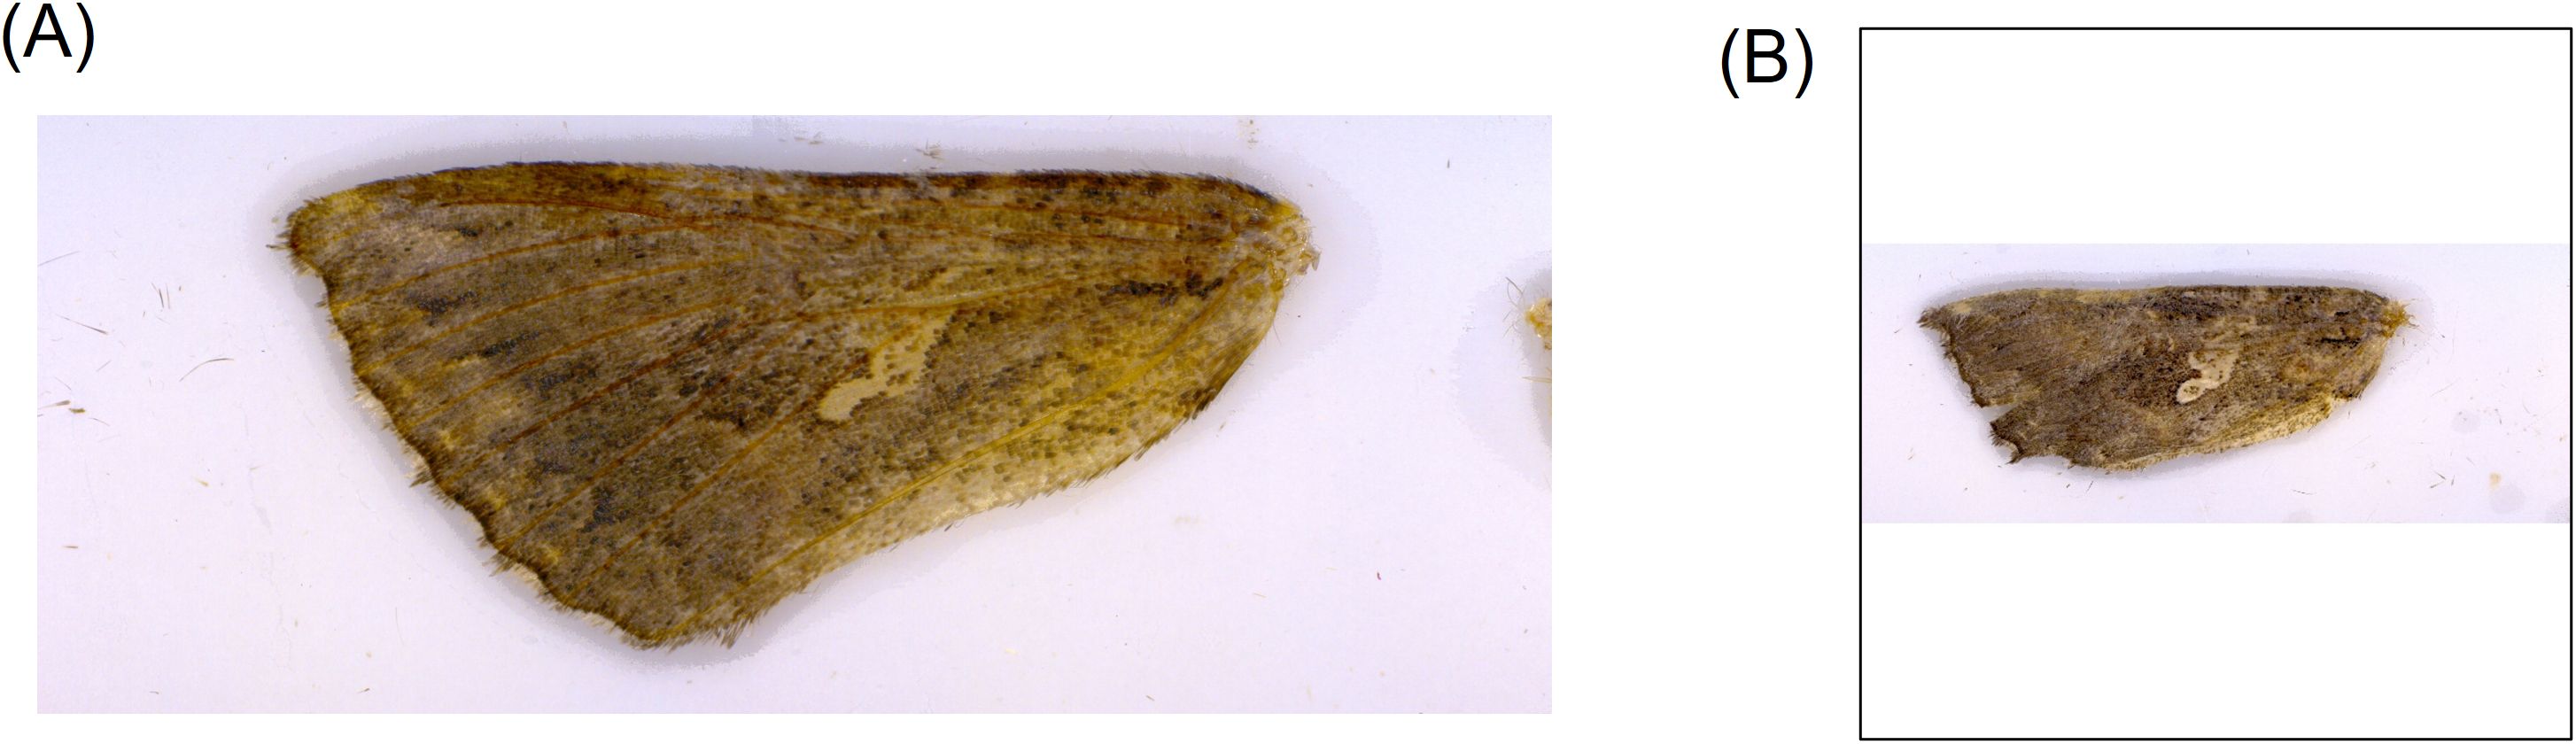
Figure 2. Original forewing images taken with the Smartzoom 5 imaging system (A) and resized images used for the models (B).
2.2 Classification experiments
Three experiments were performed using different classes and images from the lab, field, and noise datasets. The first experiment compared the two-species classification of SBL and CBL (2 classes), the second compared the species-sex classification of male and female SBL and CBL (4 classes), and the third compared the three-species classification of SBL, CBL, and GLM (3 classes). Images of GLM wings from the field and noise datasets were used only for the three-species classification experiment because of the low number of GLM images (n=134) relative to SBL (n=2,622) and CBL (n=1,032). This experiment was inherently imbalanced due to a low number of GLM images, and augmentation methods were not used to increase the number of images. For the three-species classification experiment, the images in the lab dataset were used for model training and validation, and the field and noise datasets were used as testing sets for model generalization. In the two-species and species-sex classification, all images in the lab dataset were mixed and then randomly divided into training, validation, and testing subsets by a ratio of 7:2:1 for each class (Table 2). The field and noise datasets were used as testing sets for model generalization. In the three-species classification experiment, the lab dataset was combined with GLM specimens from the field dataset, mixed, and randomly divided into training, validation, and testing subsets by a ratio of 7:2:1 for each class (Table 2). The noise dataset was used to test the model performance and generalization.
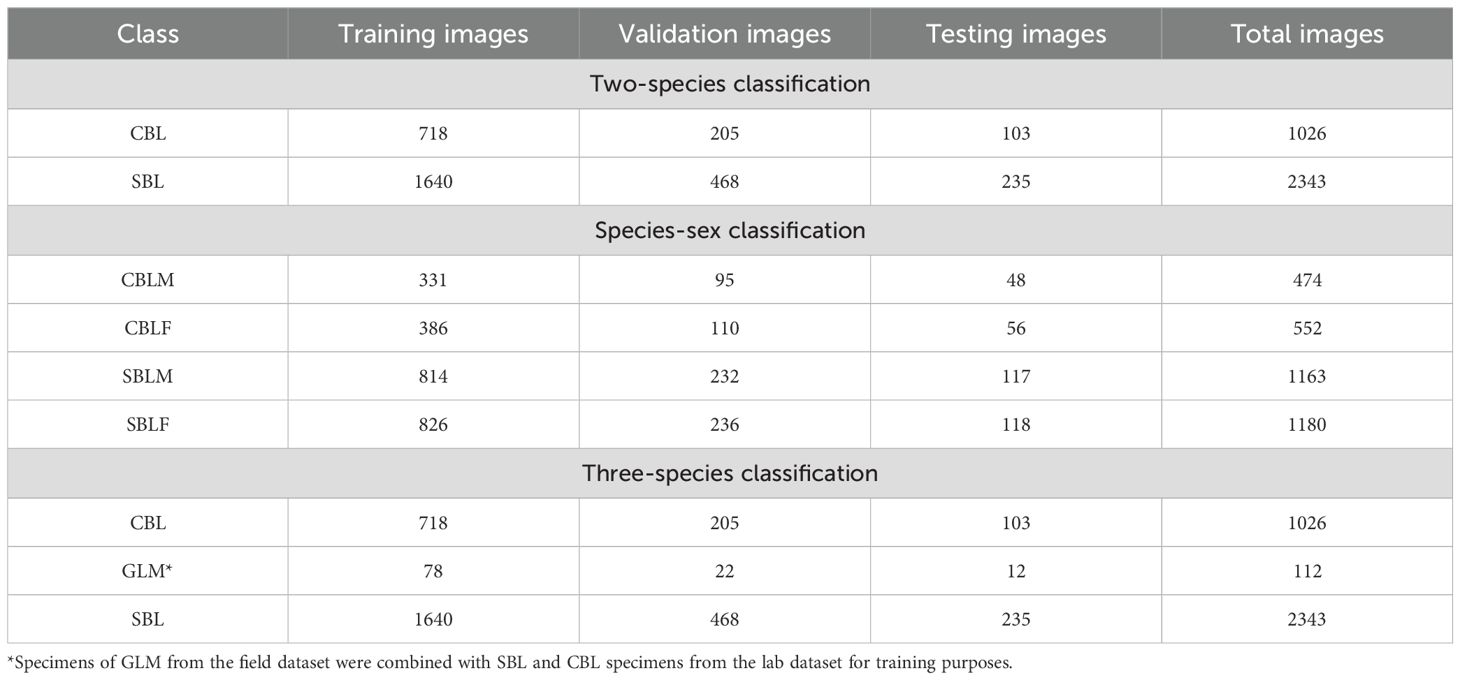
Table 2. Number of wing images from the lab dataset used for model training based on a random split by each species class of Chrysodeixis includens (SBL), Trichiplusia ni (CBL), and Rachiplusia ou (GLM) and species-sex class of male (-M) and female (-F) specimens.
The three classification experiments were performed using the five models described below. For each experiment, the model with the best performance from the testing subset of the lab dataset was used to further evaluate model generalization.
2.3 Deep learning models
Five deep learning models designed for image classification tasks were chosen for this study: ResNet50, MobileNetv3, ShuffleNetv2, EfficientNetv2-B0, and YOLOv8s-cls. Each model differs in architectural design, optimization techniques, and target applications. ResNet (He et al., 2016), short for Residual Network, is a deep learning-based classification model that uses residual blocks with skip connections to address the problem of vanishing gradients. ResNet50, a ResNet model with 50 layers, was selected for this study. MobileNet (Howard et al., 2017) is a lightweight CNN that was designed to reduce the size and complexity of the neural network for real-time applications. MobileNetv3 (Howard et al., 2019) was selected because it further refines the MobileNet architecture using a combination of neural architecture search and squeeze-and-excitation modules. ShuffleNet (Zhang et al., 2018) is another lightweight CNN designed for devices with limited computational resources that uses grouped convolutions and channel shuffling techniques. ShuffleNetv2 (Ma et al., 2018) was selected as it further simplifies and enhances the ShuffleNet architecture. EfficientNet (Tan and Le, 2019) is a CNN that combines neural architecture search and compound scaling to achieve high accuracy while maintaining efficiency. The baseline model EfficientNetv2-B0 (Tan and Le, 2021) was selected for this study. YOLOv8-cls (Jocher et al., 2023) is an architecture of the YOLOv8 family specifically designed for image classification tasks. The YOLOv8 framework is well-known for its balance between speed and accuracy due to its modern advancements such as C2f blocks, scalable architecture, and flexible deployments. The small version of YOLOv8-cls, YOLOv8s-cls, was selected for this study.
2.4 Implementation details
All models were trained in the University of Florida supercomputer, HiPerGator 3.0, a high-performance computing cluster, Gainesville, FL. The node was equipped with 8 AMD EPYC ROME CPU cores, one NVIDIA DGX A100 GPU node (80GB), and 32 GB of memory. The operating system was Linux, with software libraries including CUDA 11.7, PyTorch, and Python 3.10 with OpenCV 4.7.0 library. ResNet50, MobileNetv3, ShuffleNetv2, and EfficientNetv2-B0 were implemented using the mmpretrain package, and YOLOv8s-cls was implemented using the Ultralytics package.
Transfer learning, a strategy that leverages the previously learned knowledge gained from a pretrained model usually trained on a larger dataset, was used to reduce the training time and improve performance. The weights were pretrained on the ImageNet dataset that contains 1000 classes and loaded before the model training. Each model was then finetuned on the established forewing datasets. All the models were trained for 100 epochs, and the best model was selected if the weights performed the best on the validation dataset during training. The input image resolution was 640x640 pixels. The optimizer used for ResNet50, MobileNetv3, ShuffleNetv2 and EfficientNetv2-B0 was SGD (stochastic gradient descent). The initial learning rate was 0.1, and the momentum was 0.9. For YOLOv8s-cls, the optimizer was automatically determined as AdamW with a learning rate of 0.000714 and momentum of 0.9.
2.5 Evaluation metrics
F1 score and Top-1 accuracy were employed as the metrics to evaluate the model performance of the three wing classification experiments. F1 score is the harmonic mean of precision and recall. Precision is determined by the ratio of true positive predictions to the total number of positive predictions. Recall is the ratio of true positive detections to the number of ground truth instances. Top-1 accuracy measures the ratio of correct predictions to all predictions. The calculations of the metrics were shown in Equations 1-4.
t-SNE (Maaten and Hinton, 2008) was utilized to visualize the feature space of each model. It is an algorithm that can visualize high dimensional data in a lower dimensional space, which makes it easier to interpret and understand the clusters formed by different classes. Furthermore, Gradient-weighted Class Activation Mapping, or GradCAM, (Selvaraju et al., 2017) was employed to visualize the feature map as a heatmap. It highlights the important regions in an input image that the model focuses on to make its classification decisions. Additionally, it can help understand which parts of an image are important, providing insights into model behavior. Interpretations of GradCAM feature maps were described and correlated with model performance results for each classification experiment.
3 Results
3.1 Model performance on two-species classification
In the two-species classification experiment, the evaluation results of five models on the testing subset of the lab dataset showed that all five models achieved high performance and the ability to distinguish CBL and SBL. Four models had an F1 score and Top-1 accuracy of 100.00% (Tables 3, 4). ResNet50 had two incorrect predictions with an F1 score and Top-1 accuracy over 99.03% (Tables 3, 4; Supplementary Figure S1A). The t-SNE visualization of the embedding space of each model showed two distinct clusters of species, consistent with the model performances (Figure 3). A few specimens overlapped in the clusters of the ResNet50 and ShuffleNetv2 models (Figures 3A, C).
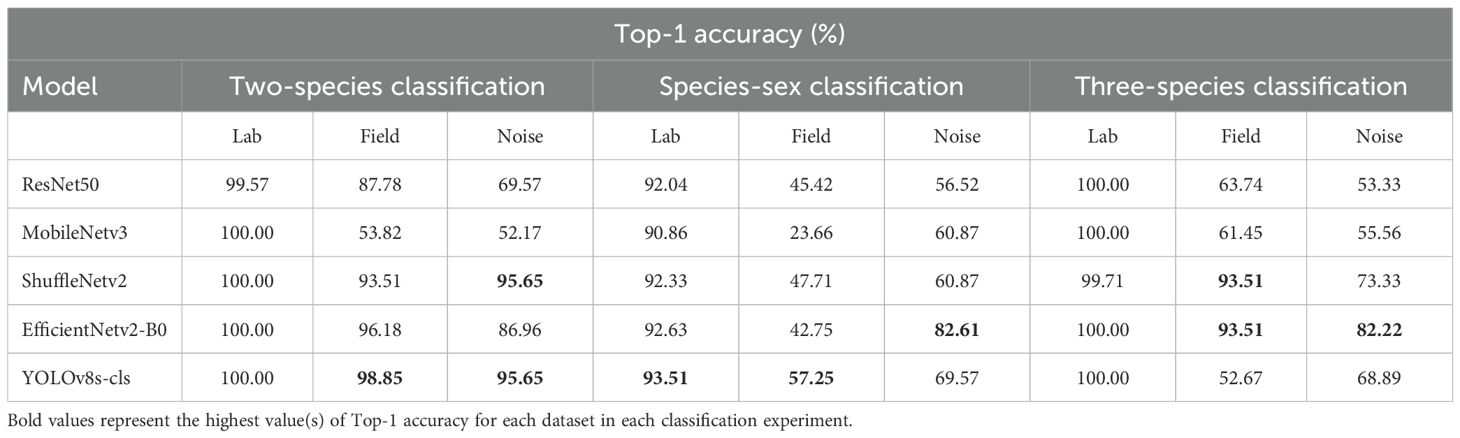
Table 3. Top-1 accuracies (%) of each model for each classification experiment and testing dataset.
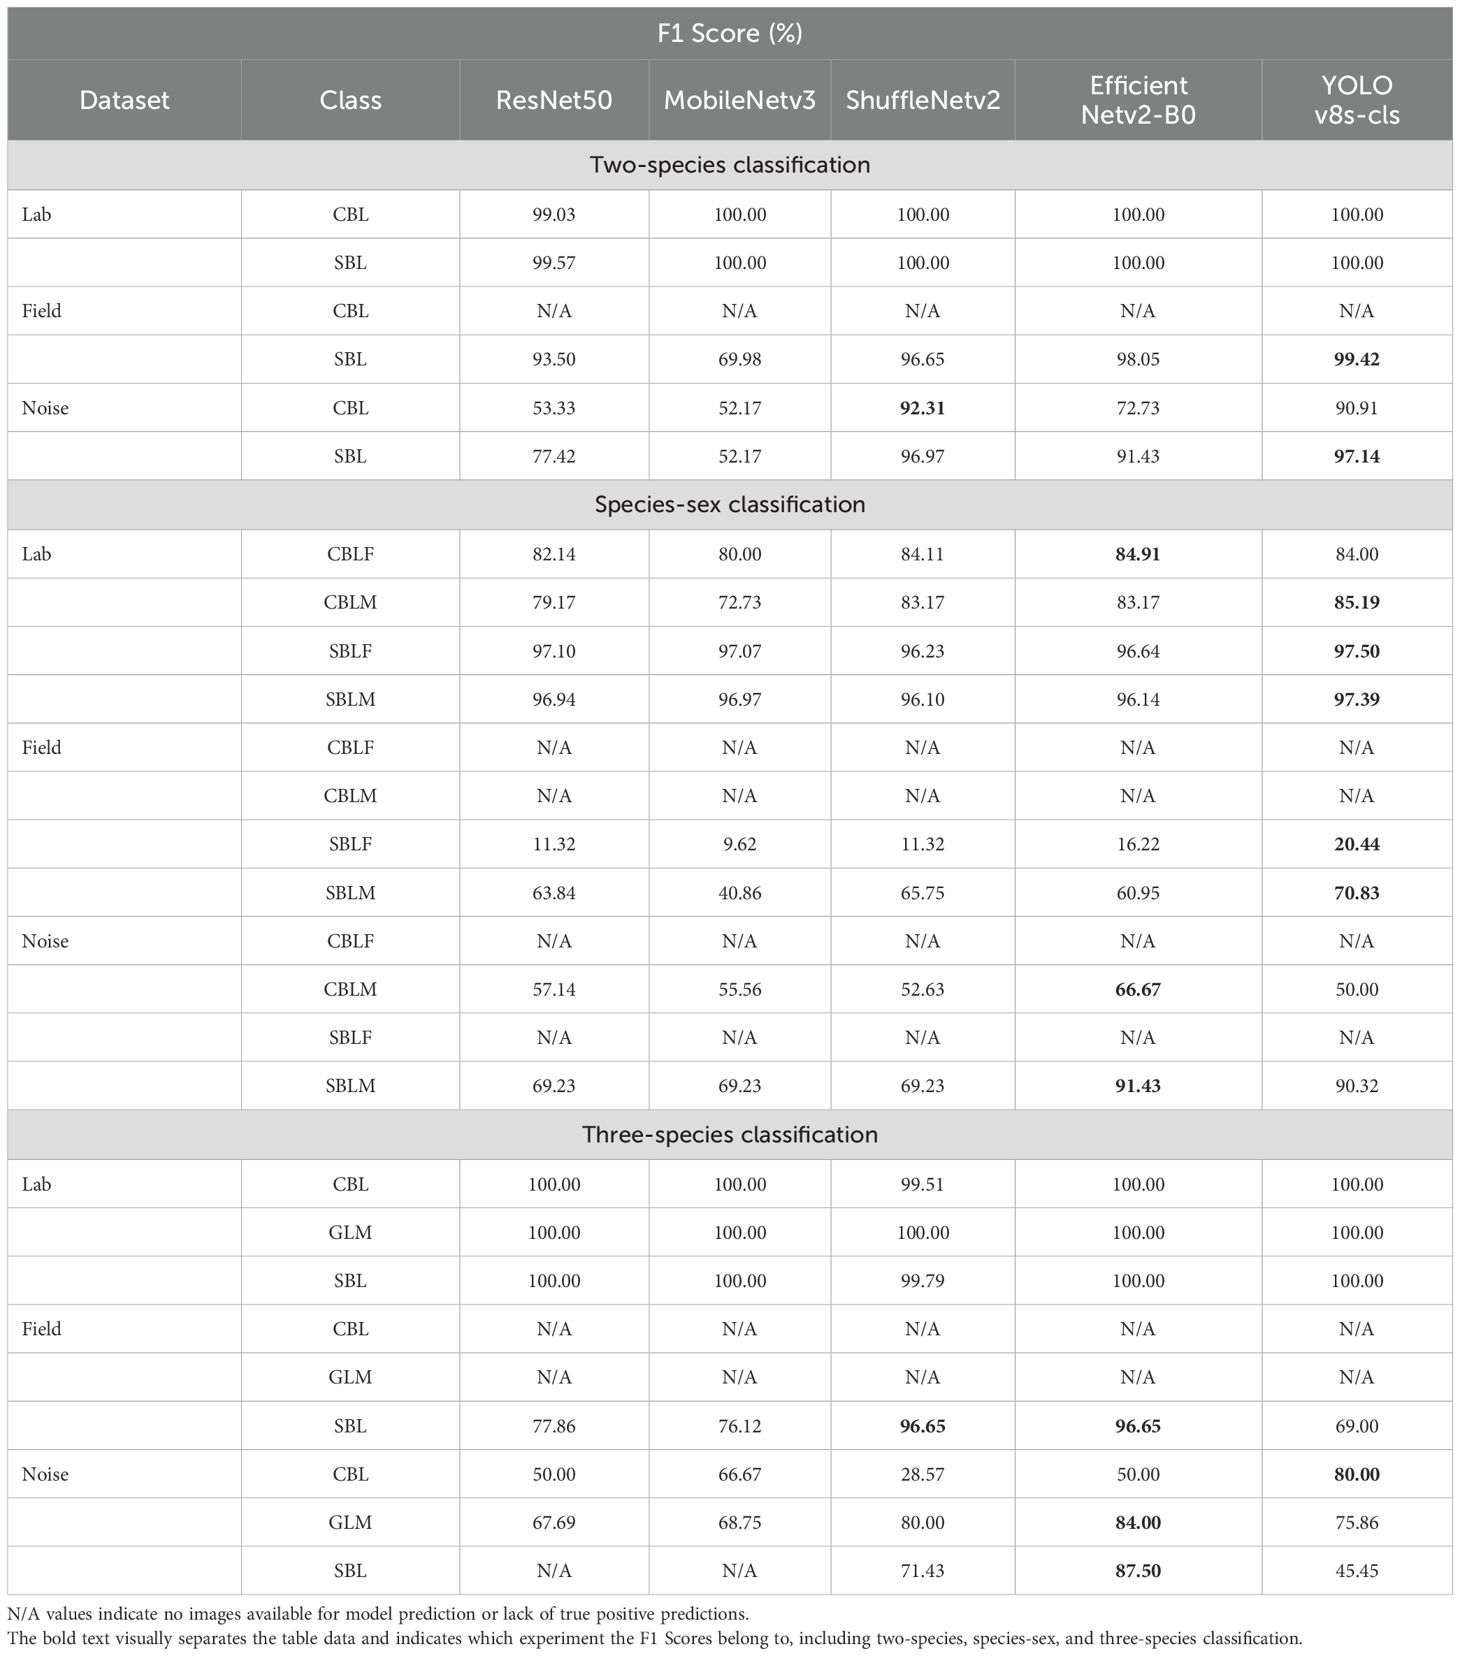
Table 4. F1 scores (%) for each model and class and its respective dataset and classification experiment.
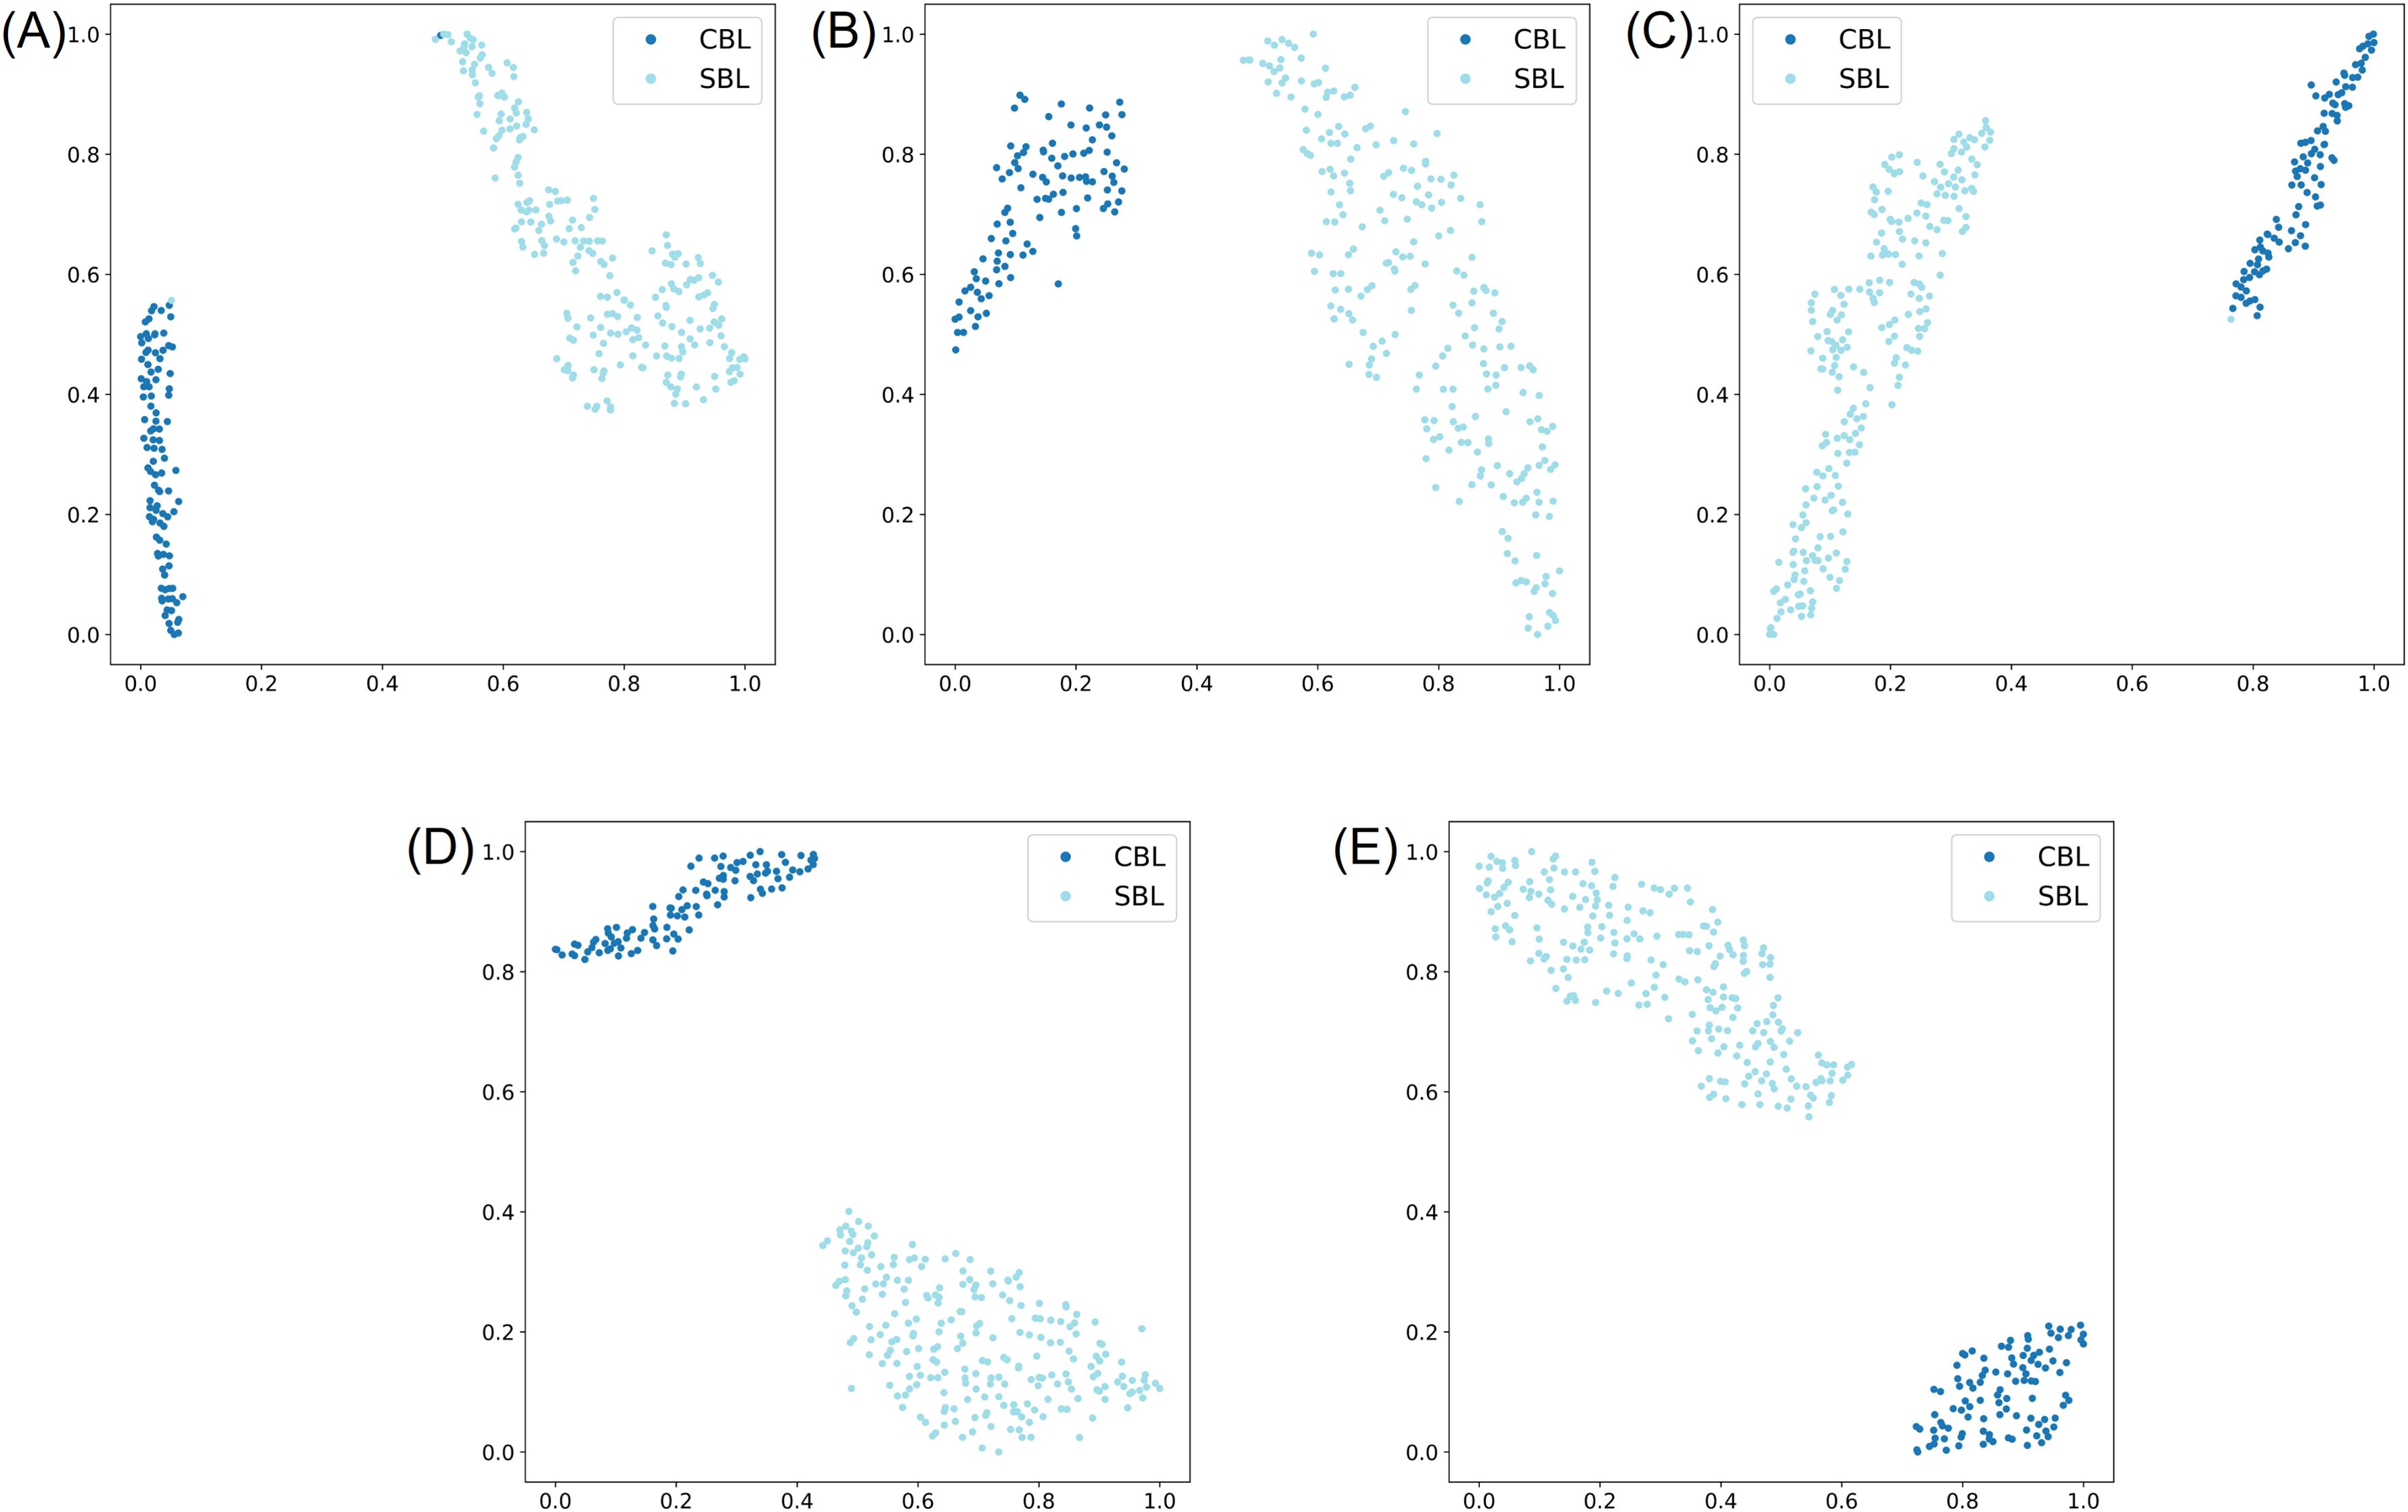
Figure 3. t-SNE visualization of the learned representation from the testing subset of the lab dataset for the two-species classification experiment, where the two classes correspond to Chrysodeixis includens (SBL) and Trichoplusia ni (CBL). (A-E) represent embeddings learned from deep learning models of ResNet50, MobileNetv3, ShuffleNetv2, EfficientNetv2-B0 and YOLOv8s-cls, respectively.
On the generalization datasets, three of the five models maintained high performances. The F1 scores and Top-1 accuracy of YOLOv8s-cls, EfficientNetv2-B0, and ShuffleNetv2 were lower than the results of the testing subset of the lab dataset, but the performance was still relatively high with values over 72.73% (Tables 3, 4). Among the five models, YOLOv8s-cls had the highest Top-1 accuracy of 98.85%, and MobileNetv3 had the lowest Top-1 accuracy of 53.82%. Only three field specimens of SBL were incorrectly predicted as CBL by YOLOv8s-cls (Supplementary Figure S2E), while the other models had higher numbers of incorrect predictions (Supplementary Figure S2). The model performances on the noise dataset were relatively similar to the field dataset (Table 3; Supplementary Figure S3). The YOLOv8s-cls and ShuffleNetv2 models demonstrated the highest Top-1 accuracy of 95.65% and the highest F1 scores between the two classes (Table 4).
Feature maps of images from the testing subset of the lab dataset were visualized for each model using GradCAM. The visualizations showed that the features used to make predictions varied by the model type (Figure 4). ResNet50, EfficientNetv2-B0, and MobileNetv3 tended to use more global features across the wing and appeared to consider the unique wing stigma in the discal area for its predictions. ShuffleNetv2 and YOLOv8s-cls used precise local features near the wing base, tornus, costa, and outer margin for its predictions. The feature maps of MobileNetv3 showed highlighted regions on the background of the image, indicating that image artifacts may have also influenced model predictions.
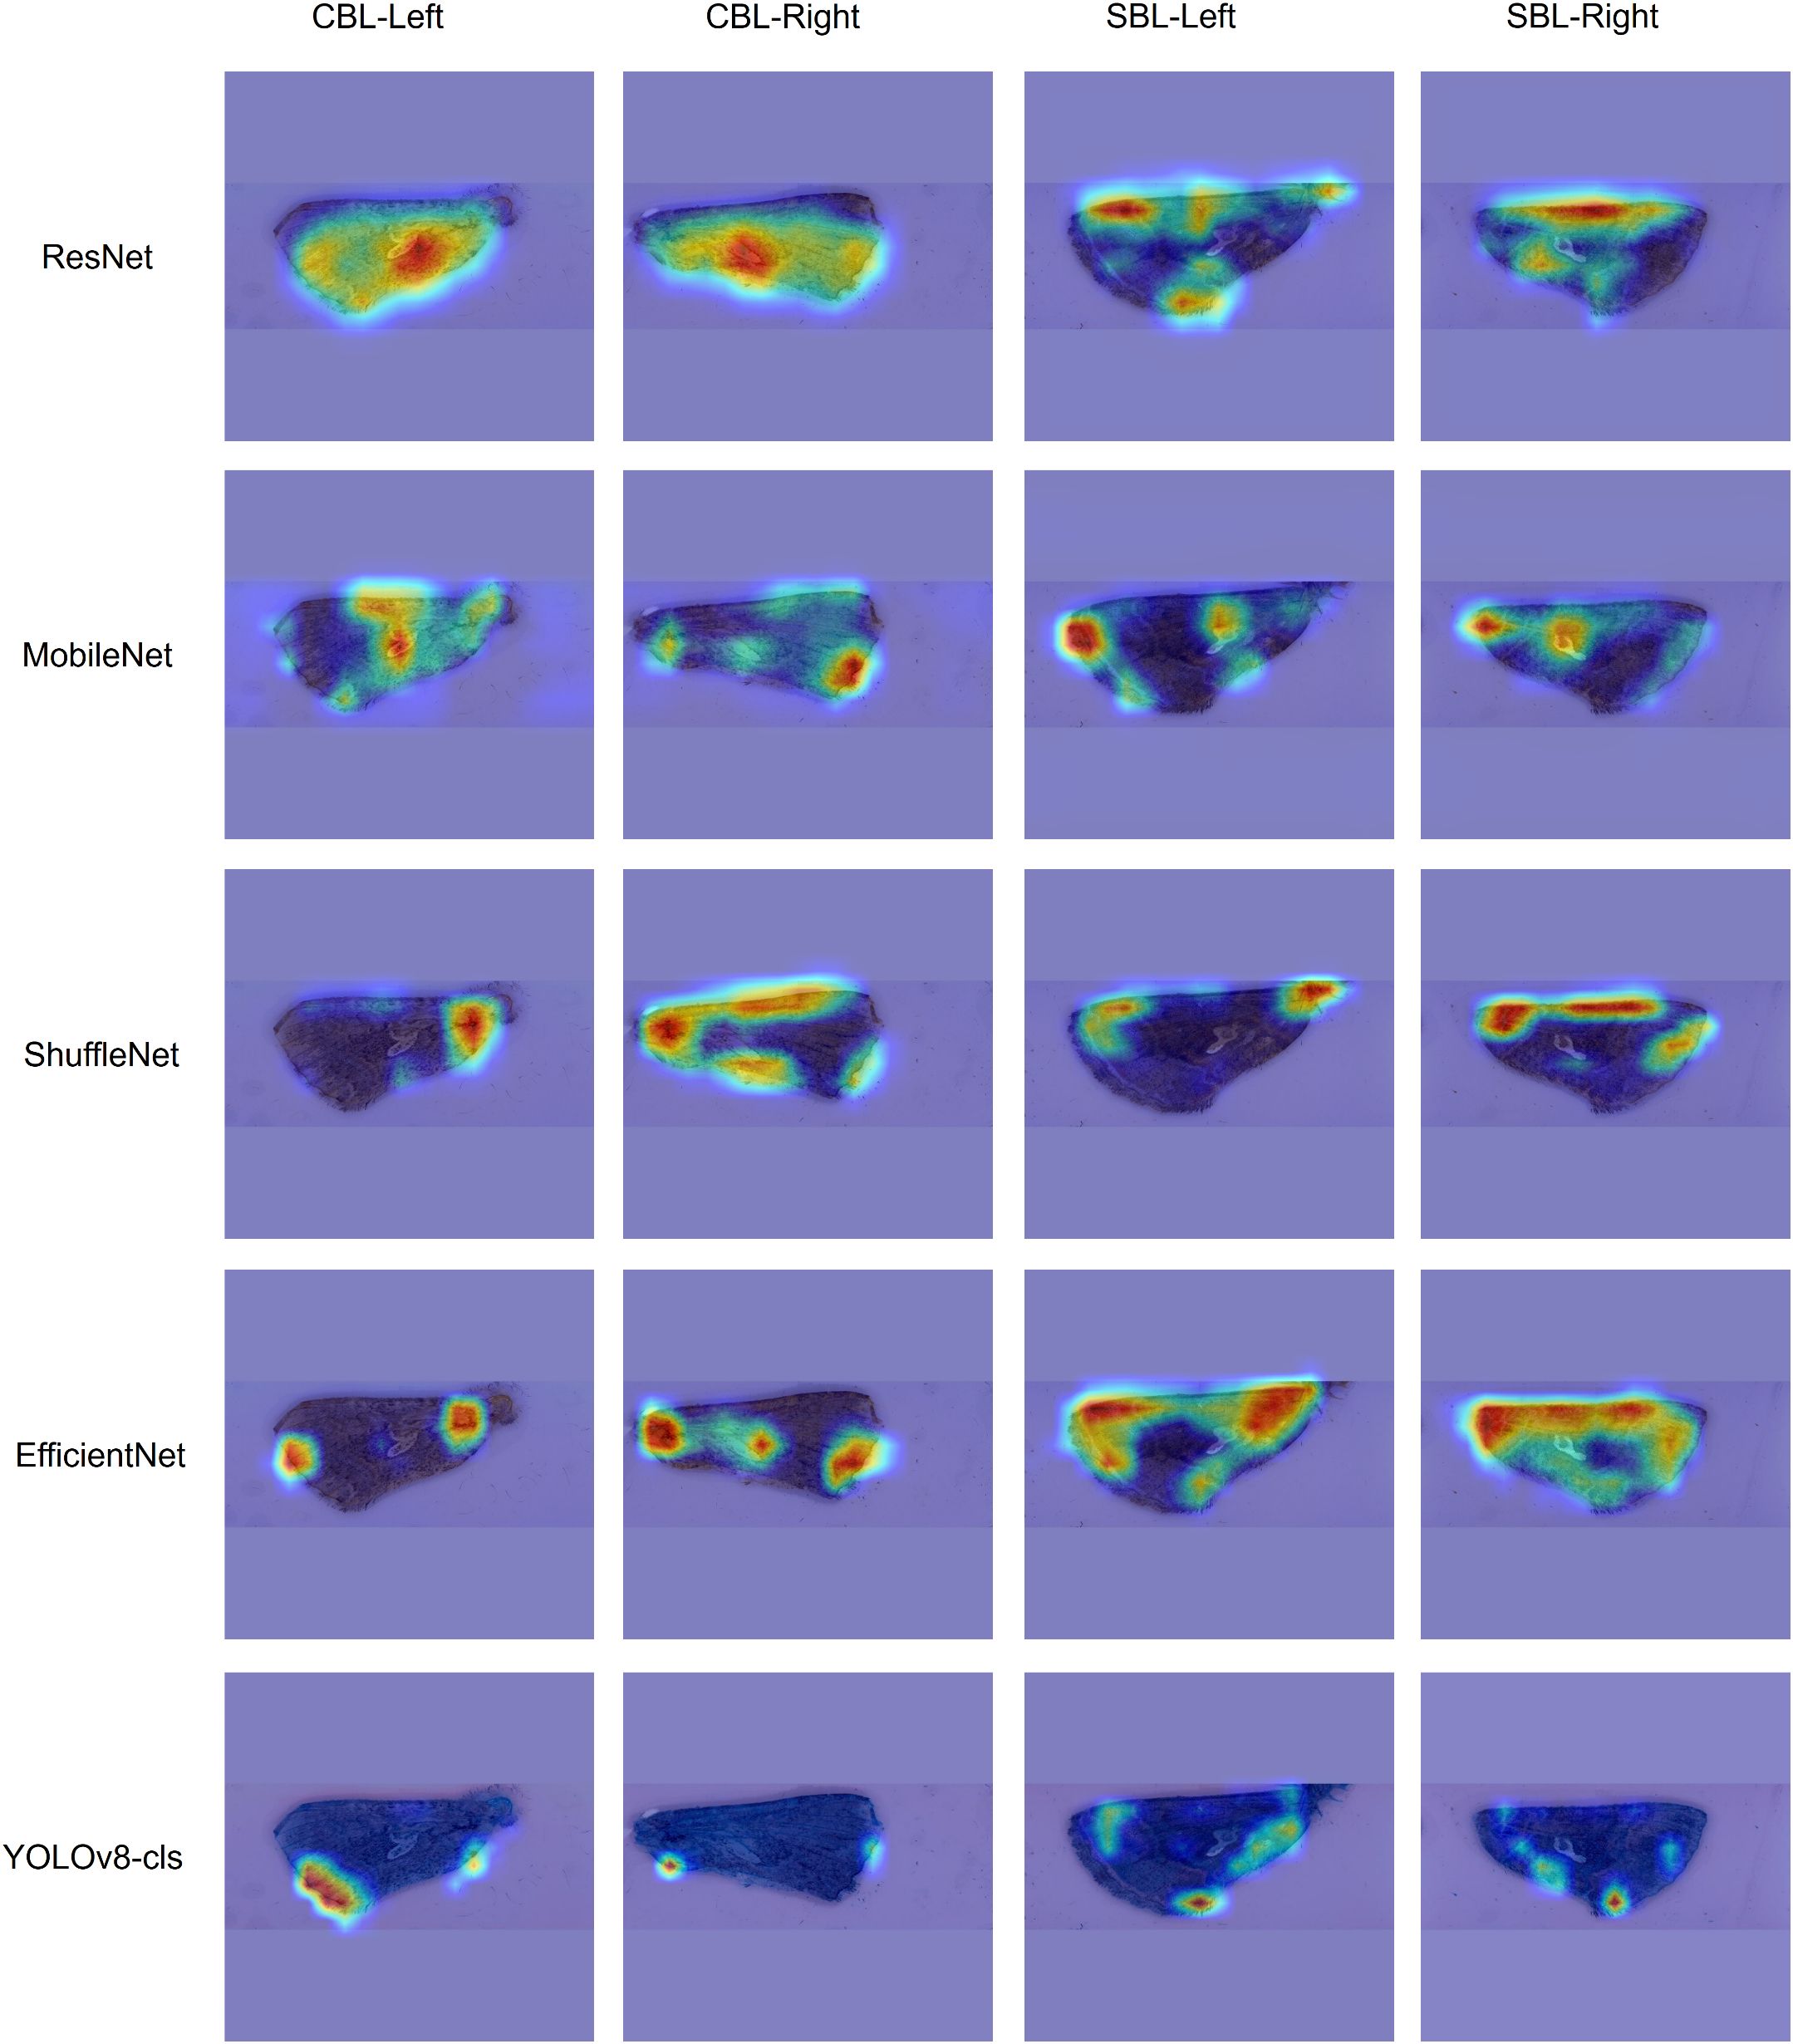
Figure 4. GradCAM visualization of the feature map of four different forewings of Trichoplusia ni (CBL) and Chrysodeixis includens (SBL). Each column uses a different wing image with the corresponding feature map of each model. The heatmaps highlight the most influential features in warmer colors, with red indicating the highest influence.
Because the YOLOv8s-cls model had the highest performance on both generalization datasets, only the feature maps of this model were interpreted and described. The feature maps of correct SBL predictions from the lab dataset show a variety of highlighted regions of the wing that may be related to visual color patterns (Figure 5A). The tornus, costa, and inner margin were almost always used by the model. The distal edge of the wing base was also important for model predictions, which may be related to the basal line on the wings of SBL. Of lesser importance, the submarginal area was also highlighted in most feature maps. The model focused on features that appear to outline the wing shape, and we hypothesize that the model may be using wing shape to make predictions; however, this interpretation cannot be verified without using another technique like geometric morphometrics analysis.
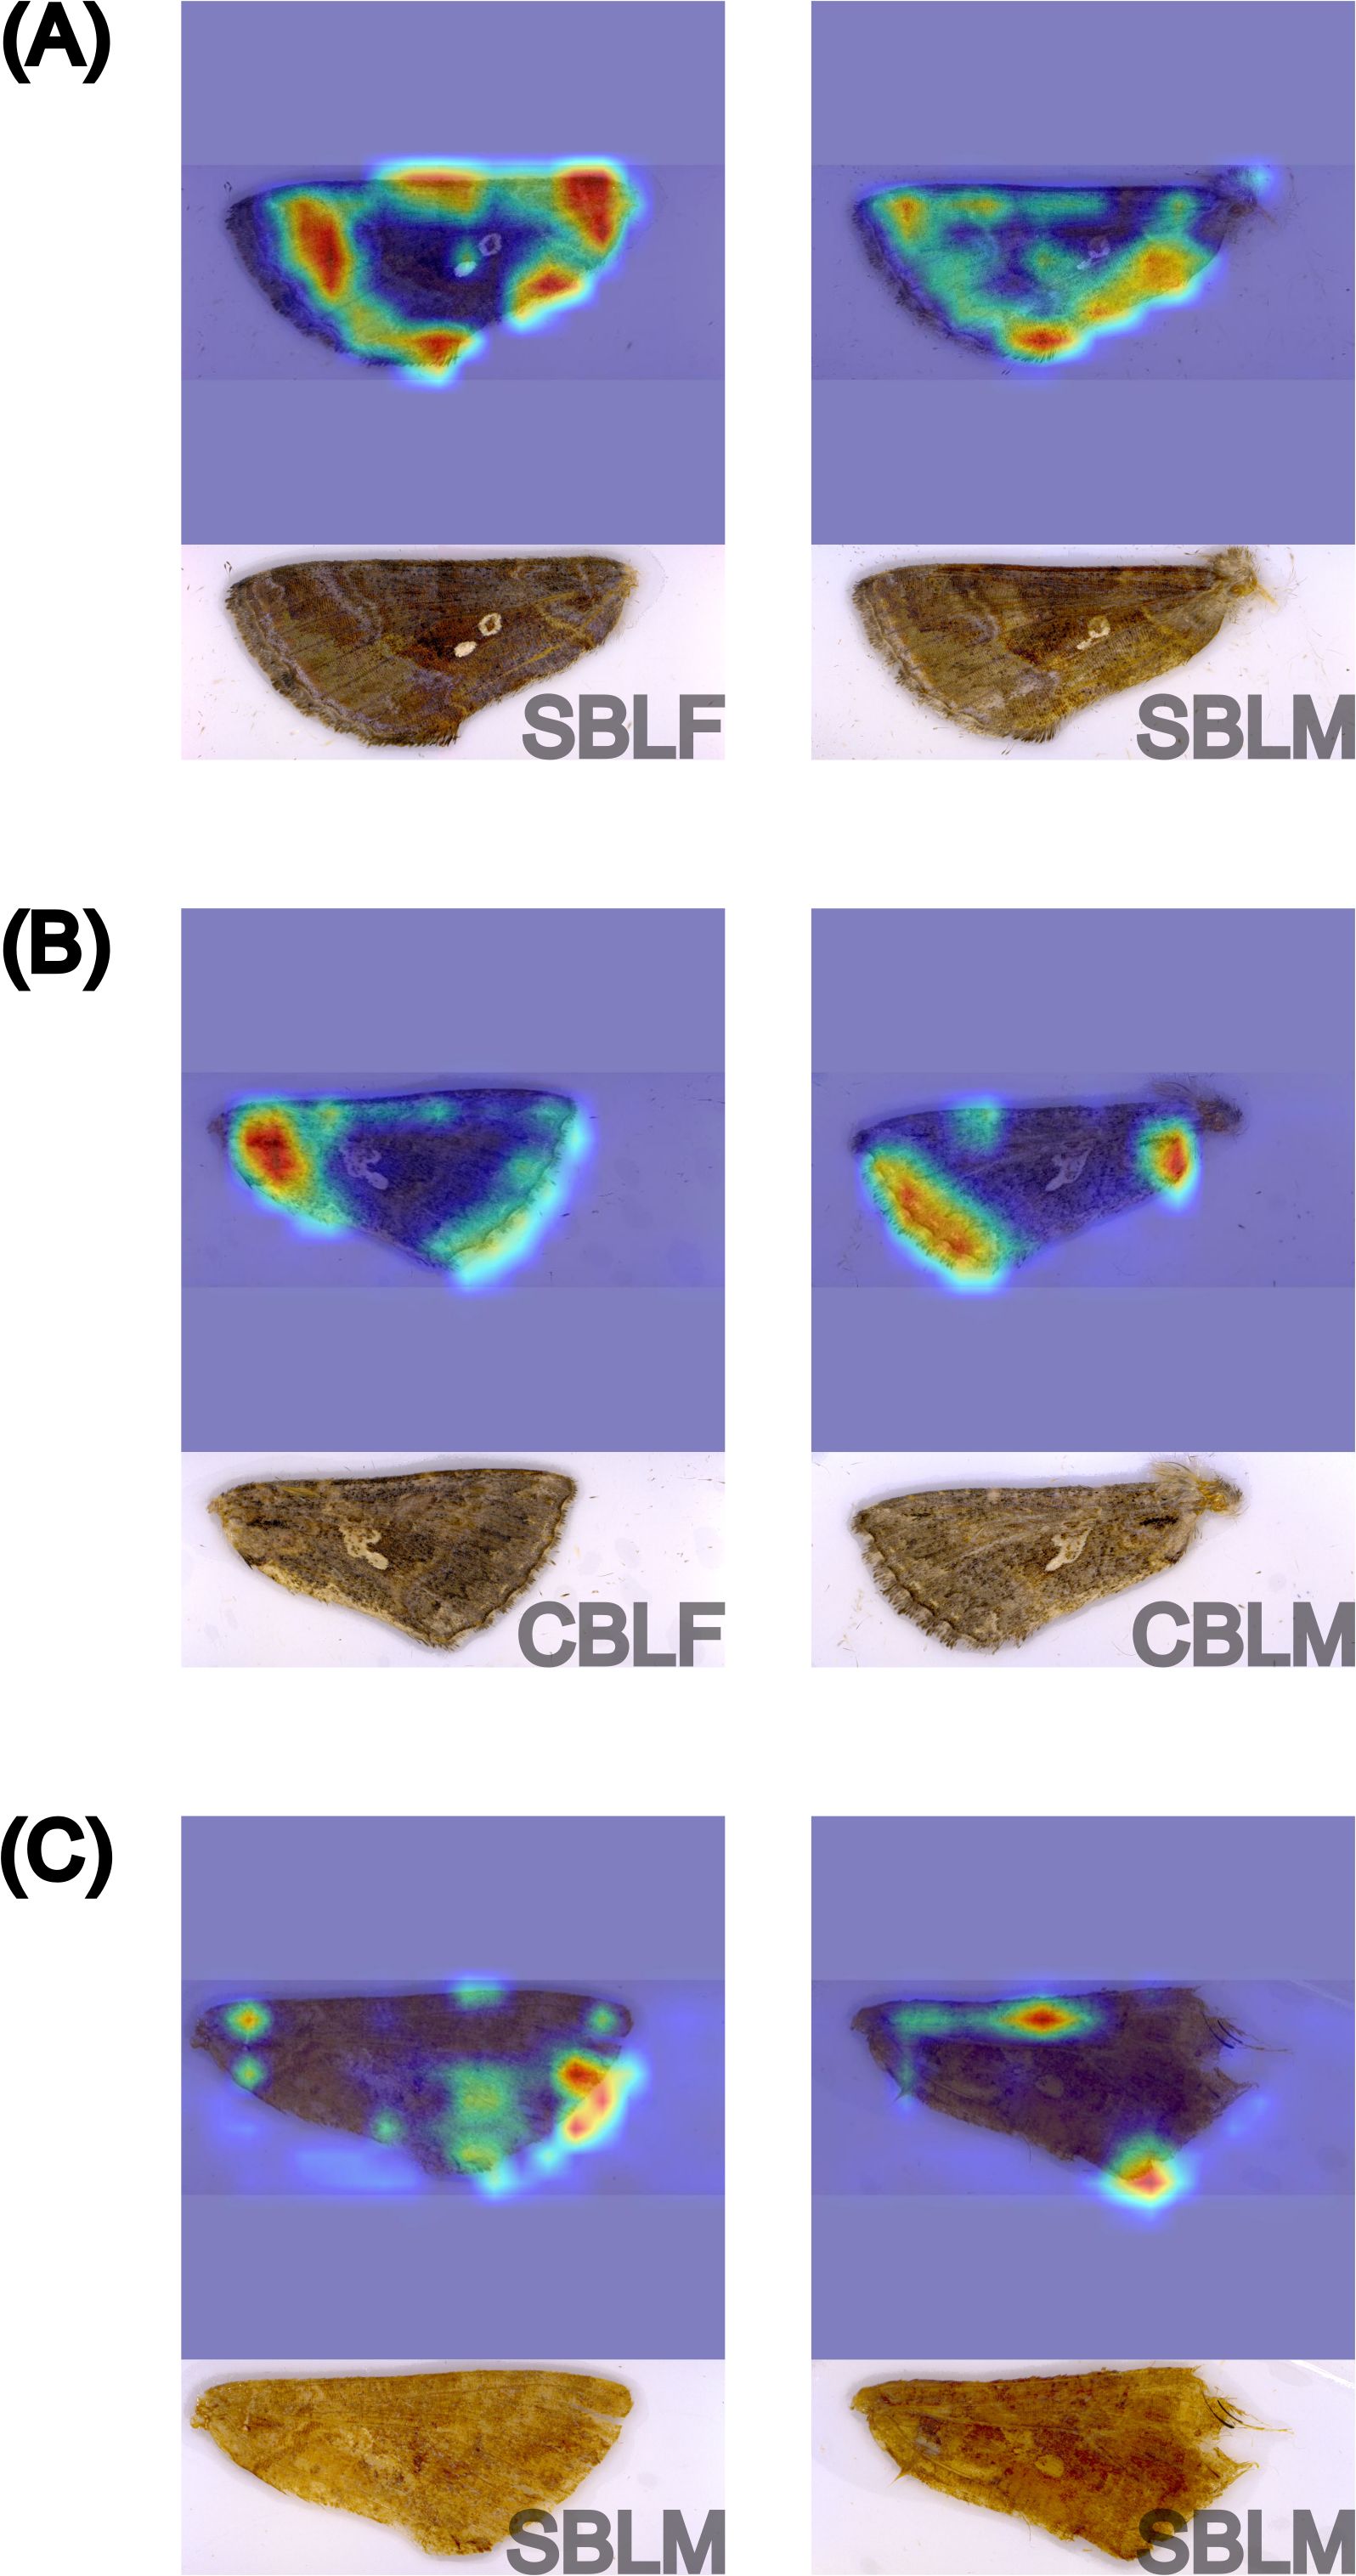
Figure 5. GradCAM visualization of the feature maps of six different forewings from YOLOv8s-cls model predictions in the two-species classification experiment, including correct predictions of Chrysodeixis includens (SBL) (A) and Trichoplusia ni (CBL) (B) from the lab dataset and incorrect predictions of SBL as CBL from the field dataset (C). The corresponding original image and specimen information (species and sex) are provided underneath each feature map. Sex was not considered in this analysis. The heatmaps highlight the most influential features in warmer colors, with red indicating the highest influence.
When examining the feature maps of correct CBL predictions from YOLOv8s-cls, the model primarily relies on the wing base and outer wing margins. The basal area of CBL wings has a less pronounced basal line that may be used by the model for distinguishing species (Figure 5B). Additionally, CBL wings have a short, black basal dash that is not present in SBL wings. The highlighted features along the outer wing margins may correspond to a discontinuous band of white scales that follow the contour of the margin, as shown in Figure 5.
Incorrect predictions of SBL and CBL by the YOLOv8s-cls model showed highlighted features that were not typically used for correct predictions, including the image background (Figure 5C). All four incorrect predictions were lower quality specimens than the specimens used for training the models. It is possible that the model was unable to locate relevant features for an accurate prediction due to the loss of features in the lower quality specimens.
3.2 Model performance on species-sex classification
The species-sex classification experiment indicated that all five models achieved a Top-1 accuracy of over 90% on the testing subset of the lab dataset when classifying both species and sex of CBL and SBL. Like the two-species classification results, YOLOv8s-cls achieved the highest Top-1 accuracy of 93.51%, and MobileNetv3 had the lowest Top-1 accuracy of 90.86% (Table 3). The F1 scores showed that the species-sex classification performance on SBL is higher than that of CBL (Table 4; Figure 6). This result was consistent with the t-SNE visualization, where male and female CBL clusters were overlapping and less distinct than that of SBL (Figure 7). The confusion matrices also demonstrated that all five models can still distinguish both species, regardless of the sex prediction; there was only one incorrect species prediction by EfficientNetv2-B0 (Figure 6D).
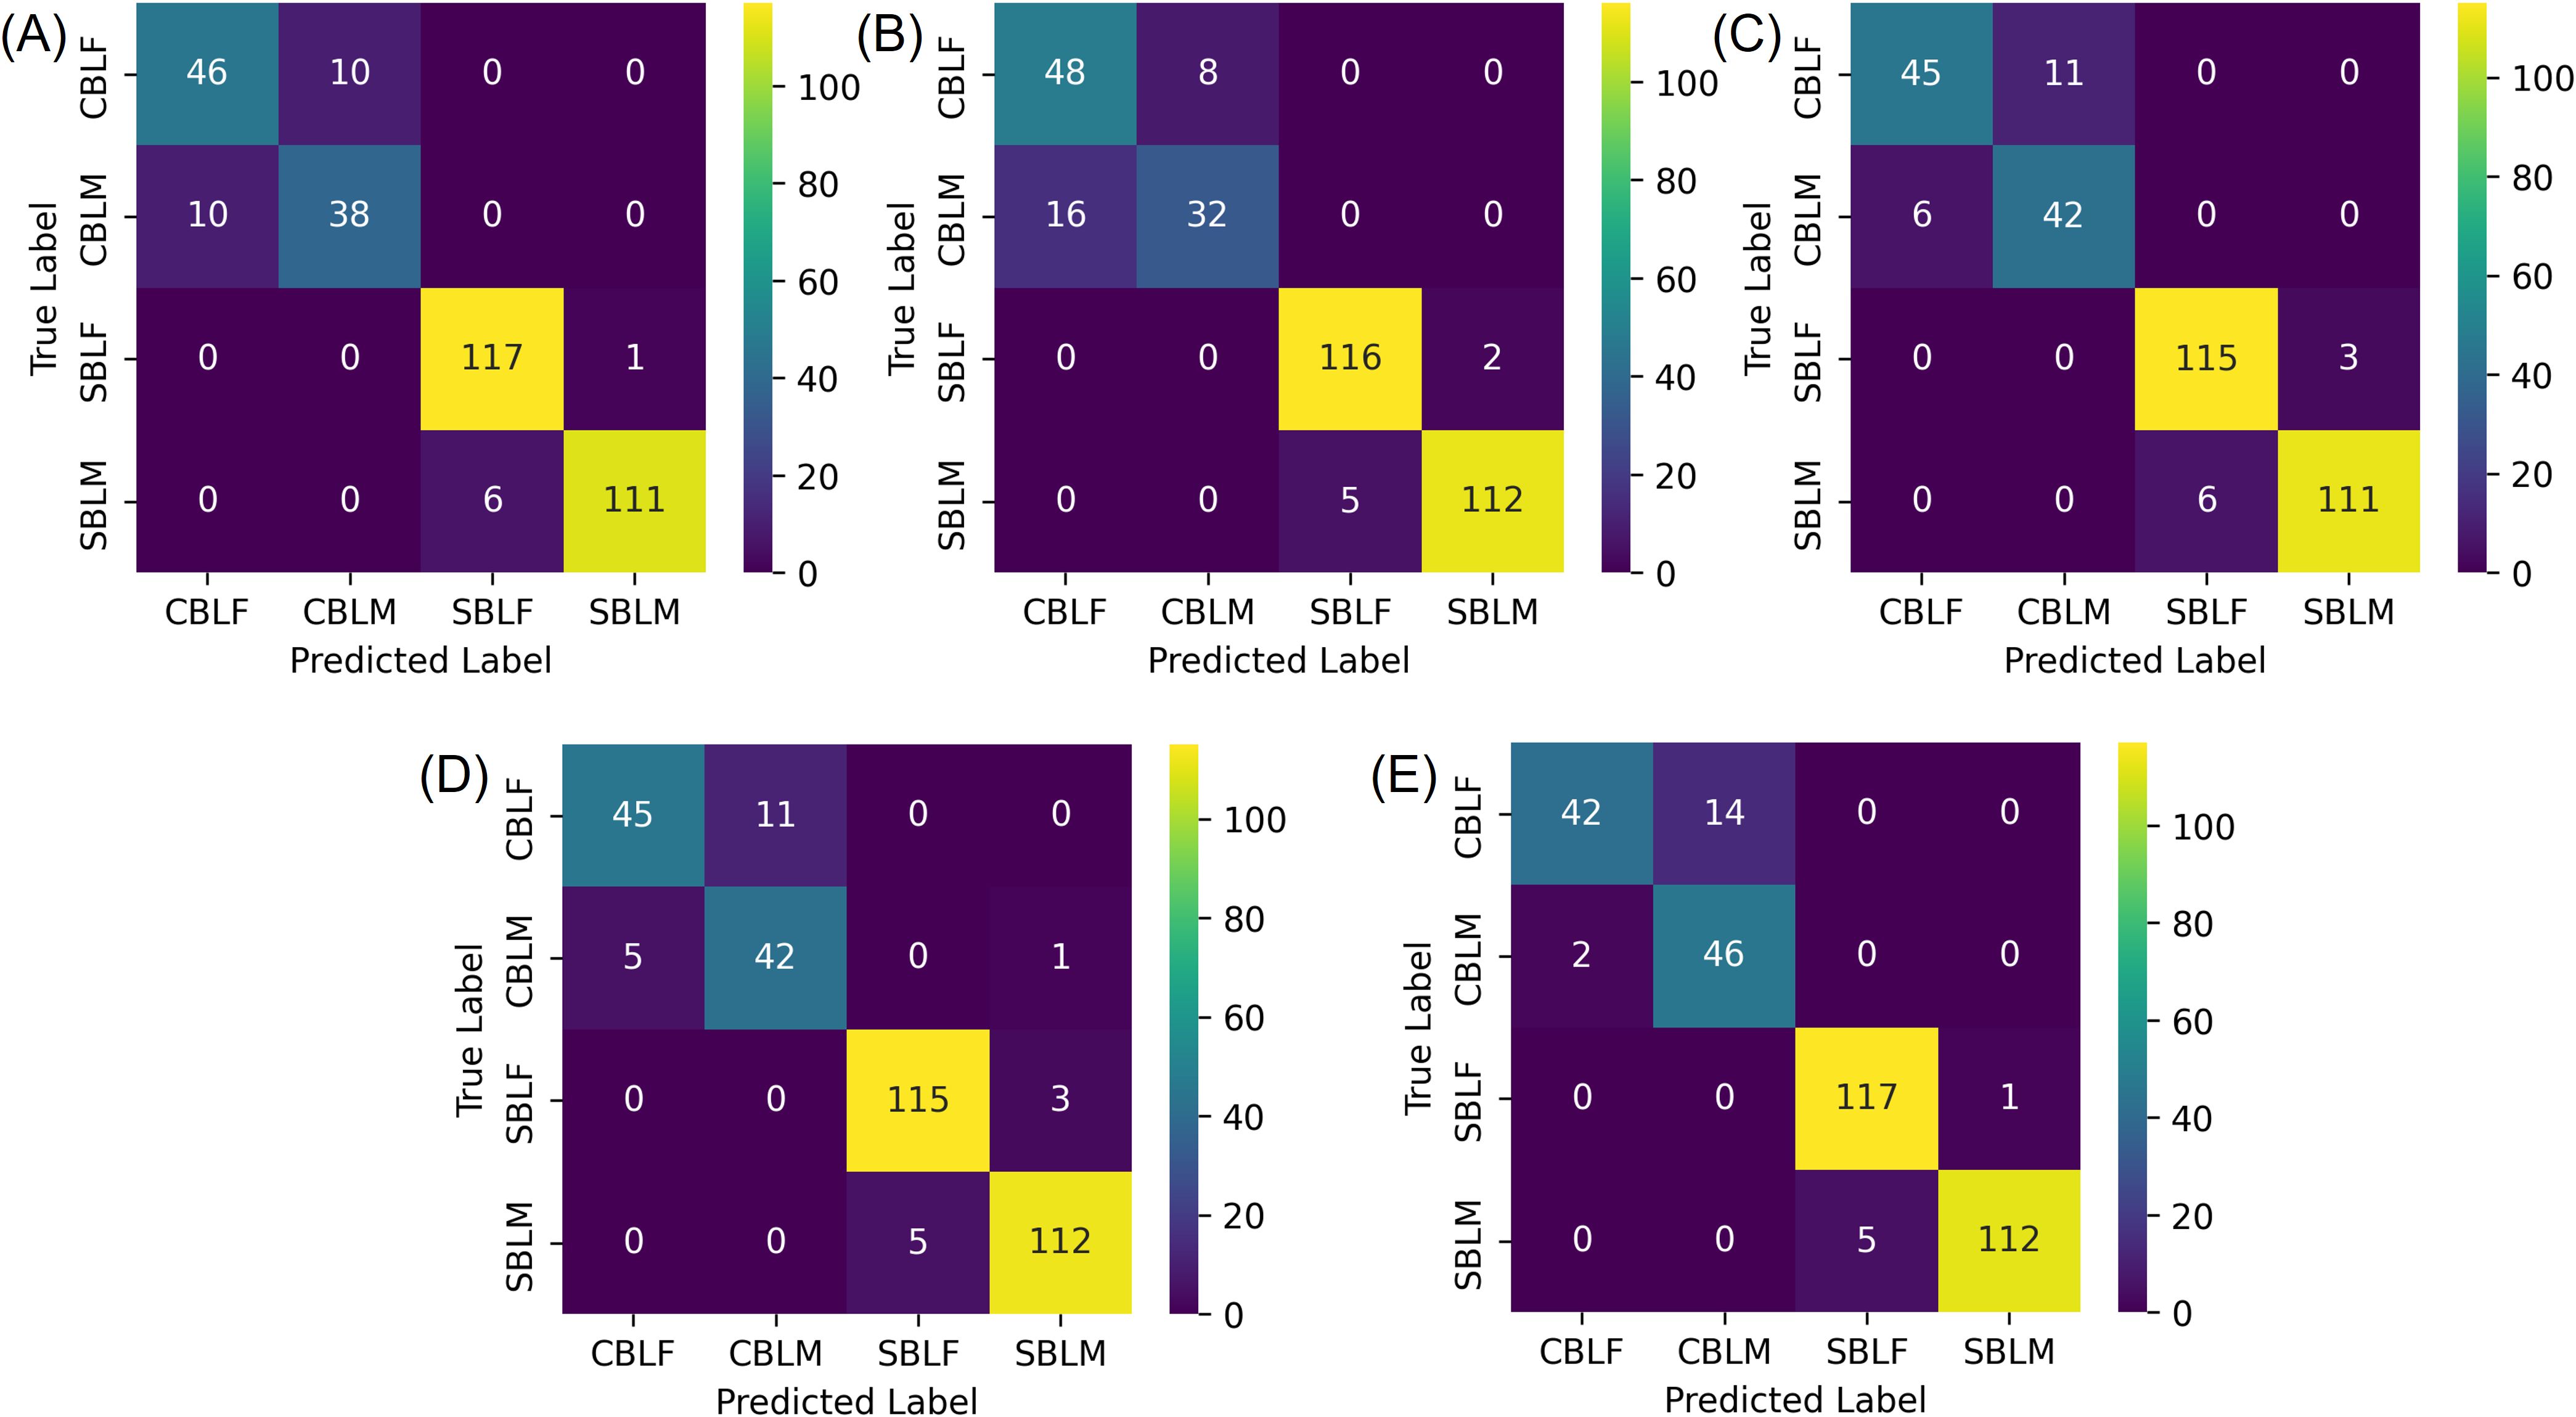
Figure 6. Confusion matrices of the testing subset of the lab dataset for the species-sex classification experiment, where the four classes correspond to male (-M) and female (-F) Chrysodeixis includens (SBL) and Trichoplusia ni (CBL). (A-E) are classification results from deep learning models of ResNet50, MobileNetv3, ShuffleNetv2, EfficientNetv2-B0 and YOLOv8s-cls, respectively.
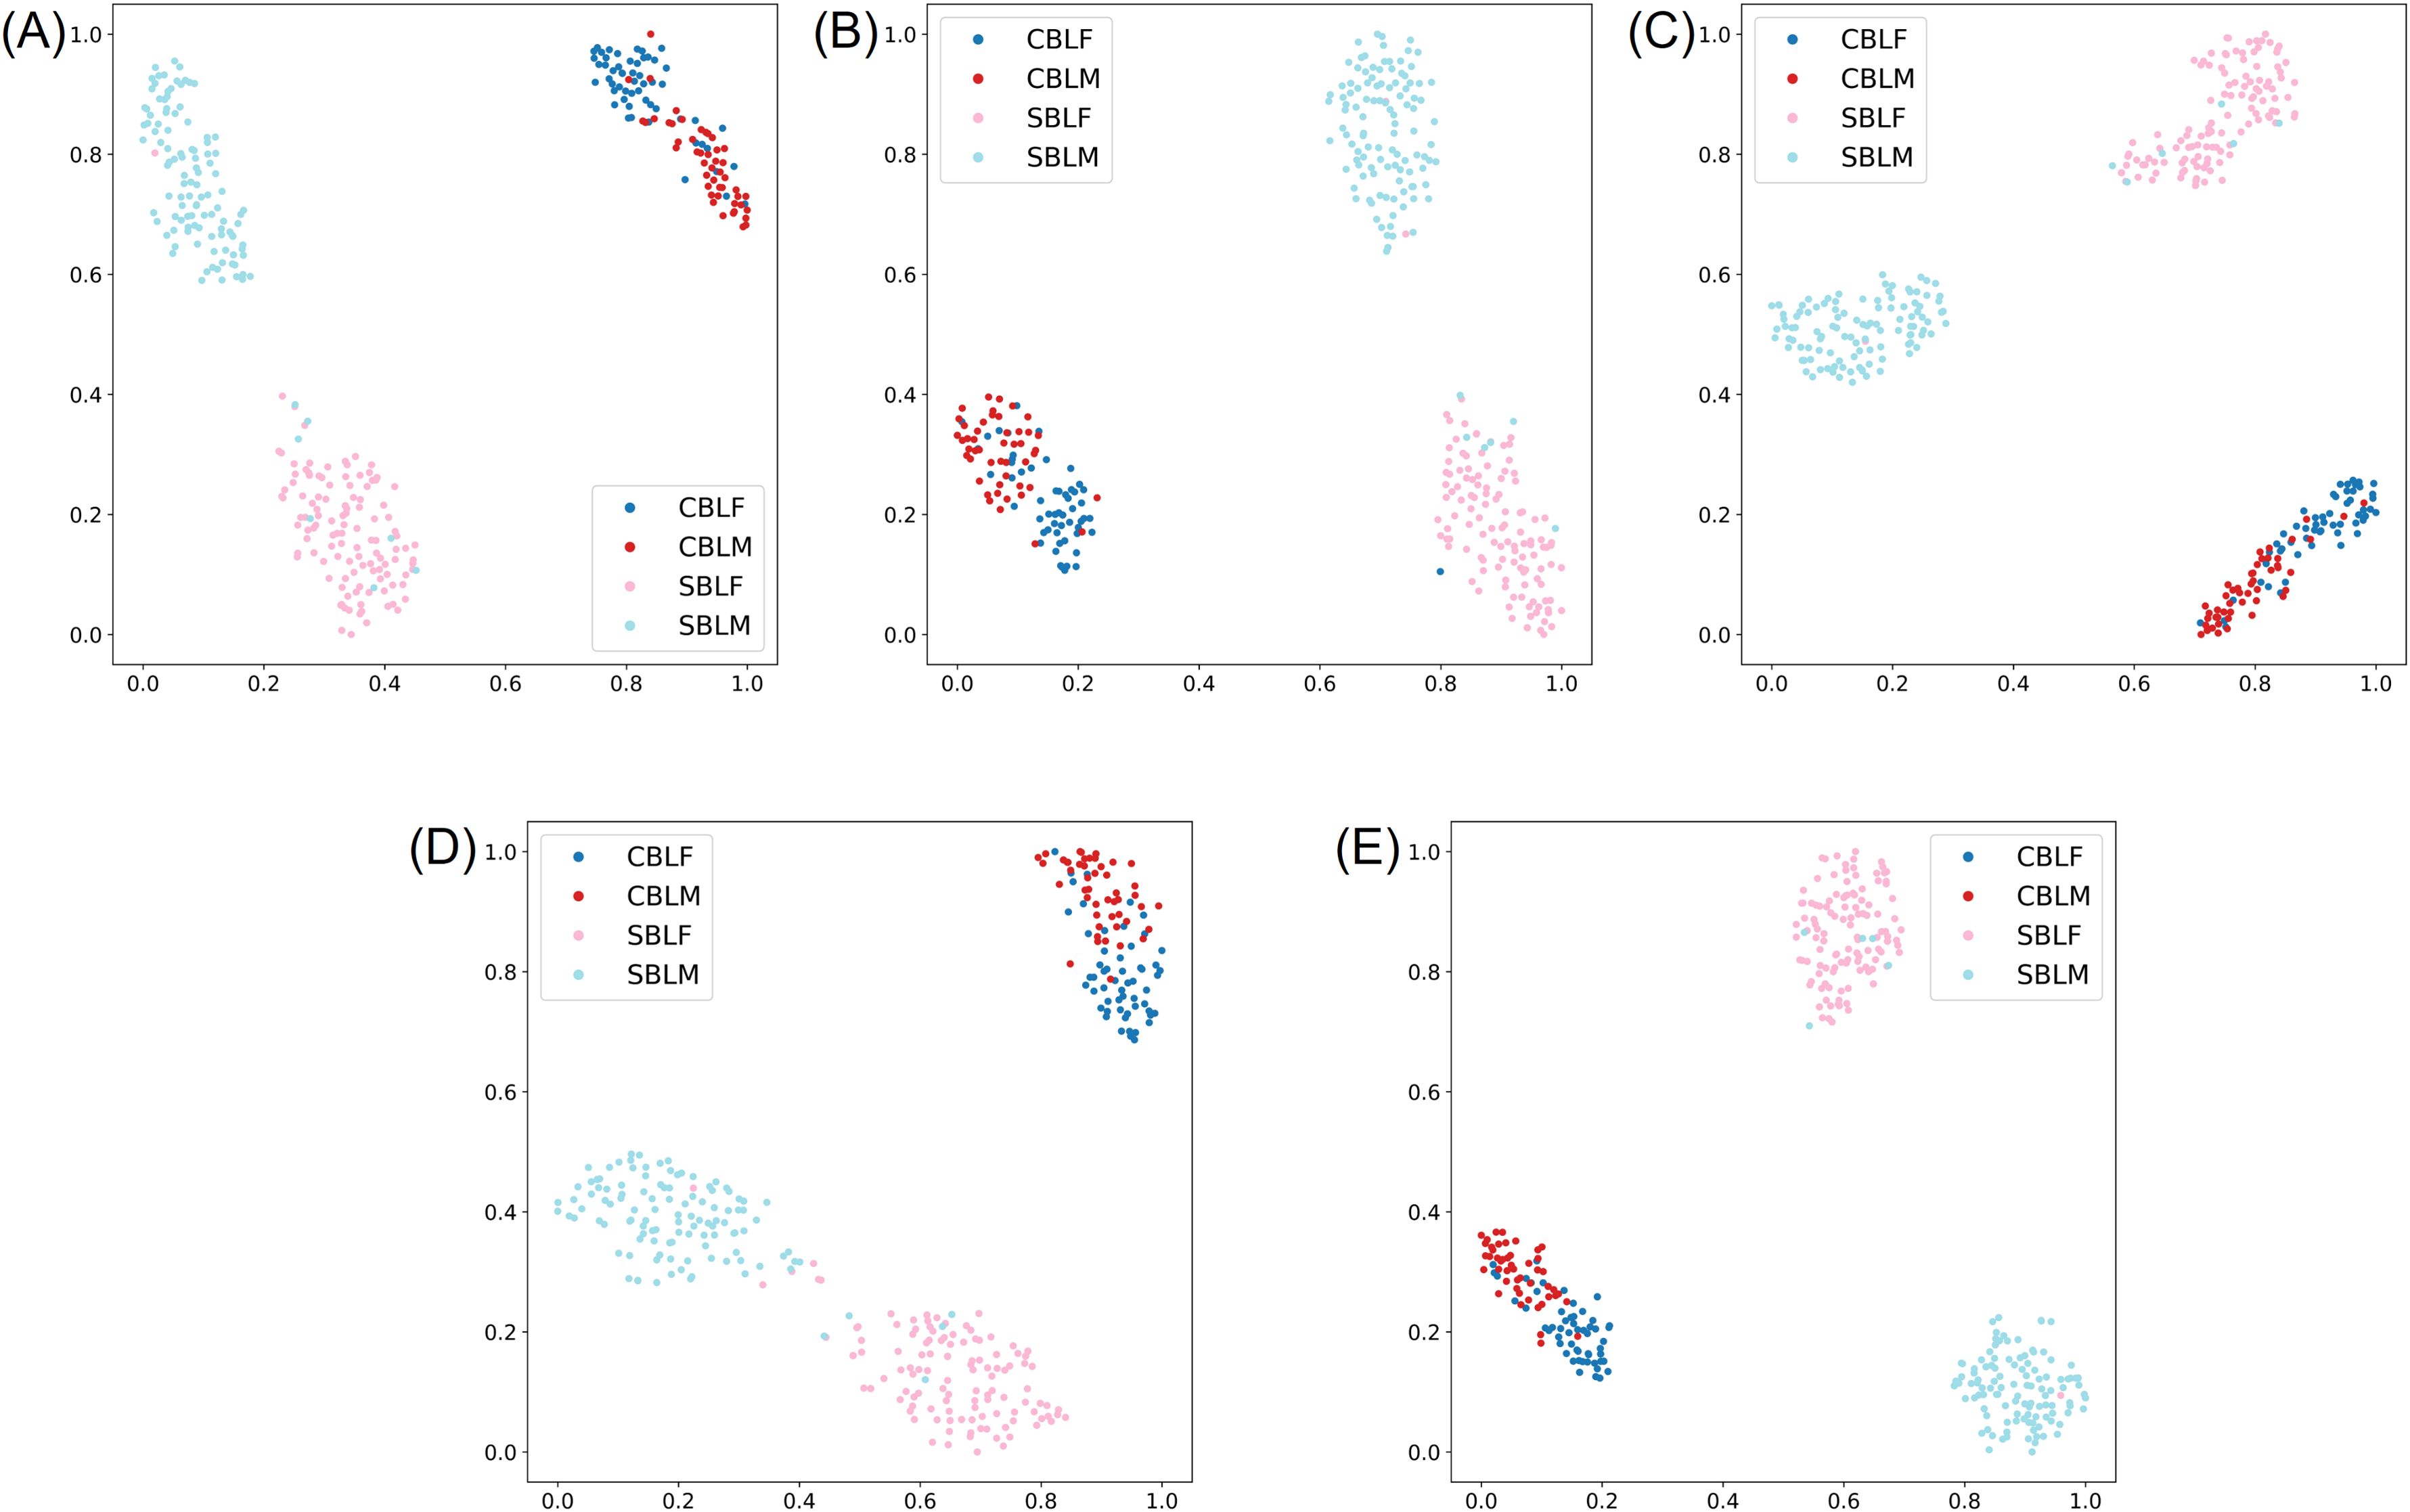
Figure 7. t-SNE visualization of the learned representation from the testing subset of the lab dataset for the species-sex classification experiment, where the four classes correspond to male (-M) and female (-F) Chrysodeixis includens (SBL) and Trichoplusia ni (CBL). (A-E) represent embeddings learned from deep learning models of ResNet50, MobileNetv3, ShuffleNetv2, EfficientNetv2-B0 and YOLOv8s-cls, respectively.
The model generalization results on the field and noise datasets showed considerably lower performances than the results of the testing subset of the lab dataset (Table 3). On the field dataset, YOLOv8s-cls outperformed the other four models with the highest Top-1 accuracy of 57.25%. The YOLOv8s-cls model had high accuracy for species prediction with only three incorrect predictions of field-collected SBL. However, it had a much lower accuracy for predicting sex, as the F1 score for female SBL was 20.44% and 70.83% for male SBL (Figure 8E). The other four models struggled to distinguish both species and sex (Figure 8). Model performance on the noise dataset was higher than the field dataset but still lower than the results of the testing subset of the lab dataset (Tables 3, 4). EfficientNetv2-B0 reached the highest Top-1 accuracy of 82.61% on the noise dataset, and ResNet50 had the lowest Top-1 accuracy of 56.52% (Supplementary Figure S4). On both generalization datasets, YOLOv8s-cls was the only model that retained a high accuracy in distinguishing species, despite the results of the concurrent sex prediction.
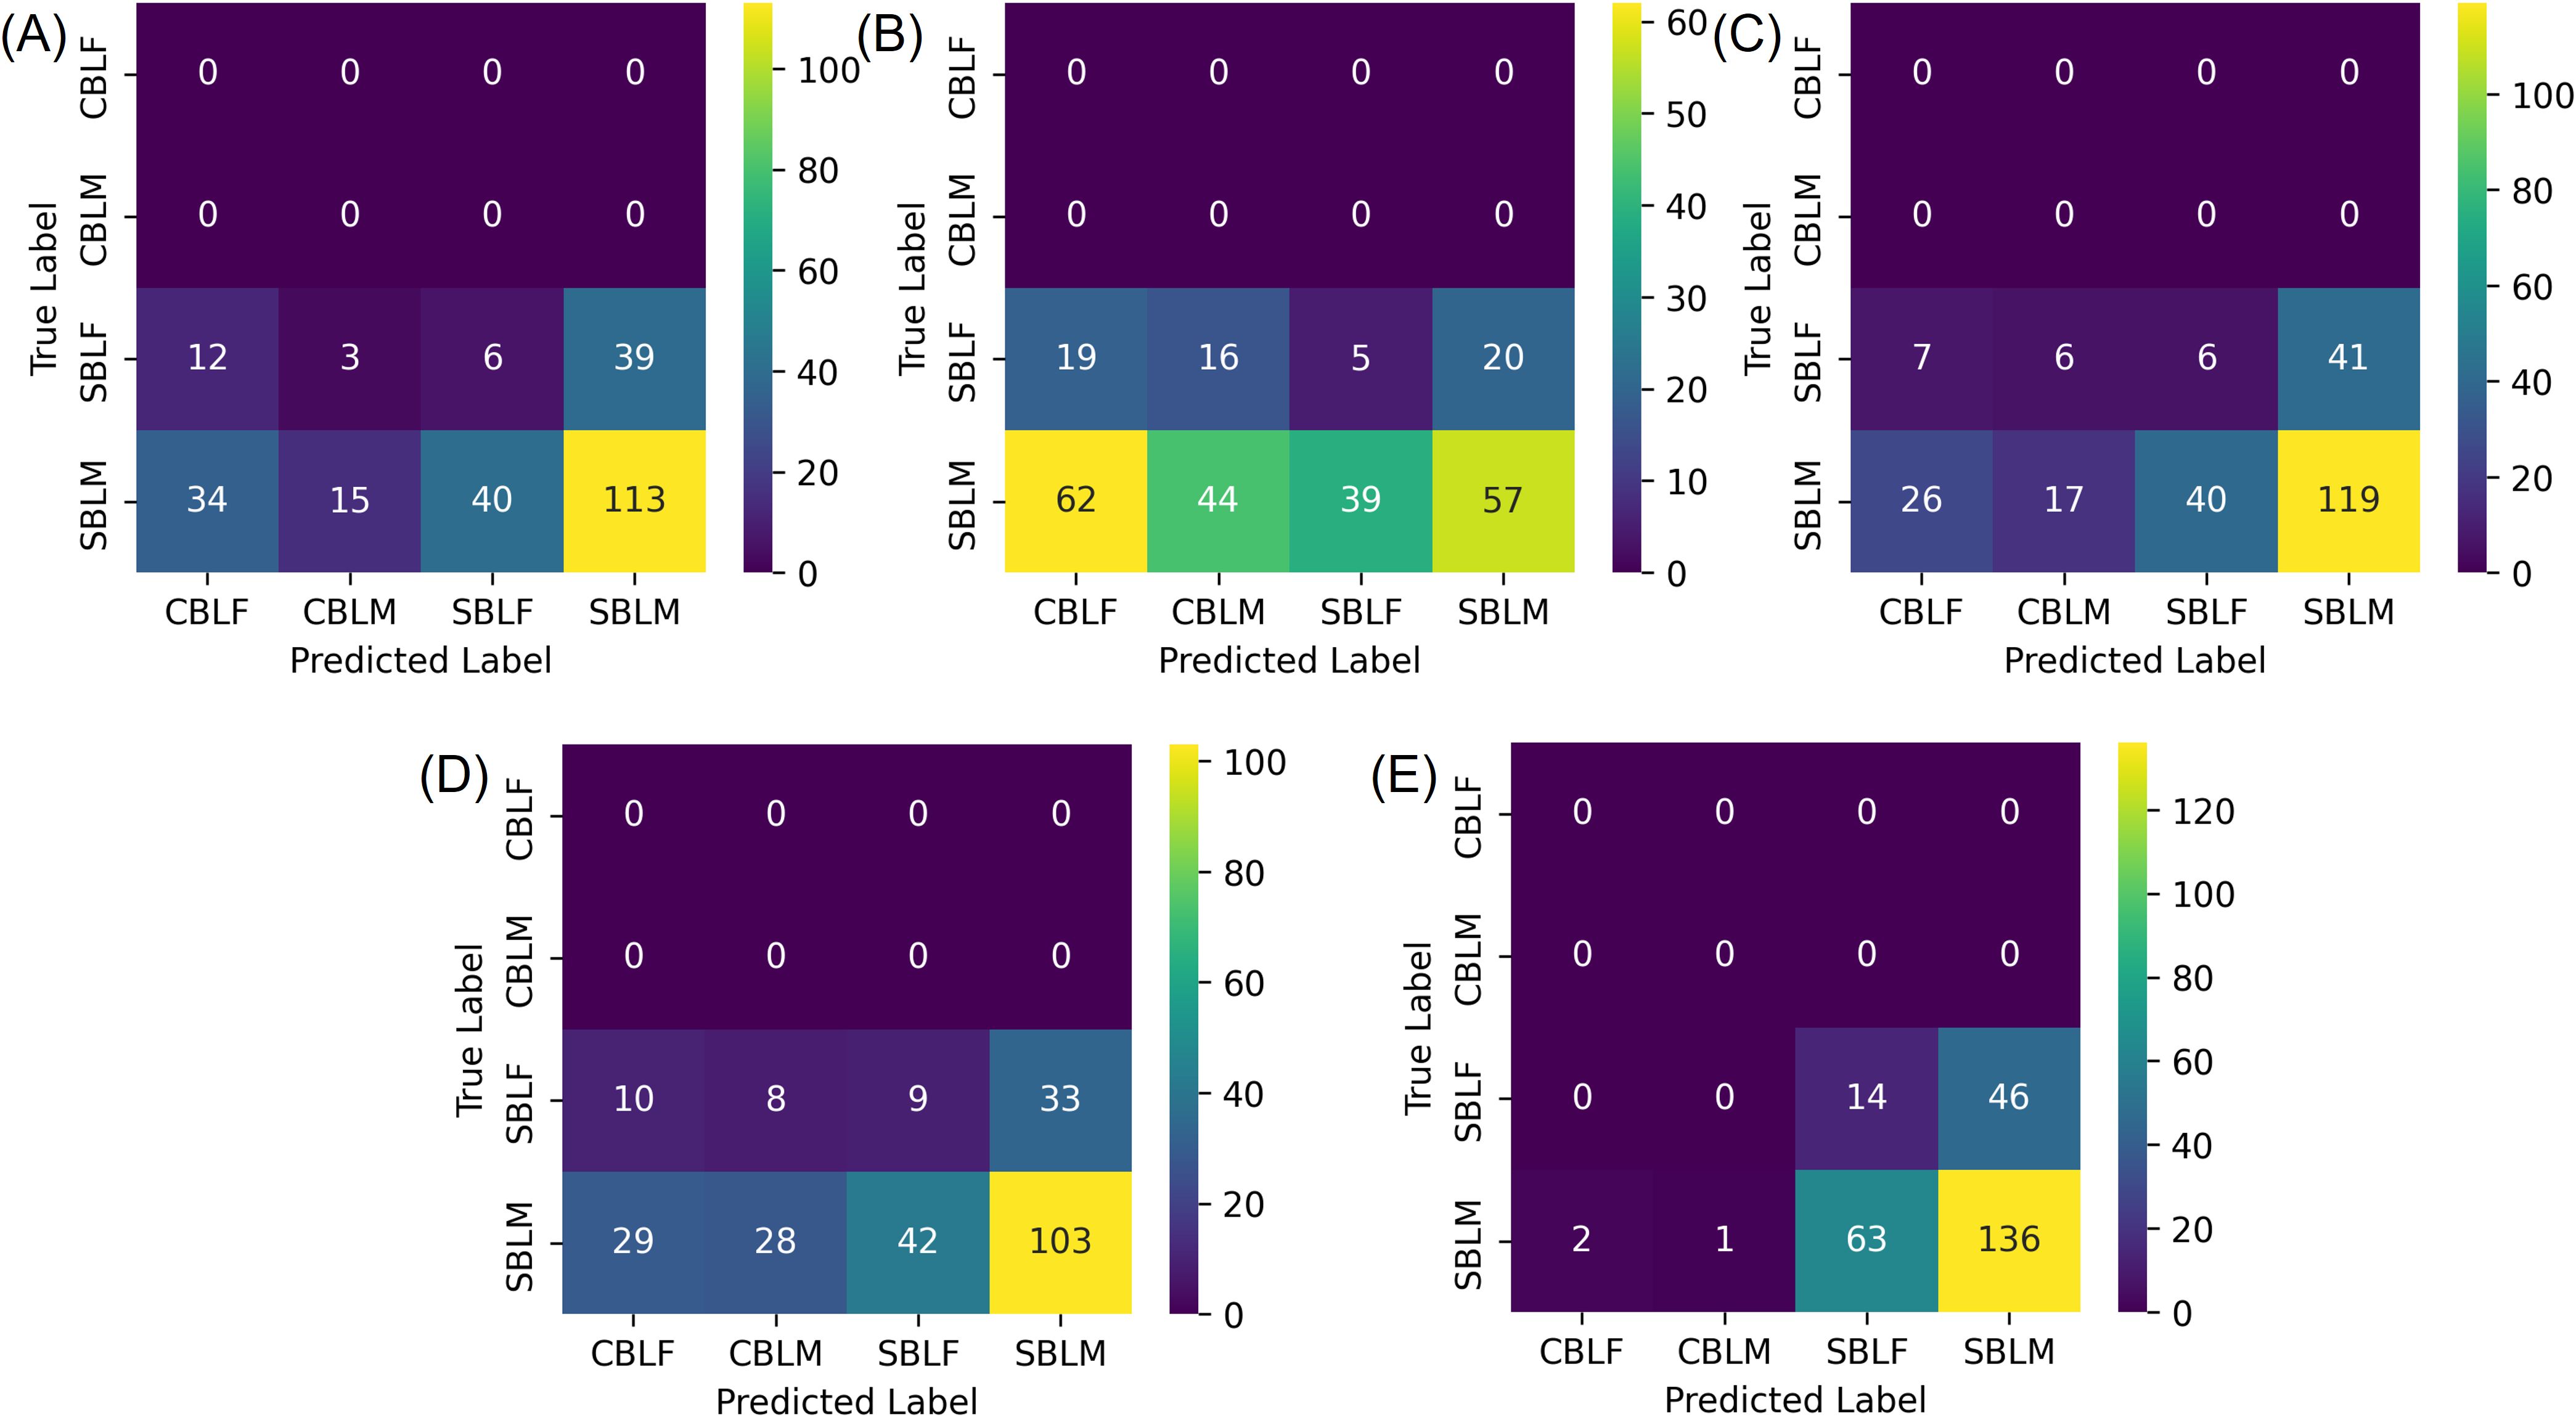
Figure 8. Confusion matrices of the field dataset for the species-sex classification experiment, where the four classes correspond to male (-M) and female (-F) Chrysodeixis includens (SBL) and Trichoplusia ni (CBL). (A-E) are classification results from deep learning models of ResNet50, MobileNetv3, ShuffleNetv2, EfficientNetv2-B0 and YOLOv8s-cls, respectively.
Because the EfficientNetv2-B0 and YOLOv8s-cls models had the highest performance results on the species-sex classification, the GradCAM feature maps from all testing datasets were examined. The feature maps of the EfficientNetv2-B0 model predictions from the testing subset of the lab dataset generally showed a strong influence of image artifacts for all predictions, particularly in male and female CBL predictions (Figure 9A). Correct SBL predictions were associated with more highlighted regions of the wing and less image artifacts. From the field dataset, correct predictions of male and female SBL showed the use of multiple regions of the wing, particularly along the inner margin towards the tornus and the basal and submarginal areas (Figure 9B). Misclassifications were almost always associated with the use of image artifacts highlighted on the feature maps, where 79.33% of the incorrect predictions on the field dataset were influenced by image artifacts. On the noise dataset, the feature maps highlighted much of the wing area for making correct predictions, but they also indicated the influence of image or insect artifacts (Figure 9C). Incorrect predictions were also strongly influenced by image artifacts.
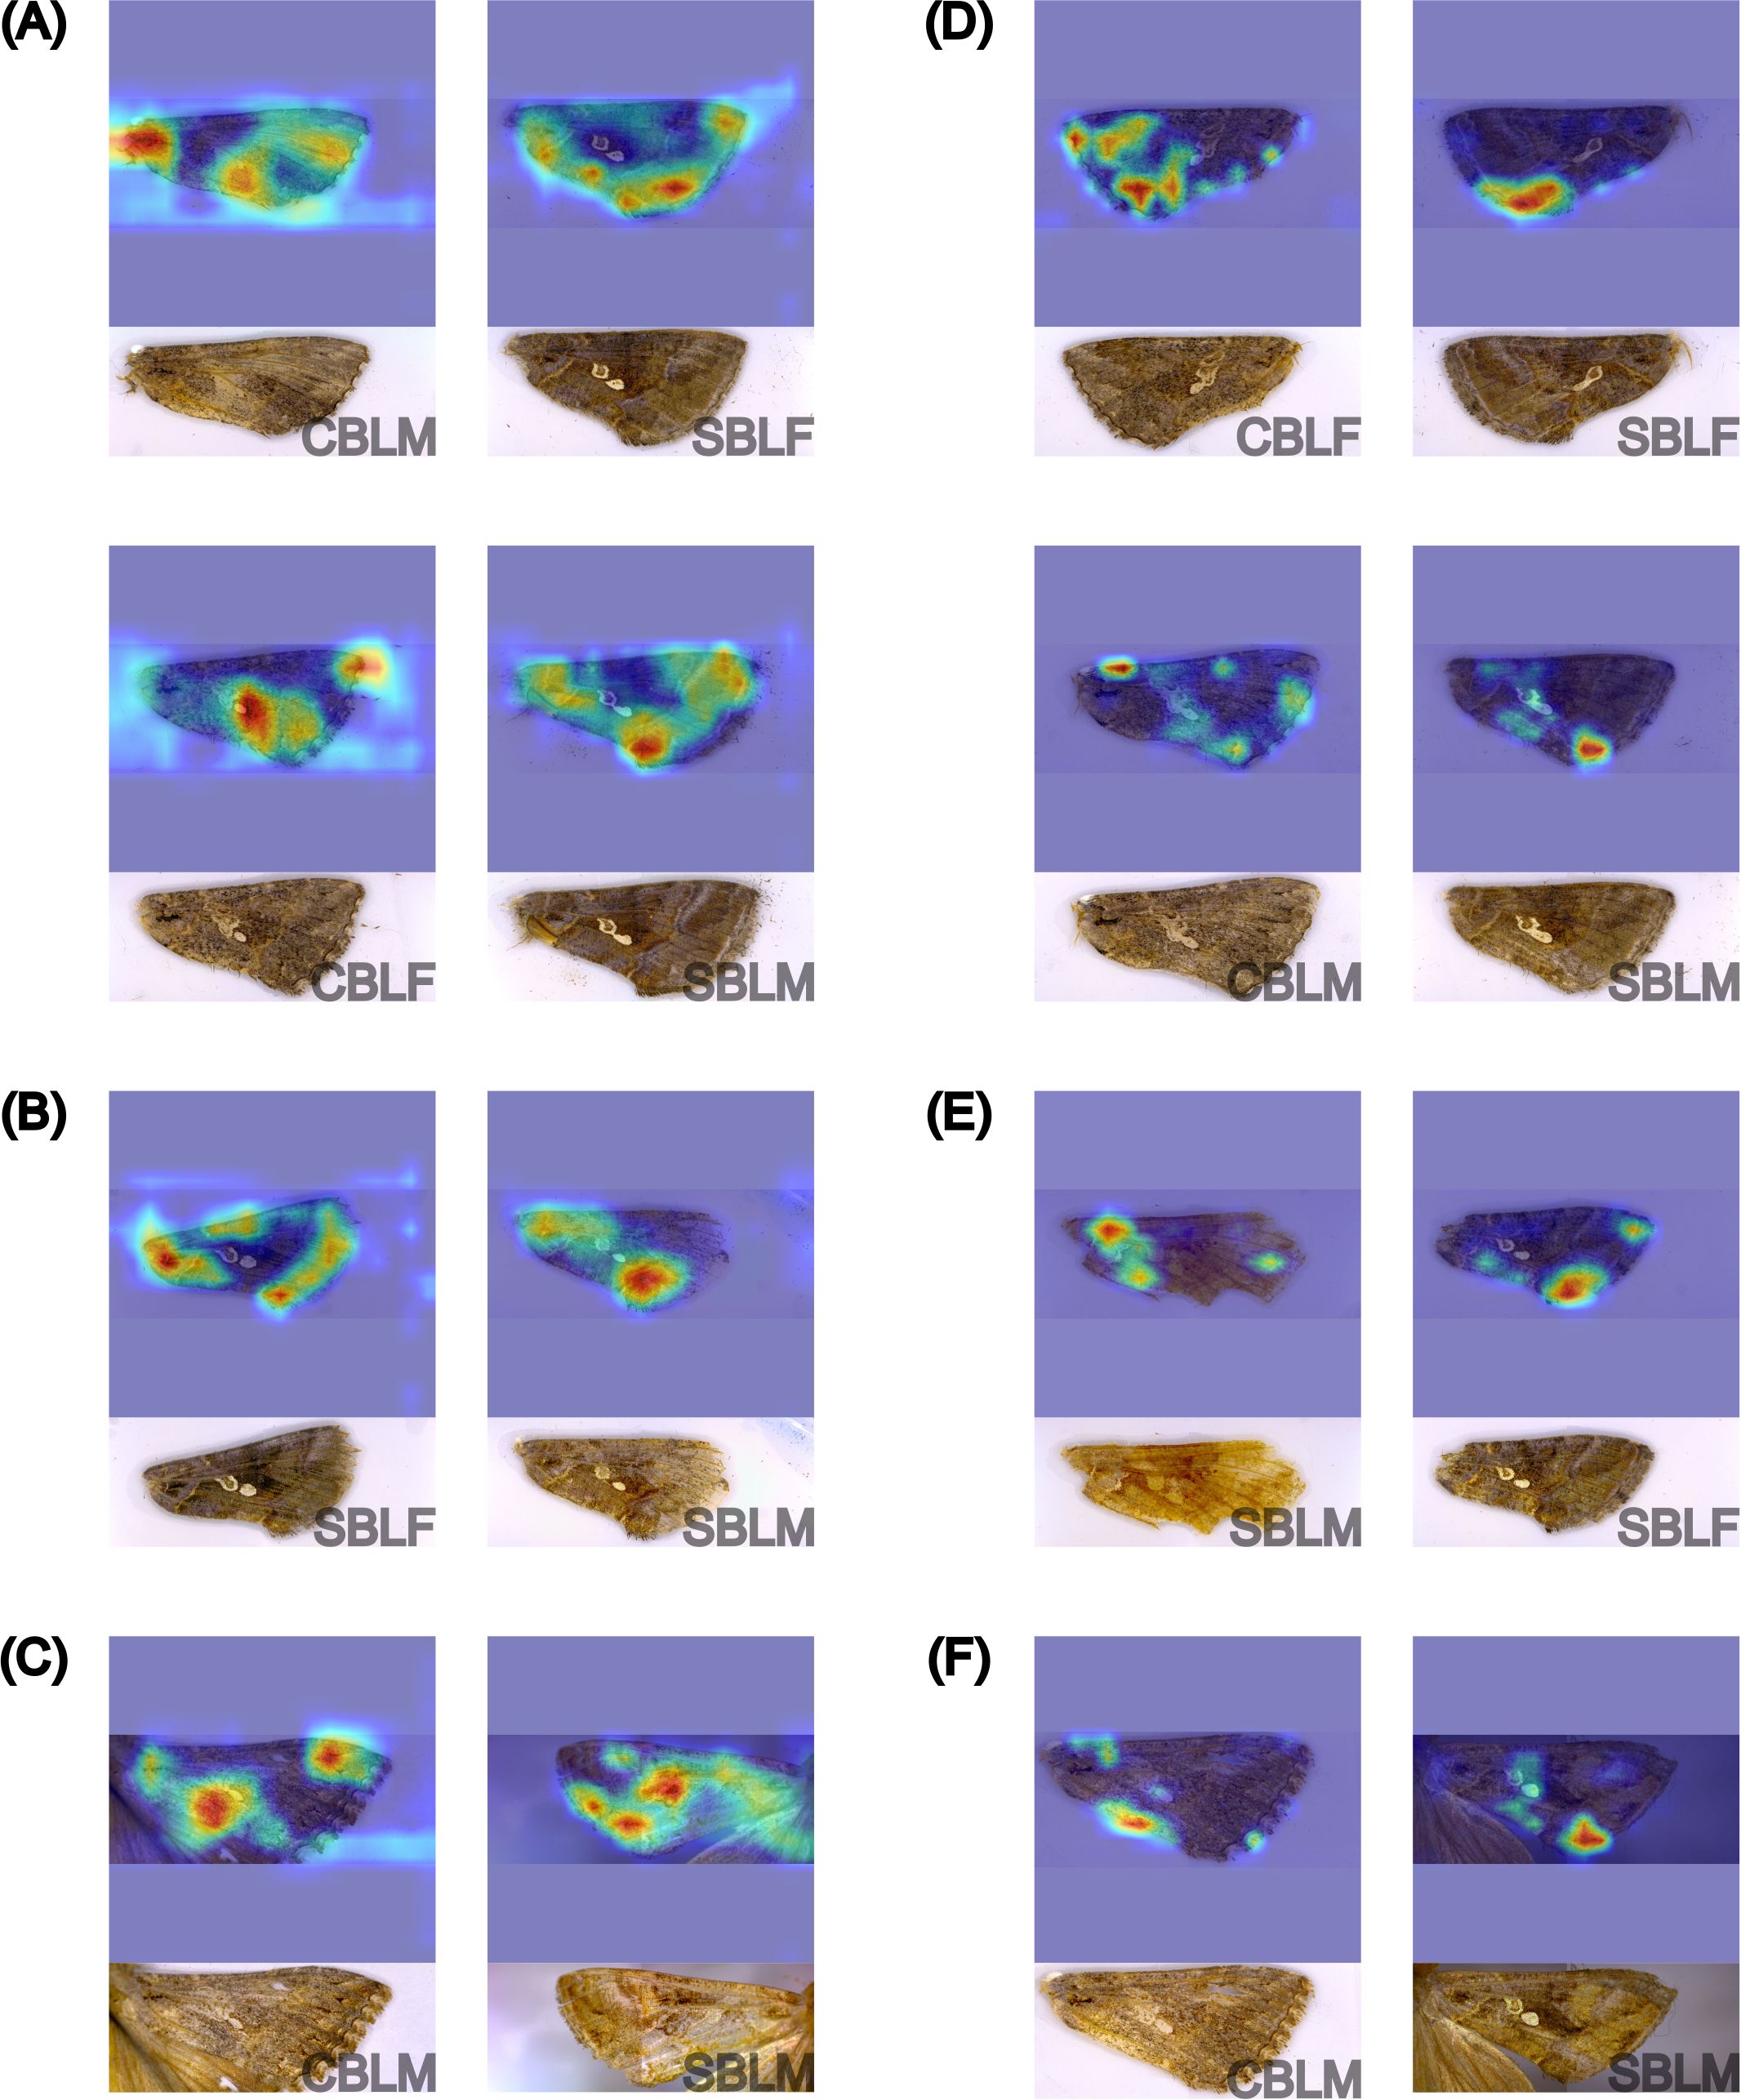
Figure 9. GradCAM visualization of the feature maps of sixteen different forewings from EfficientNetv8-B0 (A-C) and YOLOv8s-cls (D-F) model predictions in the species-sex classification experiment, including correct predictions of male (-M) and female (-F) Chrysodeixis includens (SBL-) and Trichoplusia ni (CBL-) from the testing subset of the lab dataset (A, D), field dataset (B, E), and noise dataset (C, F). The corresponding original image and specimen information (species and sex) are provided underneath each feature map. The heatmaps highlight the most influential features in warmer colors, with red indicating the highest influence.
On the lab dataset and both generalization datasets, YOLOv8s-cls did not rely heavily on image artifacts, unlike EfficientNetv2-B0. The YOLOv8s-cls model almost always relied on the tornus and occasionally the wing stigma and discal area for correct predictions of SBL and its respective sex (Figure 9). When the sex of SBL was misclassified, the features that the model used were not visually distinctive from the features used for the correct species-sex predictions. There were 118 total images misclassified due to sex misclassification of the two SBL classes (Figures 6E, 8E; Supplementary Figure S4E), and 19.49% of the incorrect predictions showed the influence of image artifacts in the feature maps. Image artifacts appeared to have little to no effect on correct SBL predictions for species-sex classification (i.e., the model did not use image artifacts on correct predictions of male and female SBL) (Figure 9D). The feature maps of the male CBL images from the noise dataset show that the model used different features for its predictions compared to the features used in SBL predictions and in correct CBL-sex predictions. Correct male CBL predictions focused on regions of the inner margin and costa (Figure 9), whereas incorrect predictions used the tornus, apex, and image artifacts.
3.3 Model performance on three-species classification
In the three-species classification experiment, the results of the testing subset of the lab dataset revealed a high accuracy for distinguishing the three species, even with a smaller training dataset for GLM. Specifically, the F1 score and Top-1 accuracy of ResNet, MobileNetv3, EfficientNetv2-B0, and YOLOv8s-cls was 100.00%, and ShuffleNet had only one incorrect prediction with an F1 score and Top-1 accuracy over 99.51% (Tables 3, 4; Supplementary Figure S5). The t-SNE visualization of the embedding space of each model showed three distinct clusters of species (Figure 10), where the cluster of GLM was associated closer to the clusters of CBL or SBL depending on the model.
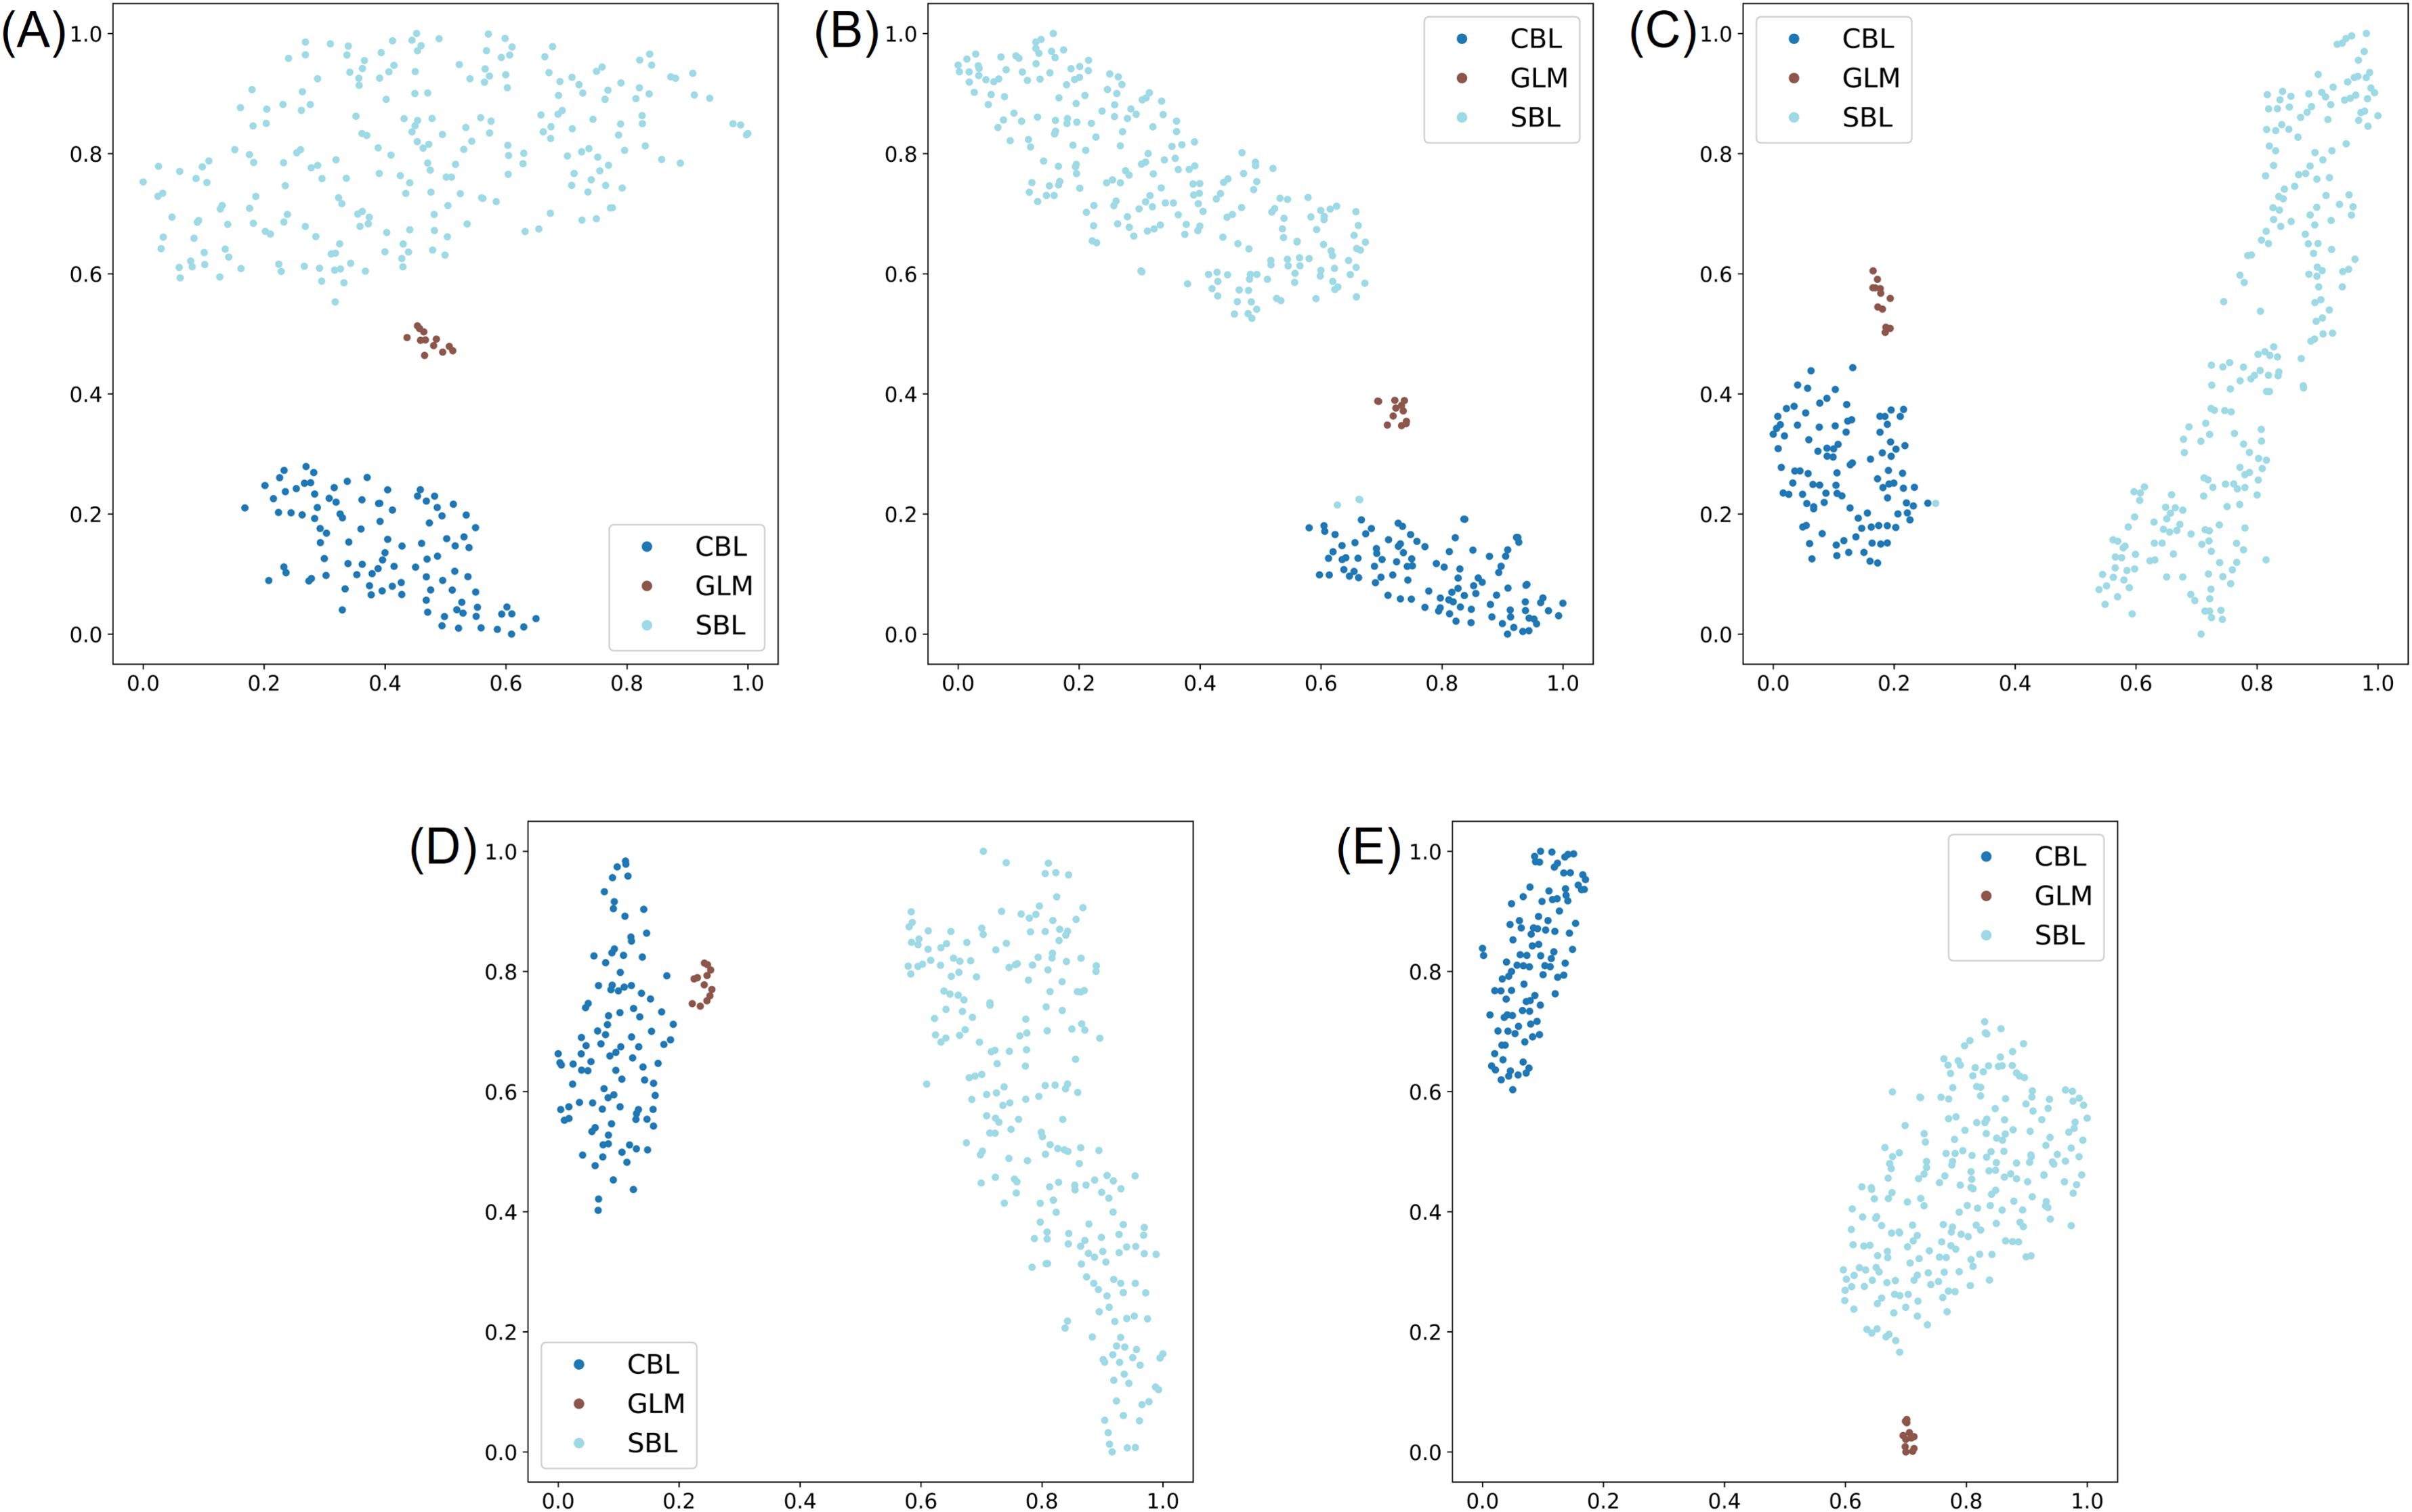
Figure 10. t-SNE visualization of the learned representation from the testing subset of the lab dataset for the three-species classification experiment, where the three classes correspond to Chrysodeixis includens (SBL), Rachiplusia ou (GLM), and Trichoplusia ni (CBL). (A-E) represent embeddings learned from the deep learning models of ResNet50, MobileNetv3, ShuffleNetv2, EfficientNetv2-B0 and YOLOv8s-cls, respectively.
The five models were further tested on the field and noise datasets to evaluate model generalization. On the field dataset, the results showed that ShuffleNetv2 and EfficientNetv2-B0 performed the highest among all five models with an F1 score and Top-1 accuracy of 96.65% and 93.51%, respectively (Tables 3, 4). Most models tended to predict SBL as GLM, especially YOLOv8s-cls (Supplementary Figure S6). This result was correlated with the t-SNE visualization that showed the relative clusters of each species (Figure 10). The models with higher accuracy on the field dataset, like ShuffleNetv2 (Figure 10C) and EfficientNetv2-B0 (Figure 10D), had clusters of GLM that were distinct from SBL clusters and more closely associated with CBL. On the noise dataset, the model performances generally decreased, and EfficientNetv2-B0 maintained the highest Top-1 accuracy of 82.22% and highest F1 scores on each class (Tables 3, 4; Supplementary Figure S7).
The GradCAM feature maps for image predictions by the EfficientNetv2-B0 and YOLOv8s-cls models were examined because EfficientNetv2-B0 had the highest performance in the three-species classification experiment and YOLOv8s-cls had the highest performance in the two previous classification experiments. For both models, the feature maps of all three testing datasets revealed a high influence of image artifacts on most species predictions (Figure 11). Feature maps from the EfficientNetv2-B0 model showed that predictions of SBL and GLM used indistinct wing features and few image artifacts, while CBL predictions primarily used only image artifacts (Figure 11A). Despite the high accuracy of EfficientNetv2-B0 in the three-species classification experiment, image artifacts contributed to both the correct and incorrect model predictions. Similarly, the feature maps of the lab and field dataset for the YOLOv8s-cls model displayed the influence of image artifacts in the correct predictions of SBL and CBL. Wing features were highlighted more in the noise dataset predictions (Figure 11E) compared to the field dataset (Figure 11F). This result was reflected in the accuracy results, as the YOLOv8s-cls model had a higher Top-1 accuracy on the noise dataset relative to the field dataset (Table 3).
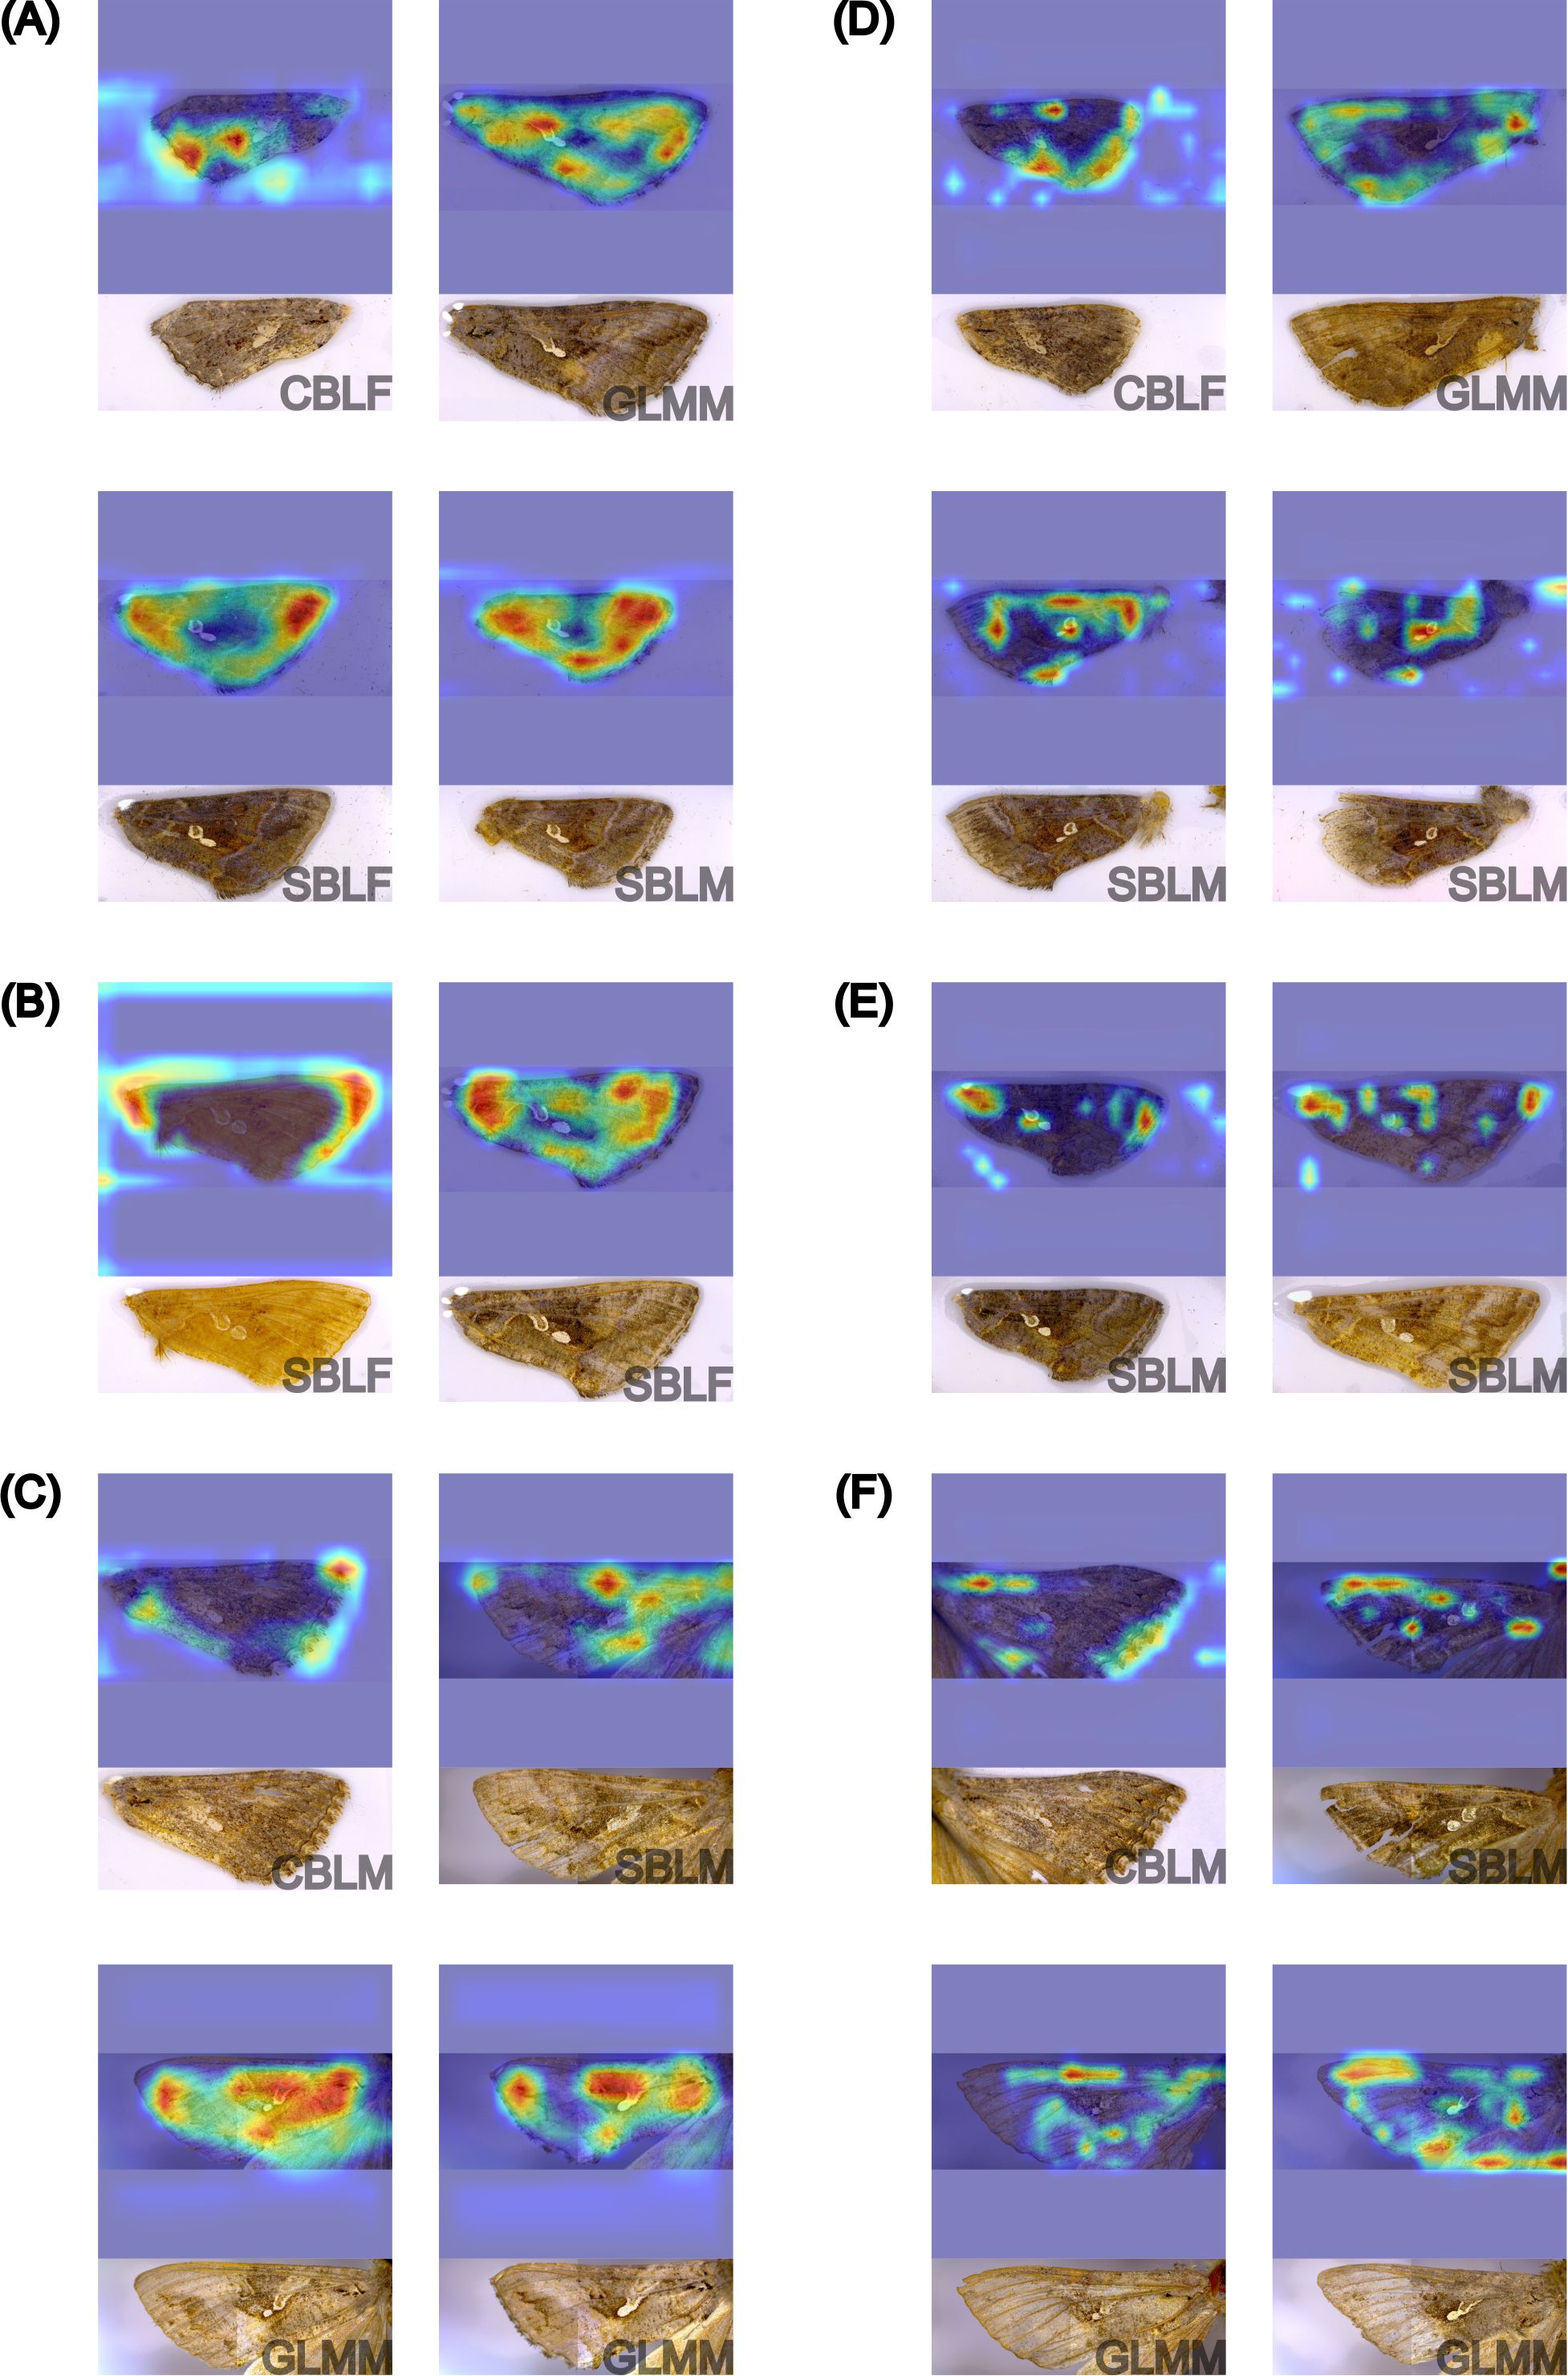
Figure 11. GradCAM visualization of the feature maps of sixteen different forewings from EfficientNetv8-B0 (A-C) and YOLOv8s-cls (D-F) model predictions in the three-species classification experiment, including correct predictions of Chrysodeixis includens (SBL), Trichoplusia ni (CBL), and Rachiplusia ou (GLM) from the testing subset of the lab dataset (A, D), field dataset (B, E), and noise dataset (C, F). The corresponding original image and specimen information (species and sex) are provided underneath each feature map. Sex was not considered in this analysis. The heatmaps highlight the most influential features in warmer colors, with red indicating the highest influence.
4 Discussion
In this study, deep learning models demonstrated promising performances on the classification of three economic plusiine pests, SBL, CBL, and GLM, using fine-scale differences in wing pattern morphology. Pest detection and identification have been at the forefront of entomological applications of deep learning methods (Høye et al., 2021; Li et al., 2021; Teixeira et al., 2023). Deep learning-based CNNs have the capacity to recognize and distinguish features in images, making them a promising tool for classification tasks in pest identification and monitoring in IPM programs (Kasinathan et al., 2021; Korsch et al., 2021; Ullah et al., 2022; Qin et al., 2024). In Lepidoptera specifically, the wings are well-suited as features for deep learning tasks due to their large size relative to the insect, ease of image acquisition as a two-dimensional feature, and unique wing pattern morphology (Feng et al., 2016; Chang et al., 2017). While deep learning applications are robust tools for classifying the large diversity of Lepidoptera (Chang et al., 2017; Böhlke et al., 2021; Xi et al., 2022), deep learning models are also capable of separating visually similar objects, including cryptic and morphologically similar species (Böhlke et al., 2021; Nolte et al., 2024; Qin et al., 2024; Spiesman et al., 2024). This type of classification task, known as fine-grained classification, has not been well-explored on morphologically similar lepidopteran adults for pest monitoring and survey programs, though it has received attention for the study of pests on a broader scale (Li et al., 2022; Zhang et al., 2022; Xu et al., 2024). This study introduces an efficient identification method for SBL and CBL, two predominant pests in agroecosystems across several regions in the Americas that share similar wing patterns and close phenology of flight (Shaw et al., 2021), overcoming plusiine identification challenges. Using deep learning models and explainable AI techniques, our study provides a foundation for future applications of automated pest identification in IPM programs.
The two-species classification experiment found that the five models distinguished SBL and CBL with extremely high accuracy (>99%) on the lab dataset, and three models continued to perform well and generalize to the field (>94% accuracy) and noise datasets (>86% accuracy). Overall, the YOLOv8 model demonstrated the highest performance and generalization ability across the three datasets. The lightweight MobileNetv3 model had low accuracy results on the generalization datasets (<53%) and feature maps that highlighted image artifacts, suggesting that this model was overfitted to the lab dataset. The fewer parameters in MobileNetv3 may have contributed to its lower performance relative to the other four models. The GradCAM visualizations of the feature maps in this experiment were valuable in understanding which features the model used to make its predictions. Interestingly, the YOLOv8s-cls feature maps for both species did not often use the discal area or wing stigma for classification. We hypothesized that these regions were used in earlier prediction stages because GradCAM only displays the last convolutional layer for final classification decisions. The feature maps from correct CBL and SBL predictions demonstrated the use of the basal area of the wing, where the basal line tends to be more prominent and clearly defined in SBL wings. A short black basal dash is also present in CBL but not in SBL wings. In the submarginal area, CBL has a discontinuous band of white scales that is not present in SBL. The features used for SBL predictions may be related to an overall subtle difference in wing pattern characteristics between SBL and CBL. Lafontaine and Poole (1991) had ambiguously described CBL wings as having a “grizzled appearance” caused by scattered black scales on a sandy-gray colored pattern. This trait tends to be reduced in SBL due to the general golden-brown color of SBL wings, particularly in the regions that are highlighted by the SBL feature maps. Despite the feature map interpretations described in this study, it is possible that the model used other features that are not easily discernable by the naked eye. The GradCAM visualizations and interpretations contribute hypothesized explanations to the wing features recognized by the model and offer useful context of CBL and SBL wing pattern morphology as an identification aid to current taxonomic descriptions.
The species-sex classification experiment showed that only the YOLOv8s-cls model could simultaneously predict the species and sex of SBL and CBL. Overall, classification performance on SBL was slightly higher than CBL, likely due to the larger number of training images for SBL. On the lab dataset, the five models maintained high accuracy (>90%), but the performance decreased considerably on the field and noise datasets. The loss of accuracy could be attributable to the quality of specimens in the two generalization datasets, indicating that species-sex classification relies on very fine differences in wing pattern morphology. However, the GradCAM feature maps of the EfficientNetv2-B0 model showed a high influence of image artifacts associated with all predictions, suggesting that EfficientNetv2-B0 and the other low-performing models were overfit to the lab dataset. In the case of the YOLOv8s-cls model, it had the highest accuracy results on the lab and field datasets, and the feature maps indicated that the correct predictions were derived from wing pattern features and not random image artifacts. The accuracy results and verification of the feature maps reveal that the YOLOv8s-cls model found species-specific sexual dimorphic wing patterns in SBL and CBL. From the feature maps, it is visually unclear which features were used to make this distinction. There is no evidence or record of sexually dimorphic wing patterns in CBL or SBL, though this has been described in Rachiplusia and a few other plusiines (Kitching, 1987).
Other studies have explored the ability of deep learning and machine learning models to distinguish insect species and sex (Tuda and Luna-Maldonado, 2020; Kittichai et al., 2021; Genaev et al., 2022). However, these studies were performed with whole insect specimens and species that exhibited dimorphism through traits like ovipositor presence, body size, and body color. Silva et al. (2025) described the potential of using deep learning models to diagnose monomorphic species as sexually dimorphic. This application of deep learning has not been applied in entomology until recently, as in this study and Nawoya et al. (2025), where they used deep learning models to separate the sex of monomorphic black soldier fly larvae. The studies that have explored this ability of deep learning models reported similar accuracies as this study that are higher than 50% (Wang et al., 2019; Nawoya et al., 2025; Silva et al., 2025). This finding of sexual dimorphism in SBL and CBL wing patterns highlights the potential of deep learning techniques to improve insect identification.
In the three-species classification experiment, adding GLM provided insights into model performance on an imbalanced training dataset. The models had high accuracy scores (>99%) on the combined lab and field dataset and lower performance on the generalization datasets (52-93%), similar to the results when classifying SBL and CBL in the two-species classification experiment. However, the feature maps of YOLOv8s-cls and EfficientNetv2-B0 predictions displayed a high influence of image artifacts on the species predictions. The EfficientNetv2-B0 model demonstrated the ability to separate at least two species, GLM and SBL, but not all predictions were based solely on wing features. Overall, the model performances suggest that none of the models learned to distinguish wing pattern features across all three species. The imbalanced data, with a limited amount of training data for GLM, likely contributed to model overfitting. These results indicate that larger training datasets (>1,000 images) are necessary for the fine-grained classification of plusiine wings when included in deep learning studies. Increasing the number of training images for GLM relative to the other classes could improve model performance and generalization, as observed in the two-species classification experiment. However, it is noteworthy that this species has a relatively minor occurrence in cultivated systems of soybean and other host plants.
In each classification experiment, the five models demonstrated a high performance on the lab dataset used for training and testing, and the performance decreased when model generalization was evaluated on the field and noise datasets. The loss in accuracy on the field and noise testing sets was expected because these datasets were assembled to differ in specimen quality from the data for model training. The models were not optimized for high performance because the objective was to determine whether deep learning models could distinguish the similar wing pattern morphology of plusiines. The models were trained on specimens in ideal conditions, where the wing and scales were not damaged, obscured, or missing. The field dataset maintained the same image standardization as the training data, but the wing quality was more representative of specimens recovered from field trapping. Field-collected specimens likely incurred discoloration or damage to the wing or scales from the trapping process and the storage, freezing, and drying process (Park et al., 2020; Kittichai et al., 2021). Similarly, the age of the collected specimen can impact the quality of the wing scales and the overall integrity of the wing. The noise dataset differs from the other two datasets because it has images of pinned specimens. The same image magnification was used, but the specimens were collected from the field and remained intact (i.e., forewings were not removed). The three-dimensional nature of the specimen and the presence of other insect parts influenced the quality of the image and background colors, creating additional challenges for model predictions. By the progression of specimen and image quality using the three datasets and verification with GradCAM visualizations, the YOLOv8s-cls model was robust in generalizing to new images in the two-species and species-sex classification experiments, and it used wing characteristics to make predictions and not random artifacts caused by the imaging process.
The models investigated in this study can potentially increase the applicability of pheromone trapping for detecting infestations of SBL and CBL. Pheromone traps for detecting plusiine pests, such as SBL, are challenging because of the non-specificity of sex pheromone formulations (Huseth et al., 2021; Debnath et al., 2024). Still, pheromone traps have the benefit of detecting initial pest infestations. This is particularly effective for SBL, as it is challenging to manage once established due to its larval feeding behavior and resistance to multiple insecticides (Catchot et al., 2016; Reisig and Goldsworthy, 2024). The deep learning models in this study offer an efficient alternative to current identification methods because they can be used independently with ease and produce reliable predictions in a matter of seconds, requiring only an image of the forewing. For applying the models to pest detection using sex pheromone lures, the context of the species included in the model is an important consideration. This study focused on SBL, CBL, and GLM primarily due to their high morphologic similarity and phenology of occurrence in cultivated systems. In addition, reports of cross-attraction of high abundance of C. oxygramma moths represent a concern for management decisions (Shaw et al., 2021). Although C. oxygramma is easily distinguished by the forewing patterns, the current models cannot predict beyond the defined classes. Future research for practical applications of the models should consider including C. oxygramma, allowing the model to differentiate between all commonly trapped plusiine species in the U.S (Eichlin and Cunningham, 1978; Lafontaine and Poole, 1991; Pogue, 2005; Shaw et al., 2021). In addition, due to the quarantine risk of the invasive C. chalcites and the potential of pheromone trapping to detect low-density populations (Witzgall et al., 2010), studies should consider including this species in model classification tasks to improve pest survey programs.
Although the models effectively distinguish SBL, CBL, and, to some extent, GLM, the image acquisition process is highly standardized. The process requires a specialized imaging system and associated workflow for the standardization of images, which limits the operation to one person capturing one image sample at a time. The tradeoff between image standardization and model accuracy is a well-known challenge in deep learning studies. When applying models to different domains, such as images taken with a smartphone, this challenge can be particularly evident (Schneider et al., 2023). Here, the specialized imaging process was important for evaluating the ability of the models to detect a difference in wing pattern morphology. However, the performance of the models beyond this standardization is unknown. Future studies should validate whether the models in this study can generalize to images taken at different resolutions or by other devices. Nolte et al. (2024) specifically explored the use of multiple image-capture devices on mosquito wing classification and found that their models struggled to accurately classify images taken by devices that differed from the device used in the training data. Image magnification and resolution should also be considered when using multiple devices because a model trained on high-magnified images can predict poorly on lesser-magnified images due to the loss of features important to the model (Kittichai et al., 2021; Nolte et al., 2024). In the case of the fine-grained wing morphology classification task, it is unclear what level of magnification is required for accurate classification. The present study is the first to explore SBL and CBL identification based on wing patterns with reliable accuracy at a high magnification. The challenges associated with the image acquisition process by incorporating multiple image-capturing devices and exploring different magnification levels of the wing patterns represent one of the next steps to be addressed to reduce standardization and increase the variability of image quality under field conditions.
5 Conclusion
This study explored the use of five deep learning models on the identification of economic pests SBL, CBL, and GLM based on their morphologic forewing patterns. It is the first study validating wing patterns as a diagnostic trait for pest identification in the Plusiinae subfamily. In the two-species classification, three of the five models demonstrated robust performances on the identification and generalization of CBL and SBL wings. The results of the species-sex classification revealed sexually dimorphic wing patterns of both CBL and SBL. Based on the GradCAM visualizations, only the YOLOv8s-cls model simultaneously classified the species and sex of the plusiines using the wing pattern features. The sexual dimorphism identified by the model is a novel discovery not only for the species themselves but also for the potential of deep learning techniques for other entomological applications. The three-species classification that included GLM, SBL, and CBL showed similar performance to the two-species classification. However, the GradCAM feature maps indicated model overfitting that was likely caused by the class imbalance, where there was a smaller amount of training data for GLM. In the two-species and species-sex classification experiments, the YOLOv8s-cls model consistently achieved the highest performance by identifying distinguishable wing features for classification and reaching the highest accuracy scores compared to the other models. The deep learning models in this study provide an efficient alternative to current identification methods of moths from the Plusiinae subfamily, including genitalia dissections, DNA analyses, and morphometrics. Moreover, this study lays a foundation for future work in the automated identification of plusiines, particularly SBL in IPM programs. The findings of the study open the opportunity of using deep learning models to classify wing patterns in the group of Plusiinae, such as for identifying the invasive C. chalcites for survey programs. This study takes the first step to the widespread application of automated trapping for pest monitoring and detection in IPM programs for economic pests in the Plusiinae subfamily.
Data availability statement
The raw data supporting the conclusions of this article will be made available by the authors, without undue reservation.
Ethics statement
The manuscript presents research on animals that do not require ethical approval for their study.
Author contributions
KT: Formal analysis, Validation, Methodology, Data curation, Software, Conceptualization, Writing – original draft, Visualization, Investigation, Writing – review & editing. CT: Writing – original draft, Software, Visualization, Formal analysis, Conceptualization, Validation, Data curation, Writing – review & editing, Methodology, Investigation. KM: Data curation, Validation, Methodology, Writing – review & editing, Investigation. AS-P: Conceptualization, Validation, Writing – review & editing. RX: Formal analysis, Validation, Software, Writing – review & editing, Methodology, Investigation. CL: Conceptualization, Writing – review & editing, Validation, Investigation, Methodology, Supervision, Resources, Data curation. SP-M: Project administration, Methodology, Data curation, Supervision, Conceptualization, Writing – original draft, Writing – review & editing, Funding acquisition, Validation, Resources, Investigation.
Funding
The author(s) declare that financial support was received for the research and/or publication of this article. This work was supported by the U.S. Department of Agriculture (USDA) Animal and Plant Health Inspection Service (APHIS) funding awards: AP22PPQS&T00C139, AP23PPQS&T00C015, and AP21PPQS&T00C031; USDA Hatch and Hatch Multistate projects FLA-WFC-006203; FLA-WFC-006420, and 7009022.
Acknowledgments
The authors acknowledge UFIT Research Computing for providing computational resources and support that have contributed to the research results reported in this publication.
Conflict of interest
The authors declare that the research was conducted in the absence of any commercial or financial relationships that could be construed as a potential conflict of interest.
The author(s) declared that they were an editorial board member of Frontiers, at the time of submission. This had no impact on the peer review process and the final decision.
Generative AI statement
The author(s) declare that no Generative AI was used in the creation of this manuscript.
Publisher’s note
All claims expressed in this article are solely those of the authors and do not necessarily represent those of their affiliated organizations, or those of the publisher, the editors and the reviewers. Any product that may be evaluated in this article, or claim that may be made by its manufacturer, is not guaranteed or endorsed by the publisher.
Supplementary material
The Supplementary Material for this article can be found online at: https://www.frontiersin.org/articles/10.3389/fagro.2025.1602164/full#supplementary-material
References
Allen K. C., Little N. S., and Perera O. P. (2021). Temporal occurrence of plusiinae on soybean in the Mississippi river delta. J. Econ. Entomol. 114, 723–727. doi: 10.1093/jee/toaa308
Böhlke J., Korsch D., Bodesheim P., and Denzler J. (2021). “Exploiting web images for moth species classification,” in 2021 INFORMATIK. Bonn, Germany: Gesellschaft für Informatik. 481–498. Available at: https://dl.gi.de/handle/20.500.12116/37702 (Accessed December 18, 2024).
Boldt P. E., Biever K. D., and Ignoffo C. M. (1975). Lepidopteran pests of soybeans: consumption of soybean foliage and pods and development time. J. Econ. Entomol. 68, 480–482. doi: 10.1093/jee/68.4.480
Bortolotto O. C., Pomari-Fernandes A., de Freitas Bueno R. C. O., de Freitas Bueno A., da Cruz Y. K. S., Sanzovo A., et al. (2015). The use of soybean integrated pest management in Brazil: a review. Agron. Sci. Biotechnol. 1, 25–25. doi: 10.33158/ASB.2015v1i1p25
Carter E. T. and Gillett-Kaufman J. L. (2018). Soybean looper chrysodeixis includens (Walker) (Insecta: lepidoptera: noctuidae): EENY-695/IN1198, 11/2017. EDIS 2018 2018 (1). doi: 10.32473/edis-in1198-2017
Catchot A., Gore J., and Cook D. (2016). Diamide Insecticides and Soybean Looper Management (Mississippi State, Mississippi: Mississippi State University Extension). Available online at: https://www.mississippi-crops.com/2016/08/12/diamide-insecticides-and-soybean-looper-management/.
Chang Q., Qu H., Wu P., and Yi J. (2017). Fine-Grained Butterfly and Moth Classification Using Deep Convolutional Neural Networks (New Brunswick, New Jersey: Rutgers University). doi: 10.13140/RG.2.2.22642.84161
Debnath R., George J., Gautam M., Shafi I., Kariyat R., and Reddy G. V. P. (2024). Ecological interactions, host plant defenses, and control strategies in managing soybean looper, Chrysodeixis includens (Lepidoptera: Noctuidae). Front. Insect Sci. 4. doi: 10.3389/finsc.2024.1480940
Eichlin T. D. and Cunningham H. B. (Eds.) (1978). The Plusiinae (Lepidoptera: Noctuidae) of America North of Mexico, Emphasizing Genitalic and Larval Morphology (Washington, D.C.: U.S. Department of Agriculture, Technical Bulletin No. 1567), 122pp. doi: 10.22004/ag.econ.158098
Feng L., Bhanu B., and Heraty J. (2016). A software system for automated identification and retrieval of moth images based on wing attributes. Pattern Recogn. 51, 225–241. doi: 10.1016/j.patcog.2015.09.012
Genaev M. A., Komyshev E. G., Shishkina O. D., Adonyeva N. V., Karpova E. K., Gruntenko N. E., et al. (2022). Classification of fruit flies by gender in images using smartphones and the YOLOv4-tiny neural network. Mathematics 10, 295. doi: 10.3390/math10030295
Gotardi G. A., Batista N. R. F., Ishizuka T. K., Marques L. H., Dal Pogetto M. H., Sethi A., et al. (2024). A Novel Polymerase Chain Reaction (PCR)-Based Method for the Rapid Identification of Chrysodeixis includens and Rachiplusia nu. Insects 15, 969. doi: 10.3390/insects15120969
He K., Zhang X., Ren S., and Sun J. (2016). “Deep Residual Learning for Image Recognition,” in 2016 IEEE Conference on Computer Vision and Pattern Recognition (CVPR) (IEEE, Las Vegas, NV, USA), 770–778. doi: 10.1109/CVPR.2016.90
Hebert P. D. N., Penton E. H., Burns J. M., Janzen D. H., and Hallwachs W. (2004). Ten species in one: DNA barcoding reveals cryptic species in the neotropical skipper butterfly Astraptes fulgerator. Proc. Natl. Acad. Sci. 101, 14812–14817. doi: 10.1073/pnas.0406166101
Howard A., Sandler M., Chen B., Wang W., Chen L.-C., Tan M., et al. (2019). “Searching for MobileNetV3,” in 2019 IEEE/CVF International Conference on Computer Vision (ICCV) (IEEE, Seoul, South Korea), 1314–1324. doi: 10.1109/ICCV.2019.00140
Howard A. G., Zhu M., Chen B., Kalenichenko D., Wang W., Weyand T., et al. (2017). MobileNets: efficient convolutional neural networks for mobile vision applications. arXiv. arXiv: 1704.04861 1–9. doi: 10.48550/arXiv.1704.04861
Høye T. T., Ärje J., Bjerge K., Hansen O. L. P., Iosifidis A., Leese F., et al. (2021). Deep learning and computer vision will transform entomology. Proc. Natl. Acad. Sci. 118, e2002545117. doi: 10.1073/pnas.2002545117
Huseth A. S., Koch R. L., Reisig D., Davis J. A., Paula-Moraes S. V., and Hodgson E. W. (2021). Current distribution and population persistence of five lepidopteran pests in U.S. Soybean. J. Integr. Pest Manage. 12, 11. doi: 10.1093/jipm/pmab004
Jocher G., Qiu J., and Chaurasia A. (2023). Ultralytics YOLO (Version 8.0.0) (GitHub). Available online at: https://github.com/ultralytics/ultralytics.
Jones M. and Duckworth J. (2017). Flights of Gray Looper (Rachiplusia ou) (Noctuidae) and Soybean Looper (Chrysodeixis includens) (Noctuidae) in Southeast Missouri Soybean. Univers. J. Agric. Res. 5, 296–303. doi: 10.13189/ujar.2017.050507
Kasinathan T., Singaraju D., and Uyyala S. R. (2021). Insect classification and detection in field crops using modern machine learning techniques. Inf. Process. Agric. 8, 446–457. doi: 10.1016/j.inpa.2020.09.006
Kitching I. J. (1987). Spectacles and Silver Ys: a synthesis of the systematics, cladistics and biology of the Plusiinae (Lepidoptera: Noctuidae). Bull. Br. Mus. Nat. Hist. Entomol. 54, 75–261. Available online at: https://biostor.org/reference/113936 (Accessed December 18, 2024).
Kittichai V., Pengsakul T., Chumchuen K., Samung Y., Sriwichai P., Phatthamolrat N., et al. (2021). Deep learning approaches for challenging species and gender identification of mosquito vectors. Sci. Rep. 11, 4838. doi: 10.1038/s41598-021-84219-4
Korsch D., Bodesheim P., and Denzler J. (2021). “Deep Learning Pipeline for Automated Visual Moth Monitoring: Insect Localization and Species Classification,” in 2021 INFORMATIK (Gesellschaft für Informatik, Bonn, Germany). doi: 10.18420/informatik2021-036
Lafontaine J. D. and Poole R. W. (1991). “Noctuoidea, Noctuidae (part) - Plusiinae,” in The moths of America north of Mexico, vol. 177. (The Wedge Entomological Research Foundation, Washington).
Li W., Zheng T., Yang Z., Li M., Sun C., and Yang X. (2021). Classification and detection of insects from field images using deep learning for smart pest management: A systematic review. Ecol. Inform. 66, 101460. doi: 10.1016/j.ecoinf.2021.101460
Li M., Zhou G., Cai W., Li J., Li M., He M., et al. (2022). Multi-scale Sparse Network with Cross-Attention Mechanism for image-based butterflies fine-grained classification. Appl. Soft. Comput. 117, 108419. doi: 10.1016/j.asoc.2022.108419
Ma N., Zhang X., Zheng H.-T., and Sun J. (2018). “ShuffleNet V2: Practical Guidelines for Efficient CNN Architecture Design,” in Computer Vision – ECCV 2018 (Springer International Publishing, Munich, Germany), 122–138. doi: 10.1007/978-3-030-01264-9_8
Maaten L. and Hinton G. (2008). Visualizing Data using t-SNE. J. Mach. Learn. Res. 9, 2579–2605. Available at: https://www.jmlr.org/papers/v9/vandermaaten08a.html (Accessed October 24, 2024).
MacLeod N., Benfield M., and Culverhouse P. (2010). Time to automate identification. Nature 467, 154–155. doi: 10.1038/467154a
Madden M. J. L., Young R. G., Brown J. W., Miller S. E., Frewin A. J., and Hanner R. H. (2019). Using DNA barcoding to improve invasive pest identification at U.S. ports-of-entry. PloS One 14, e0222291. doi: 10.1371/journal.pone.0222291
Mitchell E. R., Chalfant R. B., Greene G. L., and Creighton C. S. (1975). Soybean looper: populations in Florida, Georgia, and South Carolina, as determined with pheromone-baited BL traps. J. Econ. Entomol. 68, 747–750. doi: 10.1093/jee/68.6.747
Musser F. R., Bick E., Brown S. A., Crow W. D., Davis J. A., DiFonzo C., et al. (2024). 2023 Soybean Insect Losses in the United States Vol. 17 (Mississippi State, Mississippi: Mississippi State University Midsouth Entomologist Report No. ISSN 1936-6019), 6–30.
Nawoya S., Geissmann Q., Karstoft H., Bjerge K., Akol R., Katumba A., et al. (2025). Prediction of black soldier fly larval sex and morphological traits using computer vision and deep learning. Smart Agric. Technol. 11, 100953. doi: 10.1016/j.atech.2025.100953
Nolte K., Sauer F. G., Baumbach J., Kollmannsberger P., Lins C., and Lühken R. (2024). Robust mosquito species identification from diverse body and wing images using deep learning. Parasitol. Vectors 17, 372. doi: 10.1186/s13071-024-06459-3
Park J., Kim D. I., Choi B., Kang W., and Kwon H. W. (2020). Classification and morphological analysis of vector mosquitoes using deep convolutional neural networks. Sci. Rep. 10, 1012. doi: 10.1038/s41598-020-57875-1
Pedigo L. P. and Buntin D. G. (1994). Handbook of Sampling Methods for Arthropods in Agriculture (Boca Raton, FL: CRC Press, 736).
Pedigo L. P. and Rice M. E. (2014). Entomology and Pest Management. Sixth Edition Vol. 784 (Long Grove, Illinois: Waveland Press).
Pogue M. G. (2005). The plusiinae (Lepidoptera: noctuidae) of great smoky mountains national park. Zootaxa 1032, 1–28. doi: 10.11646/zootaxa.1032.1.1
Qin W., Abbas A., Abbas S., Alam A., Chen D., Hafeez F., et al. (2024). Automated lepidopteran pest developmental stages classification via transfer learning framework. Environ. Entomol. 53, 1062–1077. doi: 10.1093/ee/nvae085
Reid J. C. and Greene G. L. (1973). The soybean looper: pupal weight, development time, and consumption of soybean foliage. Fla. Entomol. 56, 203–206. doi: 10.2307/3493125
Reisig D. (2015). Important Changes to Insecticide Recommendations for Soybean Loopers in the Blacklands (Raleigh, North Carolina: North Carolina State Extension). Available online at: https://soybeans.ces.ncsu.edu/2015/08/important-changes-to-insecticide-recommendations-for-soybean-loopers-in-the-blacklands/.
Reisig D. and Goldsworthy E. (2024). Efficacy of selected insecticides on soybean looper in soybean. Arthropod. Manage. Tests 49, tsae069. doi: 10.1093/amt/tsae069
Schneider S., Taylor G. W., Kremer S. C., and Fryxell J. M. (2023). Getting the bugs out of AI: Advancing ecological research on arthropods through computer vision. Ecol. Lett. 26, 1247–1258. doi: 10.1111/ele.14239
Selvaraju R. R., Cogswell M., Das A., Vedantam R., Parikh D., and Batra D. (2017). “Grad-CAM: Visual Explanations from Deep Networks via Gradient-Based Localization,” in 2017 IEEE International Conference on Computer Vision (ICCV) (IEEE, Venice, Italy), 618–626. doi: 10.1109/ICCV.2017.74
Shaw T. J., Paula-Moraes S. V., Hahn P. G., and Specht A. (2021). Seasonal flight patterns of chrysodeixis includens (Lepidoptera: noctuidae) in the Florida panhandle and inventory of plusiine species cross-attracted to synthetic pheromone. J. Econ. Entomol. 114, 2315–2325. doi: 10.1093/jee/toab179
Silva N. J., Ferreira A. C., Silva L. R., Perret S., Tieo S., Renoult J. P., et al. (2025). Deep learning approach to detect and visualise sexual dimorphism in monomorphic species. Anim. Behav. 225, 123223. doi: 10.1016/j.anbehav.2025.123223
Smith-Pardo A. H., Torres K. M., and Paula-Moraes S. V. (2025). Validation of wing geometric morphometrics in Chrysodeixis spp. (Lepidoptera: Noctuidae) to support pest identification in invasive species survey programs. Front. Insect Sci. 5, 5. doi: 10.3389/finsc.2025.1542467
Specht A., de Paula-Moraes S. V., and Sosa-Gómez D. R. (2015). Host plants of Chrysodeixis includens (Walker) (Lepidoptera, Noctuidae, Plusiinae). Rev. Bras. Entomol. 59, 343–345. doi: 10.1016/j.rbe.2015.09.002
Spiesman B. J., Gratton C., Gratton E., and Hines H. (2024). Deep learning for identifying bee species from images of wings and pinned specimens. PloS One 19, e0303383. doi: 10.1371/journal.pone.0303383
Sutherland D. and Greene G. L. (1984). “Cultivated and wild host plants,” in Suppression and management of cabbage looper populations. Eds. Lingren P. D. and Green G. L. (Washington, D.C.: U.S. Department of Agriculture, Technical Bulletin No. 1684), 152.
Tan M. and Le Q. (2019). “EfficientNet: Rethinking Model Scaling for Convolutional Neural Networks,” in Proceedings of the 36th International Conference on Machine Learning (Proceedings of Machine Learning Research, Long Beach, CA, USA), 6105–6114. Available at: https://proceedings.mlr.press/v97/tan19a.html (Accessed October 24, 2024).
Tan M. and Le Q. (2021). “EfficientNetV2: Smaller Models and Faster Training,” in Proceedings of the 38th International Conference on Machine Learning, (Virtual: International Conference on Machine Learning (ICML)) 10096–10106. Available at: https://proceedings.mlr.press/v139/tan21a.html (Accessed October 24, 2024).
Teixeira A. C., Ribeiro J., Morais R., Sousa J. J., and Cunha A. (2023). A systematic review on automatic insect detection using deep learning. Agriculture 13, 713. doi: 10.3390/agriculture13030713
Tuda M. and Luna-Maldonado A. I. (2020). Image-based insect species and gender classification by trained supervised machine learning algorithms. Ecol. Inform. 60, 101135. doi: 10.1016/j.ecoinf.2020.101135
Ullah N., Khan J. A., Alharbi L. A., Raza A., Khan W., and Ahmad I. (2022). An efficient approach for crops pests recognition and classification based on novel deepPestNet deep learning model. IEEE Access 10, 73019–73032. doi: 10.1109/ACCESS.2022.3189676
Valan M., Makonyi K., Maki A., Vondráček D., and Ronquist F. (2019). Automated taxonomic identification of insects with expert-level accuracy using effective feature transfer from convolutional networks. Syst. Biol. 68, 876–895. doi: 10.1093/sysbio/syz014
Wäldchen J. and Mäder P. (2018). Machine learning for image based species identification. Methods Ecol. Evol. 9, 2216–2225. doi: 10.1111/2041-210X.13075
Wang H., Su H., Chen P., Hou R., Zhang Z., and Xie W. (2019). “Learning Deep Features for Giant Panda Gender Classification using Face Images,” in 2019 IEEE/CVF International Conference on Computer Vision Workshop (ICCVW) (IEEE, Seoul, South Korea), 279–285. doi: 10.1109/ICCVW.2019.00037
Witzgall P., Kirsch P., and Cork A. (2010). Sex pheromones and their impact on pest management. J. Chem. Ecol. 36, 80–100. doi: 10.1007/s10886-009-9737-y
Xi T., Wang J., Han Y., Lin C., and Ji L. (2022). Multiple butterfly recognition based on deep residual learning and image analysis. Entomol. Res. 52, 44–53. doi: 10.1111/1748-5967.12564
Xu X., Li H., Gao Q., Zhou M., Meng T., Yin L., et al. (2024). Visual attention focusing on fine-grained foreground and eliminating background bias for pest image identification. IEEE Access 12, 161732–161741. doi: 10.1109/ACCESS.2024.3441321
Zhang H., Zhao S., Song Y., Ge S., Liu D., Yang X., et al. (2022). A deep learning and Grad-Cam-based approach for accurate identification of the fall armyworm (Spodoptera frugiperda) in maize fields. Comput. Electron. Agric. 202, 107440. doi: 10.1016/j.compag.2022.107440
Zhang X., Zhou X., Lin M., and Sun J. (2018). “ShuffleNet: An Extremely Efficient Convolutional Neural Network for Mobile Devices,” in 2018 IEEE/CVF Conference on Computer Vision and Pattern Recognition (IEEE, Salt Lake City, UT, USA), 6848–6856. doi: 10.1109/CVPR.2018.00716
Keywords: soybean looper, convolutional neural network, computer vision, pest detection, image classification, pheromone trapping
Citation: Torres KM, Tan C, Mollet KA, Smith-Pardo AH, Xu R, Li C and Paula-Moraes SV (2025) Integration of wing pattern morphology and deep learning to support Plusiinae (Lepidoptera: Noctuidae) pest identification. Front. Agron. 7:1602164. doi: 10.3389/fagro.2025.1602164
Received: 28 March 2025; Accepted: 16 June 2025;
Published: 08 July 2025.
Edited by:
Robert C. Venette, United States Department of Agriculture (USDA), United StatesReviewed by:
Tiago Belintani, São Paulo State University, BrazilRodrigo Araujo, Universidad Católica del Maule, Chile
Copyright © 2025 Torres, Tan, Mollet, Smith-Pardo, Xu, Li and Paula-Moraes. This is an open-access article distributed under the terms of the Creative Commons Attribution License (CC BY). The use, distribution or reproduction in other forums is permitted, provided the original author(s) and the copyright owner(s) are credited and that the original publication in this journal is cited, in accordance with accepted academic practice. No use, distribution or reproduction is permitted which does not comply with these terms.
*Correspondence: Silvana V. Paula-Moraes, c2lscGF1bGFtb3JhZXNAZ21haWwuY29t
†These authors have contributed equally to this work and share first authorship