 Prakash Sandhya
 B Venkataramana
 T. Pradeesh Kumar
 Radhakrishnan Sujatha3
- 1Department of Mathematics, School of Advanced Sciences, Vellore Institute of Technology, Vellore, Tamil Nadu, India
- 2VIT School of Agricultural Innovations and Advanced Learning, Department of Agronomy, Vellore Institute of Technology (VIT), Vellore, India
- 3School of Computer Science Engineering and Information Systems, Vellore Institute of Technology (VIT), Vellore, Tamil Nadu, India
1 Background and summary
The Fall Army Worm (FAW), Spodoptera frugiperda, is an invasive species that has rapidly spread across several continents, causing severe damage to a variety of crops, particularly maize (Dessie et al., 2024). Its ability to reproduce quickly and migrate long distances makes it particularly difficult to manage. Early detection and continuous monitoring of FAW are critical for timely intervention and effective pest management strategies (Mhala et al., 2024). However, traditional pest monitoring methods, such as visual inspection, are labor intensive, time-consuming and inefficient in large-scale agricultural settings.
To address these limitations, recent studies have explored the use of remote sensing (Dzurume et al., 2025) and computer vision (Oyege et al., 2024; Shinde et al., 2024) technologies for automated pest detection. Among these, thermal imaging (Bhakta et al., 2023) has shown particular promise due to its ability to capture subtle physiological changes in plant tissues through temperature variations – changes that may be early indicators of pest infestation. Combined with RGB imaging, which provides detailed visual information, this multimodal approach would be a powerful tool for improving pest detection accuracy.
In this study, we present a novel dataset consisting of both thermal and RGB images of maize crop, including samples both infested by FAW and healthy controls. The images were captured under real field conditions using a FLIR E8 thermal camera and an iPhone RGB camera, ensuring practical relevance.
Given the limited availability of datasets for this specific use case involving thermal-RGB fusion, our dataset provides a valuable resource for the agricultural and computer vision communities by filling an important gap. In addition, we applied a comprehensive set of 38 image augmentation techniques to increase the variability and robustness of the dataset, making it suitable for training deep learning models (Upadhyay et al., 2025) in FAW detection and classification tasks.
2 Methods
The dataset consists of thermal and RGB images of maize plants, both infested with FAW and healthy, collected under varied environmental conditions. A detailed breakdown of the data collection process and the augmentation techniques is provided below.
2.1 Data collection
The images were collected in agricultural fields where maize plants were actively growing. Two types of images were captured:
‐ Thermal (Infrared) Images: These images were captured using a FLIR E8 thermal imaging camera, which has a thermal resolution of 320 x 240 pixels. The camera captures temperature variations, which are indicative of plant health, pest infestations, or environmental stress.
‐ RGB Images: RGB images were collected from both thermal camera and iPhone camera, providing high-resolution visible light images of maize plants. The images were taken from multiple angles and distances to capture varying perspectives and the spatial distribution of FAW infestations.
The images were taken under varying lighting conditions (e.g., morning, afternoon, cloudy, clear skies) to ensure the dataset is robust to environmental changes.
● RGB Images (FLIR) – RGB images captured using the FLIR E8 camera.
● RGB Images (iPhone) – RGB images captured using an iPhone.
● Thermal Images – Corresponding thermal images from the FLIR E8 camera.
2.2 Data augmentation
To enhance the diversity and size of the dataset and enable the development of robust AI models, we applied 38 image augmentation techniques. These techniques were chosen to simulate various real-world conditions, such as changes in scale, orientation, lighting, and noise that might occur in agricultural fields. The augmentation methods applied include:
‐ Geometric Transformations: skew, rotate, translate, scale, flip, zoom, random cropping, affine transform, perspective transform, elastic distortion, spatial transform, image warp, and deformable convolution.
‐ Noise Addition: gaussian noise, salt & pepper noise.
‐ Image Distortion: gaussian blur, sharpen, temperature jitter, random erasing, occlusion, pseudo coloring, and mosaic.
‐ Color Adjustments: channel shuffle, solarize, invert, cut mix, color jitter, sigmoid contrast, gamma contrast, linear contrast, color shift, and contrast adjustments.
‐ Advanced Augmentations: bounding box, collar jitter, hide & seek, grid mask, mix up, polar distortion.
These augmentations ensure that the dataset is well-suited for training deep learning models that can generalize across a variety of conditions and environments (Alessandrini et al., 2021). The augmented images were generated by applying the above methods to both the thermal and RGB images of healthy and infested maize plants.
Figures 1–5 provide visual examples of these augmentations, showcasing how image variability is introduced across different classes and imaging types. These figures highlight the effectiveness of the augmentation strategies in simulating realistic variations that models may encounter in real-world agricultural settings.
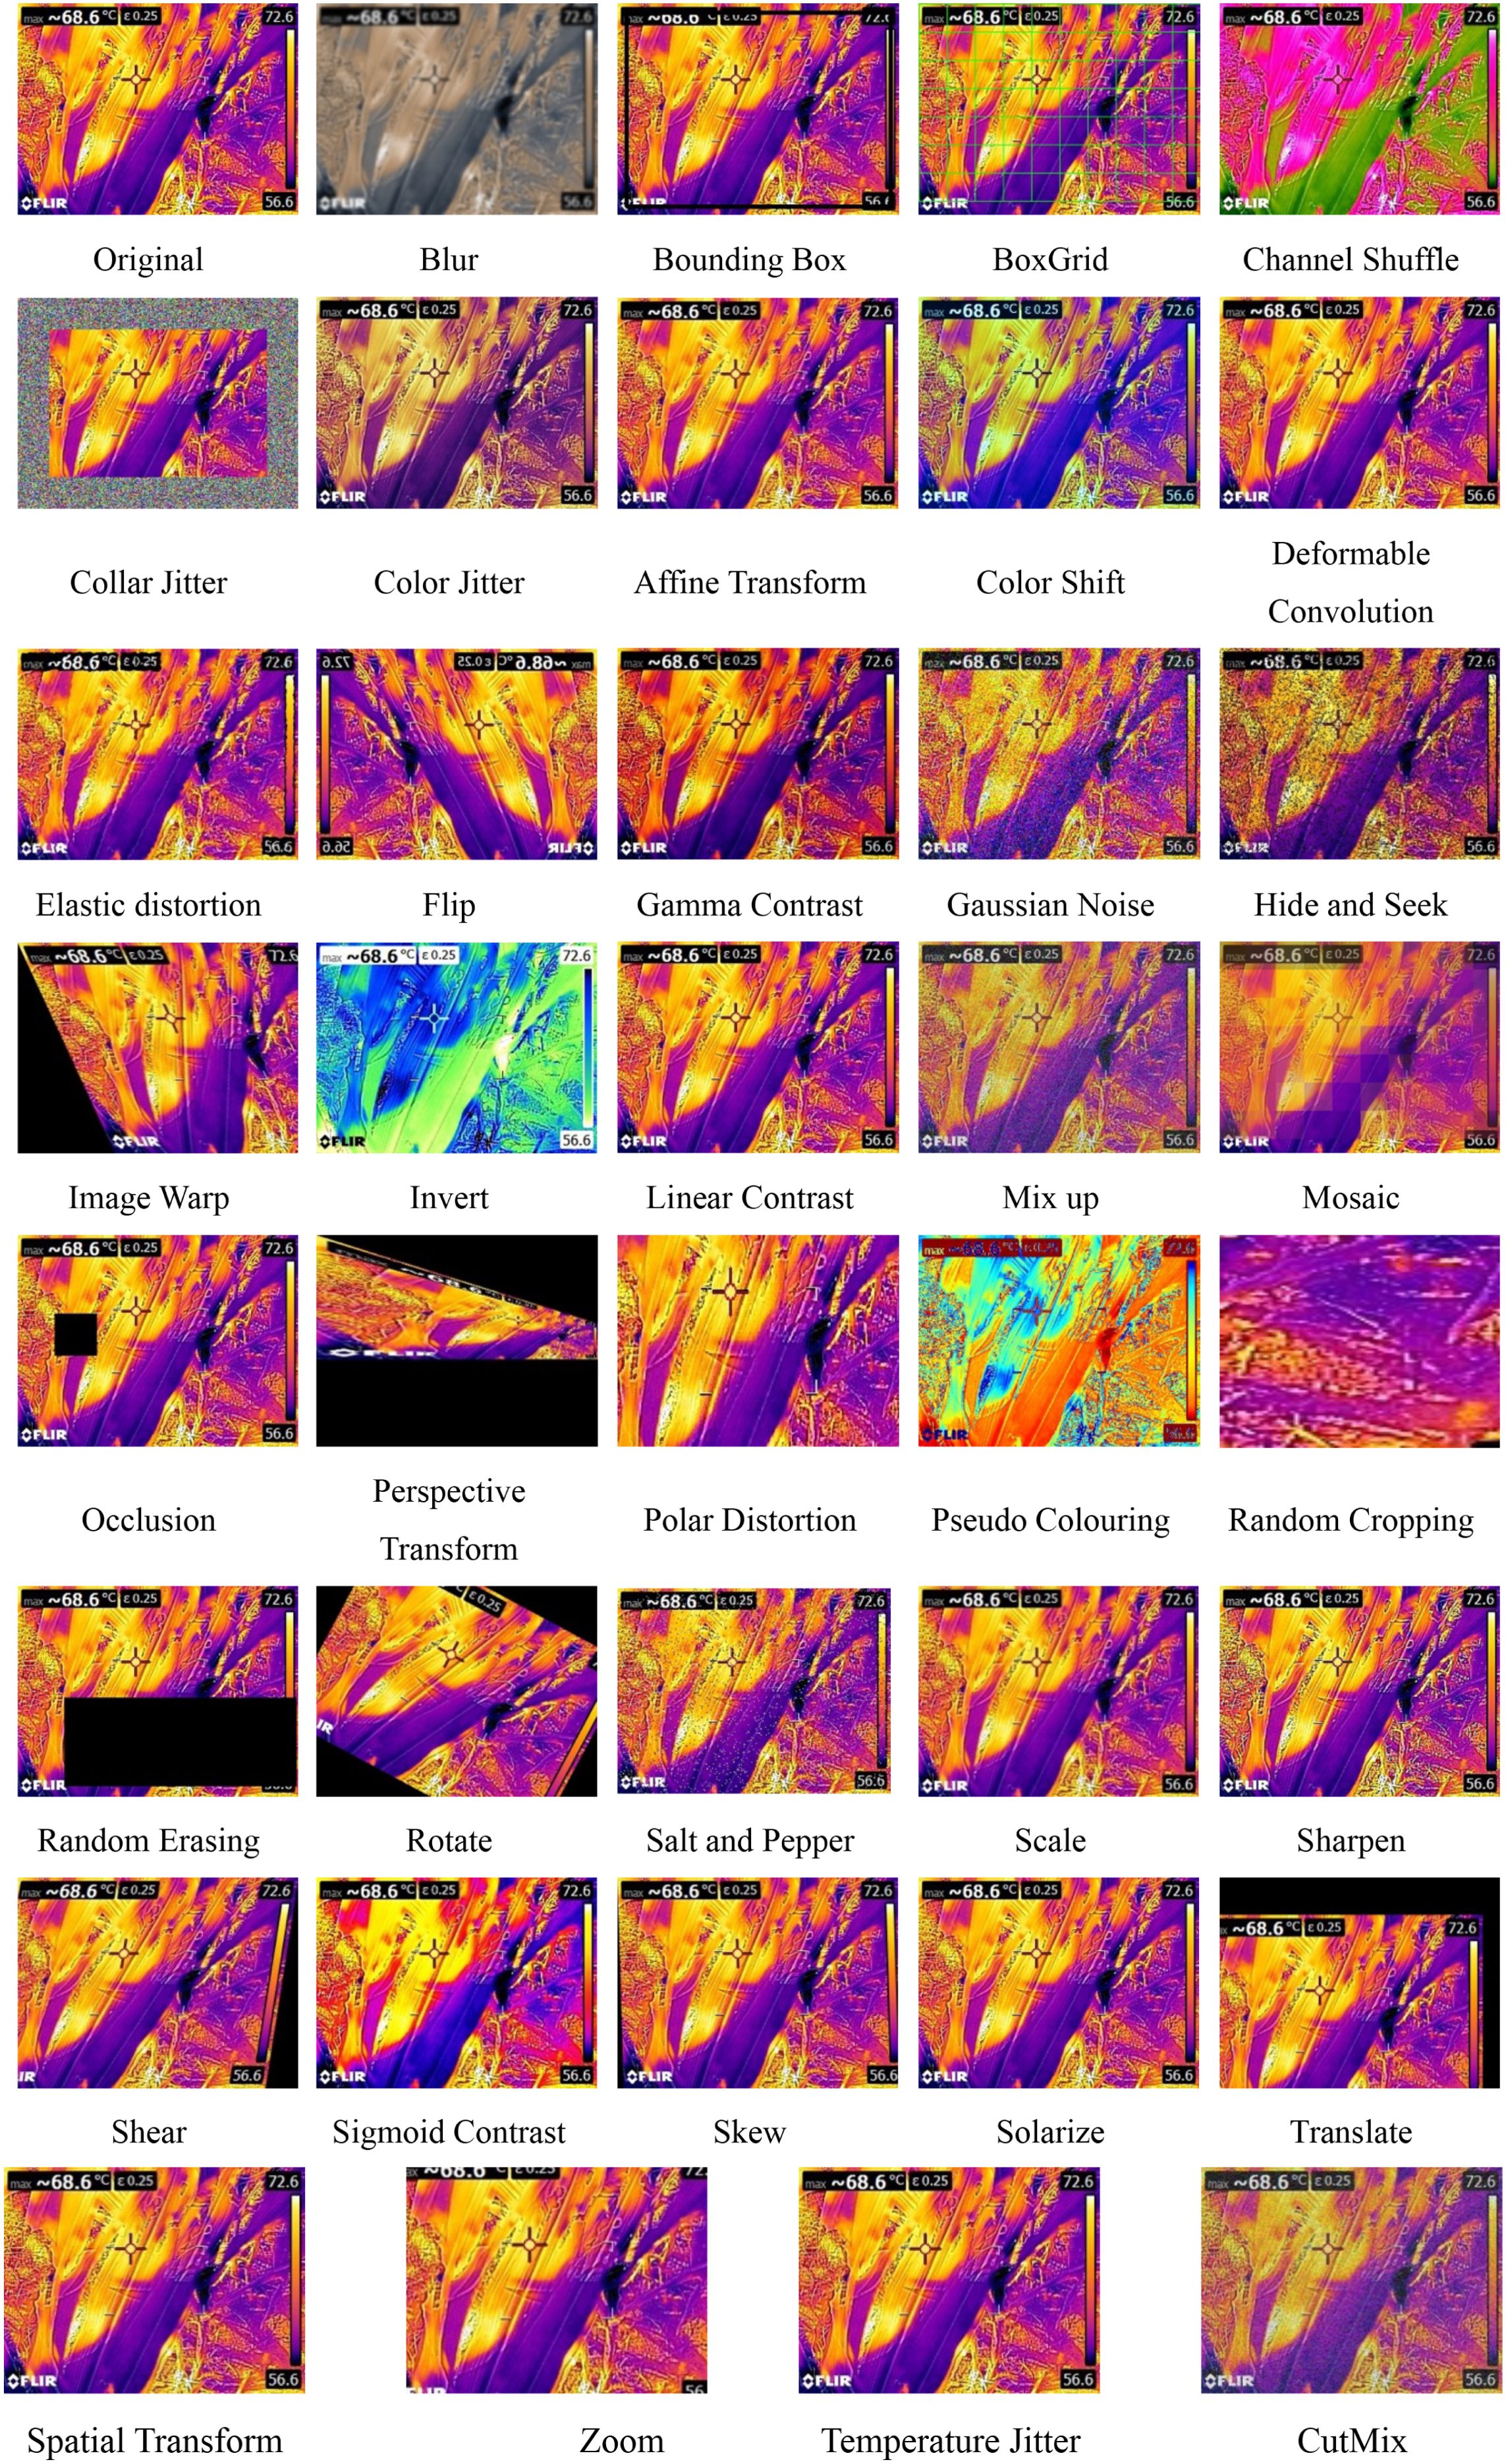
Figure 1. Samples images of augmentation for the class FAW (FLIR - IFR).
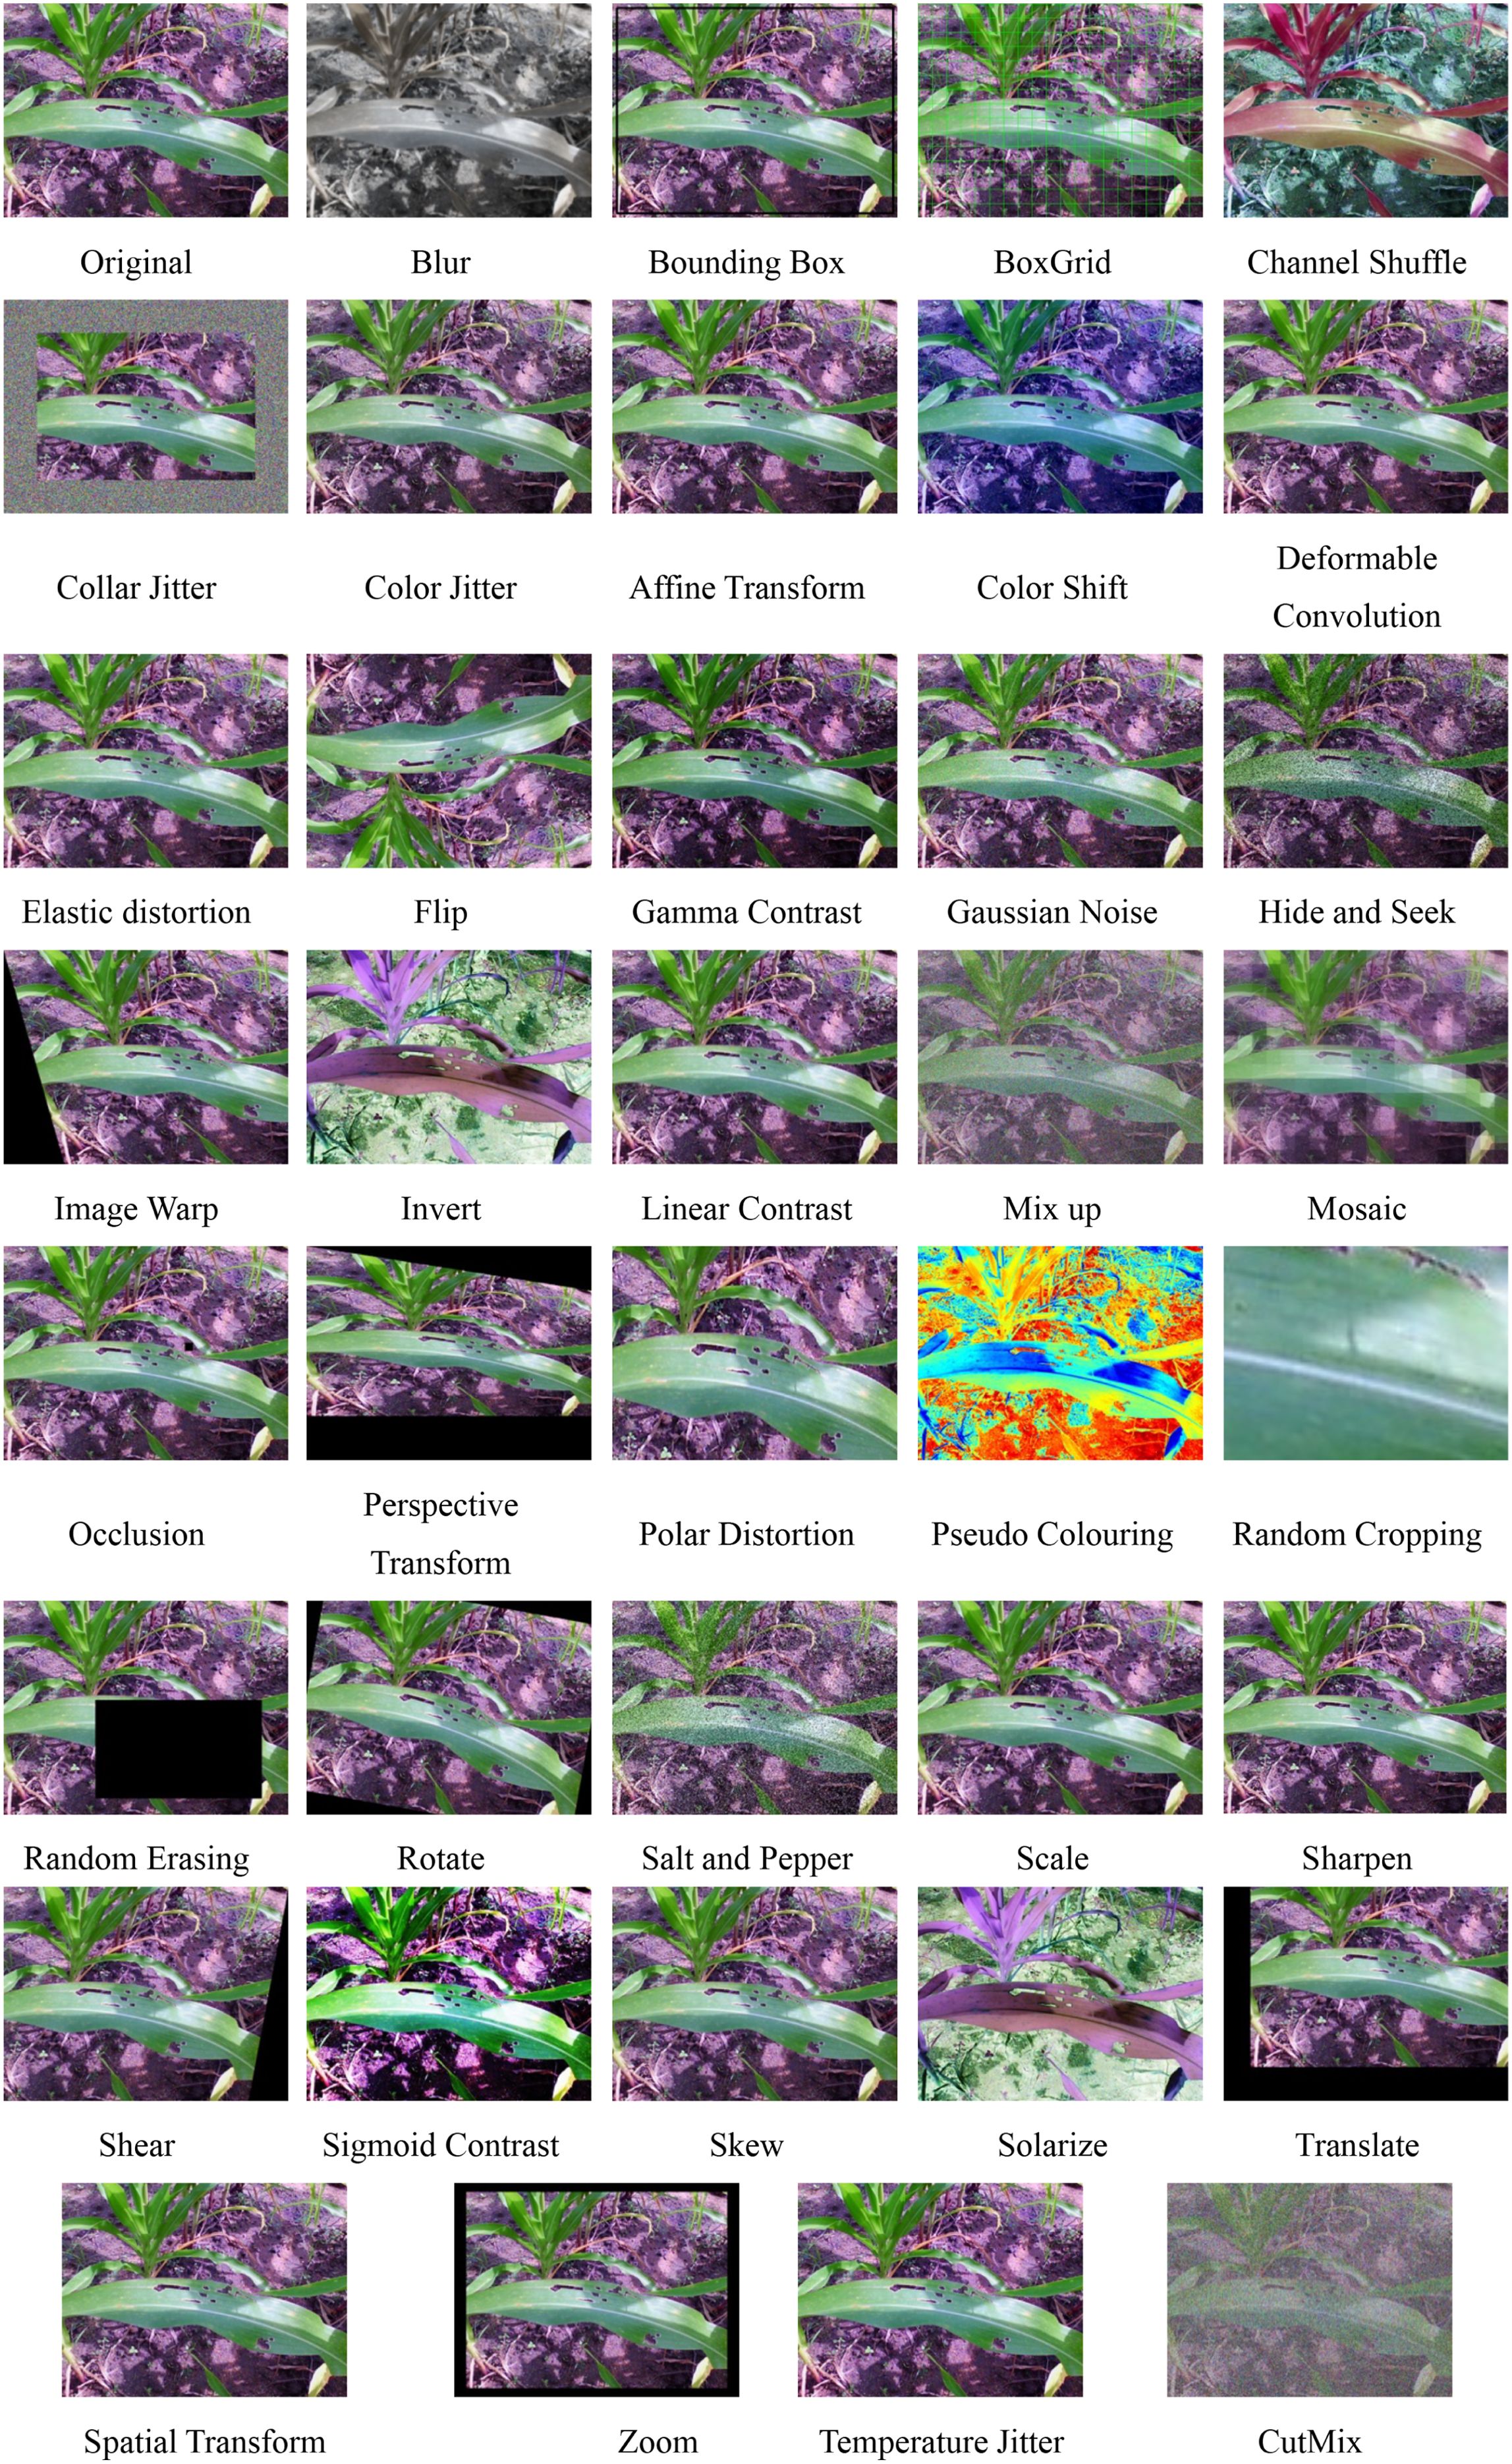
Figure 2. Samples images of augmentation for the class FAW (FLIR - RGB).
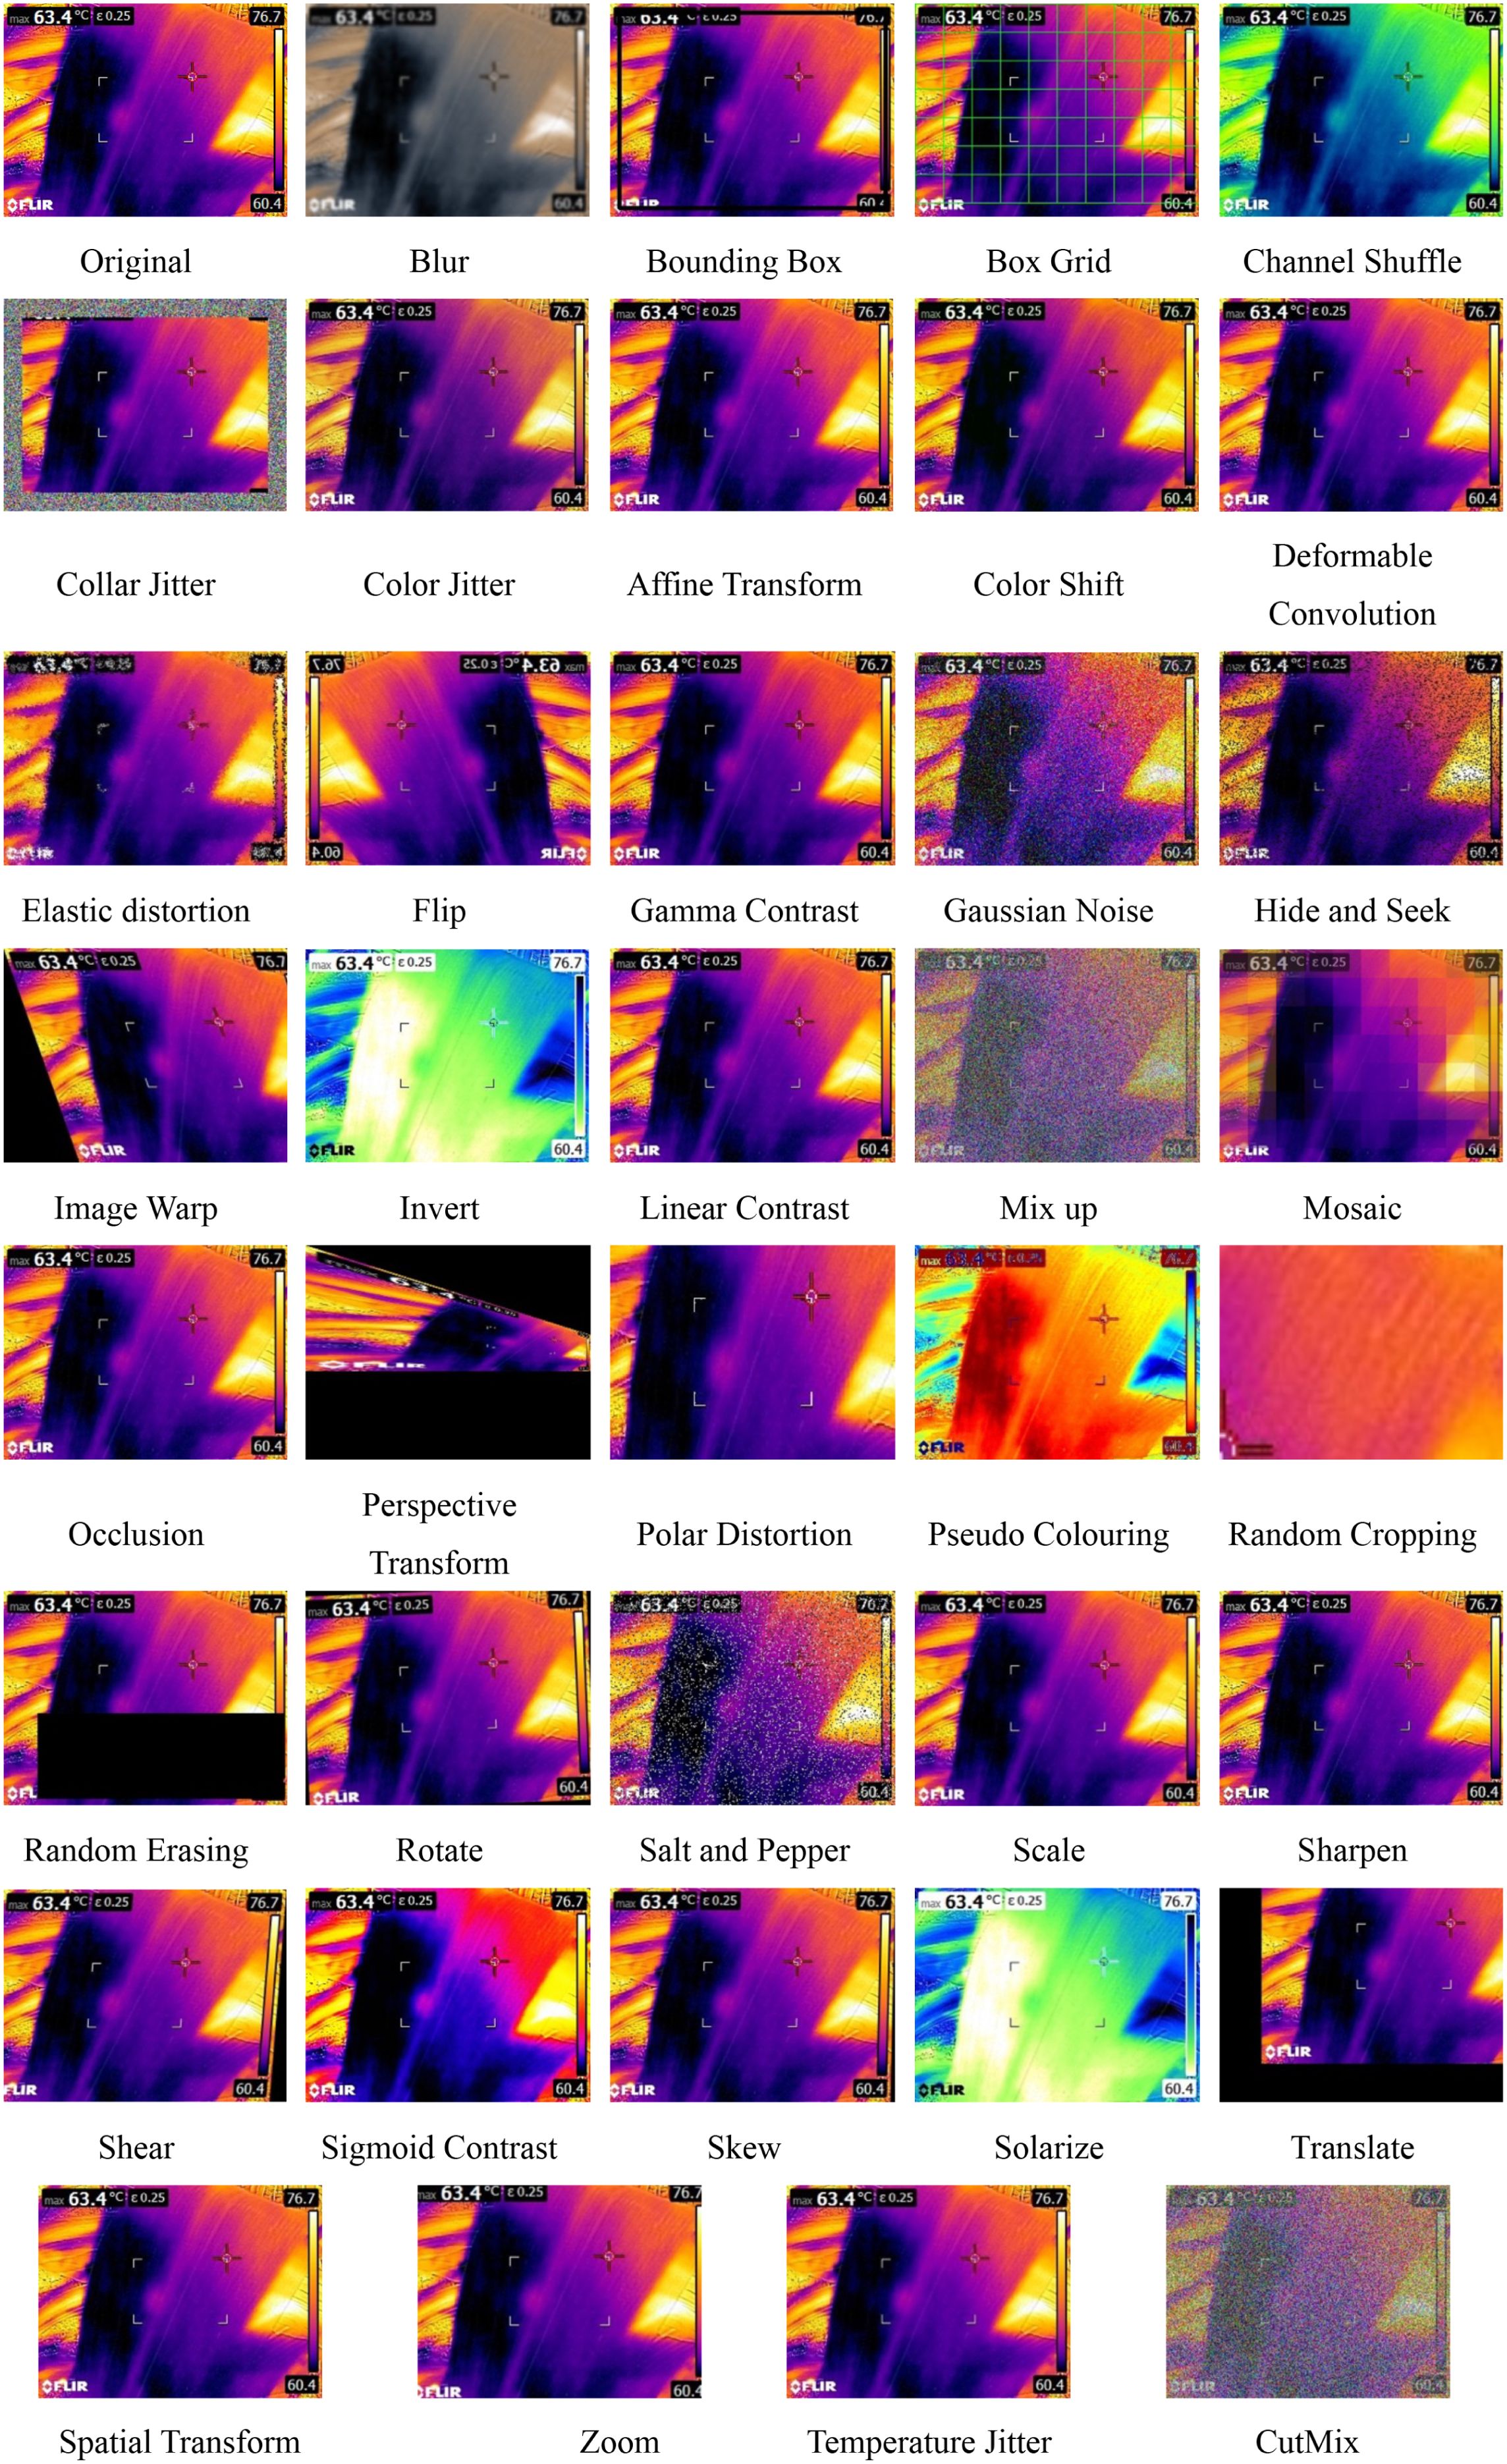
Figure 3. Samples images of augmentation for the class Healthy (FLIR - IFR).
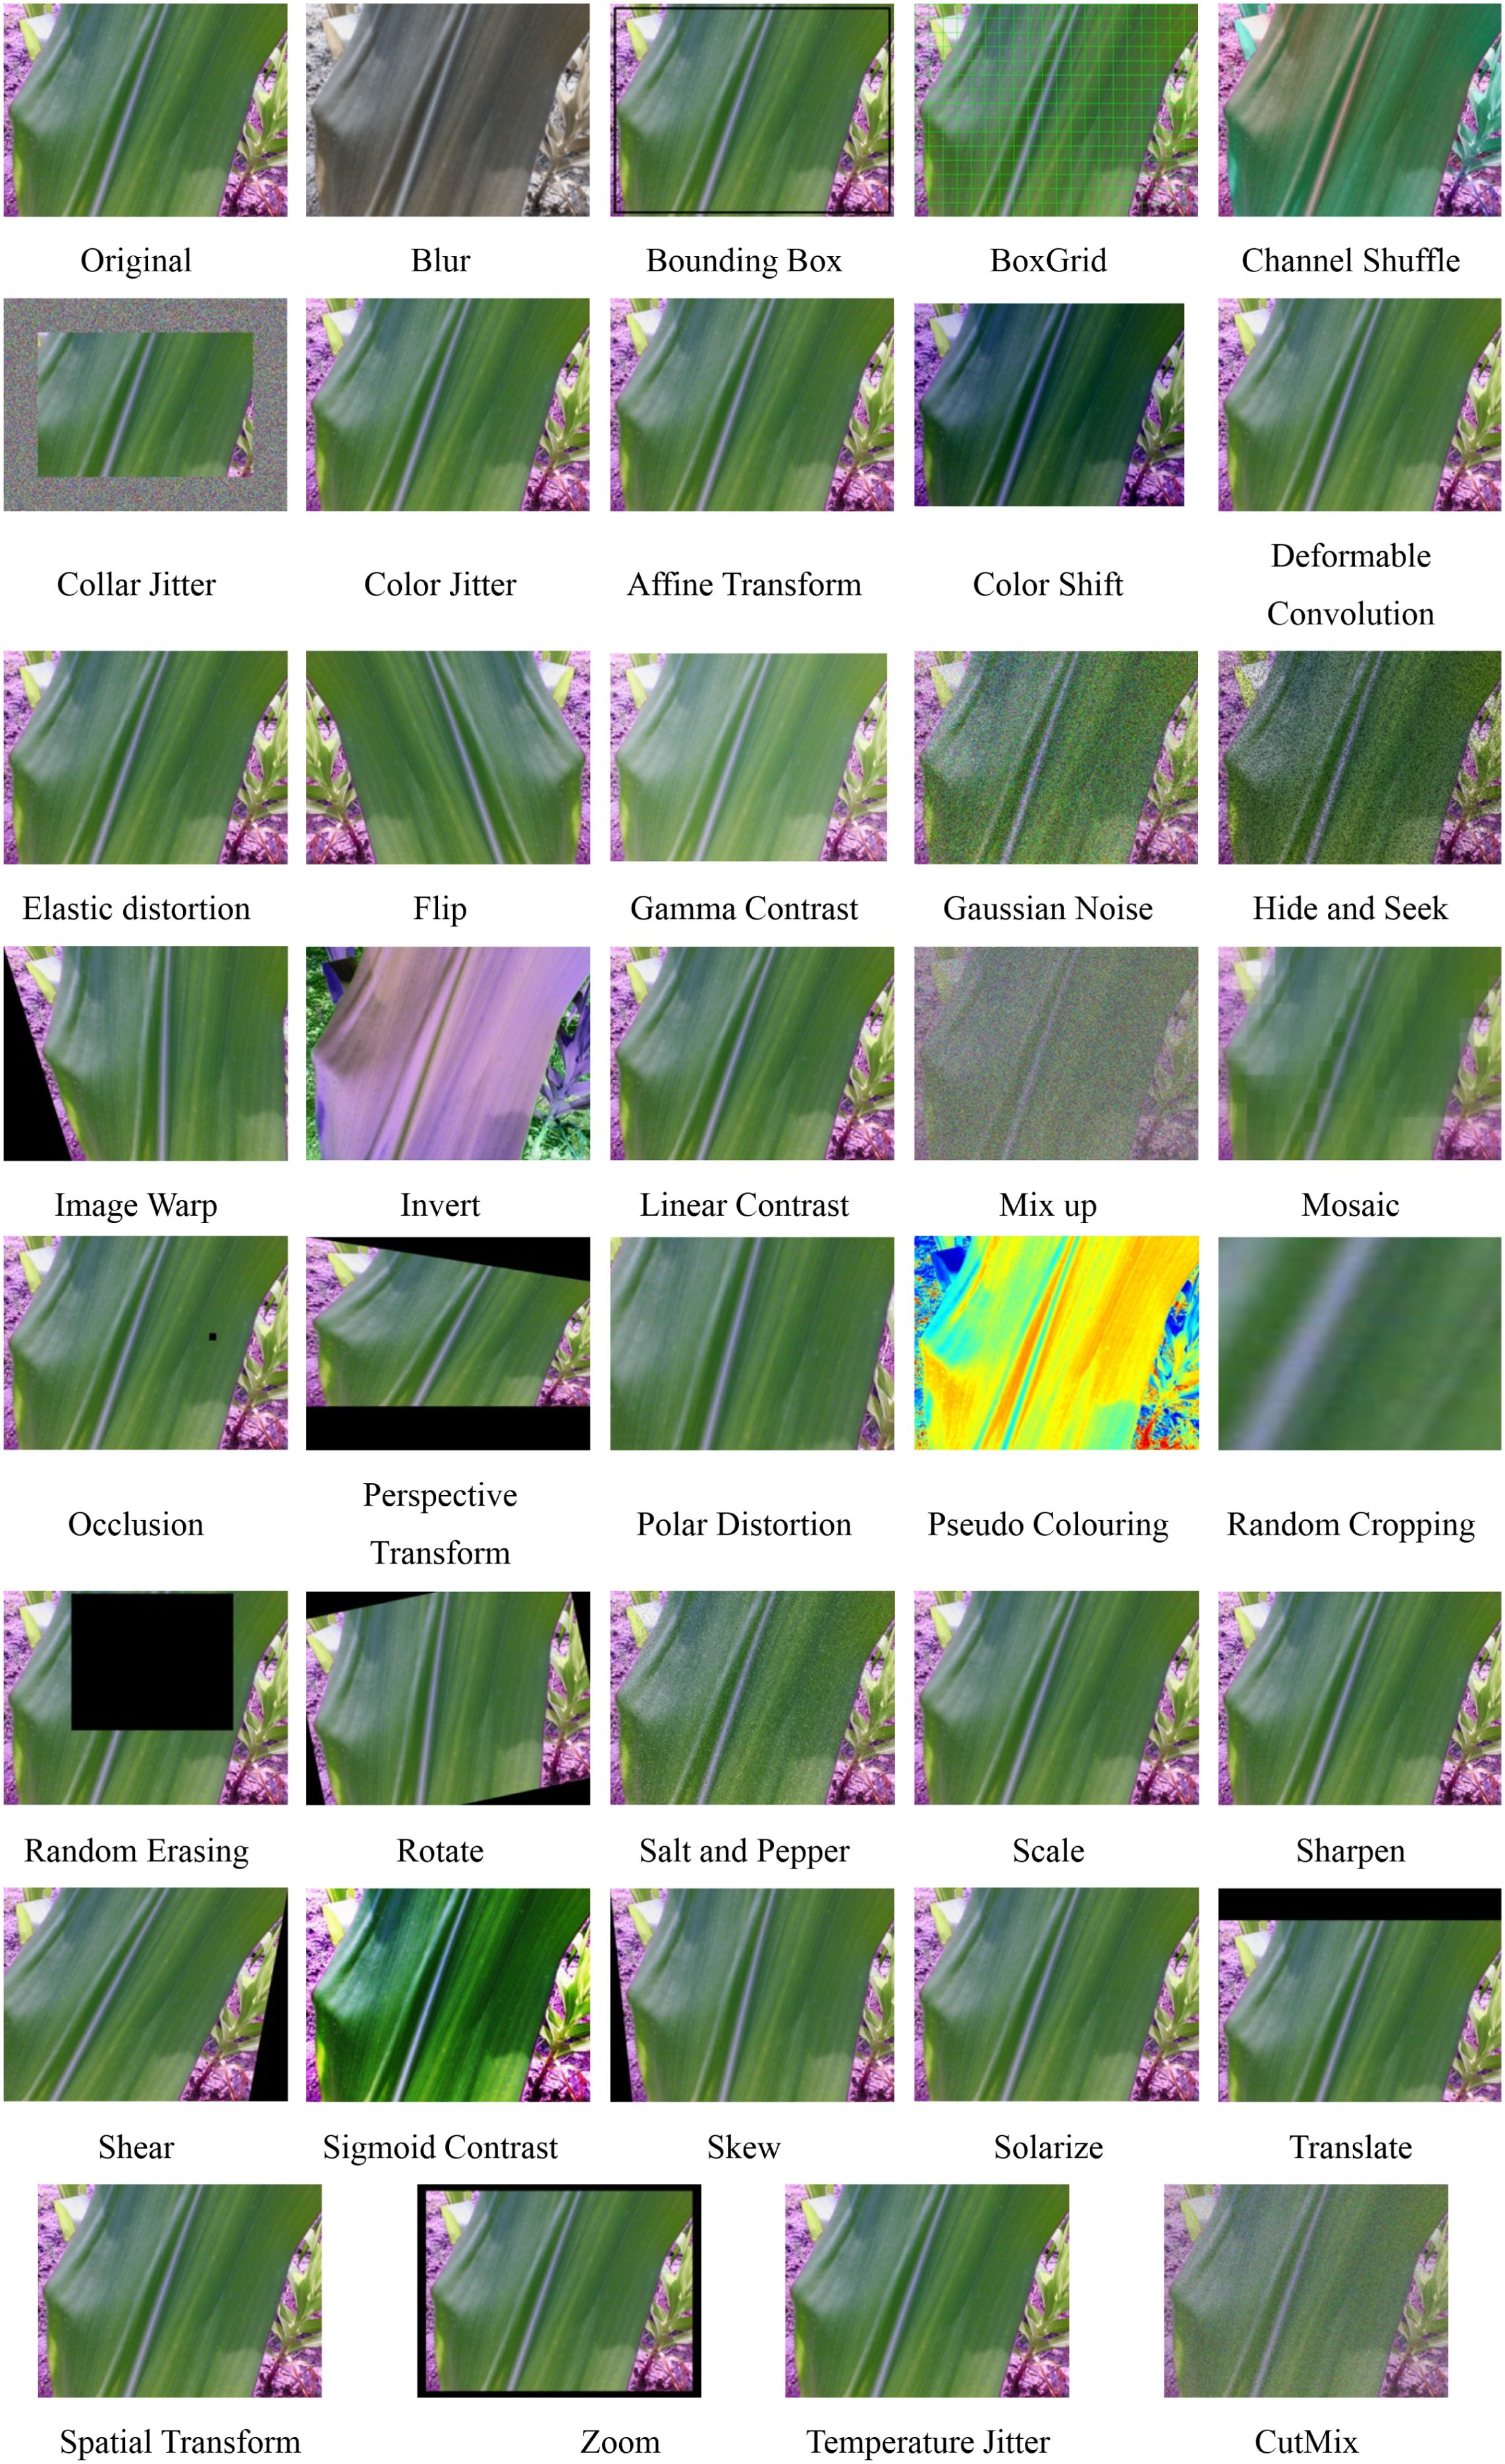
Figure 4. Samples images of augmentation for the class Healthy (FLIR - RGB).
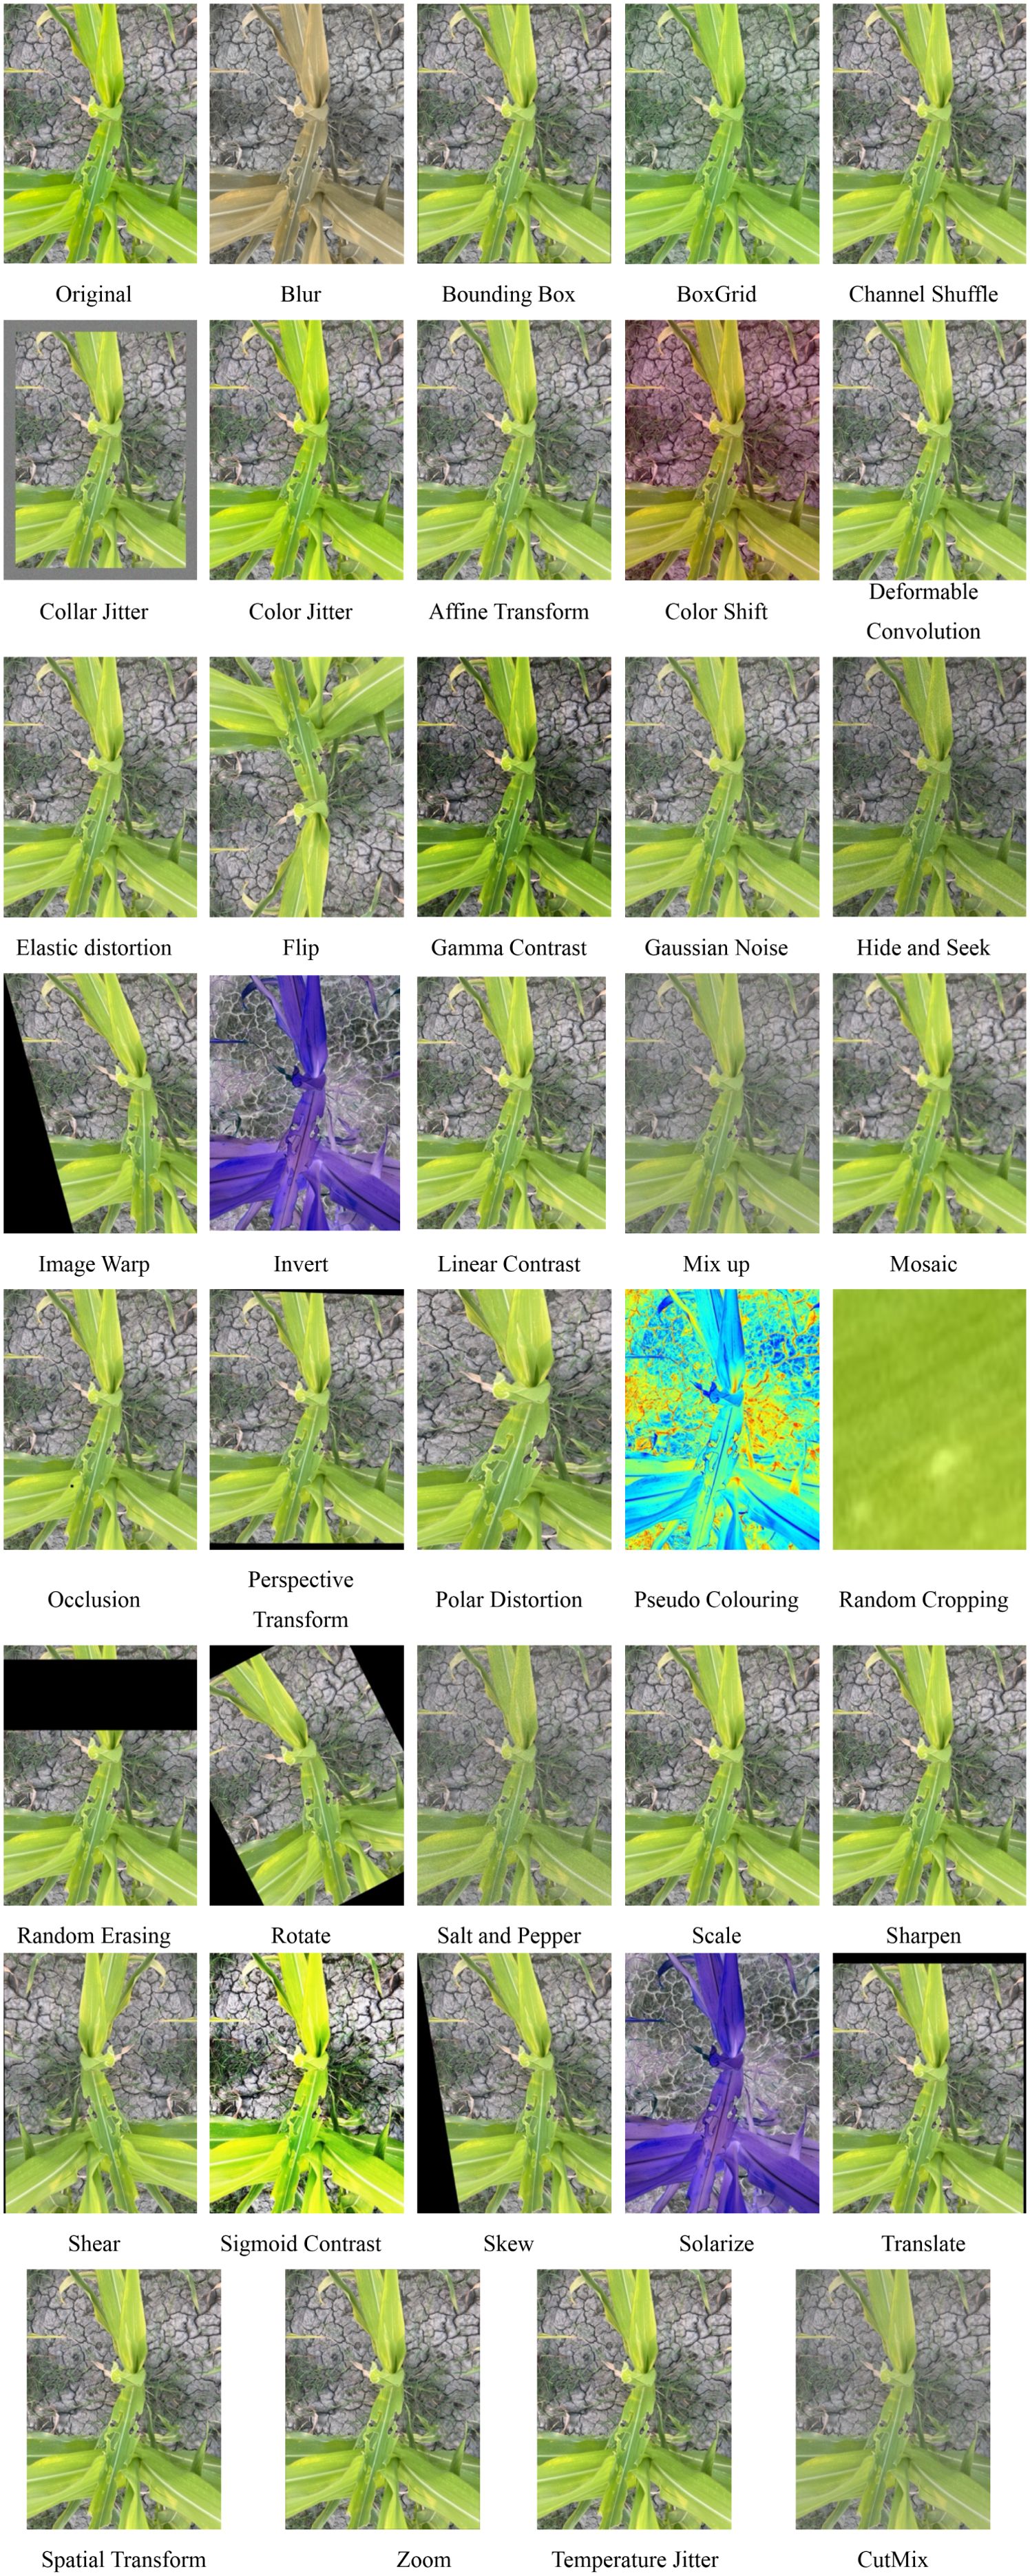
Figure 5. Samples images of augmentation for the class FAW (iPhone - RGB).
2.3 Data records
‐ Total Number of Images: The dataset post augmentation contains over 59,943 images (24,687 thermal and 35,256 RGB – 24,687 (FLIR), 10569 (iPhone)), with approximately 40% representing healthy maize plants and 60% showing FAW infestations at various stages of severity. Data structure as deposited in repository is presented in Figure 6.
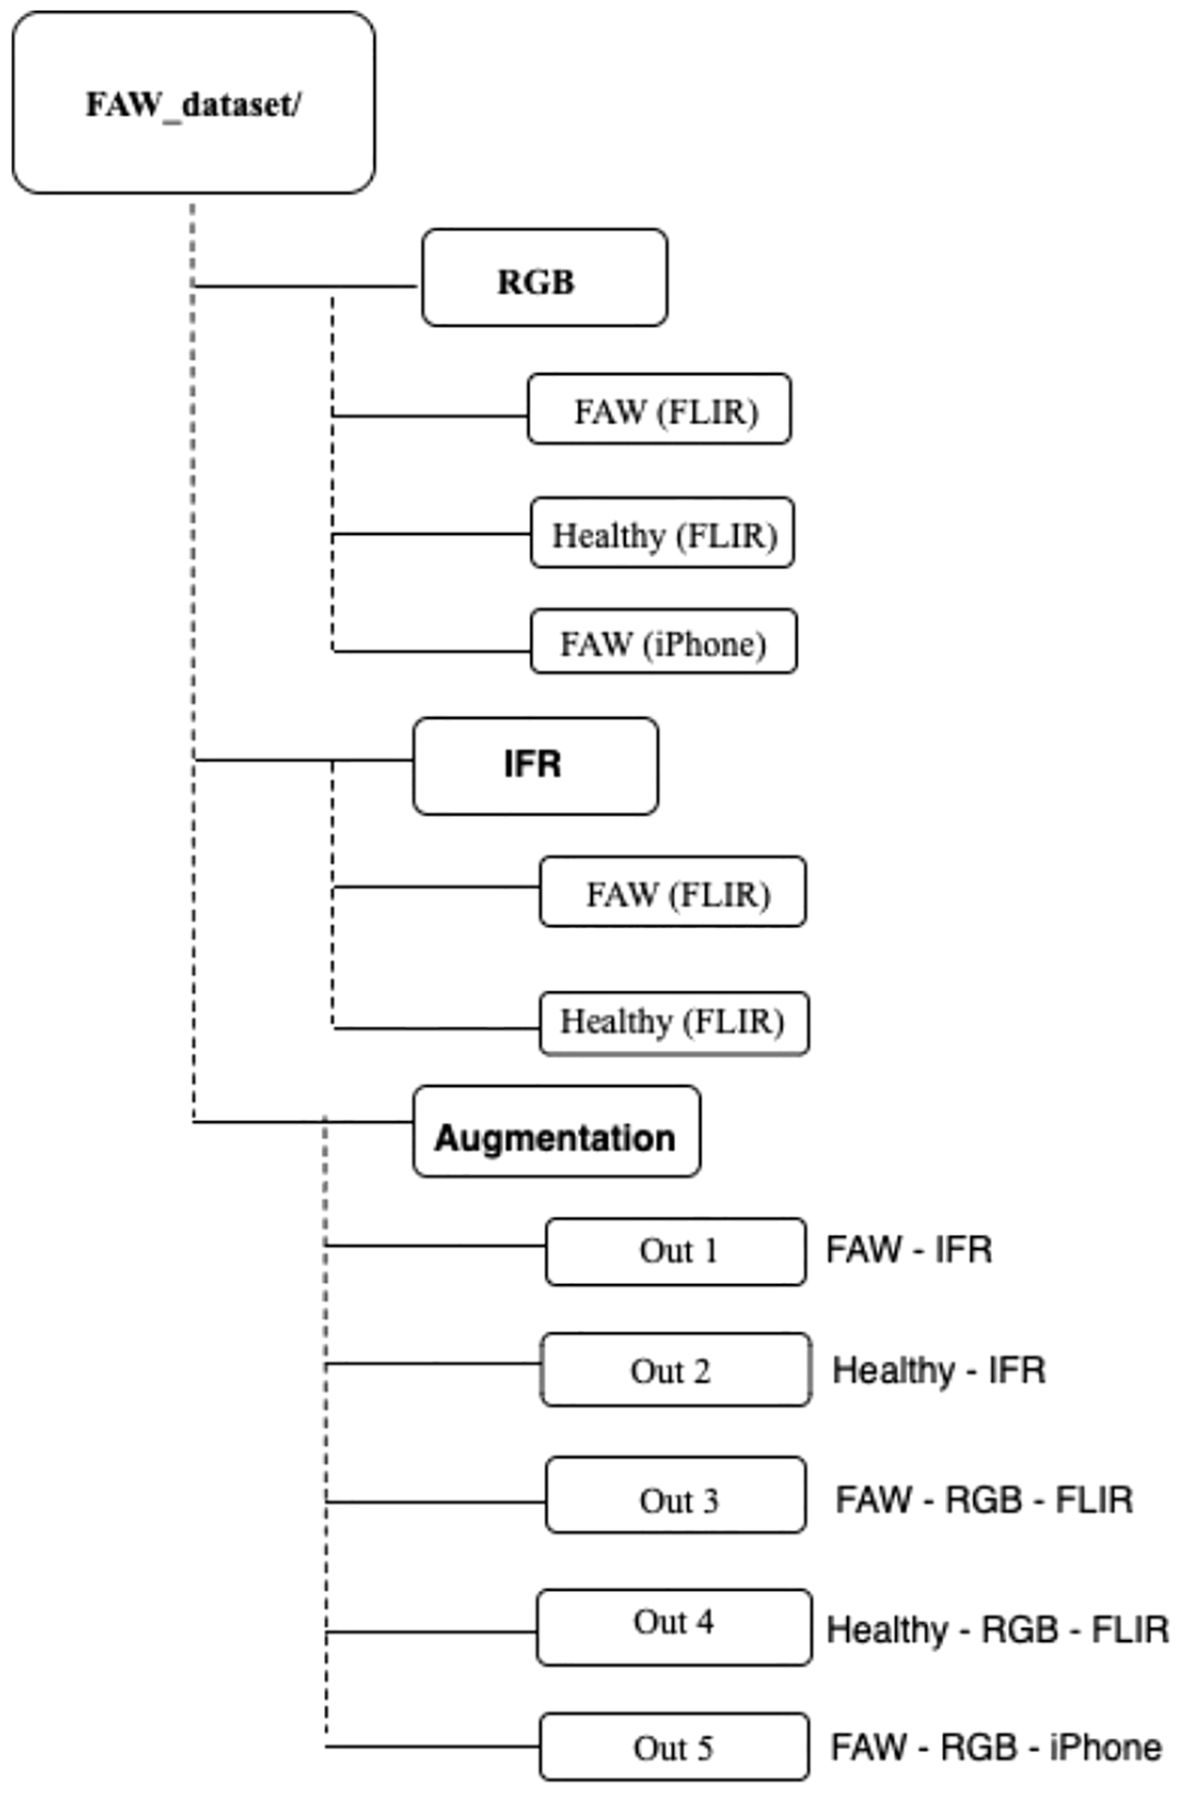
Figure 6. Dataset structure.
‐ Image Resolution: Thermal images are captured at a resolution of 320 x 240 pixels, while RGB images are of varying resolutions, typically around 640 x 480 (FLIR) and 3024 x 4032 (iPhone) pixels.
‐ Augmented Images: After augmentation, the dataset is significantly expanded, offering a highly varied set of images for training and testing machine learning models.
The dataset is available on Figshare (A Thermal and RGB Image Dataset for Fall Army Worm Detection in Maize Leaves), an open-access repository that enables users to share, cite, and discover research outputs. The dataset includes images of Fall Army Worm (FAW)-infested and healthy maize leaves captured using a FLIR E8 thermal camera and an iPhone. It is structured into categories: ‘FAM RGB - IFR’, ‘Healthy RGB - IFR’, ‘IFR FAW’, ‘IFR Healthy’, and ‘RGB FAW’. The dataset can be accessed at Figshare (DOI: 10.6084/m9.figshare.28388018).
2.4 Technical validation
To ensure dataset reliability, we:
● Cross-validated RGB and thermal images for consistency.
● Performed manual inspections for labelling accuracy.
● Employed baseline deep learning model (CNN) to validate the dataset’s usability for FAW detection.
3 Usage notes
The primary application of this dataset is in the development and training of machine learning models for the detection of FAW infestations in maize crops. The dataset can be used in several key areas:
3.1 Pest detection and classification
Machine learning models, particularly convolutional neural networks (CNNs), can be trained on this dataset to automatically detect and classify images based on the presence or absence of FAW. Thermal images are particularly useful for identifying temperature anomalies caused by pest activity, while RGB images provide detailed visual information about the physical state of the plants.
3.2 Early pest detection
The dataset is particularly valuable for early-stage pest detection, which is crucial for minimizing crop damage and reducing pesticide use. By leveraging the thermal imaging modality, which can detect heat signatures from pests even before visible signs of damage occur, the dataset can help in the development of AI-based systems that alert farmers to potential infestations in real-time (Appiah et al., 2025).
3.3 Precision agriculture
The dataset can be used as part of precision agriculture initiatives (Genze et al., 2024; Olaniyi et al., 2023; Mesías-Ruiz et al., 2025), where machine learning models analyze images of crops to identify pest outbreaks and other environmental stresses (Salaić et al., 2023), allowing farmers to take targeted actions, such as localized pesticide spraying or pest control measures. This can reduce costs, minimize pesticide use, and enhance crop yield.
3.4 Crop health monitoring
In addition to pest detection, this dataset can also be employed for broader crop health monitoring applications. By analyzing both thermal and RGB images, researchers can study the physiological stress factors affecting maize plants, including water stress, disease, and pest damage.
3.5 Image analysis
To evaluate the effectiveness of the dataset, a simple Convolutional Neural Network (CNN) was implemented to classify maize leaves as either healthy or FAW-infected. The model was trained on both RGB and infrared (IFR) images collected using a FLIR E8 thermal camera and an iPhone. The CNN architecture consisted of multiple convolutional layers, max-pooling, and fully connected layers, ensuring a basic yet effective feature extraction process. The dataset was split into 80% training and 20% validation, with all images resized to 224×224 pixels for uniformity. The results from this preliminary analysis demonstrate the dataset’s potential for distinguishing between healthy and infected leaves, serving as a foundation for future, more advanced models. The evaluation results obtained were tabulated below (Table 1) and their respective curves are presented in Figures 7–9.
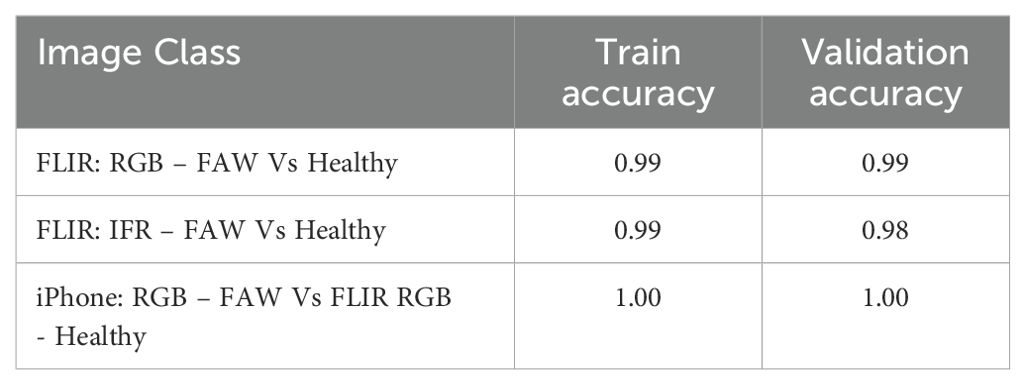
Table 1. Accuracy metrics for the evaluated train and test sets.
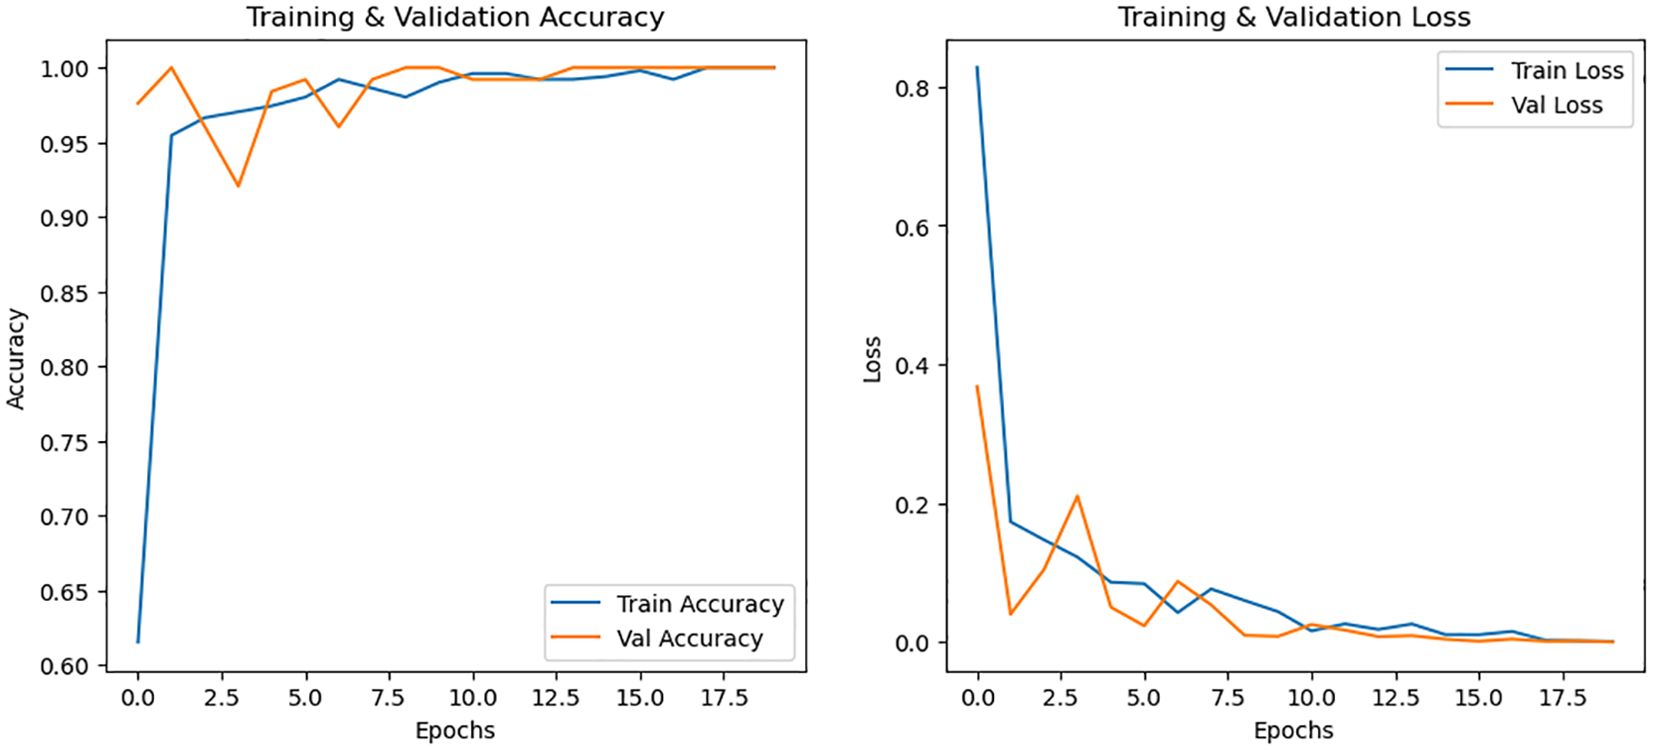
Figure 7. Accuracy and loss curve evaluated for FLIR: RGB – FAW Vs Healthy.
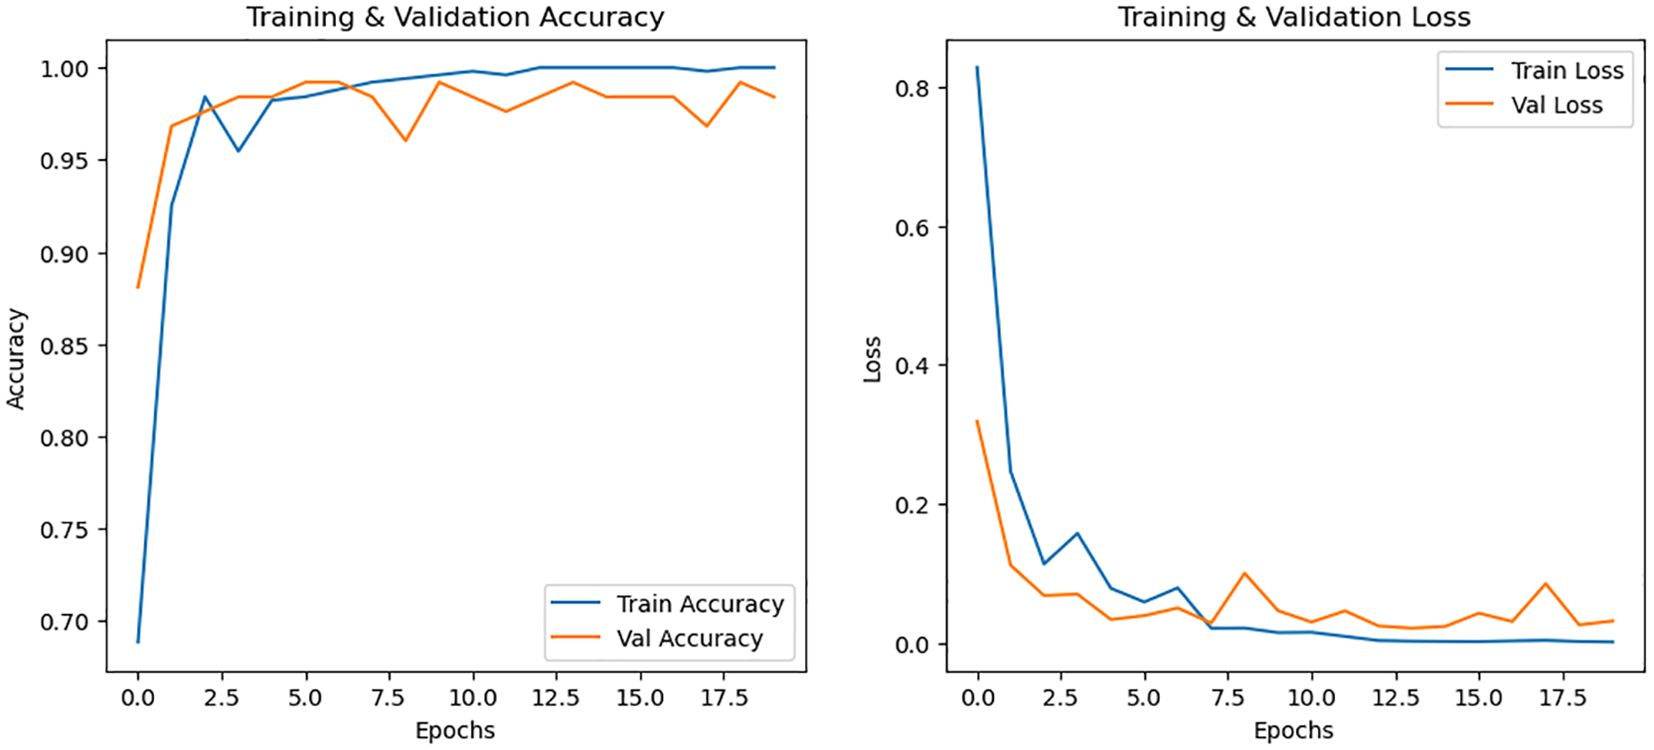
Figure 8. Accuracy and loss curve evaluated for FLIR: IFR – FAW Vs Healthy.
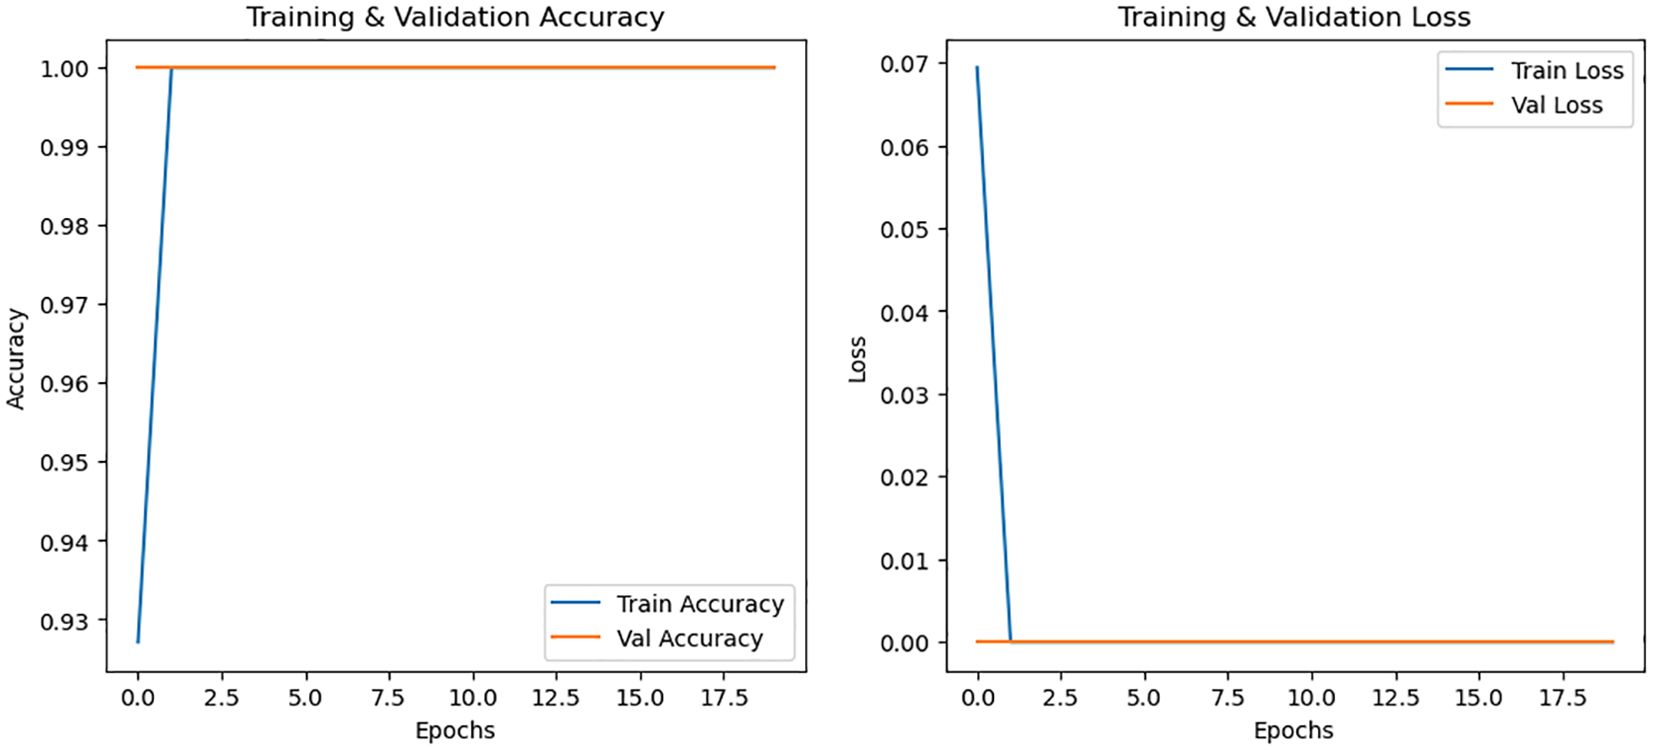
Figure 9. Accuracy and loss curve evaluated for iPhone: RGB – FAW Vs FLIR RGB – Healthy.
4 Novelty and contribution
This dataset is unique in several respects:
- Combination of Thermal and RGB Imaging: This dataset is among the first to combine close-range thermal and RGB images specifically for FAW detection in maize. The dual-modality approach allows for more accurate and robust identification of infestation, capturing both visual features and thermal signatures associated with pest activity, something not possible with RGB or satellite data alone.
- Real-World Applicability: All images were collected under natural, real-field conditions using a FLIR E8 thermal camera and an iPhone for RGB imagery. This enhances the dataset’s relevance and applicability for practical deployment in operational agricultural settings.
- Extensive Augmentation Techniques: To further improve the dataset’s utility, we applied 38 diverse image augmentation techniques to increase variability and robustness, enabling deep learning models trained on this dataset to generalize better across environmental conditions, infestation levels and image noise.
This dataset offers a fine-grained, multimodal and field-validated resource that is currently lacking in pest detection research. This contribution can support the development of more precise and scalable AI models for sustainable pest management in agriculture.
5 Conclusion
This dataset offers exciting avenues for future research and application. It can be directly used to develop robust AI models for real-time FAW detection in maize, deployable on mobile devices or UAV-mounted imaging systems. Its dual-modality (thermal and RGB) makes it ideal for integration into smart farming platforms and early warning systems to minimize crop loss. Moreover, researchers can leverage this dataset to explore multimodal learning, domain adaptation, and generalizable pest detection frameworks across various agricultural environments.
Data availability statement
The datasets presented in this study can be found in online repositories. The dataset can be accessed at Figshare (DOI: 10.6084/m9.figshare.28388018). The analysis in this work was conducted using Python 3.6.13. The code adapted for augmentation and classification are available in the following GitHub repository: https://github.com/sapryaja/MyProject.git. To ensure reproducibility, the complete Python environment, including all required dependencies, is documented in the requirements.txt file. This will allow for an accurate replication of the work done.
Author contributions
PS: Formal analysis, Data curation, Writing – original draft. BV: Funding acquisition, Project administration, Writing – review & editing, Validation, Supervision. TK: Methodology, Conceptualization, Writing – review & editing. RS: Conceptualization, Project administration, Supervision, Validation, Writing – review & editing.
Funding
The author(s) declare that no financial support was received for the research, and/or publication of this article.
Conflict of interest
The authors declare that the research was conducted in the absence of any commercial or financial relationships that could be construed as a potential conflict of interest.
Generative AI statement
The author(s) declare that no Generative AI was used in the creation of this manuscript.
Publisher’s note
All claims expressed in this article are solely those of the authors and do not necessarily represent those of their affiliated organizations, or those of the publisher, the editors and the reviewers. Any product that may be evaluated in this article, or claim that may be made by its manufacturer, is not guaranteed or endorsed by the publisher.
References
Alessandrini M., Calero Fuentes Rivera R., Falaschetti L., Pau D., Tomaselli V., and Turchetti C.. (2021). A grapevine leaves dataset for early detection and classification of esca disease in vineyards through machine learning. Data Brief 35, 106809. doi: 10.1016/j.dib.2021.106809
Appiah O., Hackman K. O., Diakalia S., Codjia A. K. D., Bêbê M., Ouedraogo V., et al. (2025). TOM2024: Datasets of Tomato, Onion, and Maize images for developing pests and diseases AI-based classification models. Data Brief 59, 111357. doi: 10.1016/j.dib.2025.111357
A Thermal and RGB Image Dataset for Fall Army Worm Detection in Maize Leaves. Available online at: https://figshare.com/articles/figure/_b_A_Thermal_and_RGB_Image_Dataset_for_Fall_Army_Worm_Detection_in_Maize_Leaves_b_/28388018. (Accessed February 17, 2025).
Bhakta I., Phadikar S., Majumder K., Mukherjee H., and Sau A. (2023). A novel plant disease prediction model based on thermal images using modified deep convolutional neural network. Precis. Agric. 24, 23–39. doi: 10.1007/s11119-022-09927-x
Dessie B., Ferede B., Taye W., and Shimelash D. (2024). Field infestation of the invasive fall armyworm, Spodoptera frugiperda (Lepidoptera: Noctuidae) on maize in Southern Ethiopia. Crop Prot. 178, 106587. doi: 10.1016/j.cropro.2024.106587
Dzurume T., Darvishzadeh R., Dube T., Babu T.S.A., Billah M., Alam S.N., et al. (2025). Detection of Fall Armyworm infestation in maize fields during vegetative growth stages using temporal Sentinel-2. Int. J. Appl. Earth Obs. Geoinformation 139, 104516. doi: 10.1016/j.jag.2025.104516
Genze N., Vahl W. K., Groth J., Wirth M., Grieb M., and Grimm D. G. (2024). Manually annotated and curated Dataset of diverse Weed Species in Maize and Sorghum for Computer Vision. Sci. Data 11. Available online at: https://www.nature.com/articles/s41597-024-02945-6. (Accessed July 22, 2025).
Mesías-Ruiz G. A., Peña J. M., de Castro A. I., and Dorado J. (2025). Drone imagery dataset for early-season weed classification in maize and tomato crops. Data Brief 58, 111203. doi: 10.1016/j.dib.2024.111203
Mhala P., Gupta A., and Sharma S. (2024). “YOLOv8 based detection of fall armyworm in field crops,” in 2024 IEEE 5th India Council International Subsections Conference (INDISCON), Chandigarh, India: IEEE, 1–6. doi: 10.1109/INDISCON62179.2024.10744347
Olaniyi O. M., Salaudeen M. T., Daniya E., Abdullahi I. M., Folorunso T. A., Bala J. A., et al. (2023). Development of maize plant dataset for intelligent recognition and weed control. Data Brief 47, 109030. doi: 10.1016/j.dib.2023.109030
Oyege I., Sibitenda H., and Bhaskar M. S. B. (2024). Deep learning applications for real-time and early detection of fall armyworm, African armyworm, and maize stem borer. Mach. Learn. Appl. 18, 100596. doi: 10.1016/j.mlwa.2024.100596
Salaić M., Novoselnik F., Žarko I. P., and Galić V. (2023). Nitrogen deficiency in maize: Annotated image classification dataset. Data Brief 50, 109625. doi: 10.1016/j.dib.2023.109625
Shinde M., Suryawanshi K., Kakade K., and More V. A. (2024). “Digital maize crop guardian: automated identification of fall armyworm infestation using computer vision,” in Agriculture Digitalization and Organic Production. Eds. Ronzhin A., Bakach M., and Kostyaev A. (Springer Nature, Singapore), 147–159. doi: 10.1007/978-981-97-4410-7_12
Upadhyay A., Chandel N. S., Singh K. P., Chakraborty S. K., Nandede B. M., Kumar M., et al. (2025). Deep learning and computer vision in plant disease detection: a comprehensive review of techniques, models, and trends in precision agriculture. Artif. Intell. Rev. 58, 92. doi: 10.1007/s10462-024-11100-x
Citation: Sandhya P, Venkataramana B, Kumar TP and Sujatha R (2025) Thermal and RGB image dataset for detection and management of Fall Army Worm (FAW) infestation in maize. Front. Agron. 7:1629681. doi: 10.3389/fagro.2025.1629681
Received: 16 May 2025; Accepted: 11 July 2025;
Published: 20 August 2025.
Edited by:
Shijun You, Fujian Agriculture and Forestry University, ChinaReviewed by:
Xinqing Xiao, China Agricultural University, ChinaMuheeb M. Awawdeh, Yarmouk University, Jordan
Copyright © 2025 Sandhya, Venkataramana, Kumar and Sujatha. This is an open-access article distributed under the terms of the Creative Commons Attribution License (CC BY). The use, distribution or reproduction in other forums is permitted, provided the original author(s) and the copyright owner(s) are credited and that the original publication in this journal is cited, in accordance with accepted academic practice. No use, distribution or reproduction is permitted which does not comply with these terms.
*Correspondence: B Venkataramana, dmVua2F0YXJhbWFuYS5iQHZpdC5hYy5pbg==