 Patricia I. Colusso
 Cameron E. F. Clark
 Lachlan J. Ingram2
 Peter C. Thomson
 Sabrina Lomax
- 1Livestock Production and Welfare, School of Life and Environmental Sciences, Faculty of Science, The University of Sydney, Camden, NSW, Australia
- 2Institute of Agriculture, School of Life and Environmental Sciences, Faculty of Science, The University of Sydney, Camden, NSW, Australia
- 3Sydney School of Veterinary Sciences, Faculty of Science, The University of Sydney, Camden, NSW, Australia
Pasture-based dairy systems rely on the accurate allocation of pasture to both meet livestock requirements and maintain the growth of herbage. Currently, physical fences are used to contain livestock however they can be labor-intensive to shift and maintain. Alternatively, virtual fence (VF) systems offer flexibility and real-time control of livestock location. Pre-commercial neckbands (eShepherd®, Agersens, Melbourne, VIC) emit a warning audio tone (AT) when a cow approaches a VF boundary, paired with an electrical pulse (EP) if the cow continues forward into the exclusion zone (EZ). However, the ability of VF technology to control animal location when pasture is restricted to the previous day's residual, remains unknown. Ten non-lactating Holstein-Friesian dairy cows were trained to use a VF system for 6 days before strip grazing a 1.2 ha paddock of annual ryegrass. Over 10 days the cows grazed eight pasture allocations at a pre-grazing pasture mass of 2,324 ± 81 kg DM/ha (mean ± SE) and post-grazing pasture-mass (post-grazing residual) of 1,649 ± 48 kg/DM/ha with a front VF. The allocations had a physical backing fence that included the fresh allocation and a small area of residual to cater for any GPS drift of the front VF. On each day, with the exception of days 5 and 10, the VF was moved forward, and the cows were provided a new pasture allocation. On days 5 and 10, the VF was not shifted, and cows were only offered the previous allocation's residual pasture. The location of each animal (inclusion, buffer, and exclusion zones) and number of stimuli (AT and EP) delivered were recorded. The number of stimuli delivered between the grazing and hold-off days was similar. Cows spent 89% of time within the inclusion zone (IZ), with significant peaks observed on day 5 and 10. Distance that cows traveled into the EZ reduced across time. There was also evidence of individual variation in the number of stimuli and thus time spent in each zone. Overall, the VF system was successful in containing the dairy cows during strip grazing even when only offered the previous days post-grazing residual.
Introduction
Pasture is the main feed source for dairy cattle in pasture-based systems in the southern hemisphere, due to the temperate climate and sufficient rainfall allowing an entirely outdoor, all year-round grazing system (Holmes et al., 2002b). On pasture-based dairy farms, the area and timing of pasture allocations differ to those used in beef systems, tending to be more intensive as they rely on the efficient conversion of pasture into milk (Clark et al., 2016). These systems are efficient in maintaining synchrony between feed demand to match the herd's energy requirements and the level of pasture growth minimizing surplus or deficits (Holmes et al., 2002a). Such pre- and post-grazing herbage mass informs decisions on the duration and area for livestock grazing (Garcia and Holmes, 2005). A minimum pre-grazing herbage mass target is required to ensure that the needs of cattle are met and to avoid overgrazing and a post-grazing herbage mass or residual is the target which the pasture will be grazed down to in order to avoid compromising pasture regrowth (Holmes et al., 2002a). Livestock management on this pasture is centered around successful animal containment behind fixed or temporary fences that physically prevent cows from accessing additional pasture.
Virtual fencing (VF) presents an alternative to physical fences with the opportunity for greater flexibility and remote control of livestock to alleviate the time and labor associated with physical fences (Colusso et al., 2021). A pre-commercial VF system (eShepherd®, Agersens, Melbourne, VIC) has been developed which uses a neck mounted device that employs an associative learning training method. This device delivers paired stimuli to control cow behavior and contain them within a determined location. The VF boundary is created using GPS coordinates through a web-based tool creates an inclusion zone (IZ) in which cattle can graze without receiving stimuli and an exclusion zone (EZ) from which they are being excluded from and will receive stimuli. A warning audio tone (AT) is emitted when a cow approaches the VF boundary, which is paired with an electrical pulse (EP) if the cow continues forward movement into the EZ. If the cow responds by either stopping or turning away all stimuli will cease. An AT always precedes an EP and previous studies have demonstrated that both dairy (Lomax et al., 2019; Langworthy et al., 2021; Verdon et al., 2021b) and beef cattle (Campbell et al., 2017, 2018a,b) can effectively learn the association between the stimuli and remain within a VF boundary. The focus of research to date has been on containing cattle from feed attractants (Campbell et al., 2018b; Colusso et al., 2020) and riparian areas (Campbell et al., 2018a), spatial utilization (Lomax et al., 2019; Langworthy et al., 2021), and the impacts of VF systems on animal welfare (Lee et al., 2018; Campbell et al., 2019; Verdon et al., 2021b). Previous findings suggest that cattle can be contained in the IZ for 97–99% of the time (Campbell et al., 2017; Lomax et al., 2019; Langworthy et al., 2021), however it is unknown how cows will respond when feed on offer is further restricted.
Strict pasture allocations, and subsequent depletion of the available pasture over time experienced in the dairy industry, has the potential to increase cow feed motivation from associated hunger (Colusso et al., 2021; Verdon et al., 2021b). This may alter cow behavior and thus their willingness to work for resources (Toates, 2002; Von Keyserlingk et al., 2017; Franchi et al., 2019) which may have implications for the containment of livestock using VF technology. An experiment evaluating the effect of two feed rations on dairy cow exclusion from a feed attractant in test paddocks reported restricted-fed cows received more stimuli as they broke through the VF to reach additional feed (Colusso et al., 2021). The implications of these findings on cattle grazing pasture are yet to be determined. The objectives of this experiment were therefore to (1) determine dairy cow response and exclusion from pasture in a strip grazing setting and (2) determine cow response and exclusion from pasture when cows are held back on the previous day's post-grazing residual. Spatial location and utilization of the IZ were also evaluated to assess the impact the VF had on spatial distribution. We hypothesized that there would be an increase in stimuli and time spent in the EZ when cows were held back on the residual as compared to the days when they were offered fresh pasture.
Materials and Methods
This experiment was conducted at The University of Sydney's research farm “Mayfarm” near Camden, NSW, Australia between June, and July 2019. All experimental protocols were approved by the University of Sydney's Animal Ethics Committee (Project 2018/1306).
Experimental Design
Ten non-lactating Holstein-Friesian dairy cows (7.1 ± 0.6 years old; 781 ± 16 kg body weight; 7.5 ± 0.2 mean ± SE months pregnant) were selected from the University's commercial dry cow herd. All cows were experienced with strip-grazing pasture but naïve to the VF neckbands and stimuli and had not been used in previous experiments.
Cows were habituated to the VF neckbands for 3 days. On day one, all cows were weighed (Gallagher G02601 TWI weigh scale, Gallagher Group Ltd., Hamilton, New Zealand) and spray marked with numbers on each side of the flank for identification purposes (Tell tail, GEA Fil Ltd., Mount Maunganui, New Zealand). While restrained in the cattle crush each cow was fitted with a neckband. Cows were then moved into home pen 1 (Figure 1) and remained for 3 days to habituate to the VF neckbands, which remained inactive during this time (Lomax et al., 2019; Colusso et al., 2020, 2021). During the habituation period the cows had ad libitum access to water and shade and were fed an amount of oaten hay (Dry matter 83%) to meet their energy requirements for maintenance and pregnancy (ARC, 1980; Moran, 2005), as determined by the following equation (Corbett et al., 1987):
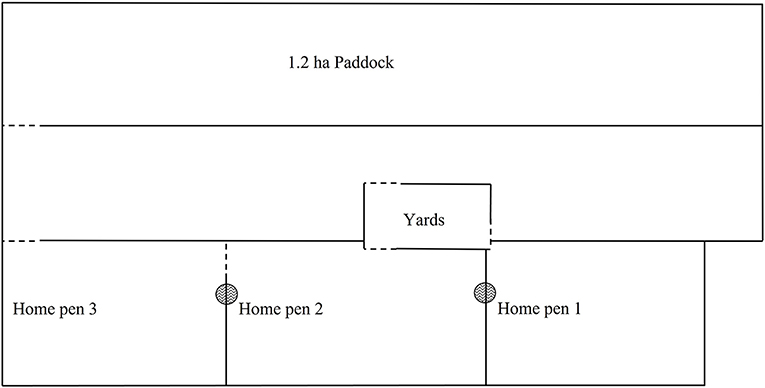
Figure 1. Experimental site (not to scale). The home pens were used to house cows during the neckband acclimatization and pasture regrowth periods. Water and shade were accessible in all home pens with a feed bunk in each used to feed out hay daily at maintenance level. The cattle yards were accessible from the home pens and contained multiple smaller pens and a cattle crush. The annual ryegrass paddock was used for both the training period and strip grazing.  water;
  fixed fence;
  gate way.
Virtual Fence Neckbands
Pre-commercial prototype neckbands (eShepherd™, Agersens Pty Ltd., Melbourne, VIC, Australia) which have been previously described in similar studies (Lomax et al., 2019; Colusso et al., 2021; Langworthy et al., 2021) were used in this experiment. The VF experimental prototype neckbands consist of a strap with a counterweight (total weight approximately 1.4 kg) and an electronic unit (approximately 725 g and 17 cm L × 12 cm W × 13 cm H) positioned on the top of each animal's neck, with two electrodes that contact the skin on the right side of the neck. The VF neckbands use a GPS module within the unit to monitor cow movement and provide real-time data on cow location, heading and speed. A VF boundary separating the IZ from the EZs is specified using GPS coordinates and which is transmitted to the unit using a radio frequency link (base station). As an animal reaches the VF boundary, the unit will emit a distinctive AT within the cow's hearing range (values are commercial in confidence). If the cow remains at that location (stops) or turns away, no EP is emitted. If the animal continues to move through the VF boundary into the EZ, the unit delivers a short, sharp pulse (EP) in the kilovolt range (values are commercial in confidence). This sequence of an AT followed by the EP is repeated if the animal continues through the VF and into the EZ. A grazing function is implemented to account for the natural grazing behavior that can mimic a cow correctly responding to an AT (slow movement forward with pauses). As the cow slowly reaches the VF the function will deliver a maximum of three consecutive AT's, followed by an EP if the cow continues its forward grazing (Langworthy et al., 2021). If a cow was moving above a specified velocity (values are commercial in confidence) a safeguard function would suspend the neckband from delivery any stimuli (Langworthy et al., 2021). The date, time, GPS location, and “stimuli event” which included where the cow was located in relation to the IZ and details of stimuli delivery, were recorded for later download from the unit.
Virtual Fence Training
On day four the cows were removed from the home pen and trained to the VF system and stimuli over a 6-day period on a 1.2 ha paddock of irrigated annual ryegrass (Lolium multiforum), as per Lomax et al. (2019) and Colusso et al. (2021). The paddock was then divided into two above maintenance allocations areas that were set at 3,000 kg DM/ha, with allocation 1 (A1) 4,356 m2 and allocation 2 (A2) 3,417 m2. The remainder of the paddock with 667 m2 of grazable pasture was not offered. A water trough was provided that was accessible by all cows across allocations (Figure 2).
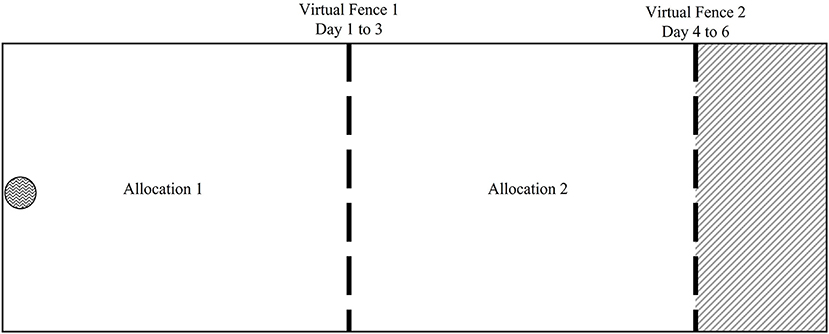
Figure 2. Diagrammatic representation (not to scale) of the training paddock used to train dairy cows in each block before experimental work, as seen in Colusso et al. (2021). The paddock was divided into three sections, allocation 1 (A1) and allocation 2 (A2). A1 was allocated for day 1–3 with the virtual fence 1 (VF1). At the end of day 3 the VF was moved forward to virtual fence two (VF2) to allow dairy cows access to A1 and A2. The remainder of the paddock (gray shaded area) remained unallocated, as it was the EZ for days 4–6. The water trough is indicated.  water;
  fixed fence;
  virtual fence;
  paddock not offered.
On day one of training, VF1 was activated in the morning to provide cows with access to allocation 1 (A1) for a total of 3 days. At the end of day three the VF1 was deactivated and VF2 was activated to provide the cows access to the residual of A1 in addition to the fresh pasture in A2 for three more days. At the end of day six the VF neckbands were deactivated, and the cows were returned to the home pen for 24 days to allow for pasture regrowth. During this period, cows were alternated between home pens 1–3 to avoid soil compaction and fed as per the acclimatization period.
Strip Grazing and Holding off Periods
Strip grazing was conducted on the 1.2 ha paddock of annual ryegrass, which was divided into nine areas that consisted of eight pasture allocations and an un-grazed area (Figure 3). The allocations were determined by pasture mass on offer, using the pre-calibrated RPM set to meet the daily maintenance energy requirement (111.3 ± 1.3 MJ DM/cow, equating to 11.1 ± 0.1 kg DM/cow) for the 10 cows. The pre-graze target of each allocation averaged at 2,324 ± 81 kg DM/ha with the post-graze residual target averaging at 1,649 ± 48 kg DM/ha. A second post-graze reading was taken only on the hold-off day 5 (allocation 4) and day 10 (allocation 8) averaging at 1,572 ± 21 kg DM/ha. The pre- and post-readings consisted of sampling across the allocation in a zig-zag transect with 55 reading points for greater estimation of the available pasture.
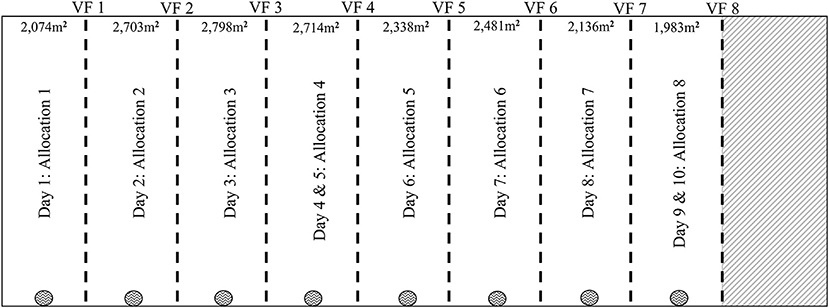
Figure 3. Diagrammatic representation (figure not to scale) of the 1.2 ha paddock for the 10-day grazing period. The paddock was divided into eight pasture strips averaged at 2,324 ± 80.51 kg/DM/ha. Each day except for day 5 and 10 the VF was moved forward, and the cows were given access to a fresh strip of pasture. On day 5 and 10 the VF was not moved, and the cows were only able to graze on the previous day's residual pasture. The area m2 estimates based on the VF and backing fence for each allocation. The backing fences for each allocation is not presented in this figure. fixed fence;  virtual fence;
  water trough placement;
  paddock not offered.
The VF was activated at the grazing front to contain cows from future fresh pasture allocations, and either a physical fence (physical external fencing of the paddock, Day 1) or a non-electrified polywire tape (days 2–10, not shown in figure) that was moved up with each allocation to prevent cows from accessing previous sections of the paddock. On average each allocation offered an area of 2,403 m2 that included an average of 1,223 m2 of fresh pasture and 1,180 m2 of residual from the previous day. The small residual that was included in each allocation area was to account for any differences between individual cow VF and/or for any GPS drift. One moveable water trough was shifted forward along the fixed fence with each new allocation offered, its position displayed in Figure 3.
All 10 cows were strip grazed as a group over a 10-day period. On every day except for days 5 and 10, the VF was shifted forward in the morning (07:30–08:00 h) to provide cows with a fresh pasture allocation. On days 5 and 10 the VF was not shifted, and the cows were only offered the previous day's residual pasture for 24 h.
Stimuli Data Processing
Date and time stamped GPS location (HH:MM:SS) and associated stimuli details (AT and EP) were recorded by the neckband. Neckbands were removed after the training period for data download and remained off until 2 days prior to strip grazing when they were placed back on the cows again. The neckbands were then removed at the end of the 10-day period of strip grazing for data collection. The process involved removing each neckband in the cattle crush to access the SD card. A logged text file was downloaded from the SD cards to produce an Excel® file (version 1908, 2016) and stacked and processed by cows and day as reported in Colusso et al. (2020, 2021). Briefly, the stimuli data was filtered to determine the total number of AT and EP each cow received per day. The grazing function ATs were included in the total sum. There was a total of 66 h of missing data points from a total of 2,400 hours, which reflects only 2.8% of SD data that was not captured.
Location Data Processing in ArcMap®
ArcMap v10.5 (ESRI, Redlands, CA) was used to determine the location of a cow relative to the VF as to ascertain if/when a cow crossed over the VF. In order to achieve this, it was necessary to determine the location of each individual cows VF on each day. This was determined by plotting the spatial coordinates of all ATs in Excel® for each cow per day and the furthest left and right GPS location (relative to the paddock entry point, Figure 1) were selected to represent the VF location for that cow and this was then repeated to give a total of 20 latitude and longitudes points for each day. All points were then averaged to produce a generalized location (latitude/longitude) of the left and right side of the VF which when joined together represented the VF for the entire herd on that day. In addition, the standard deviation (StdDev) of either side of the VF was also determined. This process was repeated for each of the 10 days of the study. The average and StdDev latitudinal and longitudinal locations were converted to Universal Transverse Mercator (UTM) Zone 56 S using Earth Point ®. The four variables were then imported into the below formula to determine the difference:
where aVF = averaged virtual fence coordinate (eastings or northings), and sdVF = corresponding standard deviations of coordinates of virtual fence.
The difference (in m) between the average and StdDev VF was then used to create a buffer zone (BZ) to account for variation between individual neckband VF locations. In Google Earth Pro ® (Version 7.3.3.7786) the VF points were used to draw a polygon of the IZ for each day. A second polygon was then drawn to account for the remaining area of the paddock and thus the EZ. The IZ and EZ polygons were then imported into ArcMap and joined to produce a single polygon of the paddock. The converted GPS data from the neckbands was imported and clipped to the paddock polygon to remove any spurious data points (“cleaned”). Spurious data points were identified as being outside the physical boundary of the 1.2 ha paddock, which the cows were unable to access. On average 3.6% ± 0.63 (ranging from 1.7 to 8.8%) of spurious GPS points were removed in this process.
The cleaned GPS datapoints were then determined to be in either the IZ or EZ polygons and the distance from the VF was calculated. This data was then exported to Excel® and the meter difference between the average and StdDev VF for each day was applied to the distance column and those data points were re-assigned to the BZ (mean ± SE, 8.4 m ± 1.1). This created three locations a data point could be located within: IZ, EZ, or BZ.
Locational Data Processing in RStudio®
The locational data were processed into bouts, defined as the duration of time a cow spent in a particular zone. These individual time intervals were calculated from the raw time data by the time between zone changes. The bout was designed to allow hourly analysis of cow location, speed, and distance into the EZ. If there were multiple consecutive time stamps found within the same zone, they were collapsed into a single bout. The total daily duration (24 h periods) each animal spent in each of the three zones across the 24 h period was also analyzed. The total duration was calculated by summing up each individual bout by zone within each day for each cow.
Density plots were created in R using the “smoothScatter” function. This function created a 2-D density plot for all cows, each day by working out the frequency of points in a local neighborhood, following kernel density smoothing. The density values were then plotted using a standard graphic plot.
Statistical Analysis
Statistical analyses were conducted in RStudio© (v1.2.5019) (Rstudio, 2015), an integrated development environment for R (v4.0.2) (R Core Team, 2020). Two data sets were used in the analysis: (1) stimuli count data of the AT, EP, and proportion of EP/AT, and the (2) locational data.
Stimuli count data were analyzed using two negative binomial generalized linear mixed models (GLMM) using the “lme4” package (Bates et al., 2015) with AT count and EP count as the response variables. Within these models, the fixed effects included day (1–10) with Cow ID as the random effect. A negative binomial model was used to account for the over dispersion of the count data. The proportion of EP to AT, i.e., the number of ATs resulting in EPs being delivered, was analyzed using a logistic GLMM with the fixed effects of Day (1–10) and Cow ID as the random effect. The cow standard deviation estimate of random effects (Cow ID) and its corresponding 95% confidence interval (CI) from the three models was used to assess the variation between cows in stimuli delivery.
All the locational data were analyzed with linear mixed models (LMM) using the “lme4” package. The duration of bouts and the speed within each zone was analyzed with two LMM with the fixed effects of zone (IZ, EZ, BZ), day (1–10) and time of day (0–23 h) including interactions, with a random effect of zone nested within cow ID. Nested random effect allowed between-cow differences to be explored both in overall bout duration, but also bout durations of individual cows across the three zones. Analysis was performed on log-transformed data to account for the positively skewed data and residual variance. For the speed LMM a constant of 0.05 m/s was added prior to transformation due to stationary bouts. The bout physical location was then plotted for each cow per day using a standard graphic plot.
Daily total duration in the IZ was analyzed by day (1–10), with cow ID as a random effect. The IZ was considered due to the data constraint, with majority of the observed time being within the IZ. To analyse distance into the EZ, a subset of the EZ data was used, with the fixed effects of day (1–10), time of day (0–23 h) with cow ID as a random effect. Analysis was performed on log-transformed data to account for the positively skewed data and unstable residual variance.
All model-based means for fixed effects were obtained using the “emmeans” package (Lenth, 2021) and pairwise comparisons using the cld function in the “multcomp” package (Hothorn et al., 2008).
The spatial utilization of areas throughout the IZ and spatial coordinate data were manipulated using the “sp” (Pebesma and Bivand, 2005; Bivand et al., 2013) and “geosphere” (Hijmans, 2019) packages. The GPS data have been analyzed on a per day basis, and records were filtered to only those within the inclusion area of the day. Each inclusion area was divided into a grid of 0.1 s (longitude) × 0.1 s (latitude), resulting in grid pixels of 1.63 × 3.09 m. This resulted in between 198 and 317 pixels per study period, depending on the inclusion area size. The number of observations within each pixel were calculated over each 1-day study period. Next, these counts were converted into proportions of observations within each of the n pixels for that study day, pi, i = 1, …, n. From these pixel proportions, the Shannon diversity index (H) was calculated as
Values of H increase with increasing number of pixels, but more importantly with more even distribution across the pixels. It may be considered as a measure of variability for categorical data, like the role of the standard deviation for quantitative data. The maximum diversity occurs when all pi are equal, i.e., all equal to 1/n, and this results in Hmax = logen. As the number of grid pixels differ across the 10 study days (i.e., across the 10 inclusion areas), it is preferable to compare spatial utilization using evenness, defined as E = H/Hmax. A value of E = 1 would indicate the cows use all parts of the inclusion area equally. Bootstrap standard errors of H and hence E were calculated by performing 1,000 re-samples form a multinomial distribution [N = total number of observations p = (p1, …, pn)] and re-calculating H and E at each sample, with the SE being the SD of these 1,000 values.
Results
Pasture Consumption Means
The mean ± SE estimated pasture consumption on hold-off days was 165 ± 0.0 kg DM/ha as compared to 675 ± 60.5 kg DM/ha for the grazing days.
Stimuli Data
There was no significant difference in the number of ATs delivered on the hold-off days as compared to the grazing days. There was a difference in the number of ATs delivered across days (P = 0.002, Table 1). Less ATs were delivered on Day 1 as compared to Days 2–9. The StdDev of the random effect of cow was identified with a CI of 0.35–0.89. The CI range was above 0 identifying significant variation between individual cows in the number of ATs delivered across days.
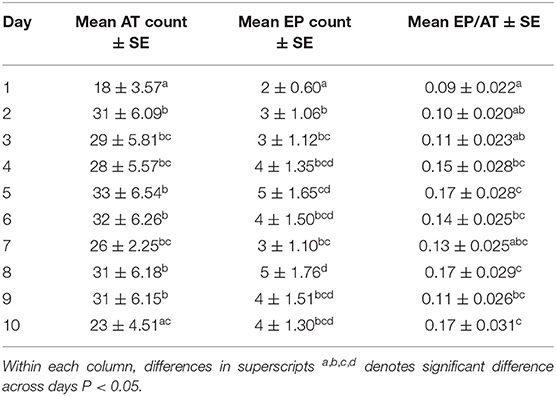
Table 1. Model-based mean number of audio tone (AT), mean number electrical pulse (EP), and model-based probability of that an AT resulted in an EP (EP/AT) ± standard error of the mean (SE) of all cows across days (1–10).
There was no difference in the number of EPs delivered on the hold-off days as compared to grazing days. However, there was a difference between days (P = 0.002, Table 1). The lowest number of EPs were delivered on Day 1 as compared to Days 2–10. The StdDev of the random effect of cow was identified with a CI 0.60–1.58 indicating variation between individual cows in the number of EPs delivered across days.
There was no difference in the proportion of EP/AT between hold-off days and grazing days. There was a difference across days (P = 0.005, Table 1). Day 1 had lower EP/AT as compared to Days 4, 5, 8, 9, and 10. The StdDev of the random effect of cow was identified with a CI of 0.28–0.84, indicating variation between individual cows in EP/AT across days.
Animal Location and Spatial Utilisation
Density plots of the herd location for each day of the experiment were created, to visualize where cows spent most of their time in each allocation. We have included plots from grazing Day 4 and the subsequent hold-off Day 5 to illustrate the similarity in herd density across days on the same pasture allocation (Figure 4). The darker the color represents a greater density of data points.
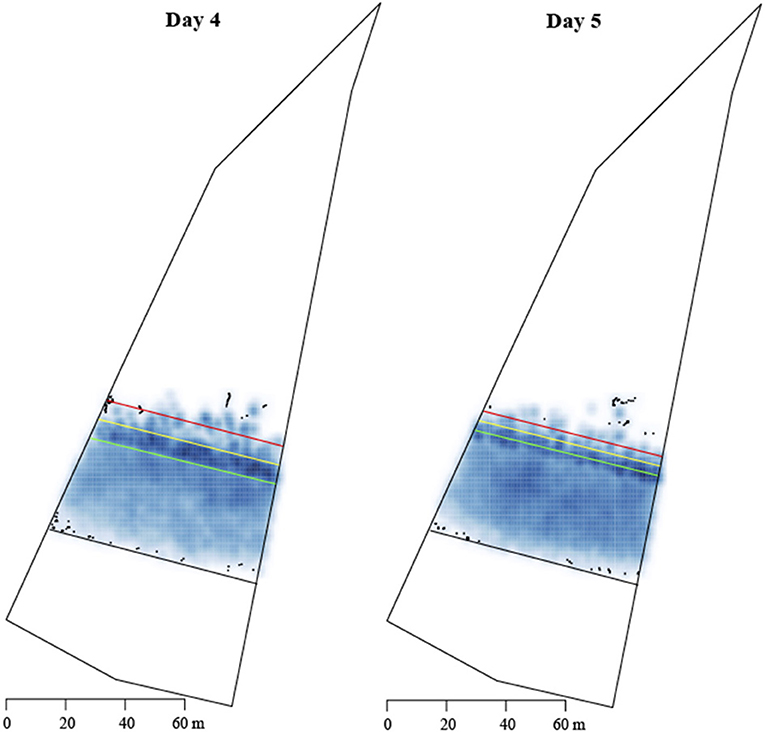
Figure 4. Density maps of all cows within the allocation 4 on a grazing day (Day 4, left) and a hold-off day (Day 5, right). Scale 0–60 m of the paddock. The clear dots represent an isolated point distant from any others and as such no smoothing has occurred. The zones are depicted with the colored lines.  inclusion zone;
  buffer zone;
  exclusion zone;
  physical fence.
Cow location by hour was plotted for every cow across all days using the bout per hour model. The GPS location by hour is visually presented as the location of one individual (cow 3) within the same allocation across Days 4 and 5 (Figure 5).
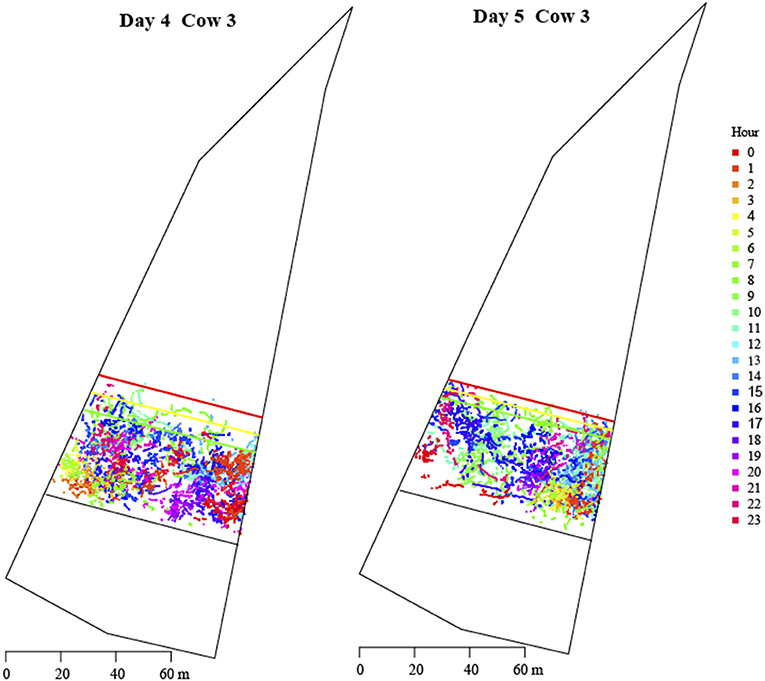
Figure 5. Location of cow 3 by hour for Day 4 (left) and Day 5 (right). The zones are depicted with the colored lines.  inclusion zone;
  buffer zone;
  exclusion zone;
  physical fence.
The evenness values, used to evaluate spatial utilization of the IZ, were high across all days with an average of E = 0.941 and SE = 0.0003, with variation due to the large numbers of observations. A value of E = 1 indicates cows used all parts of the IZ equally.
Daily Duration
There was no significant difference in the time spent in the EZ on the hold-off days as compared to the grazing days. The daily duration in the EZ across the experiment was low, with cows spending an average of 20 ± 5 min (range 4–44 min) in the EZ within each 24-h allocation (Figure 6). Time spent within the BZ changed significantly across the study (P < 0.001). Time spent in the BZ decreased from Day 6 in conjunction with increased time in the IZ (Figure 6). Cows spent more time in the IZ on the hold-off days as compared to the grazing days (P = 0.05). There were differences between individual animals in time spent in the IZ (average 21.5 ± 0.377 h, minimum 19.0 h and maximum 22.8 h, P < 0.001).
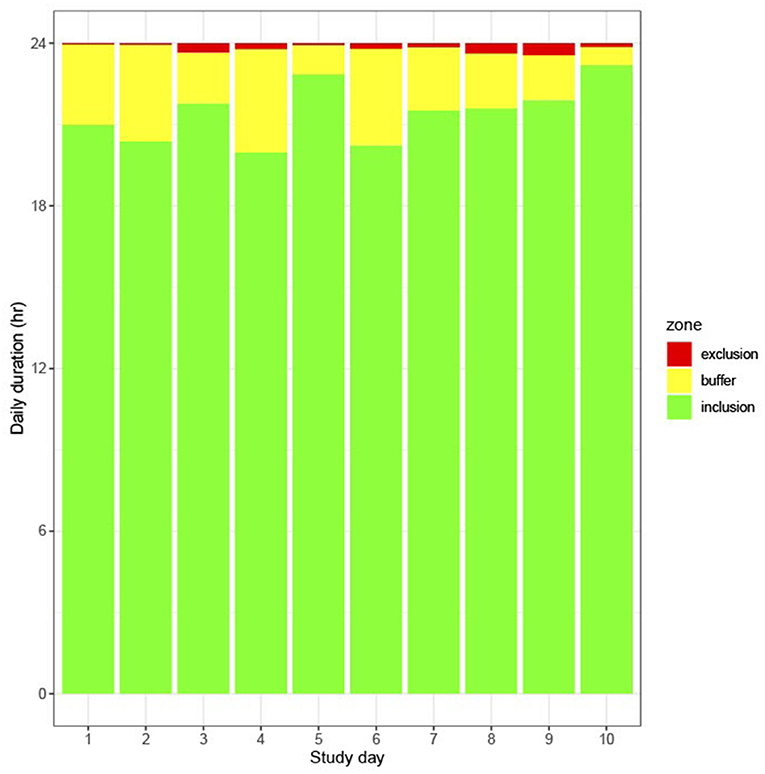
Figure 6. Daily duration spent in each zone across days (1–10) based on averages derived from the raw data.
Bout Duration
There were significant differences in bout duration (time between zone changes) across zones and days (zone × day P < 0.001). There was an increase in bouts in the IZ across the study period (Figure 7A), with more consecutive time spent in the IZ, and less transition into other zones. There was also a significant zone × hour interaction (P < 0.001), with peaks in time spent in the IZ between 01:00 and 02:00 and 17:00 and 18:00 h but without any corresponding peaks in activity in the other two zones (Figure 7B). There was significant variation in bout duration between cows (P < 0.001).
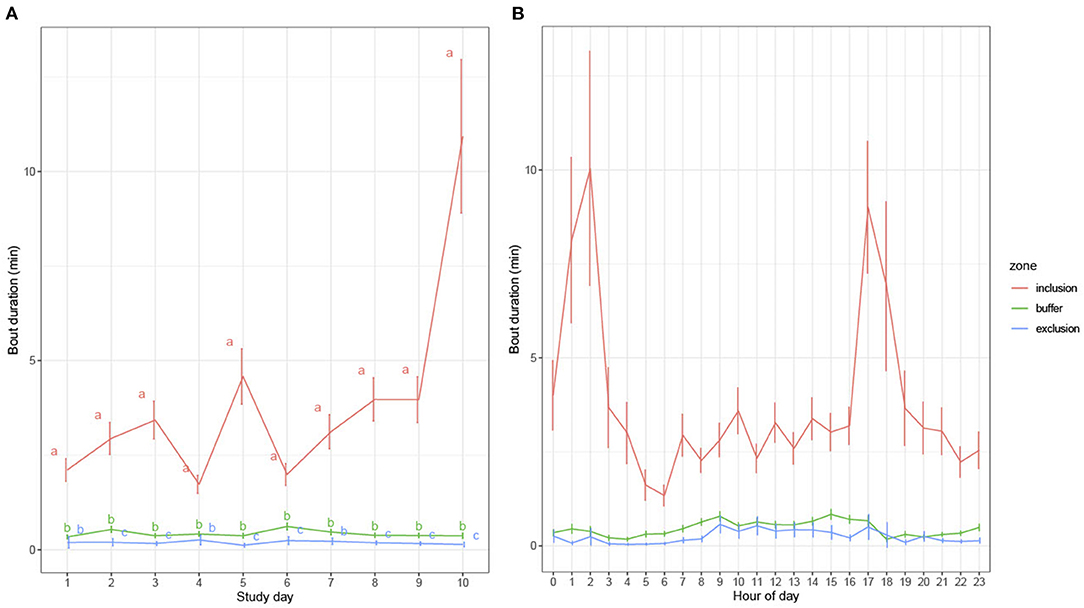
Figure 7. (A) Model-based mean bout duration (min) across zones by day (1–10). Differences in superscripts a, b, c denotes significant difference between days P < 0.05. (B) Model-based mean bout duration in each zone across hour of all days (1–10).
Distance Traveled Into the Exclusion Zone
The distance that cows traveled into the EZ reduced across the 10 days of the experiment (P < 0.001, Figure 8A), with cows moving <8 m into the EZ from day 5. Distance traveled into the EZ varied across hours of the day (P < 0.001), with cows moving a greater distance into the EZ in the 2-h period from 06:00 to 08:00 h (Figure 8B).
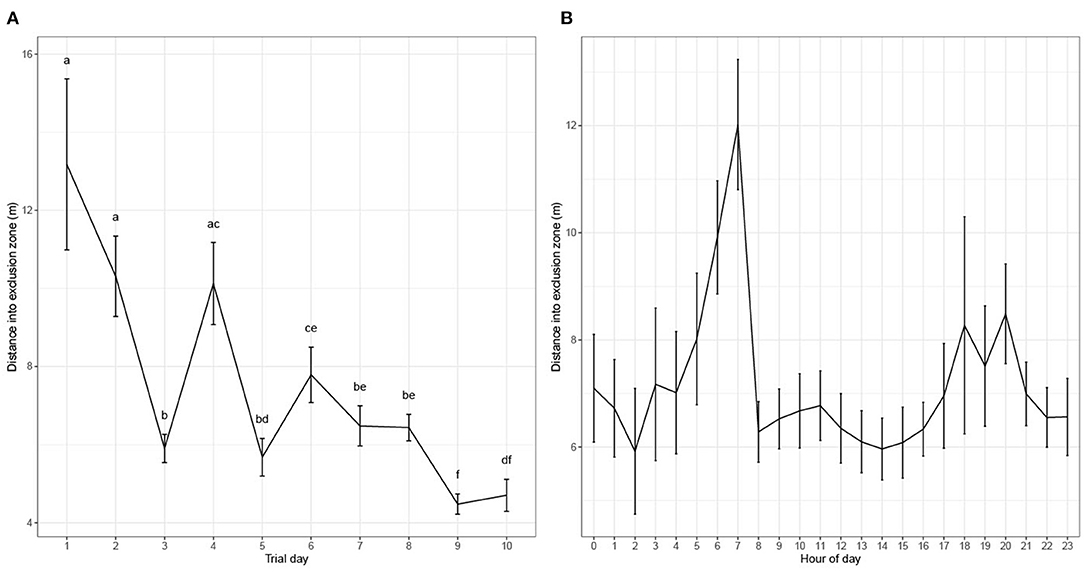
Figure 8. (A) Model-based mean maximum distance (m) cows entered into the exclusion zone by day (1–10). Differences in superscripts a, b, c, d, e, f denotes significant difference between days P < 0.05. (B) Model-based mean maximum distance (m) entered into the exclusion zone by hour of all days (1–10).
Cow Speed
There was a significant zone × hour interaction for speed of cow (P < 0.001), with speed above 0.1 m/s between 07:00 and 18:00 h. The greatest speed occurred in the EZ, followed by the BZ and then the IZ (Figure 9). There was overall variation in speed between cows (P < 0.001).
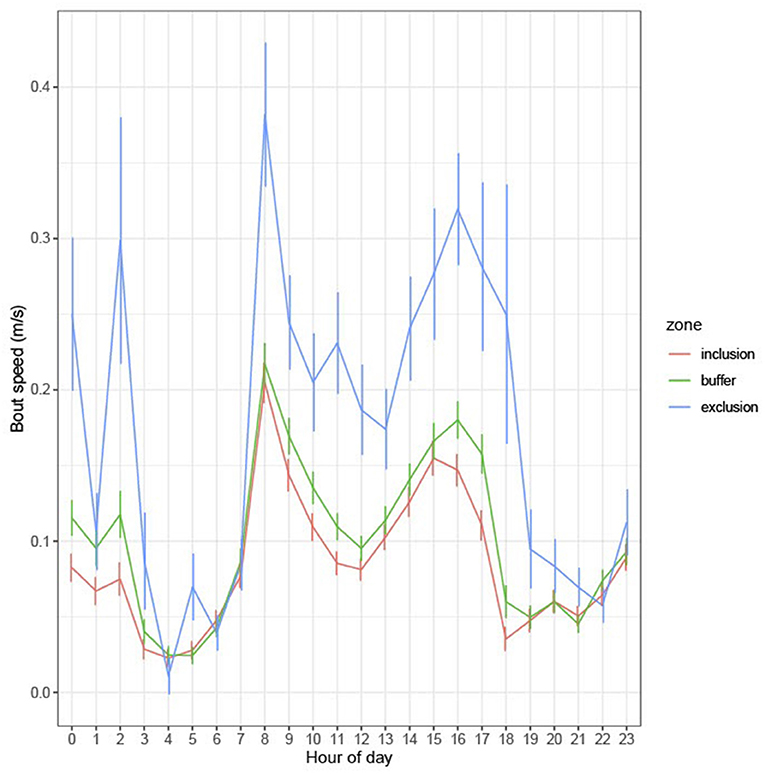
Figure 9. Model-based mean bout speed (m/s) in each zone by hour of all days (1–10).
Discussion
This experiment is the first to evaluate the effect of feed restriction on the use of a VF to exclude cows from fresh pasture. Contrary to our hypothesis, there was no difference in the number of stimuli delivered on the hold-off days as compared to the grazing days. Cows were contained within the IZ 89% of the time across the experiment. Overall, this experiment highlights the ability of using a front VF to contain grazing dairy cattle even when pasture is restricted to grazing the previous day's residual.
The dairy cows in this experiment were successfully contained within allocated grazing areas. We hypothesized that on days when cows were restricted to grazing the previous day's residual, increased motivation to access fresh pasture across the VF would result in more VF interactions and greater stimuli delivery. However, the stimuli delivery was similar between grazing days and hold-off days. Overall, the stimuli results demonstrate the ability of cattle to retain their learned response to a VF even when pasture on offer was limited. A low proportion of EPs to ATs indicates that cows have successfully learnt the association between stimuli, responding increasingly to the AT alone (Colusso et al., 2020, 2021). In the current study, ≤17% of all AT's required an EP, which aligns with our previous findings that dairy cows offered a restricted feed ration could be contained from a feed attractant in an artificial context (Colusso et al., 2021). There were less EPs delivered and a lower EP/AT on the first 3 days of the experiment as compared to the remaining days, likely due to cows adapting their learning to the new grazing scenario. There was a period of 24 days between the training and grazing phases of the experiment, in which cattle had to re-adjust to the VF system and in a more intense setting. We have previously reported a period of re-adjustment when cows were trained using the same protocol and tested in artificial scenarios (Colusso et al., 2021). Lomax et al. (2019) found that cow spent less time near the VF on the first day of grazing a new paddock, than on subsequent days and would graze closer to the VF across time. Similarly, beef heifers took 4.25 h to interact and learn a new VF location in a 6.15 ha paddock (Campbell et al., 2017), and dairy cows took 60 min in s 2,000 m2 artificial context (Colusso et al., 2021). In the current experiment there was an increase in stimuli delivery from day 3 which we attribute to an increase in exploratory behavior with cows grazing closer to the VF, resulting in a greater number of VF interactions. Additionally, cows were provided access to high quality oaten hay during the period between training and the experiment, which may also have influenced hunger on Day 1 through increased gut fill. Increased gut fill has been shown to decrease voluntary intake of available feed in sheep (Baumont et al., 1990) and cattle (Campling and Balch, 1961). Cows may not have spent as much time grazing on Days 1 and 2, however grazing behavior was not measured. Future research could use accelerometer-based sensors to record grazing, rumination, and activity across time (Campbell et al., 2017; Verdon et al., 2021b), to provide objective data of cow behavior.
Cattle spent 89% of their time in the IZ across the experiment. Accordingly, time spent in the EZ was low, with cows spending only 20 ± 5 min (range 4–44 min) in the EZ each day. Similar high levels of cattle containment have been reported for grazing beef cattle that spent 97% of their time in the IZ (Campbell et al., 2017), and 99% of the time for lactating (Langworthy et al., 2021) and non-lactating (Lomax et al., 2019) grazing dairy cows. The slightly lower value in the current experiment can be attributed to the inclusion of a BZ, where cows were located 9.8% of the time. The GPS location of the VF varied between cows with on average an 8.4 ± 1.1 m difference between all cows across days. Therefore, the BZ was included to account for this variation, and as such may include datapoints that fall within the IZ. The variation has operational implications for individual cow pasture access within and across days. In addition, cows traveled less distance into the EZ as they learnt the grazing routine. There were peaks in distance and speed into the EZ found between 06:00 and 08:00 h (Figures 8B, 9) aligning with the VF changes between 07:30 and 08:00 h. Depending on neckband connectivity with the base station there was an average delay of 20 ± 4.5 min between the first and last neckband receiving a new fence. We observed that some cows would receive the new VF and move into the next allocation and begin grazing, which would attract others to move forward, even if their fence had not yet changed. Cows moved into the EZ during the VF changes which may have been influenced by conspecifics, therefore this did not occur on the hold-off days when the fence was not moved. Contrary to our hypothesis, cows spent more time within the IZ on the hold-off days as compared to the grazing days. We reported similar findings for cows fed a restricted ration and withheld from a feed attractant in an artificial context, where cows increasingly remained within the IZ across four tests (Colusso et al., 2021). It is likely that cows reduced their interactions with the VF when it was not moved as compared to when it was moved forward. In the current study the level of feed restriction was limited to a 24 h period and thus longer periods would need to be evaluated in the future to account for extreme climatic events such as droughts (Chang-Fung-Martel et al., 2017). Future research should also evaluate lactating cows that have a higher metabolic demand to account for the on-farm variations of feed requirements and motivation.
Locational avoidance of the VF that has previously been reported (Campbell et al., 2018b; Lomax et al., 2019) was not observed in the current study, as evidenced by the evenness of cow location and spatial utilization. Lomax et al. (2019) reported that cows underutilized the space near the VF on the first day of grazing within a VF system, which increased across time. The density plot in Figure 4 displays a high density of points along the VF and BZ areas on Day 4, which suggests that cows not only weren't avoiding the VF location but were grazing at and across the VF. Langworthy et al. (2021) reported that lactating dairy cows grazed the area near a VF equally as compared to other areas of the IZ. In our experiment, movement across the VF into the EZ may have been influenced by the neckband's grazing function, which controls for grazing behavior with an alternative stimuli delivery pattern (Langworthy et al., 2021), allowing cows to graze further into the EZ before receiving a EP. This function may have also further contributed to the difference in daily duration between the grazing vs. hold-off days. Spatial evenness analysis demonstrated equal spatial utilization of each IZ across the experimental period. Therefore, the use of a VF in this experiment did not impact on how cows utilized the allocated space, suggesting there would be no impact on efficient pasture utilization. However, pasture utilization was not directly measured as we only estimated pasture depletion so future work should focus on this. The absence of locational avoidance and even utilization of each allocation is important for ensuring continued herd productivity in pasture-based dairy systems using a VF.
There was a diurnal pattern to cow movement and location within each allocation aligning with literature on the time budget of grazing cattle (Kilgour, 2012; Kilgour et al., 2012). A study that observed beef cattle at pasture, identified three varying diurnal patterns across six beef cattle herds, that consisted of grazing peaks in the morning (06:00 h) and late afternoon (18:00 h), a third in the middle of the day (11:00–12:00 h) and a gradual increase in grazing across the day, with the highest at the last recording point (18:00 h) (Kilgour et al., 2012). In the current experiment there were peaks in time spent in the IZ between 01:00 and 02:00 and 17:00 and 18:00 h and a decrease in speed to below 0.1 m/s in all zones between 02:00 and 06:00 h and 19:00–22:00 h coinciding with the likelihood cattle were resting and ruminating, preceding, or following bouts of activity such as grazing. Grazing tends to occur during the daylight hours averaging at around 4.5–9.3 h total duration, with resting bouts of only 2.0–3.5 h, and a strong tendency for rumination to occur more at night than during the day light hours (Kilgour, 2012). Both distance into the EZ and speed increased in the morning hours, just before and around the time of the VF changes and again in the afternoon (13:00–17:00) coinciding with peaks in grazing behaviors (Kilgour et al., 2012). We also observed cows to be waiting and interacting with the VF around the morning fence change period. An observer was present each morning to monitor the VF change and conduct pasture readings, which suggests an additional level of associative learning may have occurred in which the presence of the human observer was linked with the VF shift. In this experiment the stocking density in each allocation was greater than that of Kilgour et al. (2012) and the pasture was further restricted and controlled by regular VF changes which may have influenced grazing and resting behaviors to occur relative to when fresh pasture was offered. The density by hour plot in Figure 5 illustrates a difference in cow location within an allocation across a day, between a grazing and hold-off day. The diurnal patterns of cow location and associated behaviors are important to understand when using VF technology, as 100% containment is not possible (Langworthy et al., 2021), and the key grazing periods may influence the number of VF interactions if timing of allocations do not align with these natural patterns. Therefore, timing VF changes to align with peak grazing periods could optimize pasture management and minimize stimuli delivery.
There was variation between individual cows in the number of stimuli delivered, time spent within the IZ, bout duration, bout duration across the zones, and overall animal speed. Similarly, individual variation in cow learning of and response to a VF, and VF stimuli delivery have been reported for beef cattle (Lee et al., 2009; Campbell et al., 2018b) and dairy cattle (Lomax et al., 2017, 2019). Animal variation may be attributed to differences in temperament (Finkemeier et al., 2018), motivational states (Toates, 2002), and sensitivity levels or reactiveness to the EP (Norell et al., 1983; Quigley and Sanderson, 1990). The variation in bout duration across zones may be attributed to resource competition, with some cows having a greater motivation to graze at the VF and in the EZ compared to others, as has been reported in feed attractant trials (Campbell et al., 2018b; Verdon et al., 2020). Differences in cattle motivational states, metabolic drive, and willingness to work to gain access to feed has been identified in the literature (Schütz et al., 2006; Cooper et al., 2010; Greter et al., 2015). There is evidence that social learning plays a role in the number of stimuli a cow may receive, with observations of herd level response to an individual's reaction to receiving a stimulus (Campbell et al., 2018b; Colusso et al., 2020; Langworthy et al., 2021). This may have contributed to the differences seen in time spent in the IZ, as some cows may have watched others interact with the VF rather than doing so themselves. There is potential for the social pull and push of the herd influencing where and how long cows spend in certain locations. It was anecdotally observed that a dominant cow would regularly push a subordinate cow forward, toward the VF, and watch the subordinate receive stimuli. Future work should investigate the social motivation and pull-push dynamics within a herd of grazing dairy cattle and how this may influence VF interactions and containment (Verdon et al., 2021a).
Conclusions
We have demonstrated that cows can be successfully contained from fresh pasture on a residual allocation for a 24-h period using a VF. The current limitations of the GPS accuracy and the different functions need to be considered when allocating pasture for intensive systems. Future research should evaluate pasture restrictions for either a longer period or with less available pasture to understand the level of effectiveness this system will have during extreme climatic conditions such as drought. Additionally, the effect of social motivation to remain with conspecifics and pull-push dynamics will need to be further explored to inform use of VFs for a range of farm management practices.
Data Availability Statement
The raw data supporting the conclusions of this article will be made available by the authors, without undue reservation.
Ethics Statement
The animal study was reviewed and approved by Animal Ethics Committee The University of Sydney.
Author Contributions
CC, SL, and PC: conceptualization and methodology. PC, PT, and LI: formal analysis and data curation. PC: writing—original draft preparation. PC, CC, LI, PT, and SL: writing—review and editing. SL: project administration. CC: funding acquisition. All authors have read and agreed to the published version of the manuscript.
Funding
This research was supported by the Australian Commonwealth Government through their Department of Agriculture, Water, and the Environment as part of its Rural R&D for Profit program.
Conflict of Interest
The authors declare that the research was conducted in the absence of any commercial or financial relationships that could be construed as a potential conflict of interest.
Publisher's Note
All claims expressed in this article are solely those of the authors and do not necessarily represent those of their affiliated organizations, or those of the publisher, the editors and the reviewers. Any product that may be evaluated in this article, or claim that may be made by its manufacturer, is not guaranteed or endorsed by the publisher.
Acknowledgments
The authors would like to thank the University of Sydney's undergraduate students who assisted in field work, cattle husbandry procedures, and data collection. Thank you to the farm staff at Mayfarm for their support provided during the experimental period.
References
ARC. (1980). The Nutrient Requirements of Ruminant Livestock: Technical Review by an Agricultural Research Council Working Party. Slough, UK: Commonwealth Agricultural Bureaux.
Bates, D., Mächler, M., Bolker, B., and Walker, S. (2015). Fitting linear mixed-effects models using lme4. J. Stat. Softw. 67, 1–48. doi: 10.18637/jss.v067.i01
Baumont, R., Malbert, C. H., and Ruckebusch, Y. (1990). Mechanical stimulation of rumen fill and alimentary behaviour in sheep. Anim. Sci. 50, 123–128. doi: 10.1017/S0003356100004529
Bivand, R. S., Pebesma, E., and Gomez-Rubio, V. (2013). Applied spatial data analysis with R, Second edition. NY: Springer. Available online at: https://asdar-book.org/.
Campbell, D. L. M., Haynes, S. J., Lea, J. M., Farrer, W. J., and Lee, C. (2018a). Temporary exclusion of cattle from a Riparian zone using virtual fencing technology. Animals 9, 1–12. doi: 10.3390/ani9010005
Campbell, D. L. M., Lea, J. M., Farrer, W. J., Haynes, S. J., and Lee, C. (2017). Tech-savvy beef cattle? How heifers respond to moving virtual fence lines. Animals 7, 1–12. doi: 10.3390/ani7090072
Campbell, D. L. M., Lea, J. M., Haynes, S. J., Farrer, W. J., Leigh-Lancaster, C. J., and Lee, C. (2018b). Virtual fencing of cattle using an automated collar in a feed attractant trial. Appl. Anim. Behav. Sci. 200, 71–77. doi: 10.1016/j.applanim.2017.12.002
Campbell, D. L. M., Lea, J. M., Keshavarzi, H., and Lee, C. (2019). Virtual fencing is comparable to electric tape fencing for cattle behavior and welfare. Front. Vet. Sci. 6, 445–445. doi: 10.3389/fvets.2019.00445
Campling, R. C., and Balch, C. C. (1961). Factors affecting the voluntary intake of food by cows: 1. Preliminary observations on the effect, on the voluntary intake of hay, of changes in the amount of the reticulo-ruminal contents. Brit. J. Nutr. 15, 523–530. doi: 10.1079/BJN19610065
Chang-Fung-Martel, J., Harrison, M. T., Rawnsley, R., Smith, A. P., and Meinke, H. (2017). The impact of extreme climatic events on pasture-based dairy systems: a review. Crop Past. Sci. 68, 1158. doi: 10.1071/CP16394
Clark, C. E. F., Farina, S. R., Garcia, S. C., Islam, M. R., Kerrisk, K. L., and Fulkerson, W. J. (2016). A comparison of conventional and automatic milking system pasture utilization and pre- and post-grazing pasture mass. Grass For. Sci. 71, 153–159. doi: 10.1111/gfs.12171
Colusso, P. I., Clark, C. E. F., Green, A. C., and Lomax, S. (2021). The effect of a restricted feed ration on dairy cow response to containment from feed using a virtual fence. Front. Anim. Sci. 2, 710648. doi: 10.3389/fanim.2021.710648
Colusso, P. I., Clark, C. E. F., and Lomax, S. (2020). Should dairy cattle be trained to a virtual fence system as individuals or in groups? Animals 10, 1767. doi: 10.3390/ani10101767
Cooper, M. D., Arney, D. R., and Phillips, C. J. C. (2010). The motivation of high- and low-yielding dairy cows to obtain supplementary concentrate feed. J. Vet. Behav. 5, 75–81. doi: 10.1016/j.jveb.2009.09.045
Corbett, J. L., Freer, M., and Graham, N. M. (1987). “A generalised equation to predict the varying maintenance metabolism of sheep and cattle,” in Energy Metabolism of Farm Animals. Proceedings 10th Symposium, Vol. 32 (Airlie, VA: European Association for Animal Production), 62–65.
Finkemeier, M.-A., Langbein, J., and Puppe, B. (2018). Personality research in mammalian farm animals: concepts, measures, and relationship to welfare. Front. Vet. Sci. 5, 131. doi: 10.3389/fvets.2018.00131
Franchi, G. A., Herskin, M. S., and Jensen, M. B. (2019). Dairy cows fed a low energy diet before dry-off show signs of hunger despite ad libitum access. Sci. Rep. 9, 16159–16159. doi: 10.1038/s41598-019-51866-7
Garcia, S., and Holmes, C. (2005). Seasonality of calving in pasture-based dairy systems: its effects on herbage production, utilisation and dry matter intake. Aust. J. Exp. Agric. 45, 1–9. doi: 10.1071/EA00110
Greter, A. M., Miller-Cushon, E. K., McBride, B. W., Widowski, T. M., Duffield, T. F., and DeVries, T. J. (2015). Short communication: limit feeding affects behavior patterns and feeding motivation of dairy heifers. J. Dairy Sci. 98, 1248–1254. doi: 10.3168/jds.2014-8879
Hijmans, R. J. (2019). Geosphere: Spherical Trigonometry. R Package Version 1.5–10. Available online at: https://CRAN.R-project.org/package=geosphere (accessed July 18, 2021).
Holmes, C. W., Brookes, I. M., Garrick, D. J., Mackenzie, D. D. S., Parkinson, T. J., and Wilson, G. F. (2002a). Milk Production From Pasture. Palmerston North: NZ Massey University, 33–49.
Holmes, C. W., Brookes, I. M., Garrick, D. J., Mackenzie, D. D. S., Parkinson, T. J., and Wilson, G. F. (2002b). Milk Production From Pasture. Palmerston North: NZ Massey University, 53–68.
Hothorn, T., Bretz, F., and Westfall, P. (2008). Simultaneous inference in general parametric models. Biom. J. 50, 346–363. doi: 10.1002/bimj.200810425
Kilgour, R. J. (2012). In pursuit of “normal”: a review of the behaviour of cattle at pasture. Appl. Anim. Behav. Sci. 138, 1–11. doi: 10.1016/j.applanim.2011.12.002
Kilgour, R. J., Uetake, K., Ishiwata, T., and Melville, G. J. (2012). The behaviour of beef cattle at pasture. Appl. Anim. Behav. Sci. 138, 12–17. doi: 10.1016/j.applanim.2011.12.001
Langworthy, A. D., Verdon, M., Freeman, M. J., Corkrey, R., Hills, J. L., and Rawnsley, R. P. (2021). Virtual fencing technology to intensively graze lactating dairy cattle. I: Technology efficacy and pasture utilization. J. Dairy Sci. 104, 7071–7083. doi: 10.3168/jds.2020-19796
Lee, C., Colditz, I. G., and Campbell, D. L. M. (2018). A framework to assess the impact of new animal management technologies on welfare: a case study of virtual fencing. Front. Vet. Sci. 5, 187–187. doi: 10.3389/fvets.2018.00187
Lee, C., Henshall, J. M., Wark, T. J., Crossman, C. C., Reed, M. T., Brewer, H. G., et al. (2009). Associative learning by cattle to enable effective and ethical virtual fences. Appl. Anim. Behav. Sci. 119, 15–22. doi: 10.1016/j.applanim.2009.03.010
Lenth, R. (2021). emmeans: Estimated Marginal Means, aka Least-Squares Means. R Package Version 1.6.3. Available online at: https://CRAN.R-project.org/package=emmeans (accessed July 18, 2021).
Lomax, S., Colusso, I. P., Gargulio, J., and Clark, C. E. F. (2017). “Determining learning and behavioural response to a virtual fence for dairy cows,” in European Conference on Precision Livestock Farming (Nantes).
Lomax, S., Colusso, P., and Clark, C. E. F. (2019). Does virtual fencing work for grazing dairy cattle? Animals 9, 429. doi: 10.3390/ani9070429
Moran, J. (2005). Tropical Dairy Farming : Feeding Management for Small Holder Dairy Farmers in the Humid Tropics. Melbourne, VIC: CSIRO Publishing. doi: 10.1071/9780643093133
Norell, R. J., Gustafson, R. J., Appleman, R. D., and Overmier, J. B. (1983). Behavioral studies of dairy cattle sensitivity to electrical currents. Trans. ASAE 26, 1506–1511. doi: 10.13031/2013.34160
Pebesma, E. J., and Bivand, R. S. (2005). Classes and methods for spatial data in R. R News 5, 9–13. Available online at: https://CRAN.R-project.org/doc/Rnews/.
Quigley, T. M., and Sanderson, H. R. (1990). Livestock control with electrical and audio stimulation. Rangelands 12, 152–155.
R Core Team. (2020). R: A Language and Environment for Statistical Computing. Vienna: R Foundation for Statistical Computing.
Schütz, K., Davison, D., and Matthews, L. (2006). Do different levels of moderate feed deprivation in dairy cows affect feeding motivation? Appl. Anim. Behav. Sci. 101, 253–263. doi: 10.1016/j.applanim.2006.02.008
Toates, F. (2002). “Physiology, motivation and the organization of behaviour,” in The Ethology of Domestic Animals : An Introductory Text, 3rd Edn., ed P. Jensen (Wallingford, CT; Oxfordshire, UK: CABI), 31–50. doi: 10.1079/9780851996028.0031
Verdon, M., Horton, B., and Rawnsley, R. (2021a). A case study on the use of virtual fencing to intensively graze angus heifers using moving front and back-fences. Front. Anim. Sci. 2, 663963. doi: 10.3389/fanim.2021.663963
Verdon, M., Langworthy, A., and Rawnsley, R. (2021b). Virtual fencing technology to intensively graze lactating dairy cattle. II: Effects on cow welfare and behavior. J. Dairy Sci. 104, 7084–7094. doi: 10.3168/jds.2020-19797
Verdon, M., Lee, C., Marini, D., and Rawnsley, R. (2020). Pre-exposure to an electrical stimulus primes associative pairing of audio and electrical stimuli for dairy heifers in a virtual fencing feed attractant trial. Animals 10, 217. doi: 10.3390/ani10020217
Keywords: virtual fence (VF), audio tone (AT), electrical pulse (EP), dairy cattle, pasture, strip grazing, residual
Citation: Colusso PI, Clark CEF, Ingram LJ, Thomson PC and Lomax S (2021) Dairy Cattle Response to a Virtual Fence When Pasture on Offer Is Restricted to the Post-grazing Residual. Front. Anim. Sci. 2:791228. doi: 10.3389/fanim.2021.791228
Received: 08 October 2021; Accepted: 17 November 2021;
Published: 10 December 2021.
Edited by:
Oleksiy Guzhva, Swedish University of Agricultural Sciences, SwedenReviewed by:
Anders Henrik Herlin, Swedish University of Agricultural Sciences, SwedenEd Pajor, University of Calgary, Canada
Copyright © 2021 Colusso, Clark, Ingram, Thomson and Lomax. This is an open-access article distributed under the terms of the Creative Commons Attribution License (CC BY). The use, distribution or reproduction in other forums is permitted, provided the original author(s) and the copyright owner(s) are credited and that the original publication in this journal is cited, in accordance with accepted academic practice. No use, distribution or reproduction is permitted which does not comply with these terms.
*Correspondence: Patricia I. Colusso, cGF0cmljaWEuY29sdXNzb0BzeWRuZXkuZWR1LmF1