 Erik Versluijs1†*
 Laura J. Niccolai1†
 Mélanie Spedener1
 Barbara Zimmermann1
 Anna Hessle2Morten Tofastrud3
 Olivier Devineau1
 Alina L. Evans1
- 1Inland Norway University of Applied Sciences, Department of Forestry and Wildlife Management, Campus Evenstad, Koppang, Norway
- 2Swedish University of Agricultural Sciences, Department of Animal Environment and Health, Skara, Sweden
- 3Inland Norway University of Applied Sciences, Department of Agricultural Sciences, Campus Blæstad, Hamar, Norway
Precision farming technology, including GPS collars with biologging, has revolutionized remote livestock monitoring in extensive grazing systems. High resolution accelerometry can be used to infer the behavior of an animal. Previous behavioral classification studies using accelerometer data have focused on a few key behaviors and were mostly conducted in controlled situations. Here, we conducted behavioral observations of 38 beef cows (Hereford, Limousine, Charolais, Simmental/NRF/Hereford mix) free-ranging in rugged, forested areas, and fitted with a commercially available virtual fence collar (Nofence) containing a 10Hz tri-axial accelerometer. We used random forest models to calibrate data from the accelerometers on both commonly documented (e.g., feeding, resting, walking) and rarer (e.g., scratching, head butting, self-grooming) behaviors. Our goal was to assess pre-processing decisions including different running mean intervals (smoothing window of 1, 5, or 20 seconds), collar orientation and feature selection (orientation-dependent versus orientation-independent features). We identified the 10 most common behaviors exhibited by the cows. Models based only on orientation-independent features did not perform better than models based on orientation-dependent features, despite variation in how collars were attached (direction and tightness). Using a 20 seconds running mean and orientation-dependent features resulted in the highest model performance (model accuracy: 0.998, precision: 0.991, and recall: 0.989). We also used this model to add 11 rarer behaviors (each< 0.1% of the data; e.g. head butting, throwing head, self-grooming). These rarer behaviors were predicted with less accuracy because they were not observed at all for some individuals, but overall model performance remained high (accuracy, precision, recall >98%). Our study suggests that the accelerometers in the Nofence collars are suitable to identify the most common behaviors of free-ranging cattle. The results of this study could be used in future research for understanding cattle habitat selection in rugged forest ranges, herd dynamics, or responses to stressors such as carnivores, as well as to improve cattle management and welfare.
1 Introduction
Livestock grazing, whether in intensive (feed lots and pastures) or extensive (free-range) systems is a traditional practice that has persisted in our modern society to cope with increasing food production demands (Michalk et al., 2019; Komarek et al., 2021). Within this tradition, the ever-expanding development of modern technology has allowed for the growth of precision livestock farming management and research (Eastwood et al., 2017). Indeed, this management approach focuses on the fine-scale monitoring of individuals’ health and food intake (Schellberg et al., 2008; Werkheiser, 2018). While it remains relatively easy to implement in barn and pasture settings, free-range farming presents additional challenges; herd supervision can become more difficult as cattle are not contained. Additionally, external factors affecting cattle such as exposure to climatic extremes, parasitic load, untreated diseases, accidents, and potential carnivore effects are complex to monitor (Hutchings et al., 2000; Silanikove, 2000; Sevi et al., 2009; Nedeva, 2020). Technological advances such as biosensors, camera-equipped drones and GPS collars have offered scientists, managers and farmers tools to address those challenges (Herlin et al., 2021).
Notably, modern GPS collars, which often contain accelerometry sensors, provide researchers with an opportunity for non-invasive, low maintenance and remote monitoring of livestock and wildlife. If properly calibrated, this allows for the study of fine-scale animal behavior, activity budgets and energy expenditure on an individual level (Vázquez Diosdado et al., 2015; O’Leary et al., 2020; Mulvenna et al., 2022). Even though accelerometry data has largely increased our understanding and knowledge of livestock behavior (Theurer et al., 2013; Uenishi et al., 2021), most behavioral studies using accelerometry sensors focus on a few key behaviors such as grazing, resting, and walking (Robért et al., 2011; Homburger et al., 2014; Benaissa et al., 2019), and they are conducted in controlled settings such as barns and pastures (Homburger et al., 2014; Hendriks et al., 2020; Rodriguez-Baena et al., 2020).
Very few studies examine the behavior of free-ranging cattle in remote areas, where cattle are difficult to monitor and observe due to them moving over large areas and using dense vegetation types (Tofastrud et al., 2019). Yet, in these conditions, behaviors such as vigilance, social behaviors or grooming can be representative of stress, as cows have been reported to increase vigilance when stressed (Welp et al., 2004), and to decrease milk production when separated from the herd and not allowed to perform social behaviors (Hedlund and Løvlie, 2015). In addition, self and allogrooming are reported to be frequent as maintenance behaviors and shown to be an important proxy for welfare (Kohari et al., 2007). While these behaviors are important to monitor, they are especially difficult to observe. Tofastrud et al. (2018) used two-axial accelerometry data at five-minute intervals on free-ranging cattle to study resting, grazing and movement activity patterns. Although this allows for insight into general free-ranging cattle behavioral habits in remote areas, it lacks the ability to precisely quantify additional, rarer behaviors and restricts the amount of information capable of being calibrated and further studied. Continuous, high resolution (10Hz) tri-axial accelerometry data can potentially increase the number of behaviors that can be classified and provide more detailed information about cattle behavior in large rugged, forested ranges (Hounslow et al., 2019). Such studies could contribute to the improvement of farmer monitoring systems related to high precision farming in outfields and offer the possibility to study effects from external factors, such as carnivores, on cattle behavior while monitoring welfare.
There are numerous ways to analyze accelerometry data, ranging from simple decision trees to complex neural networks (Riaboff et al., 2022). Most studies utilize supervised machine learning methods such as random forest (de Weerd et al., 2015; Williams et al., 2020; Riaboff et al., 2022), while others use unsupervised machine learning such as hidden Markov Models (Leos-Barajas et al., 2017; Chimienti et al., 2021; Rautiainen et al., 2022). Supervised methods provide the advantage of allowing for accelerometry data to be calibrated on actual behavioral observations, which then allows for prediction of behaviors based on collected data.
Feature selection is the first step in this process. Features can be calculated and extracted from raw accelerometry data and be used for behavioral classification. Orientation dependent features, such as the mean and variance of the raw x, y, z values, body pitch roll, yaw and dynamic acceleration (Figure 1) remain sensitive to the sensor’s orientation (Abell et al., 2017; Benaissa et al., 2019). For example, even though collars are assumed to be stationary positioned on the animal, there can be noise related to rotation, collar deployment errors, and other causes. This may result in additional variability in orientation-dependent features, which may render these features unusable without correcting for orientation (Williams et al., 2017; Barker et al., 2018; Kamminga et al., 2018). This sensitivity can be challenging when standardizing accelerometer sensor placement during animal handling, and recapturing individuals to manually fix issues is difficult (Chakravarty et al., 2019; Cade et al., 2021; Rautiainen et al., 2022). To remedy this problem, orientation independent features can be utilized. Models can then account for displacement of the sensor’s orientation and make obsolete the need to correct for orientation.
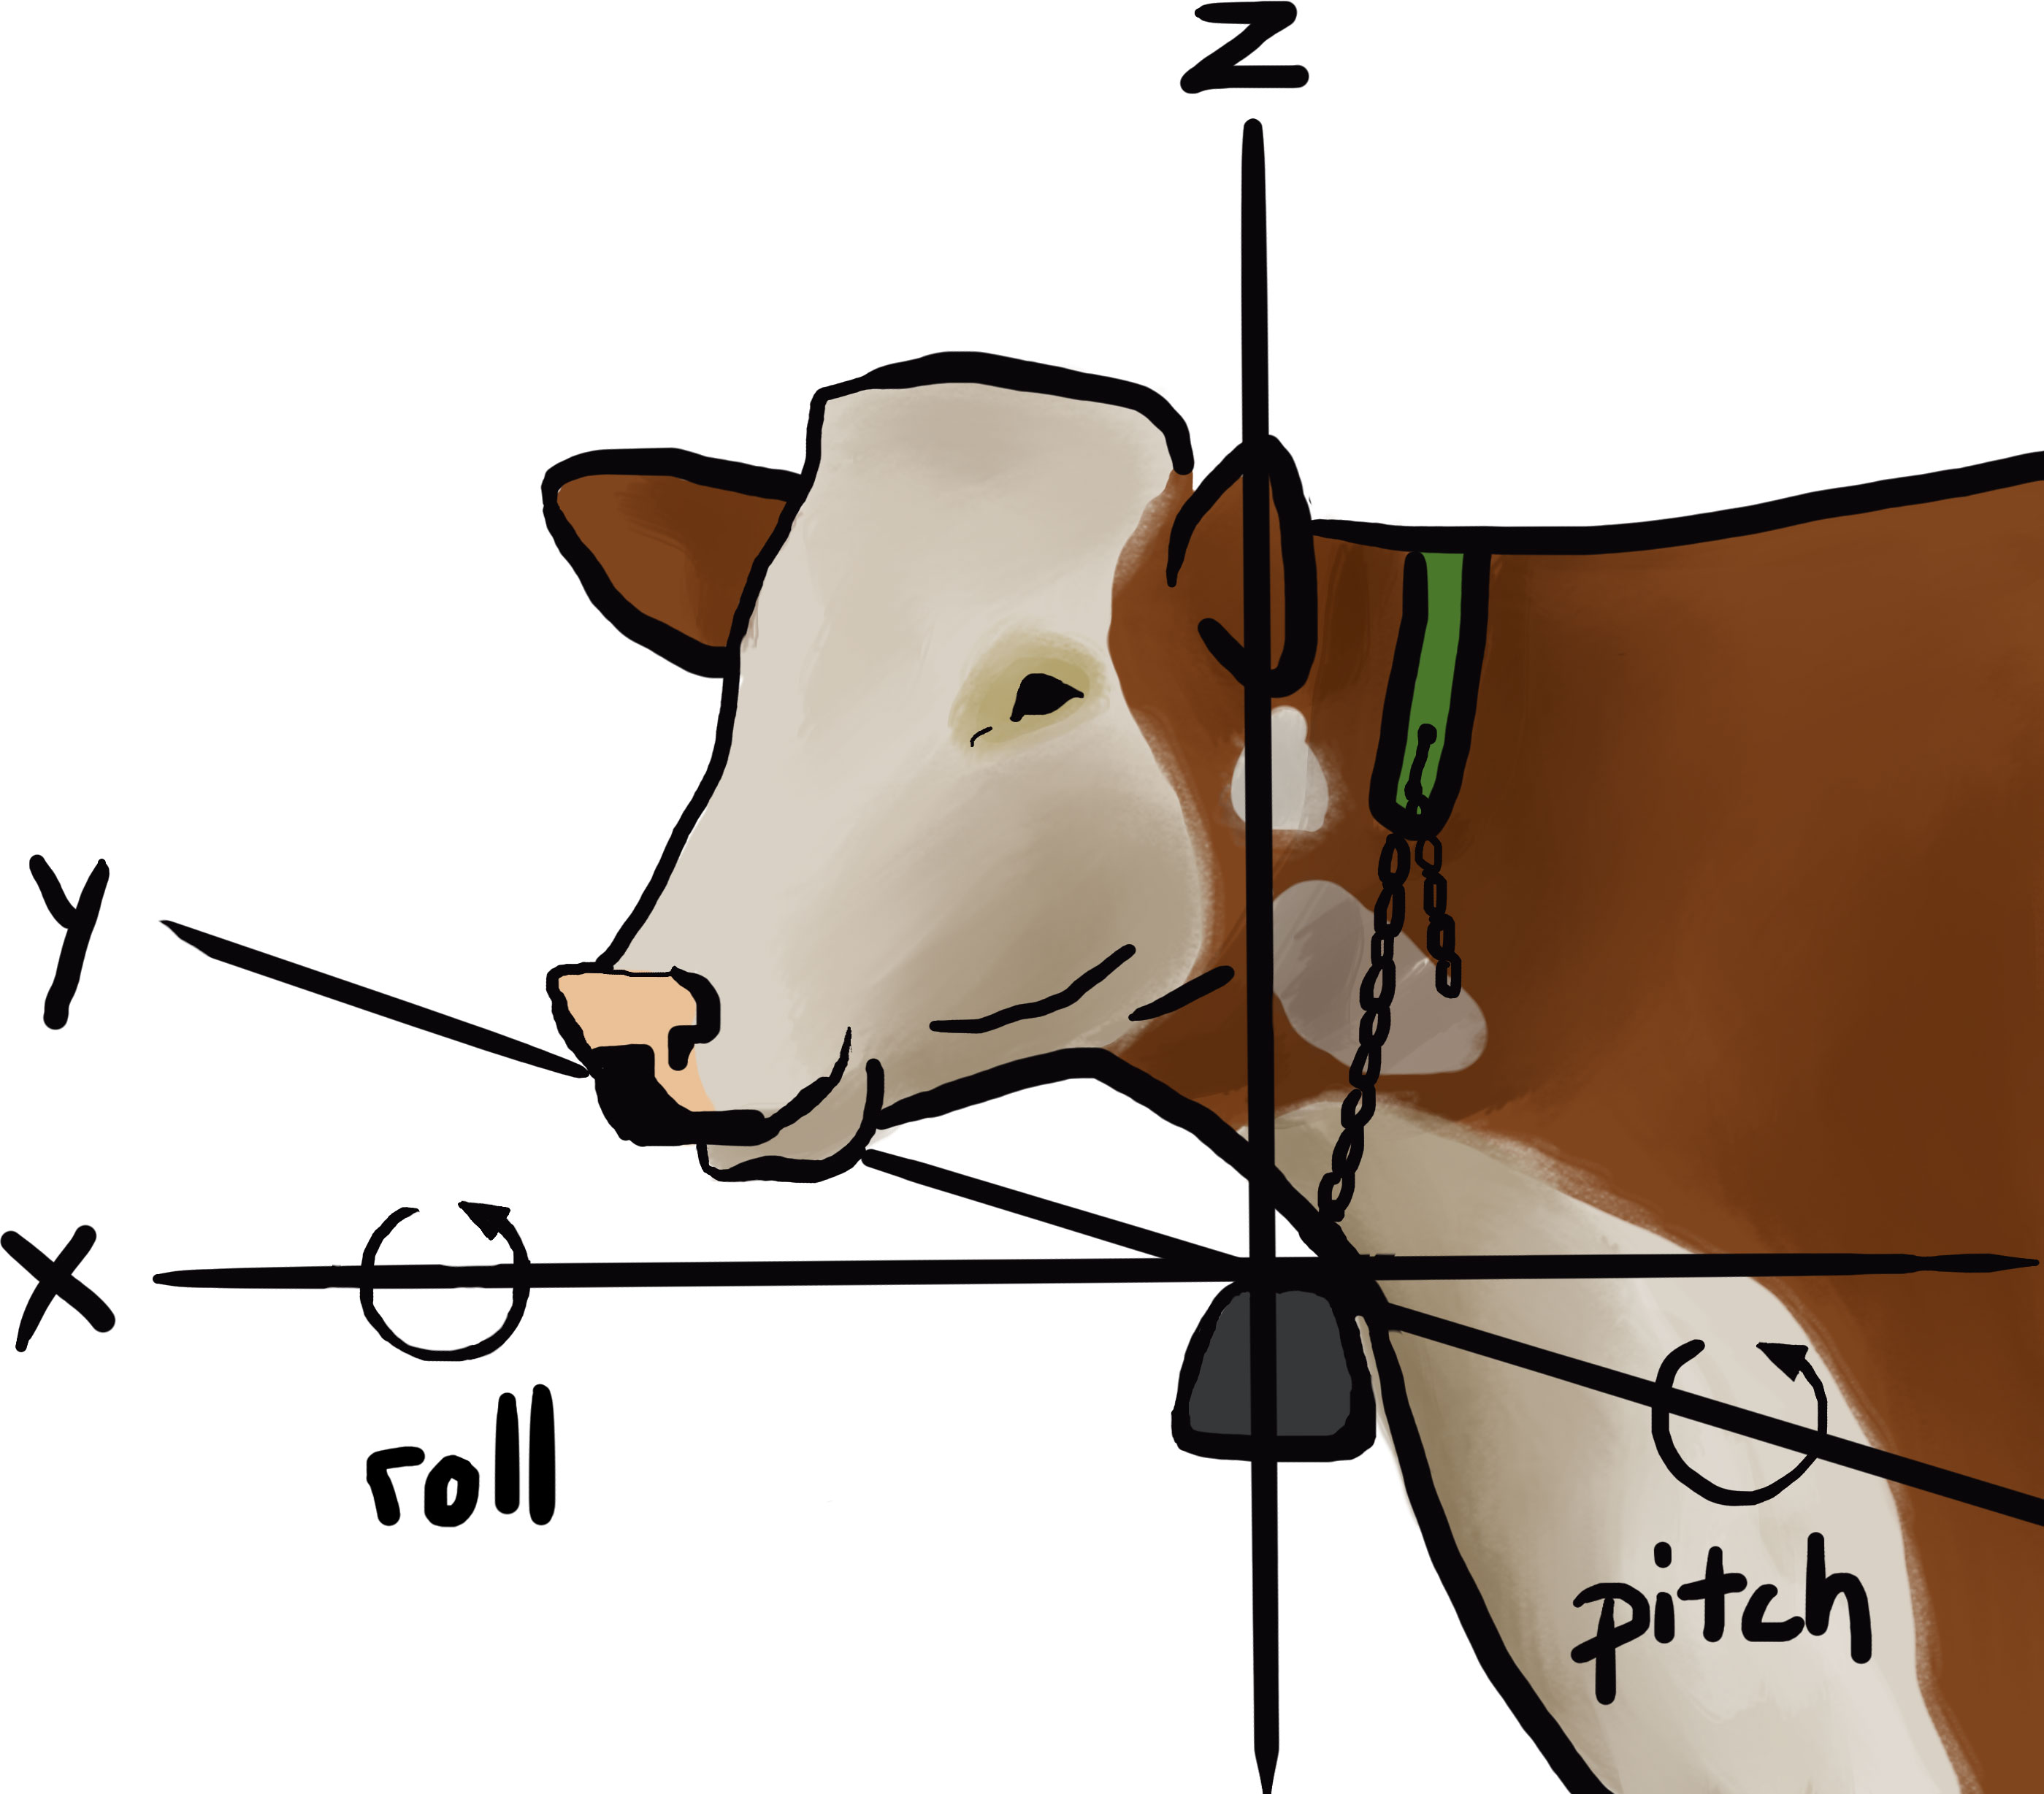
Figure 1 Position of the GPS collar below the cows’ neck. Black lines indicate the direction of the three axes (X, Y, Z) and arrows indicate on which axis the roll and pitch were calculated. Art by Saskia H. Wulff.
High resolution (> 1Hz) accelerometry data is usually smoothed with a running average over a given time window (Shepard et al., 2008a). The chosen window length can result in the loss of certain less frequent and shorter behaviors that might not be detectable, while longer lasting, more common behaviors increase the accuracy and precision of the predictions (Mansbridge et al., 2018; Chang et al., 2022). Therefore, clear study goals become essential in accelerometry analysis, as the study aim will determine different trade-offs and decisions for modeling (Chang et al., 2022).
For instance, some authors suggest that averaging values in the sensor provides an opportunity to increase data collection capacity, and thus allows for live monitoring of behaviors with computationally simple and cost-efficient features and algorithms, which reduce battery usage (Kamminga, 2020; Nuijten et al., 2020). Study questions will thus determine data collection methods, which resolution the data needs to be collected in, as well as which steps should be included in the pre-processing. This will induce trade-offs which will determine what type and number of behaviors that can be analyzed (Kamminga et al., 2018; Riaboff et al., 2022).
In this paper, we aim to calibrate high-resolution accelerometry data collected by commercially available livestock collars deployed on free-ranging cattle in remote areas. Additionally, we aim to investigate the effect of collar placement during deployment of collar and how it might affect accelerometry data. Finally, we attempt to address the gap in knowledge concerning the classification of less frequent cattle behaviors to accelerometry data, as these behaviors can represent behavioral changes or even be indicators of stress.
Our classification study contributes to potential research on cattle social interactions, behavioral responses to carnivores, and energy expenditure of free-ranging cattle in remote forested areas. Additionally, this study has the potential to develop tools for improved monitoring systems for farmers, and therefore to contribute to the practice of agroforestry and precision livestock farming.
We first hypothesized that the model performance to predict general behaviors such as walking (locomotion), foraging, vigilance, standing, laying/resting, or ruminating, would be affected by the choice of features included in the models (orientation-dependent versus orientation-independent features) and by the direction of the collar position on the neck of the animals (as we wanted to account for collar placement variation by the farmers on cattle) (H1). Models with orientation-independent features might perform better than those using orientation-dependent features, as orientation-independent features can account for potential rotation or tightness differences of collars when individuals navigate through rugged terrain. Additionally, models including orientation-dependent features corrected for direction might perform better than those without correction.
Secondly, we hypothesized that less frequent behaviors such as social interactions and body care movements would be impacted by the smoothing of the data (H2). Data smoothed with a short running mean would allow for the detection of rarer behaviors, but at the cost of a loss in the overall model’s performance as a short running window mean can induce more noise during the analysis.
2 Methods
2.1 Study area
We collected data in three summer grazing ranges in the Innlandet county of Norway. This region of Norway belongs to the boreal forest biome and is dominated by coniferous forest, mires and lakes, and only about 4% is covered by agricultural fields. Many beef cattle breeders release their suckler cows with their calves into the forest during the summer months, to make use of outfield grazing resources and to spare the fields close to the farm for winter forage production. The summer ranges included in this study (Steinvik 27.2 km2, long = 11.28°, lat = 61.23°, Deset west 16.4 km2, long = 11.42°, lat = 61.29°, Tørberget 5.8 km2, long = 12.29°, lat = 61.08°) consisted of a patchwork of forest stands of different age classes due to clearcutting practices, often followed by soil scarification, thinning and other silvicultural practices used to increase timber production. Forest stands were either dominated by Norway spruce (Picea abies) or Scots pine (Pinus silvestris), interspersed with birch (Betula pendula, B. pubescens) and other deciduous species. Only minor parts of the ranges were covered by bogs and old grazing meadows. The terrain was rugged and covered an elevational gradient of 300 – 640 m above sea level. A network of forest roads connected the forest stands. Earlier studies in similar habitat have shown that cattle prefer to graze in young forest stands (Tofastrud et al., 2019), where there is access to graminoids of different species (Spedener et al., 2019). However, clearcutting and soil scarification induced varied landscapes that force wildlife and free-ranging livestock to walk on uneven, rugged terrain with obstacles such as fallen trees, stumps, and tree residuals after logging.
2.2 Study animals
All suckler cows belonging to four farms were fitted with virtual fence collars (Nofence, 2022) in May 2021. The farmers trained the cows for virtual fencing while still at the farm, following the instructions given by Nofence (Nofence, 2022). In end of May and beginning of June, the cows were released into their summer grazing ranges (45 cows Steinvik, 21 cows in Deset West, and 13 cows in Tørberget), along with their (uncollared) calves. The grazing ranges were delimited by virtual fencing, and range size did not change much during the summer season. In this study, we included data from 38 cows (4 – 16 individuals per farm) of the following breeds: Hereford (n = 16), Limousine (n = 5), Charolais (n = 4), and 13 crossbred individuals including the beef breeds Simmental, Hereford and the dual-purpose breed Norwegian Red (NRF) (Supplementary Table 1).
Nofence collars with virtual fencing technology (Brunberg et al., 2017; Werkheiser, 2018; Søraa and Vik, 2021; Verdon et al., 2021) triangulate the positions of animals (1 position every 5 to 15 minutes) through the GNSS (Global Navigation Satellite Systems), as well as record movement activity with a motion sensor that yields high-resolution tri-axial accelerometry data (10Hz). The battery is designed to last for at least three months and to be continuously recharged through solar panels. Each animal carried a total weight of 1446g. As cows weighted between 500 and 900 kg depending on the breed and age, collars made up about 0.3-0.5% of the body weight. These devices fell under the recommended threshold of 3-5% of an animal’s body mass (Arnemo et al., 2011; Soulsbury et al., 2020; Hamidi et al., 2022; Sonne et al., 2022).
2.3 Accelerometry sensor activation
Accelerometry sensors on the Nofence collars were remotely activated to continuously sample and transmit data during bouts of 48h. Bouts were distributed throughout the grazing season at intervals of minimum three weeks between bouts per cow, to enable the solar-powered batteries to recharge. This resulted in 1-5 sampling bouts per monitored cow. The order of activation followed a somewhat opportunistic design, depending on where the cows were in relation to each other and in relation to the habitat type. Cows in dense forest were difficult to observe, and we therefore activated mostly collars of cows in more open habitat types.
2.4 Video data
A team of two people located and filmed adult individual cattle in-field while the collars’ accelerometers were activated (Arablouei et al., 2021). To ensure a maximum number of behaviors was captured, we filmed the cattle throughout the summer, in varying weather conditions, times of day, and terrains. The team located the cattle with the Nofence app (Nofence, 2022), which displays the latest positions of individuals.
Carrying a video camera (Canon XA40, Canon Inc.), the team approached the herds as quietly as possible (min. 10 - 15 m distance) to minimize disturbance and stress. When the habitat was open (e.g., clearcuts), the team filmed the entire herd, but when the vegetation was dense, the team focused on filming single individuals. Individual cows were identified by their earmarks and color patterns, using direct observation, binoculars or camera zoom. Video clips lasted between 24 seconds to 48 minutes and were downloaded from the internal memory card every evening, to be stored on a One Drive folder for later use.
All video footage was then viewed and tagged in the software BORIS (Friard and Gamba, 2016), an open-source platform for behavioral coding of video/audio files, to identify and label individual cattle behavior (done multiple times for the same video if multiple individuals in the footage). This was done using an ethogram with a total of 42 behaviors and postures in the following categories: alert, body care, excretion, intake, locomotion, posture, posture transition and social interaction. This ethogram was constructed to be as inclusive as possible of all cattle behaviors (Langford et al., 2011; MacKay et al., 2013; Petherick et al., 2013; Tofastrud et al., 2018; Navarro et al., 2019) and was further detailed with field observations (Supplementary Table 2). The principal investigator of the fieldwork and video analysis labeled ~95% of the video material and trained and supervised three students for the remaining videos, thus minimizing observer bias.
2.5 Pre-processing of the accelerometry data
The software R, version 4.2.1 (R Core Team, 2022) with the Rstudio interface (R Studio Team, 2021) was used for data pre-processing, analysis, and visualization. The tri-axial accelerometry data was matched with the corresponding video data. First, the approximate time stamps of the tri-axial accelerometry data were calculated in decimal seconds. Raw data files have rounded timestamps, up to 32 observations per timestamp, while the data was collected at 10Hz. We converted this to unique timestamps with decimal seconds by subtracting the amount of time that had passed since the last rounded timestamp (i.e., when the time stamp was 13:02:02, and it was the 5th observation, we subtracted 2.7 seconds ((32-5)/10) from the original time stamp). Double observations were then removed, resulting in a data set of approximately 10Hz with an error of ±0.5 seconds. Due to this rounding error, possible time drift in video recordings, and to reduce observer bias in video analysis, we excluded any behavior which had a shorter length than five seconds.
In the next step, the behavioral data was matched with the accelerometry data by timestamp using the function ‘foverlaps’ from the Data.table package (Dowle and Srinivasan, 2019). For the initial match, all behaviors were used (Supplementary Table 2). However, as some behaviors overlapped with each other and we could only keep one single behavior per observation for the analyses, we introduced decision rules based on cattle ecology and body movement (Supplementary Figure 1, Supplementary Table 3). For example, grazing behavior was prioritized over walking, and vigilant behavior was considered only when no other behaviors were shown, to avoid noise in the accelerometry signature from the other behaviors. Behaviors that made up less than 1% of all observation time were pooled into one class named ‘other’.
2.6 Features calculation
We used the raw accelerometry data to calculate orientation dependent and independent features to avoid additional complex pre-processing steps and to reduce the need for computing power. The mean and the standard deviation were calculated along the three axes (Table 1) using 1, 5, and 20 seconds running means, following previous work with accelerometry data on cattle (Riaboff et al., 2022). The pitch is the angle of the collar in degrees (°) along the x axis (Figure 1, Equation 1) where the collar is facing upwards for a +90° angle and downwards for a -90° angle. Similarly, the roll is the angle of the collar along the y axis (Figure 1, Equation 2) (Shepard et al., 2008b; Chimienti et al., 2016). Thereafter, we calculated the mean and standard deviation of the pitch and roll across the three-running means (Table 1).
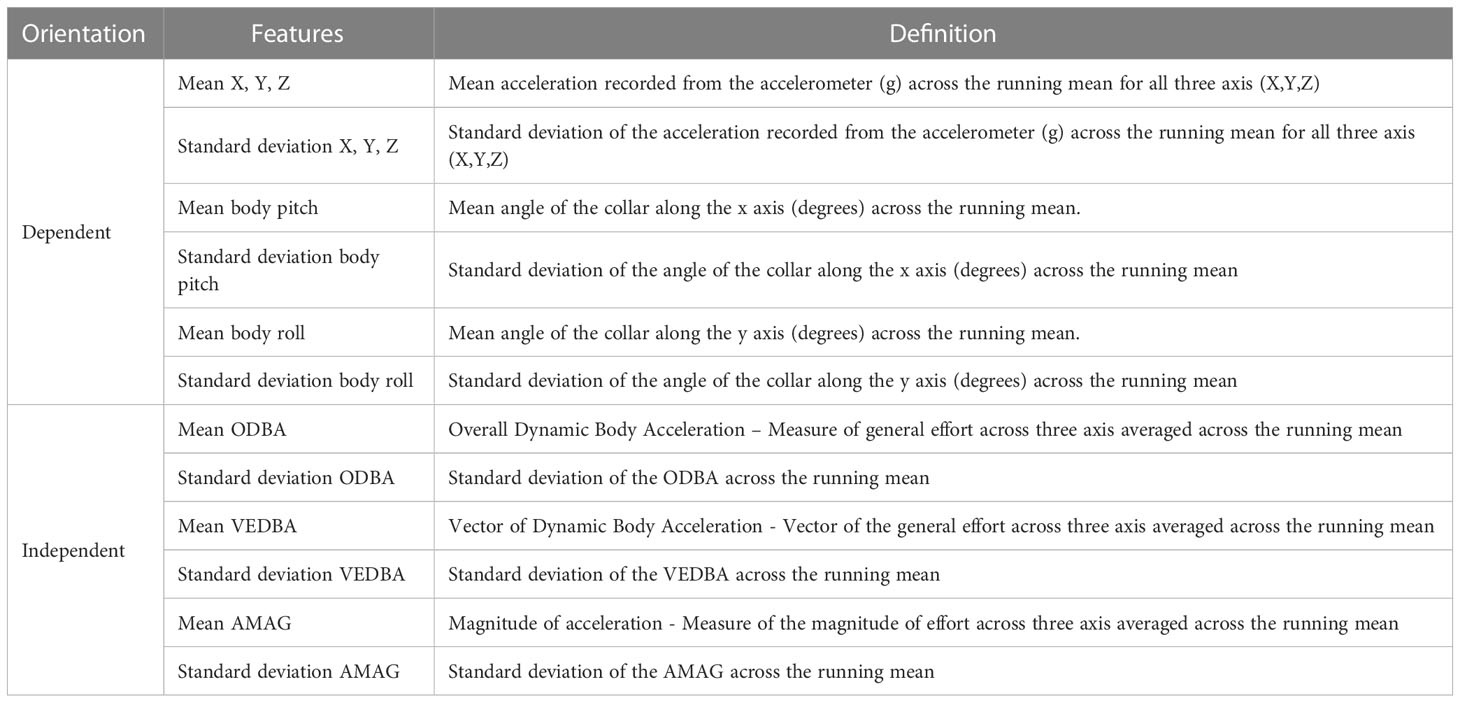
Table 1 Overview of the features used in the models: orientation dependent (three axis, body pitch, and body) and orientation independent (overall dynamic body acceleration (ODBA), vector of dynamic body acceleration (VEDBA), and magnitude of acceleration (AMAG)).
For the overall dynamic body acceleration (ODBA) and the vector of dynamic body acceleration (VEDBA) we first subtracted the mean acceleration from the raw acceleration for each axis to calculate the dynamic acceleration (respectively noted dx, dy, dz for each axis). The sum of the absolute values from the dynamic acceleration was then used to calculate the ODBA (Equation 3), and subsequently the mean and standard deviation of ODBA across the running means (Table 1). The VEDBA was calculated by taking the square root of the squared dynamic acceleration for the three axes (Equation 4), again followed by calculation of mean and standard deviation across the running mean (Table 1). Finally, the magnitude of acceleration (AMAG) was calculated by taking the square root of the squared acceleration for the three axes (Equation 5), with mean and standard deviation across the running mean (Table 1).
During the analyses, we noticed that about half of the collars were placed in the reverse direction on the cow. We identified these based on the pitch angle from “foraging_low” behavior (a positive angle suggests a reversed collar), and by looking at the video data (the collars have a small mark to distinguish between left and right side). The data was then corrected by reversing both x and y axis. The orientation-dependent features were calculated for both the original and the corrected data sets (Figure 2).
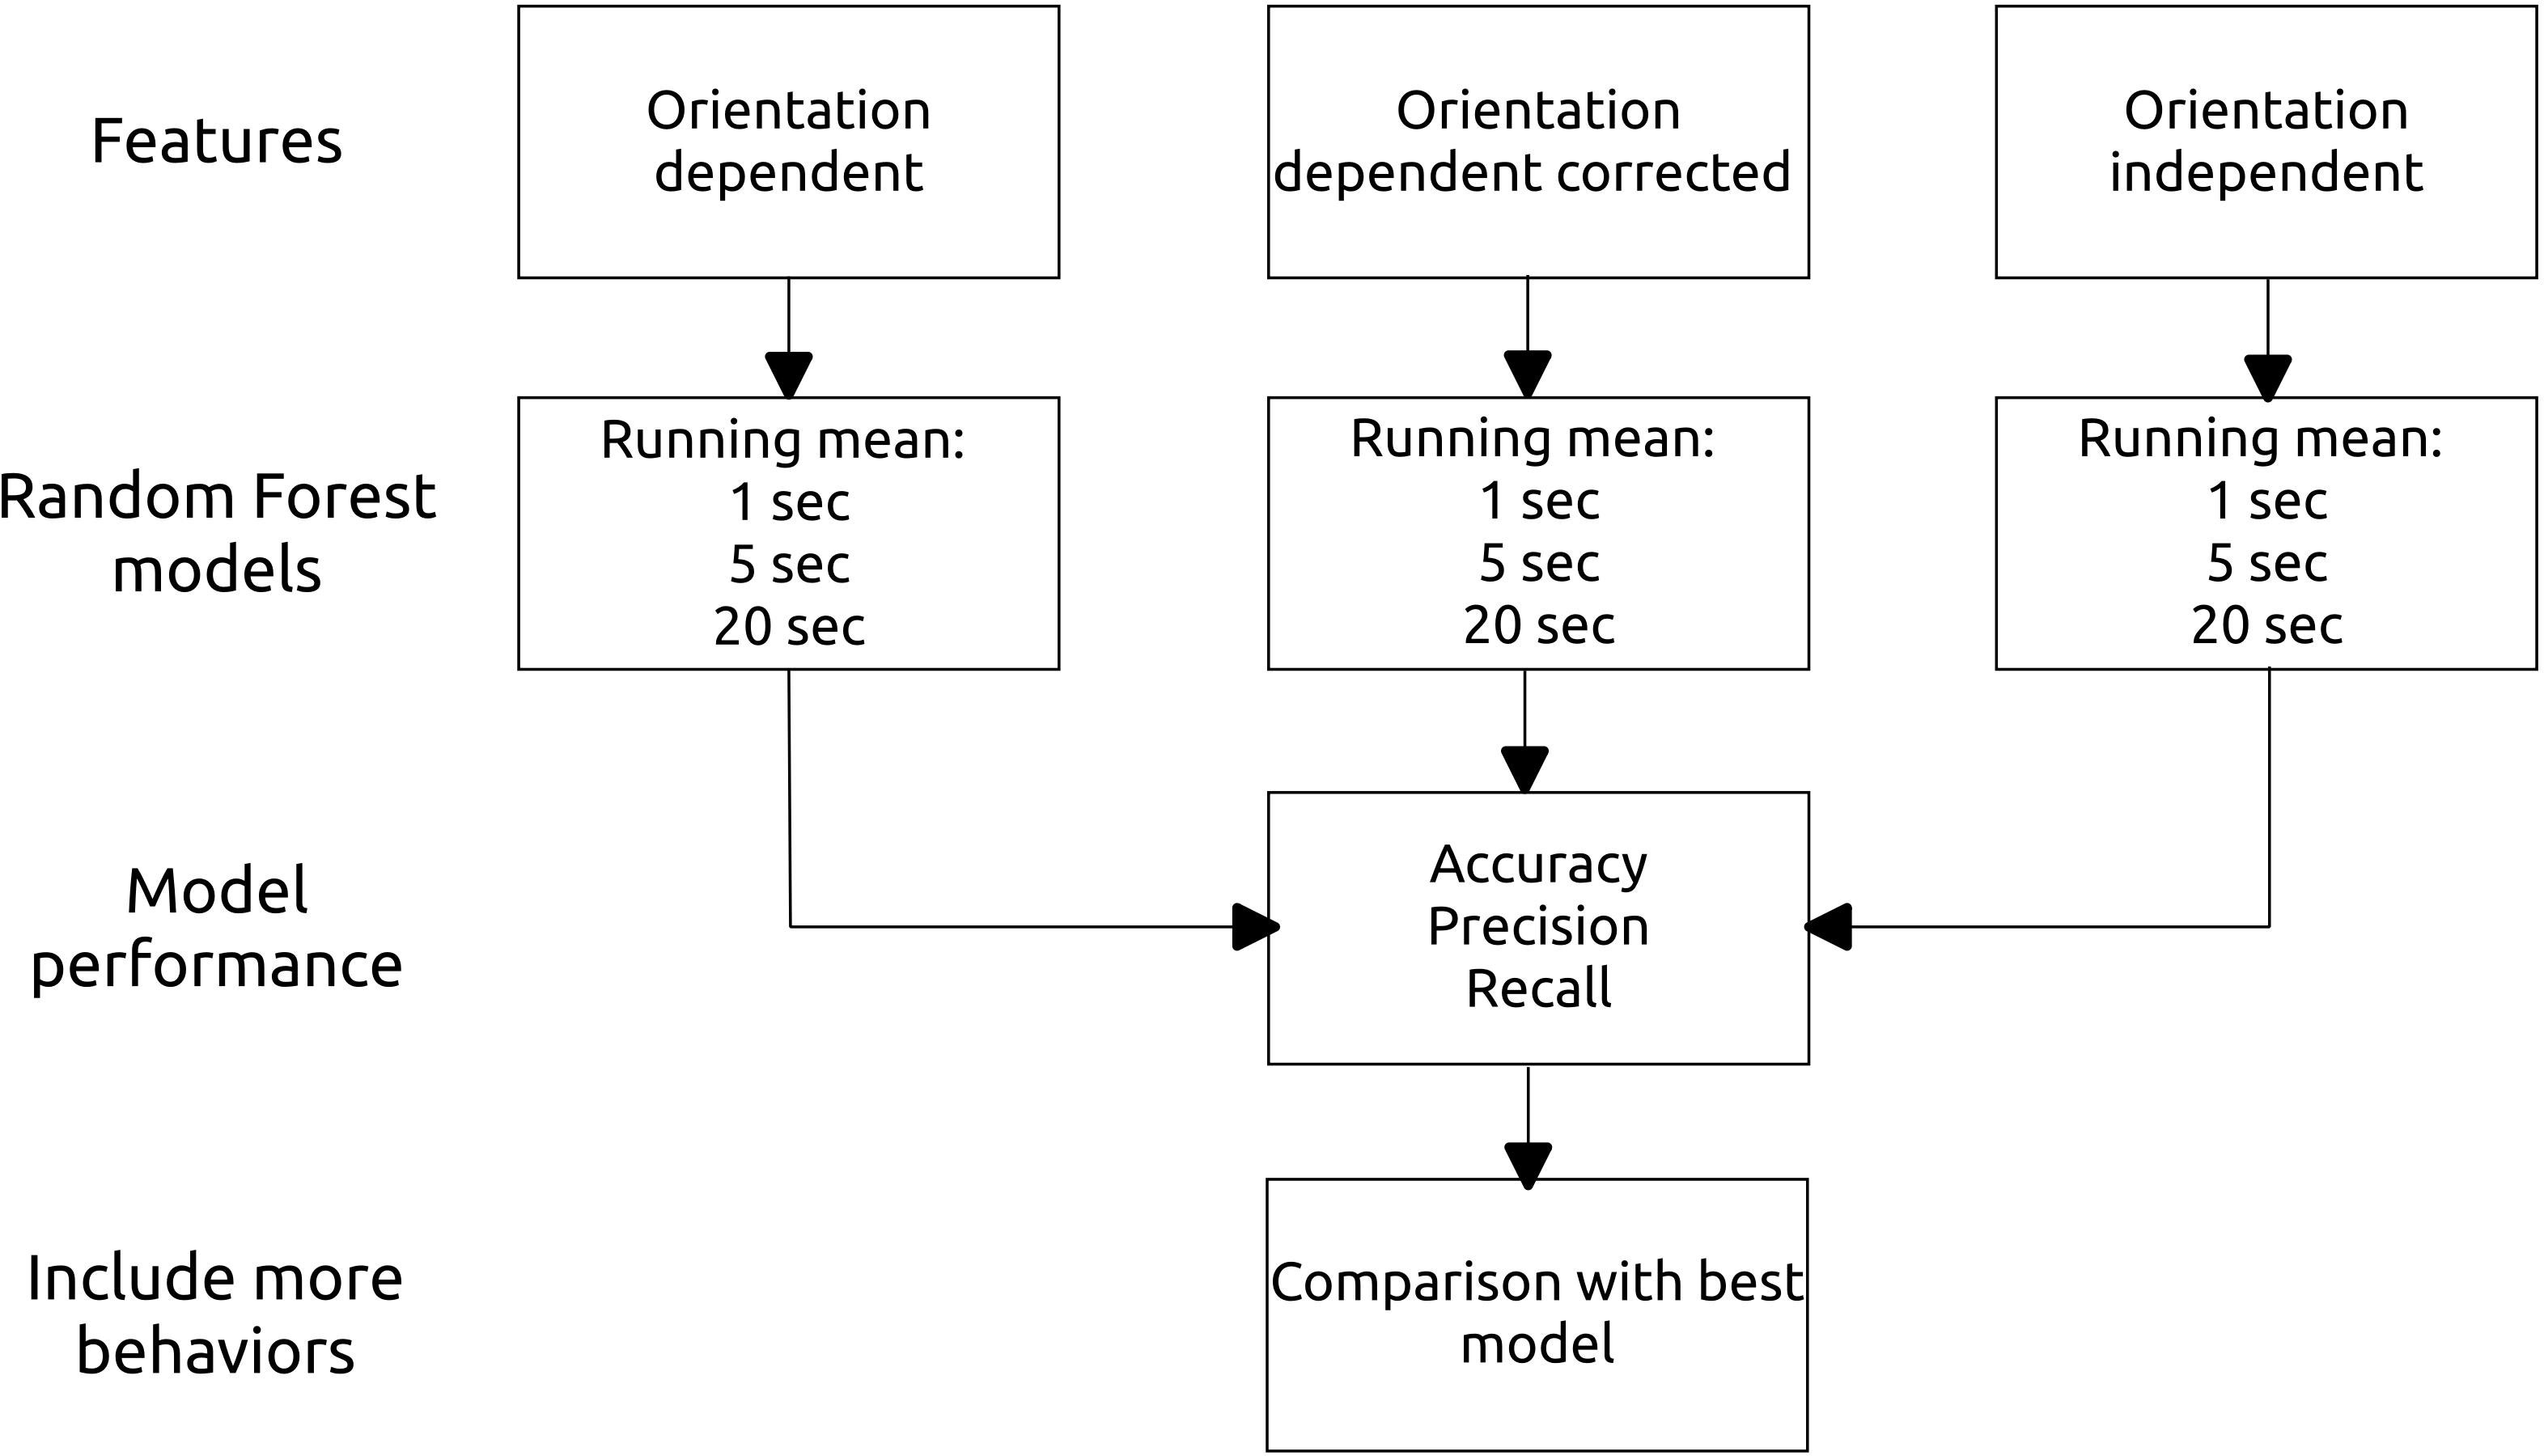
Figure 2 Flow chart showing the modeling process. For each feature category (orientation dependent, orientation dependent corrected, orientation independent), we ran three models, one for each running mean (1, 5, and 20 seconds). Furthermore, after assessing the models performance we reran the best model including more behaviors.
2.7 Random forest models
We prepared data for orientation-dependent, orientation-dependent with correction, and orientation-independent features (Figure 2). Within each category, we ran three models on the three different running means (1, 5, and 20 seconds). All features were standardized before running the models. The data were grouped by behavior and split with 80% used for training and 20% for validation. Thereafter, random forest models were run using the function ‘h2o.randomforest’ from the H2O package version 3.36.1.2 (LeDell et al., 2021). We chose the random forest algorithm for its versatility, and because it has good predictive power for its computation time (Biau & Scornet, 2016). Models were run with 150 trees, as with this number of trees, the log-loss of the model became stable. We used 5-fold cross-validation, and we added a weight to each class (N of rarest behavior divided by the N of the behavioral class) to account for class imbalance and potential over-fitting (Cutler et al., 2012). Additionally, we checked for individual variation by running an individual-based cross-validation (without data split by behavior). The package’s default settings were used for the other hyperparameters (max tree depth = 20, mtries = square root of the number of features). We visualized model results using the DALEX package (Biecek, 2018) and the ggplot2 package (Wickham, 2016). Furthermore, the model accuracy, precision, and recall were calculated to compare model performance (Equations 6, 7, and 8, respectively) (Kamminga, 2020). Based on the best performing model, we ran the last model including more behaviors to test if models including more behaviors performed similarly well (Figure 2). Here, the threshold for a behavior to be included was minimum 0.1% of the total observation time.
3 Results
We annotated 6 898 behavioral observations based on video analysis and matched them with accelerometry data, resulting in a total of 1 240 588 observations for 31 behaviors (Supplementary Table 2). Visual inspection showed appropriate matching, i.e. the accelerometry data showed different signatures for different behaviors (Figure 3).
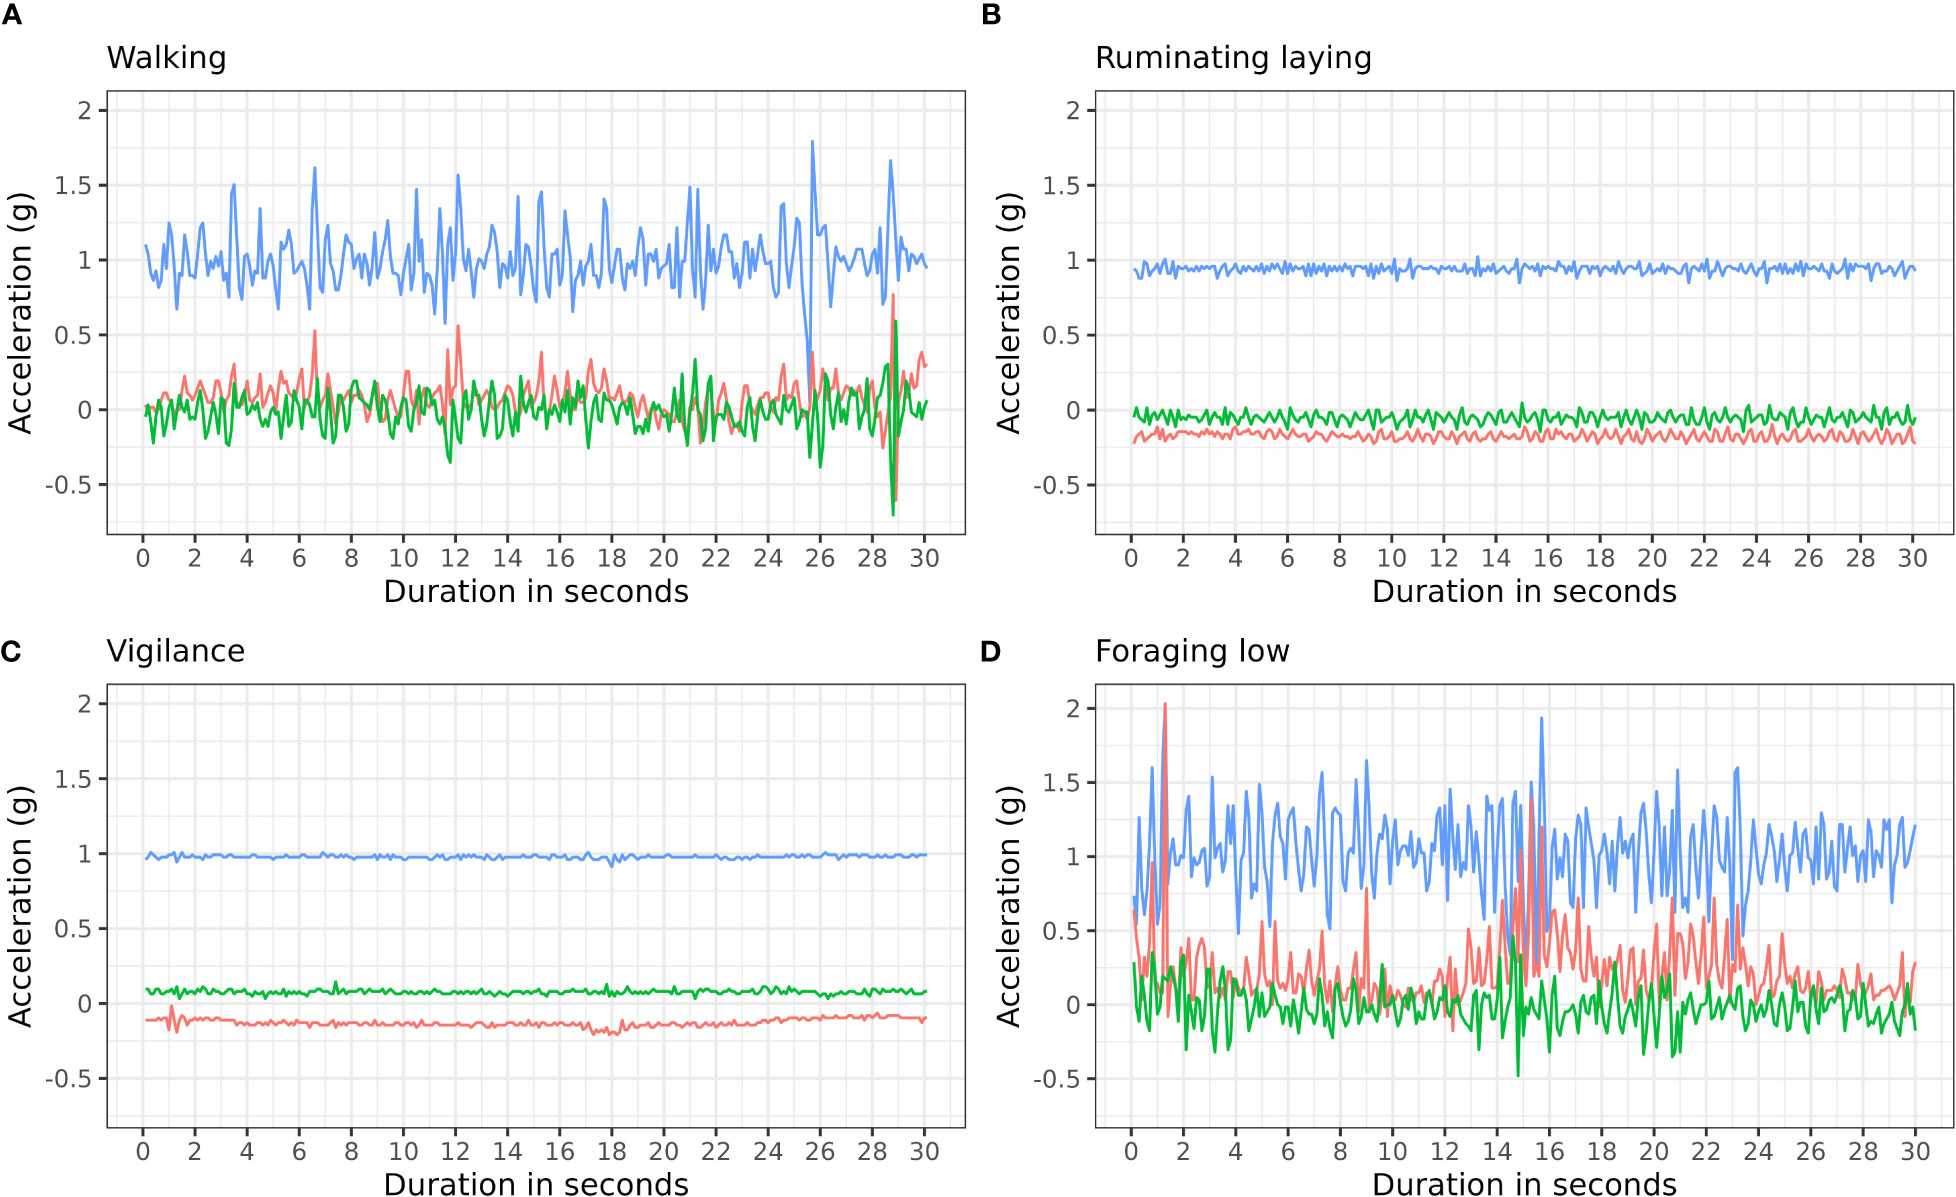
Figure 3 Example of four behaviors and their raw accelerometry signature for the duration of 30 seconds (300 observations). For the behaviors; (A) Walking, (B) Ruminating laying, (C) Vigilance, and (D) Foraging low. Line color indicate the different axis; blue: z axis, red: x axis, green: y axis. The proportion of observations for each of these behaviors is 9%, 23%, 8%, 33%, respectively. See the full overview of behaviors in Supplementary Table 3.
Overall, the models with 20 seconds running mean performed better than those with shorter running means (Table 2). Orientation-independent models showed a lower performance than orientation-dependent models. Corrected orientation-dependent models performed similar to uncorrected models (Table 2). Both orientation-dependent models with 20 seconds running mean (models C and F) had average accuracy, precision and recall > 0.96. The orientation-independent model I had an average precision of 0.88, recall 0.93 and accuracy 0.99 (Table 2). Precision averaged 0.62 and 0.63 for the 1 second running mean in the orientation-dependent and corrected orientation-dependent models, respectively (models A and D, Table 2), and averaged 0.37 and 0.64 for the 1 second and the 5 seconds running means, respectively in the models with orientation-independent features (models G and H, Table 2). Similarly, the recall averaged 0.69 for the 1 second running mean in the orientation-dependent and corrected orientation-dependent models (models A and D, Table 2). The orientation-independent models G and H had an average recall of 0.39 and 0.72 for 1 and 5 seconds running mean, respectively (Table 2). Prediction performance varied across behaviors for recall, accuracy and precision (Figure 4, and Supplementary Figures 2, 3, respectively). Behaviors in models with a shorter running mean varied more in recall than in models with a longer running mean, e.g., ‘foraging_high’ and ‘other’ in the orientation-dependent models A and D were below 0.4 (Figure 4). Those behaviors were correctly classified in less than 40% of their occurrence. Orientation-dependent models using 5 seconds running means performed better with lowest recall of 0.8 (model B, Figure 4). For models with 20 seconds running mean, the recall was never below 0.96, showing that the lowest performing behavior had a classification success of 0.96. The performance of the orientation-independent models showed overall lower recall values for each behavior. Still, increased running means in the orientation-independent models helped to improve prediction and decreased the number of classification errors.
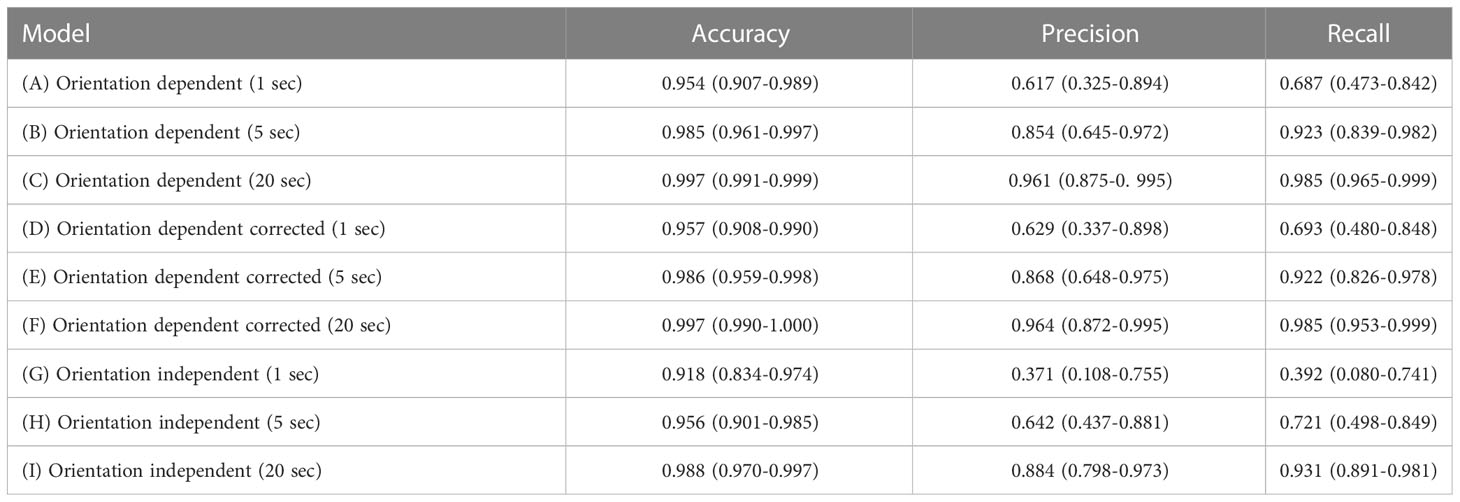
Table 2 Overview of the nine models with the average and range for accuracy (as the ratio of correct predictions out of all predictions), precision (as the ratio of true positives over the sum of false positives and true negatives), and recall (as the ratio of correct predicted outcomes to all predictions).
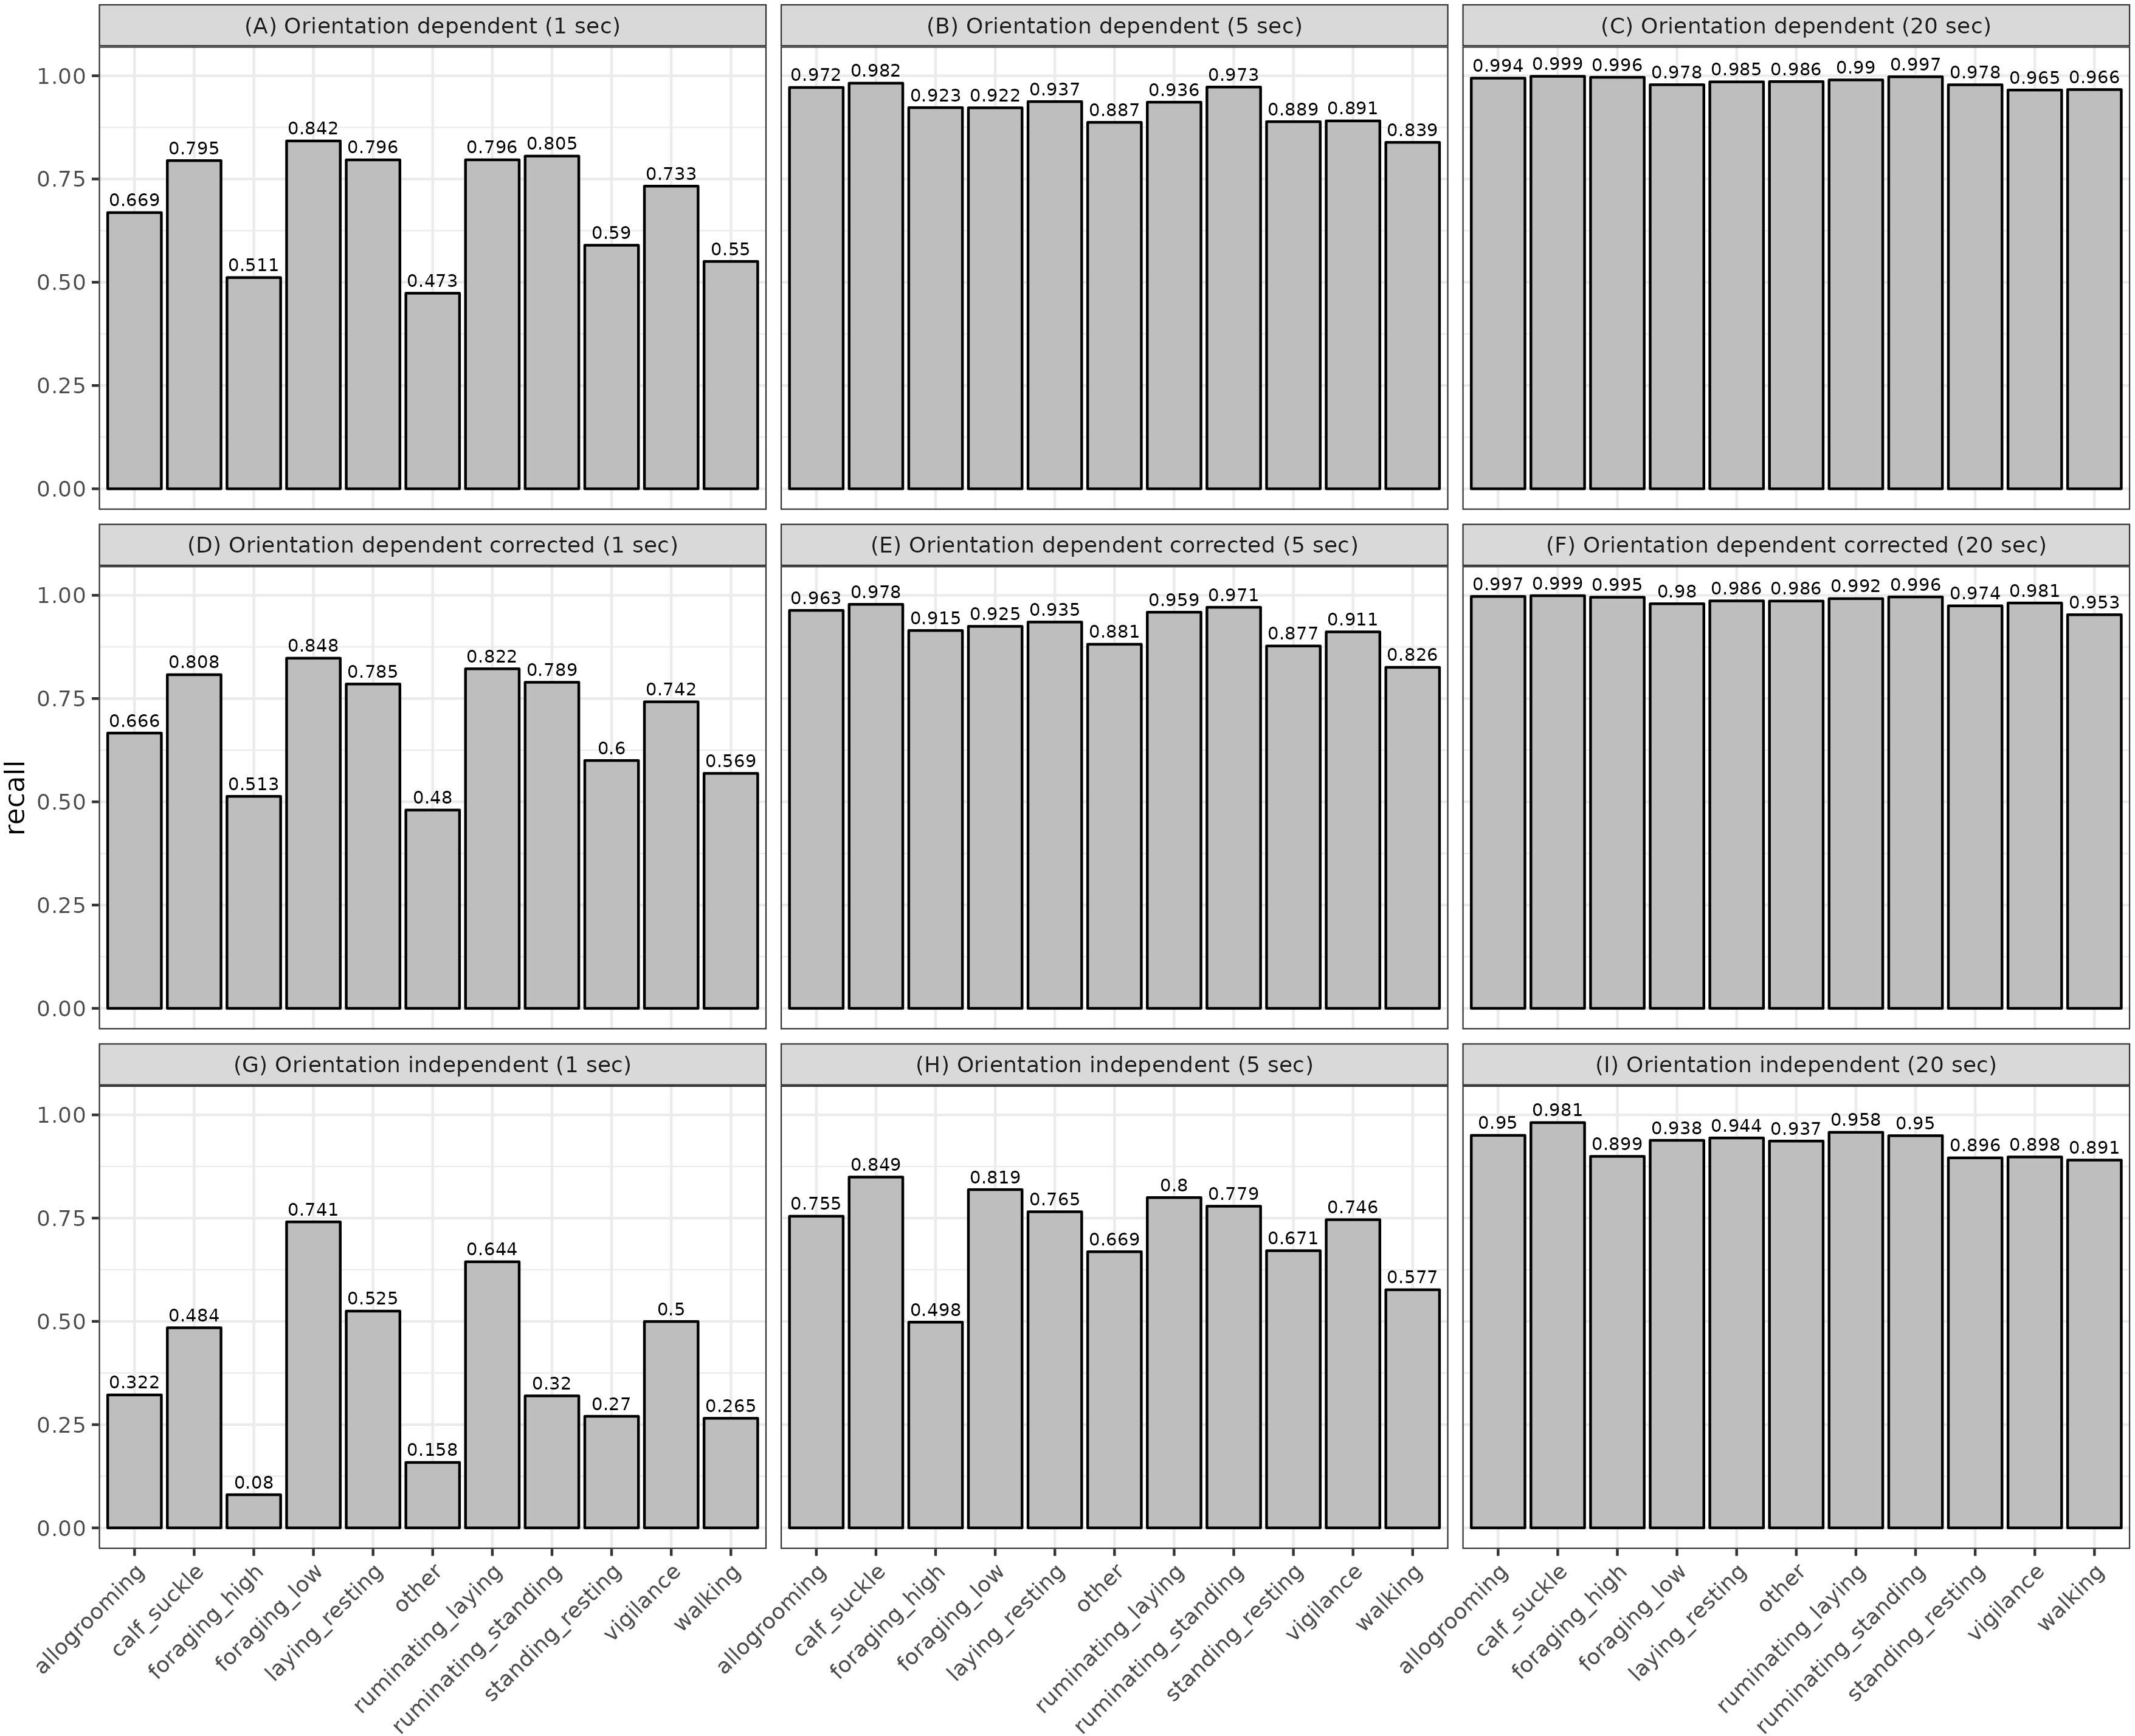
Figure 4 The recall (classification success) for each model, specified by behavior and based on the model’s validation data. Rows indicate orientation-dependent features, corrected orientation-dependent features, and orientation-independent features, respectively.
The orientation-dependent model with 20 seconds running mean had a few occasions where behaviors were misclassified (Table 3). However, the confusion matrix for the orientation-independent model with 20 seconds running mean showed a higher degree of misclassification (Table 4), especially for behaviors that were more similar in their acceleration signature (e.g. ‘foraging_low’ and ‘walking’, or ‘ruminating_standing’ and ‘ruminating_laying’). The confusion matrices for all other models are presented in Supplementary Tables 4–10.
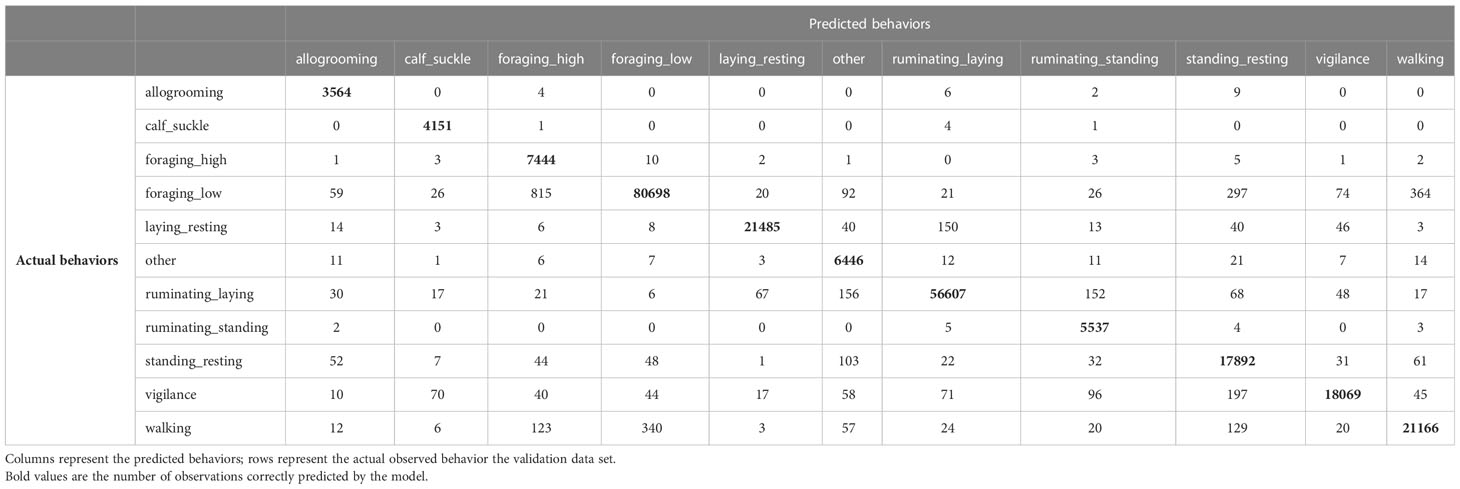
Table 3 Confusion matrix for the orientation dependent features without collar correction with 20 seconds running mean.
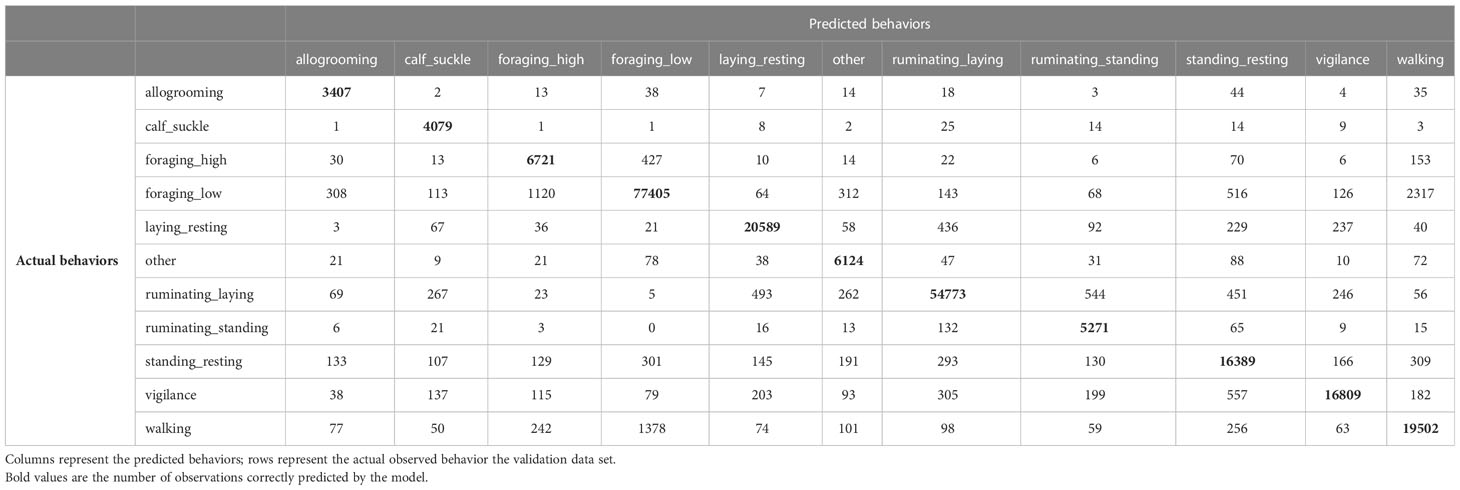
Table 4 Confusion matrix for the orientation independent features without collar correction with 20 seconds running mean.
The individual-based cross validation model using a 20 second running mean and orientation-dependent data indicated that rarer behaviors were more difficult to predict for individuals with less observations, but overall, the model performed similar to the model using the 80-20 data split, because there were enough observations of these rare behaviors across all individuals. The averaged accuracy was 0.997, the averaged precision was 0.965, and the averaged recall was 0.987 (See Supplementary Table 11 for the confusion matrix).
The model including more behaviors had an average accuracy of 0.99, precision of 0.71, and recall of 0.96. The classification success for the behaviors that were also present in the other models performed similarly well (Tables 3–5). However, rarer behaviors had a high classification success with almost no misclassifications, e.g., in the behaviors ‘stretching’ and ‘throw_head’ (Table 5).
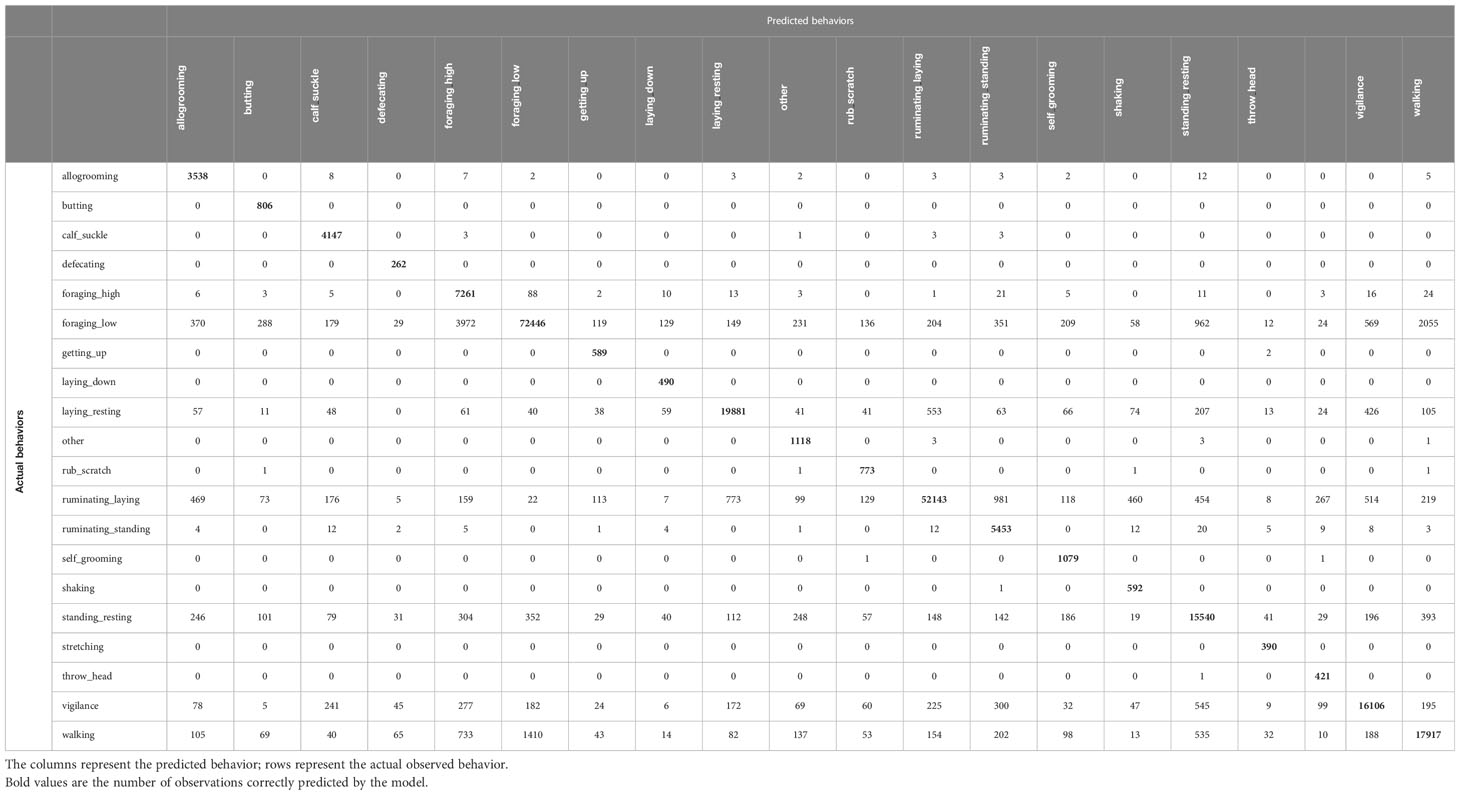
Table 5 Confusion matrix for orientation dependent features with 20 seconds running mean including all behaviors below 0.1% proportionally of the data set.
4 Discussion
In this study, tri-axial accelerometer signatures were assigned to observed behaviors of free-ranging cattle based on supervised machine learning algorithms and using different accelerometer features and running mean smoothing windows. We found that (1) using a long running mean (20 seconds) translated to best model performance across all model categories, and (2) model performance remained excellent when using orientation-dependent instead of orientation-independent features, or when adding more behaviors (with accurate classification even with minority class behaviors i.e., allogrooming, suckling calf).
How tight and in which direction collars were deployed, and terrain ruggedness through which the cows navigated, varied widely in our study. We therefore expected that orientation-independent features derived from accelerometer data, would lead to better prediction performance than orientation-dependent features (hypothesis H1). However, models based solely on orientation-dependent features performed better than those based on orientation-independent features.
While our study assessed the outcome and performance of either orientation-dependent or -independent features, previous studies have combined up to 60 features of both types to increase model performance (Lush et al., 2018; Riaboff et al., 2020; Riaboff et al., 2022). However, as our best model with solely orientation-dependent features had excellent performance (0.997 accuracy, 0.961 precision, 0.985 recall), we did not need to extend the model by including additional orientation-dependent and -independent features. We believe our model performed so well in part because the accelerometer was placed along with the battery and other collar electronics on the low side of the collar. The combined weight of the unit seems to hold the accelerometer in place, independently from collar tightness. In comparable studies on marine mammals, accelerometer placement is highly variable (Shepard et al., 2008b).
Moreover, and contrary to our predictions, we found that correcting for collar orientation did not improve the model performance. Indeed, both corrected and uncorrected models performed similarly. While placing the accelerometer backwards can impact axes values, the accelerometer unit remains below the neck of the animal and hangs similarly for all individuals. In fact, backwards placement of the accelerometer affects only the mean of the X and Y axes, with a more pronounced effect for the X axis, as well as the mean pitch values; the variance of the Z axis and the pitch are not affected by orientation (Wang et al., 2015; Chang et al., 2022). Despite variations in feature values, the amplitude and pattern of movement remain consistent, which might explain why orientation-corrected models did not outperform uncorrected models. Additionally, the sample size in our study is large enough to rule out noise in the data due to collar deployment error, making our models robust (Riaboff et al., 2022). Furthermore, cattle are large and slow animals, and behavior-specific body movements can be more easily differentiated compared to small-sized animals. This might be more challenging for smaller, faster moving species, and placement of accelerometers in those species, and placement of accelerometers in those species is likely more important (Grünewälder et al., 2012; Brewster et al., 2018).
We initially hypothesized that the detection of less frequent behaviors, such as social interactions and body care movements, would be impacted by the smoothing of the data, as these behaviors might not be detected by long running mean windows. Contrary to our predictions, we found an increase in model performance across all categories (orientation-dependent, orientation-dependent with correction, orientation-independent) with increasing smoothing window, with highest performance when using a 20 second running mean. Other studies have shown that smoothing of the data increases the classification success by reducing noise, and that larger animals often require a longer running mean as their movements are generally slower (Shepard et al., 2008a). However, this often results in a decrease in classification success for behaviors which are rare and short in time (Mansbridge et al., 2018; Chang et al., 2022). In our study we did not find such a decrease. An explanation might be that we excluded all behaviors shorter than 5 seconds, resulting in a large enough difference in mean and variance of the features for those behaviors for successful classification. Furthermore, the large number of observations in the minority classes (rarer behaviors) across individuals might have contributed positively during the training of the model, resulting in high model performance.
Finally, we predicted that adding more behaviors would affect model performance negatively and expected that the addition of behaviors would lead to loss of model performance (H2) as it has been shown in previous studies (Vázquez Diosdado et al., 2015; Lush et al., 2018). Contrary to our prediction, we found that models performed well with an increase of behaviors and could accurately predict less frequent behaviors such as head butting, throwing head and shaking. Less frequent behaviors were observed for fewer individuals than more common behaviors, which may lead to a stronger impact of individual-specific accelerometer signatures in the random forest models. We addressed this through class weighting, and individual-based cross validation. Even though there was variation in prediction success across individuals and behaviors, the overall model performed similarly well as with the 5-fold (i.e. with random 80/20 data split) cross-validation model.
This study’s sample size of individuals is larger than most accelerometry classification studies of free-ranging cattle (Chapa et al., 2020; Kour et al., 2021). Riaboff et al. (2022) recommended using a minimum of 10 animals and emphasized more robust analysis with at least 25 animals and a variety of breeds and farms. While we exceeded this recommendation (n = 38 individuals distributed on four breeds and four farms), we did not specifically account for breed, farm or individual characteristics such as body weight or age, as this would require an even larger sample.
Interestingly, we were able to differentiate between behaviors that we expected to have similar accelerometry signatures, such as laying ruminating and standing ruminating. When looking at posture, cattle laying causes the angle of the accelerometer to vary slightly compared to when they are standing, as the electronic housing often leans against the individual’s chest. Similarly, we could identify vigilance behavior, which is likely due to our decision rule defining individuals as being vigilant only when no other behavior happened (Supplementary Figure 1).
Often, scientific studies develop models and tools that are appropriate for experimental settings, but too expensive or impractical to be used for commercial settings. Our results based on the accelerometers contained in the commercial Nofence collars open up for a range of end-user applications. For example, these could be Nofence tools for easy handling by the customers, such as a built-in algorithm in the collar converting accelerometer data directly to behavioral states or to time budget summaries, which could be continuously transmitted to the farmer. This could allow for an easy and fine-scale supervision and monitoring of free-ranging cattle in remote areas or dense habitats. Furthermore, the success in classification of ruminating, vigilance and social behaviors could contribute to the study of free-ranging cattle welfare, stress and productivity, through the quantification of precise nutrient intake and energy expenditure.
In conclusion, our study succeeded in categorizing high resolution accelerometer data into behaviors for free-ranging cattle in rugged terrain of the boreal forest. Not only were collar deployment errors confirmed to not significantly impact model performance, but our models also showed success in detecting more behaviors than previously published, including less frequent behaviors other than resting, grazing, ruminating and walking. Calibrating such data with an array of different behaviors makes a valuable contribution to livestock precision farming in extensive rangeland systems. It may allow farmers to monitor the welfare of their animals continuously and to detect non-normal behaviors caused by e.g. diseases or carnivore attacks.
Data availability statement
The data and R scripts to replicate the models of this study are openly available in Dataverse NO at https://doi.org/10.18710/ND4CLL.
Ethics statement
Ethical review and approval was not required for the animal study because this study used commercially available GPS/virtual fence collars in Norway and is approved by the Norwegian authorities for use on cattle. Written informed consent was obtained from the owners for the participation of their animals in this study.
Author contributions
EV, LJN, MS, BZ, and ALE conceived the study. BZ and ALE secured the funding. LJN conducted the filming and video analysis. EV and MS conducted the accelerometry analysis, with additional support of OD. EV and LJN drafted the manuscript. MS, BZ, AH, MT, OD, ALE reviewed and commented on the initial drafts. All authors contributed to the ideas and edits to the manuscript and approved the submitted version.
Funding
This research is part of the CarniForeGraze project which is funded by the Norwegian Research Council (project number 302674).
Acknowledgments
We would like to thank the farmers Anne Dieset, Lasse Holter, Øystein Lageraaen, and Jens Gunnar Voldmo, for their cooperation and permission of approaching and filming their cattle, and for sharing of their data. Furthermore, we would also like to thank Nofence AS for their support in obtaining the accelerometry data. Additionally, we would like to thank Pierre Lissillour for his help during the filming, Malena Diaz Gómez, Josh Hauer and Irene Garcia Cuesta for their help with the video analysis and Saskia H. Wulff for her illustration.
Conflict of interest
The authors declare that the research was conducted in the absence of any commercial or financial relationships that could be construed as a potential conflict of interest.
Publisher’s note
All claims expressed in this article are solely those of the authors and do not necessarily represent those of their affiliated organizations, or those of the publisher, the editors and the reviewers. Any product that may be evaluated in this article, or claim that may be made by its manufacturer, is not guaranteed or endorsed by the publisher.
Supplementary material
The Supplementary Material for this article can be found online at: https://www.frontiersin.org/articles/10.3389/fanim.2023.1083272/full#supplementary-material
References
Abell K. M., Theurer M. E., Larson R. L., White B. J., Hardin D. K., Randle R. F. (2017). Predicting bull behavior events in a multiple-sire pasture with video analysis, accelerometers, and classification algorithms. Comput. Electron. Agric. 136, 221–227. doi: 10.1016/j.compag.2017.01.030
Arablouei R., Currie L., Kusy B., Ingham A., Greenwood P. L., Bishop-Hurley G. (2021). In-situ classification of cattle behavior using accelerometry data. Comput. Electron. Agric. 183, 106045. doi: 10.1016/j.compag.2021.106045
Arnemo J. M., Evans A., Fahlman Å., Ahlqvist P., Andrén H., Brunberg S., et al. (2011). Biomedical protocols for free-ranging brown bears, wolves, wolverines and lynx Vol. 14 (Evenstad, Norway: Hedmark University College).
Barker Z. E., Vázquez Diosdado J. A., Codling E. A., Bell N. J., Hodges H. R., Croft D. P., et al. (2018). Use of novel sensors combining local positioning and acceleration to measure feeding behavior differences associated with lameness in dairy cattle. J. Dairy Sci. 101, 6310–6321. doi: 10.3168/jds.2016-12172
Benaissa S., Tuyttens F. A., Plets D., Cattrysse H., Martens L., Vandaele L., et al. (2019). Classification of ingestive-related cow behaviours using RumiWatch halter and neck-mounted accelerometers. Appl. Anim. Behav. Sci. 211, 9–16. doi: 10.1016/j.applanim.2018.12.003
Biau G., Scornet E. (2016). A random forest guided tour. TEST 25 (2), 197–227. doi: 10.1007/s11749-016-0481-7
Biecek P. (2018). DALEX: Explainers for complex predictive models in r. J. Mach. Learn. Res. 19, 1–5.
Brewster L. R., Dale J. J., Guttridge T. L., Gruber S. H., Hansell A. C., Elliott M., et al. (2018). Development and application of a machine learning algorithm for classification of elasmobranch behaviour from accelerometry data. Mar. Biol. 165, 62. doi: 10.1007/s00227-018-3318-y
Brunberg E. I., Bergslid I. K., Bøe K. E., Sørheim K. M. (2017). The ability of ewes with lambs to learn a virtual fencing system. animal 11, 2045–2050. doi: 10.1017/S1751731117000891
Cade D. E., Gough W. T., Czapanskiy M. F., Fahlbusch J. A., Kahane-Rapport S. R., Linsky J. M. J., et al. (2021). Tools for integrating inertial sensor data with video bio-loggers, including estimation of animal orientation, motion, and position. Anim. Biotelemetry 9, 34. doi: 10.1186/s40317-021-00256-w
Chakravarty P., Cozzi G., Ozgul A., Aminian K. (2019). A novel biomechanical approach for animal behaviour recognition using accelerometers. Methods Ecol. Evol. 10, 802–814. doi: 10.1111/2041-210X.13172
Chang A. Z., Fogarty E. S., Moraes L. E., García-Guerra A., Swain D. L., Trotter M. G. (2022). Detection of rumination in cattle using an accelerometer ear-tag: A comparison of analytical methods and individual animal and generic models. Comput. Electron. Agric. 192, 106595. doi: 10.1016/j.compag.2021.106595
Chapa J. M., Maschat K., Iwersen M., Baumgartner J., Drillich M. (2020). Accelerometer systems as tools for health and welfare assessment in cattle and pigs – a review. Behav. Processes 181, 104262. doi: 10.1016/j.beproc.2020.104262
Chimienti M., Beest F. M., Beumer L. T., Desforges J.-P., Hansen L. H., Stelvig M., et al. (2021). Quantifying behavior and life-history events of an Arctic ungulate from year-long continuous accelerometer data. Ecosphere 12, e03565. doi: 10.1002/ecs2.3565
Chimienti M., Cornulier T., Owen E., Bolton M., Davies I. M., Travis J. M. J., et al. (2016). The use of an unsupervised learning approach for characterizing latent behaviors in accelerometer data. Ecol. Evol. 6 (3), 727–741. doi: 10.1002/ece3.1914
Cutler A., Cutler D. R., Stevens J. R. (2012). ““Random forest”,” in Ensemble machine learning: Methods and applications. Eds. Zhang C., Ma Y. (New York, NY: Springer), 157–175.
de Weerd N., van Langevelde F., van Oeveren H., Nolet B. A., Kölzsch A., Prins H. H. T., et al. (2015). Deriving animal behaviour from high-frequency GPS: Tracking cows in open and forested habitat. PloS One 10, e0129030. doi: 10.1371/journal.pone.0129030
Dowle M., Srinivasan A. (2019) Data.table: Extension of `data.frame`. Available at: https://CRAN.R-project.org/package=data.table.
Eastwood C., Klerkx L., Nettle R. (2017). Dynamics and distribution of public and private research and extension roles for technological innovation and diffusion: Case studies of the implementation and adaptation of precision farming technologies. J. Rural Stud. 49, 1–12. doi: 10.1016/j.jrurstud.2016.11.008
Friard O., Gamba M. (2016). BORIS: a free, versatile open-source event-logging software for video/audio coding and live observations. Methods Ecol. Evol. 7, 1325–1330. doi: 10.1111/2041-210X.12584
Grünewälder S., Broekhuis F., Macdonald D. W., Wilson A. M., McNutt J. W., Shawe-Taylor J., et al. (2012). Movement activity based classification of animal behaviour with an application to data from cheetah (Acinonyx jubatus). PloS One 7, e49120. doi: 10.1371/journal.pone.0049120
Hamidi D., Grinnell N. A., Komainda M., Riesch F., Horn J., Ammer S., et al. (2022). Heifers don't care: no evidence of negative impact on animal welfare of growing heifers when using virtual fences compared to physical fences for grazing. animal 16 (9), 100614. doi: 10.1016/j.animal.2022.100614
Hedlund L., Løvlie H. (2015). Personality and production: Nervous cows produce less milk. J. Dairy Sci. 98, 5819–5828. doi: 10.3168/jds.2014-8667
Hendriks S. J., Phyn C. V. C., Huzzey J. M., Mueller K. R., Turner S.-A., Donaghy D. J., et al. (2020). Graduate student literature review: Evaluating the appropriate use of wearable accelerometers in research to monitor lying behaviors of dairy cows. J. Dairy Sci. 103, 12140–12157. doi: 10.3168/jds.2019-17887
Herlin A., Brunberg E., Hultgren J., Högberg N., Rydberg A., Skarin A. (2021). Animal welfare implications of digital tools for monitoring and management of cattle and sheep on pasture. Animals 11, 829. doi: 10.3390/ani11030829
Homburger H., Schneider M. K., Hilfiker S., Lüscher A. (2014). Inferring behavioral states of grazing livestock from high-frequency position data alone. PloS One 9, e114522–e114522. doi: 10.1371/journal.pone.0114522
Hounslow J. L., Brewster L. R., Lear K. O., Guttridge T. L., Daly R., Whitney N. M., et al. (2019). Assessing the effects of sampling frequency on behavioural classification of accelerometer data. J. Exp. Mar. Biol. Ecol. 512, 22–30. doi: 10.1016/j.jembe.2018.12.003
Hutchings M. R., Gordon I. J., Robertson E., Kyriazakis I., Jackson F. (2000). Effects of parasitic status and level of feeding motivation on the diet selected by sheep grazing grass/clover swards. J. Agric. Sci. 135, 65–75. doi: 10.1017/S002185969900790X
Kamminga J. W. (2020). Hiding in the deep: Online animal activity recognition using motion sensors and machine learning. PhD Thesis. (University of Twente: Research UT, graduation UT, University of Twente). doi: 10.3990/1.9789036550550
Kamminga J. W., Le D. V., Meijers J. P., Bisby H., Meratnia N., Havinga P. J. M. (2018). Robust sensor-Orientation-Independent feature selection for animal activity recognition on collar tags. Proc. ACM Interact. Mob. Wearable Ubiquitous Technol. 2, 15:1–15:27. doi: 10.1145/3191747
Kohari D., Kosako T., Fukasawa M., Tsukada H. (2007). Effect of environmental enrichment by providing trees as rubbing objects in grassland: Grazing cattle need tree-grooming. Anim. Sci. J. 78, 413–416. doi: 10.1111/j.1740-0929.2007.00455.x
Komarek A. M., Dunston S., Enahoro D., Godfray H. C. J., Herrero M., Mason-D’Croz D., et al. (2021). Income, consumer preferences, and the future of livestock-derived food demand. Global Environ. Change 70, 102343. doi: 10.1016/j.gloenvcha.2021.102343
Kour H., Patison K. P., Corbet N. J., Swain D. L. (2021). Recording cattle maternal behaviour using proximity loggers and tri-axial accelerometers. Appl. Anim. Behav. Sci. 240, 105349. doi: 10.1016/j.applanim.2021.105349
Langford F. M., Rutherford K. M. D., Sherwood L., Jack M. C., Lawrence A. B., Haskell M. J. (2011). Behavior of cows during and after peak feeding time on organic and conventional dairy farms in the united kingdom. J. Dairy Sci. 94, 746–753. doi: 10.3168/jds.2010-3309
LeDell E., Gill N., Aiello S., Fu A., Candel A., Click C., et al. (2021). h2o: R interface for the “H2O” scalable machine learning platform (Available at: https://CRAN.R-project.org/package=h2o).
Leos-Barajas V., Photopoulou T., Langrock R., Patterson T. A., Watanabe Y. Y., Murgatroyd M., et al. (2017). Analysis of animal accelerometer data using hidden Markov models. Methods Ecol. Evol. 8, 161–173. doi: 10.1111/2041-210X.12657
Lush L., Wilson R. P., Holton M. D., Hopkins P., Marsden K. A., Chadwick D. R., et al. (2018). Classification of sheep urination events using accelerometers to aid improved measurements of livestock contributions to nitrous oxide emissions. Comput. Electron. Agric. 150, 170–177. doi: 10.1016/j.compag.2018.04.018
MacKay J. R. D., Turner S. P., Hyslop J., Deag J. M., Haskell M. J. (2013). Short-term temperament tests in beef cattle relate to long-term measures of behavior recorded in the home pen1. J. Anim. Sci. 91, 4917–4924. doi: 10.2527/jas.2012-5473
Mansbridge N., Mitsch J., Bollard N., Ellis K., Miguel-Pacheco G. G., Dottorini T., et al. (2018). Feature selection and comparison of machine learning algorithms in classification of grazing and rumination behaviour in sheep. Sensors 18. doi: 10.3390/s18103532
Michalk D. L., Kemp D. R., Badgery W. B., Wu J., Zhang Y., Thomassin P. J. (2019). Sustainability and future food security–a global perspective for livestock production. Land Degradation Dev. 30, 561–573. doi: 10.1002/ldr.3217
Mulvenna C. C., Marks N. J., Wilson R. P., Halsey L. G., Scantlebury D. M. (2022). Can metrics of acceleration provide accurate estimates of energy costs of locomotion on uneven terrain? using domestic sheep (Ovis aries) as an example. Anim. Biotelemetry 10, 8. doi: 10.1186/s40317-022-00281-3
Navarro G., Bravo V., Gallo C., Phillips C. J. C. (2019). Physiological and behavioural responses of cattle to high and low space, feed and water allowances during long distance transport in the south of Chile. Animals 9, 229. doi: 10.3390/ani9050229
Nedeva I. (2020). Primary factors influencing sheep welfare in intensive and extensive farming systems–a review article. Bulgarian J. Agric. Sci. 26, 97–106.
Nofence (2022). Available at: https://www.nofence.no/en/what-is-nofence (Accessed September 19, 2021).
Nuijten R. J. M., Gerrits T., Shamoun-Baranes J., Nolet B. A. (2020). Less is more: On-board lossy compression of accelerometer data increases biologging capacity. J. Anim. Ecol. 89, 237–247. doi: 10.1111/1365-2656.13164
O’Leary N. W., Byrne D. T., Garcia P., Werner J., Cabedoche M., Shalloo L. (2020). Grazing cow behavior’s association with mild and moderate lameness. Animals 10, 661. doi: 10.3390/ani10040661
Petherick J. C., McCosker K., Mayer D. G., Letchford P., McGowan M. (2013). Evaluation of the impacts of spaying by either the dropped ovary technique or ovariectomy via flank laparotomy on the welfare of bos indicus beef heifers and cows1. J. Anim. Sci. 91, 382–394. doi: 10.2527/jas.2012-5164
Rautiainen H., Alam M., Blackwell P. G., Skarin A. (2022). Identification of reindeer fine-scale foraging behaviour using tri-axial accelerometer data. Movement Ecol. 10, 40. doi: 10.1186/s40462-022-00339-0
R Core Team (2022). R: A language and environment for statistical computing (Vienna, Austria: R Foundation for Statistical Computing). Available at: https://www.R-project.org/.
Riaboff L., Poggi S., Madouasse A., Couvreur S., Aubin S., Bédère N., et al. (2020). Development of a methodological framework for a robust prediction of the main behaviours of dairy cows using a combination of machine learning algorithms on accelerometer data. Comput. Electron. Agric. 169, 105179. doi: 10.1016/j.compag.2019.105179
Riaboff L., Shalloo L., Smeaton A. F., Couvreur S., Madouasse A., Keane M. T. (2022). Predicting livestock behaviour using accelerometers: A systematic review of processing techniques for ruminant behaviour prediction from raw accelerometer data. Comput. Electron. Agric. 192, 106610. doi: 10.1016/j.compag.2021.106610
Robért B. D., White B. J., Renter D. G., Larson R. L. (2011). Determination of lying behavior patterns in healthy beef cattle by use of wireless accelerometers. Am. J. Veterinary Res. 72, 467–473. doi: 10.2460/ajvr.72.4.467
Rodriguez-Baena D. S., Gomez-Vela F. A., García-Torres M., Divina F., Barranco C. D., Daz-Diaz N., et al. (2020). Identifying livestock behavior patterns based on accelerometer dataset. J. Comput. Sci. 41, 101076. doi: 10.1016/j.jocs.2020.101076
R Studio Team (2021). RStudio: Integrated development environment for r (Boston: MA: RStudio, PBC). Available at: http://www.rstudio.com/.
Søraa R. A., Vik J. (2021). Boundaryless boundary-objects: Digital fencing of the CyborGoat in rural Norway. J. Rural Stud. 87, 23–31. doi: 10.1016/j.jrurstud.2021.08.015
Schellberg J., Hill M. J., Gerhards R., Rothmund M., Braun M. (2008). Precision agriculture on grassland: Applications, perspectives and constraints. Eur. J. Agron. 29, 59–71. doi: 10.1016/j.eja.2008.05.005
Sevi A., Casamassima D., Pulina G., Pazzona A. (2009). Factors of welfare reduction in dairy sheep and goats. Ital. J. Anim. Sci. 8, 81–101. doi: 10.4081/ijas.2009.s1.81
Shepard E. L. C., Wilson R. P., Halsey L. G., Quintana F., Laich A. G., Gleiss A. C., et al. (2008a). Derivation of body motion via appropriate smoothing of acceleration data. Aquat. Biol. 4, 235–241. doi: 10.3354/ab00104
Shepard E. L. C., Wilson R. P., Quintana F., Laich A. G., Liebsch N., Albareda D. A., et al. (2008b). Identification of animal movement patterns using tri-axial accelerometry. Endangered Species Res. 10, 47–60. doi: 10.3354/esr00084
Silanikove N. (2000). Effects of heat stress on the welfare of extensively managed domestic ruminants. Livestock Production Sci. 67, 1–18. doi: 10.1016/S0301-6226(00)00162-7
Sonne C., Alstrup A. K. O., Pertoldi C., Frikke J., Linder A. C., Styrishave B. (2022). Cortisol in manure from cattle enclosed with nofence virtual fencing. Animals 12 (21), 3017. doi: 10.3390/ani12213017
Soulsbury C. D., Gray H. E., Smith L. M., Braithwaite V., Cotter S. C., Elwood R. W., et al. (2020). The welfare and ethics of research involving wild animals: A primer. Methods Ecol. Evol. 11, 1164–1181. doi: 10.1111/2041-210X.13435
Spedener M., Tofastrud M., Devineau O., Zimmermann B. (2019). Microhabitat selection of free-ranging beef cattle in south-boreal forest. Appl. Anim. Behav. Sci. 213, 33–39. doi: 10.1016/j.applanim.2019.02.006
Theurer M. E., Amrine D. E., White B. J. (2013). Remote noninvasive assessment of pain and health status in cattle. Vet. Clin. North Am. Food Anim. Pract. 29, 59–74. doi: 10.1016/j.cvfa.2012.11.011
Tofastrud M., Devineau O., Zimmermann B. (2019). Habitat selection of free-ranging cattle in productive coniferous forests of south-eastern Norway. For. Ecol. Manage. 437, 1–9. doi: 10.1016/j.foreco.2019.01.014
Tofastrud M., Hegnes H., Devineau O., Zimmermann B. (2018). Activity patterns of free-ranging beef cattle in Norway. Acta Agriculturae Scandinavica Section A — Anim. Sci. 68, 39–47. doi: 10.1080/09064702.2018.1524928
Uenishi S., Oishi K., Kojima T., Kitajima K., Yasunaka Y., Sakai K., et al. (2021). A novel accelerometry approach combining information on classified behaviors and quantified physical activity for assessing health status of cattle: a preliminary study. Appl. Anim. Behav. Sci. 235, 105220. doi: 10.1016/j.applanim.2021.105220
Vázquez Diosdado J. A., Barker Z. E., Hodges H. R., Amory J. R., Croft D. P., Bell N. J., et al. (2015). Classification of behaviour in housed dairy cows using an accelerometer-based activity monitoring system. Anim. biotelemetry 3, 15. doi: 10.1186/s40317-015-0045-8
Verdon M., Langworthy A., Rawnsley R. (2021). Virtual fencing technology to intensively graze lactating dairy cattle. II: Effects on cow welfare and behavior. J. Dairy Sci. 104, 7084–7094. doi: 10.3168/jds.2020-19797
Wang Y., Nickel B., Rutishauser M., Bryce C. M., Williams T. M., Elkaim G., et al. (2015). Movement, resting, and attack behaviors of wild pumas are revealed by tri-axial accelerometer measurements. Movement Ecol. 3, 2. doi: 10.1186/s40462-015-0030-0
Welp T., Rushen J., Kramer D. L., Festa-Bianchet M., de Passillé A. M. B. (2004). Vigilance as a measure of fear in dairy cattle. Appl. Anim. Behav. Sci. 87, 1–13. doi: 10.1016/j.applanim.2003.12.013
Werkheiser I. (2018). Precision livestock farming and farmers’ duties to livestock. J. Agric. Environ. Ethics 31, 181–195. doi: 10.1007/s10806-018-9720-0
Williams H. J., Holton M. D., Shepard E. L. C., Largey N., Norman B., Ryan P. G., et al. (2017). Identification of animal movement patterns using tri-axial magnetometry. Mov Ecol. 5, 1–14. doi: 10.1186/s40462-017-0097-x
Keywords: free-ranging cattle, behavioral classification, animal behavior, accelerometry, virtual fence collars
Citation: Versluijs E, Niccolai LJ, Spedener M, Zimmermann B, Hessle A, Tofastrud M, Devineau O and Evans AL (2023) Classification of behaviors of free-ranging cattle using accelerometry signatures collected by virtual fence collars. Front. Anim. Sci. 4:1083272. doi: 10.3389/fanim.2023.1083272
Received: 28 October 2022; Accepted: 27 March 2023;
Published: 14 April 2023.
Edited by:
Carolina Pugliese, University of Florence, ItalyReviewed by:
Martin Komainda, Institute of Grassland Science, University of Göttingen, GermanyGamaliel Simanungkalit, University of New England, Australia
Said Benaissa, Ghent University, Belgium
Copyright © 2023 Versluijs, Niccolai, Spedener, Zimmermann, Hessle, Tofastrud, Devineau and Evans. This is an open-access article distributed under the terms of the Creative Commons Attribution License (CC BY). The use, distribution or reproduction in other forums is permitted, provided the original author(s) and the copyright owner(s) are credited and that the original publication in this journal is cited, in accordance with accepted academic practice. No use, distribution or reproduction is permitted which does not comply with these terms.
*Correspondence: Erik Versluijs, ZXJpay52ZXJzbHVpanNAaW5uLm5v
†These authors have contributed equally to this work and share first authorship