 A.W. Altman
 A. A. Adams2
 K. R. McLeod
 E. S. Vanzant
- 1Department of Animal and Food Sciences, University of Kentucky, Lexington, KY, United States
- 2Department of Veterinary Sciences, University of Kentucky, Lexington, KY, United States
Two experiments (n=12 Angus heifers/experiment) investigated influences of animal temperament, as indicated by exit velocity (EV; determined at weaning) and consumption of toxic endophyte-infected tall fescue seed on peripheral lymphocyte production of interferon-γ. Heifers were selected from calves born on the University of Kentucky’s C. Oran Little Research Center. In experiment 1, calves were randomly selected from 50 heifers within a single calf crop. In experiment 2, calves with the 6 fastest and 6 slowest EV in the subsequent year’s calf crop were selected. In both experiments, heifers were assigned to either high or low EV treatments based on relative ranking, and endophyte treatments (toxic endophyte-infected, E+, or endophyte-free, E-, fescue seed) were balanced by body weight. Rations were restricted to 1.8 x NEm and common diet was top-dressed with fescue seed each morning. Experiment 1 had four phases (pre-endophyte treatment/thermoneutral, increased room temperature, increased room temperature/endophyte treatment, and post-endophyte/thermoneutral) and experiment 2 had two phases (increased room temperature/endophyte treatment and thermoneutral). During endophyte treatment phases, heifers were fed their respective treatment seed. During all other phases, all heifers received E- seed. In experiment 1, proportions of lymphocytes producing interferon-γ were decreased in E+ heifers during the heat/endophyte phase (P=0.03) whereas during the subsequent thermoneutral period this response was greater in high, compared with low, EV heifers on E- treatment, with no difference observed among E+ heifers (interaction P=0.08). Also during the recovery phase, average lymphocyte production of interferon-γ was higher in E+ heifers (P=0.01). Consistent with experiment 1 findings, during the recovery period of experiment 2, endophyte exposure increased the per cell production of interferon-γ (P<0.01). In this experiment, the difference was of sufficient magnitude to result in a concomitant increase (P=0.03) in total interferon-γ production during that period. These results indicate peripheral lymphocyte production of interferon-γ can be influenced by both EV and endophyte exposure following periods of increased ambient temperature humidity indices, though there was minimal indication of interactions between temperament and alkaloid exposure. This may imply that cattle with high exit velocities and those previously exposed to toxic endophyte-infected tall fescue are better poised against cell-mediated challenges.
Introduction
Tall fescue (Lolium arundinaceum) is the most prevalent forage produced in the Southeastern United States (Hoveland, 1993). Thus, many beef cattle raised in this region are exposed to tall fescue and its endophytic alkaloids from an early age. This grass has been found to contain an endophytic fungus (Epichloë coenophiala), which confers increased hardiness and drought resistance to the plant (Hill et al., 1991). However, alkaloid compounds produced by this fungus are detrimental to grazing animals, resulting in decreased gains and overall poor performance (Stuedemann and Hoveland, 1988). The negative effects of the fungal alkaloids are compounded during times of heat stress (Spiers et al., 2012).
Relatively little is known about the immunological implications of endophyte exposure in cattle. Filipov et al. (1999) reported modulation of acute phase responses to ergovaline exposure. Additionally, steers grazing endophyte-infected tall fescue pastures and exhibiting characteristic signs of fescue toxicosis maintained lower major histocompatibility class II expression and phagocytic monocyte activity compared with steers grazing endophyte-free pastures (Saker et al., 1998; Saker et al., 2001). However, in none of these studies were the direct effects due to alkaloids distinguished from potential effects of alkaloid consumption on dry matter (DM) intake. Thus, whether alkaloids per se directly influence immunological responses in cattle remains unknown.
Interferon-gamma (IFN-γ) is an important immunological effector protein, or cytokine, that is crucial for combatting viruses and intracellular bacteria. This cytokine is produced by natural killer cells, natural killer T cells, CD8+ T cells, and CD4+ TH1 T cells. Interferon-γ is used by the immune system to upregulate differentiation of CD4+ T cells to the TH1 subset, which further enhances cell-mediated defenses against viruses and intracellular bacteria (Schoenborn and Wilson, 2007). Additionally, IFN-γ stimulates production of other pro-inflammatory cytokines through activation of macrophages (Boehm et al., 1997). Furthermore, recent studies indicated IFN-γ may differ among animals with different temperament rankings. Work from our laboratory has demonstrated that heifers with higher exit velocities had depressed systemic IFN-γ concentrations (Altman, 2015) and increased rectal temperatures (Altman et al., 2016) during an acute phase response to lipopolysaccharide injection.
A wide range of studies have demonstrated that temperament is correlated with growth rates in growing and finishing cattle, and that chute exit velocity (EV) has been the temperament-related measure most consistently related to growth (Burrow and Dillon, 1997; Petherick et al., 2002; Falkenberg et al., 2005; Cafe et al., 2011; Bruno et al., 2016; Bruno et al., 2017). In addition to relationships with growth, researchers have generally found that immunological function is compromised in so-called ‘temperamental’ cattle (Oliphint, 2006; Burdick et al., 2011). Oliphint (2006) reported cattle with poor temperament scores had lower in vitro lymphocyte proliferative responses. Higher cortisol release, which has been correlated with fast exit velocities and aggressive chute behavior (defined as ‘poor temperament’; Fell et al., 1999), may be associated with a decrease in lymphocyte proliferation in cattle (Blecha and Baker, 1986), and has been shown to reduce interleukin-12 and IFN-γ production in humans (De Jong et al., 1999). Combined, these studies suggest that temperament effects may be particularly important during the feedlot receiving phase, especially when considering the implications of suppressed immunological function coinciding with a period of high stress and exposure to novel pathogens. Periods of adjustment, such as during weaning and feedlot receiving, are stressful events for the calf which may compromise the immune system (Blecha et al., 1984; Duff and Galyean, 2007). An animal’s innate response to stimuli, or temperament, may further compound any negative effects of a new environment. Potential interactions between temperament and endophyte exposure on immunological function might help explain phenotypic variation among individual animal health responses during the feedlot receiving phase subsequent to fescue grazing.
The hypothesis for these experiments was that calves with higher exit velocities would maintain lower lymphocyte IFN-γ production and consumption of endophytic alkaloids would further decrease this response in an additive fashion (i.e., that exit velocity and alkaloid consumption do not interact). Experiment 2 (EXP 2) was developed to refine the model used in EXP 1, specifically by focusing on calves selected from the two extremes of the measured exit velocity range to enhance the ability to detect potential effects of this factor upon lymphocyte IFN-γ production. Furthermore, we hypothesized that these responses would be particularly evident while animals were consuming alkaloids and that they would return to baseline levels after alkaloids were removed from the ration. Thus, our objective was to determine whether animal temperament (as measured by exit velocity) and endophytic alkaloid consumption interact in their effects on the humoral and cell-mediated immune responses of healthy cattle, and to describe the general nature of the effects of both factors.
Materials and methods
All methods were approved by the University of Kentucky Institutional Animal Care and Use Committee.
Each experiment used a completely randomized design with repeated measures. There were two dietary treatments (endophyte-infected (E+) and endophyte-free (E-) fescue seed) and heifers were categorized within one of two flight response designations (high/low), as determined by EV (see below). Endophyte treatment assignments were balanced for body weight and EV. Heifers were placed in individual pens (3.0 x 3.7 m) inside environmentally controlled research building for the duration of the experiments.
Experiment 1
Cattle and processing
Twelve Angus heifers (277 ± 29.3 kg BW; 248 ± 21 d of age) out of 8 sires, born on the University of Kentucky C. Oran Little Research farm, were used in this experiment. At weaning (d-55), heifers were vaccinated against bacterial and viral pathogens (Bovi-Shield Gold 5, Zoetis, Florham Park, NJ; Once PMH, Merck Animal Health, Summit, NJ; Somubac, Zoetis; Ultrachoice 7, Zoetis; Autogenous Pinkeye, Central KY Vet Center), and given an injection of anthelmintic (Dectomax, Zoetis). Exit velocity, a measure of temperament, was also recorded at this time, and was calculated as the time it took for a heifer to transverse 1.68m upon release from the headgate, as measured using an infrared trip-wire system (Bruno et al., 2016). The six heifers with the fastest exit velocities were consigned to the high exit velocity treatment (mean ± s.d. = 2.50 ± 0.455 m/s), and the remainder to the low exit velocity treatment (1.42 ± 0.247 m/s). Although exit velocity measures vary over time, and it may seem natural that averages of serial measures might produce estimates with lower variance, studies from our lab and others indicate that initial measures of exit velocity appear to be more valuable predictors of future performance and carcass characteristics due to the naïvety of the animal to facilities and handling (Behrends et al., 2009; Bruno et al., 2016; Bruno et al., 2017; Altman et al., 2020). Following the weaning period, heifers were halter broken for adaptation to human handling. Repeated exposure to human handling has been demonstrated to result in slower exit velocities but not influence relative exit velocity groupings within a cohort over time (Curley et al., 2006).
The experiment consisted of 4 periods: thermoneutral conditions with all calves on E- diet (d1-21; P1), increased temperature-humidity index conditions (THI) and all calves on E- diet (d22-28; P2), increased THI and calves on respective E+ and E- diets (d29-50; P3), and return to thermoneutral conditions with all calves on E- diet during the recovery period (d51-78; P4). Body weights and blood samples were obtained at weekly intervals throughout the experiment (d1, 8, 15, 22, 29, 36, 43, 50, 57, 64, 71, and 78). All calves were naïve to endophyte-infected fescue, thereby preventing any potential effects of prior exposure from influencing results. Daily feed and water consumption were recorded throughout the experimental period.
The basal diet (Tables 1, 2) was prepared prior to initiation of the experiment, without inclusion of fescue (E+ and E-) seed. Sufficient seed was included to provide 10μg ergovaline·kg BW-1·d-1 for the E+ ration. Rations were restricted to 1.8 x NEm, and initially provided based upon starting weights, then increased to match current body weight at the start of the fescue exposure period to ensure heifers received the targeted ergovaline dose. Pens were cleaned prior to feeding and heifers were fed once daily at 0700. Heifers were randomly assigned to treatment diets, with groups balanced for weight and weaning exit velocity. All feed offered to heifers was consumed throughout the duration of the study.
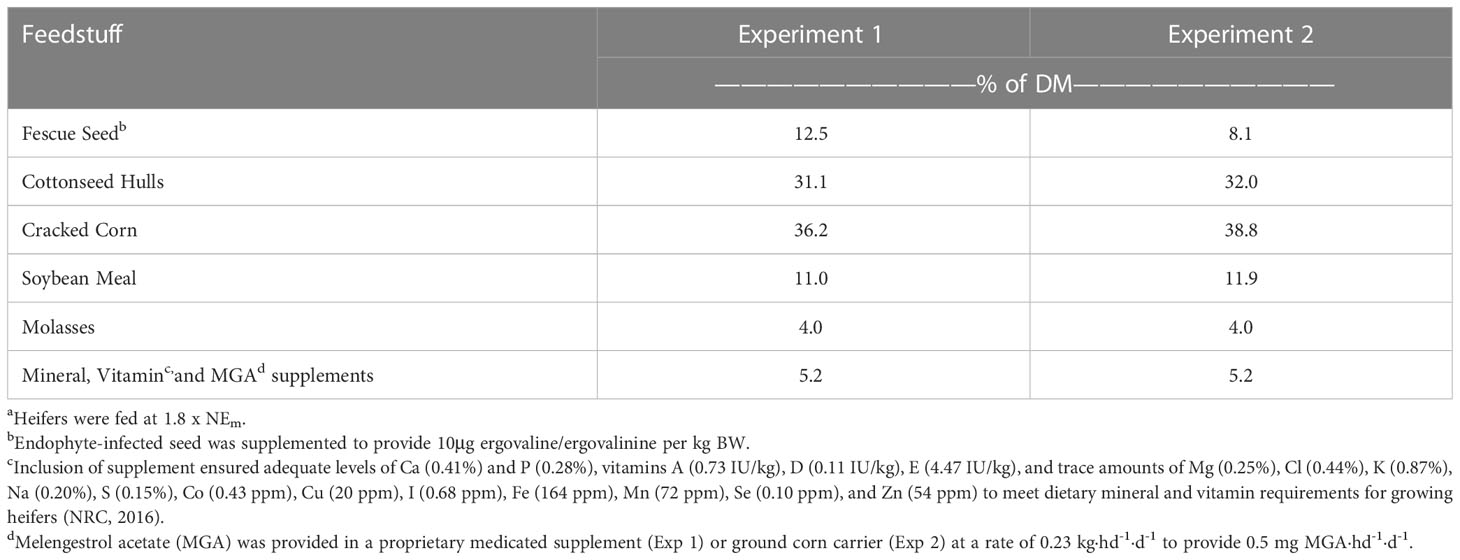
Table 1 Feedstuff composition of experimental dietsa.
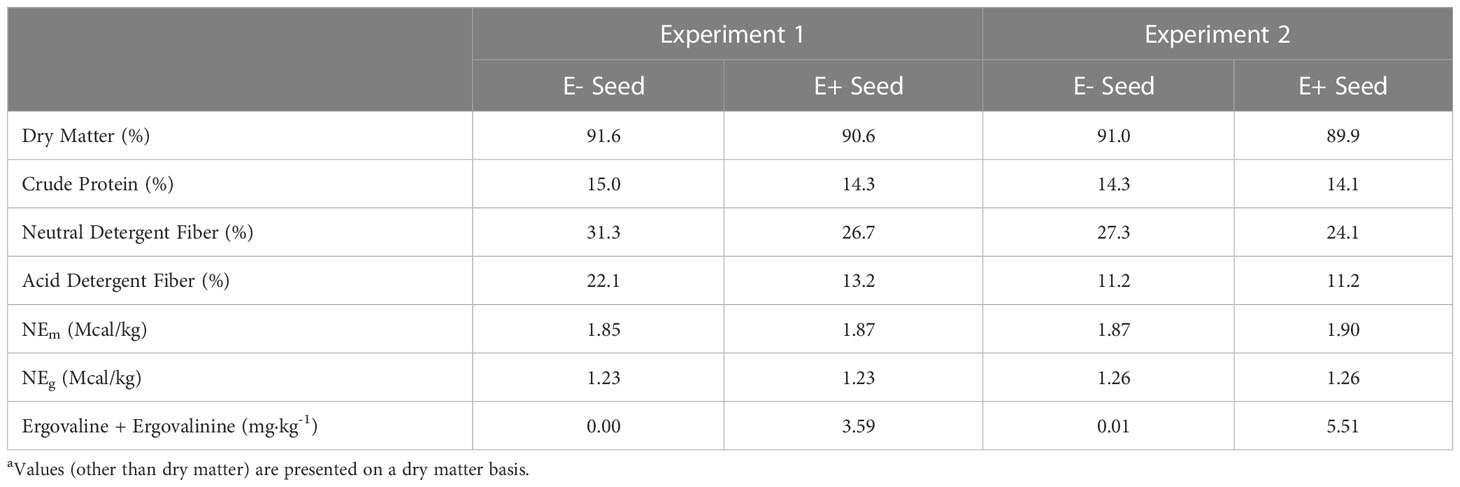
Table 2 Chemical composition of endophyte-infected and endophyte-free seeda.
Melangesterol acetate (MGA; 0.5 mg·hd-1·d-1) was provided to control for the effects of estrous and offered prior to the basal diet each day (in 0.23 kg·hd-1·d-1 of a commercial supplement) to ensure all heifers consumed the daily dosage. Although MGA has been reported to negatively influence immunological responses (Corrigan et al., 2007), the noted differences in that study were attributed to agents of the innate immune system involved with oxidative burst, with no differences observed in lymphocyte and monocyte concentrations due to MGA inclusion. Conversely, several studies have demonstrated an influence of estrogens, whose synthesis is inhibited by MGA, on lymphocyte populations (Paavonen et al., 1981; Sthoeger et al., 1988; Jenkins et al., 2001). Estrogen concentrations will vary over time as a result of estrous cycling (Lyimo et al., 2000). Thus, as both experiments within the current study were specifically interested in production of interferon-γ by lymphocytes, and experiment 2 additionally examined humoral responses to an extracellular bacterial challenge, inclusion of MGA to control for these potential fluctuations was deemed necessary.
Fescue seed (E+/E-) was top-dressed on the basal diet and mixed by hand each morning to ensure appropriate seed inclusion for each heifer. Endophyte-infected seed was only provided to cattle on the E+ treatment during P3 of the study, with all heifers receiving E- seed during P1, P2, and P4. All heifers consumed the entirety of their rations throughout the experiment.
Environmental temperatures were monitored using a Hobo environmental temperature logger set to record ambient temperature and humidity every 5 minutes (Figure 1). On d1, heifers were randomly assigned to individual pens (3.0 x 3.7 m) inside an environmentally controlled barn, where they remained for the duration of the study. Ambient temperature was set at 22.2°C and remained at this level during P1 of the experiment. Calves were fed E- fescue seed with the basal diet during this time to establish baseline levels of lymphocyte IFN-γ production. At the start of P2, ambient temperatures were set to cycle between 33.3°C during the day and 22.2°C at night. This was to simulate average temperature fluctuations experienced by cattle in Kentucky during July and August, when effects of fescue toxicosis are at their most severe (Hemken et al., 1981) and has been previously shown to be sufficient for inducing signs of fescue toxicosis in cattle during periods of tall fescue seed consumption (Spiers et al., 2012). Temperature humidity index (THI) was calculated as described by Hahn (1999):
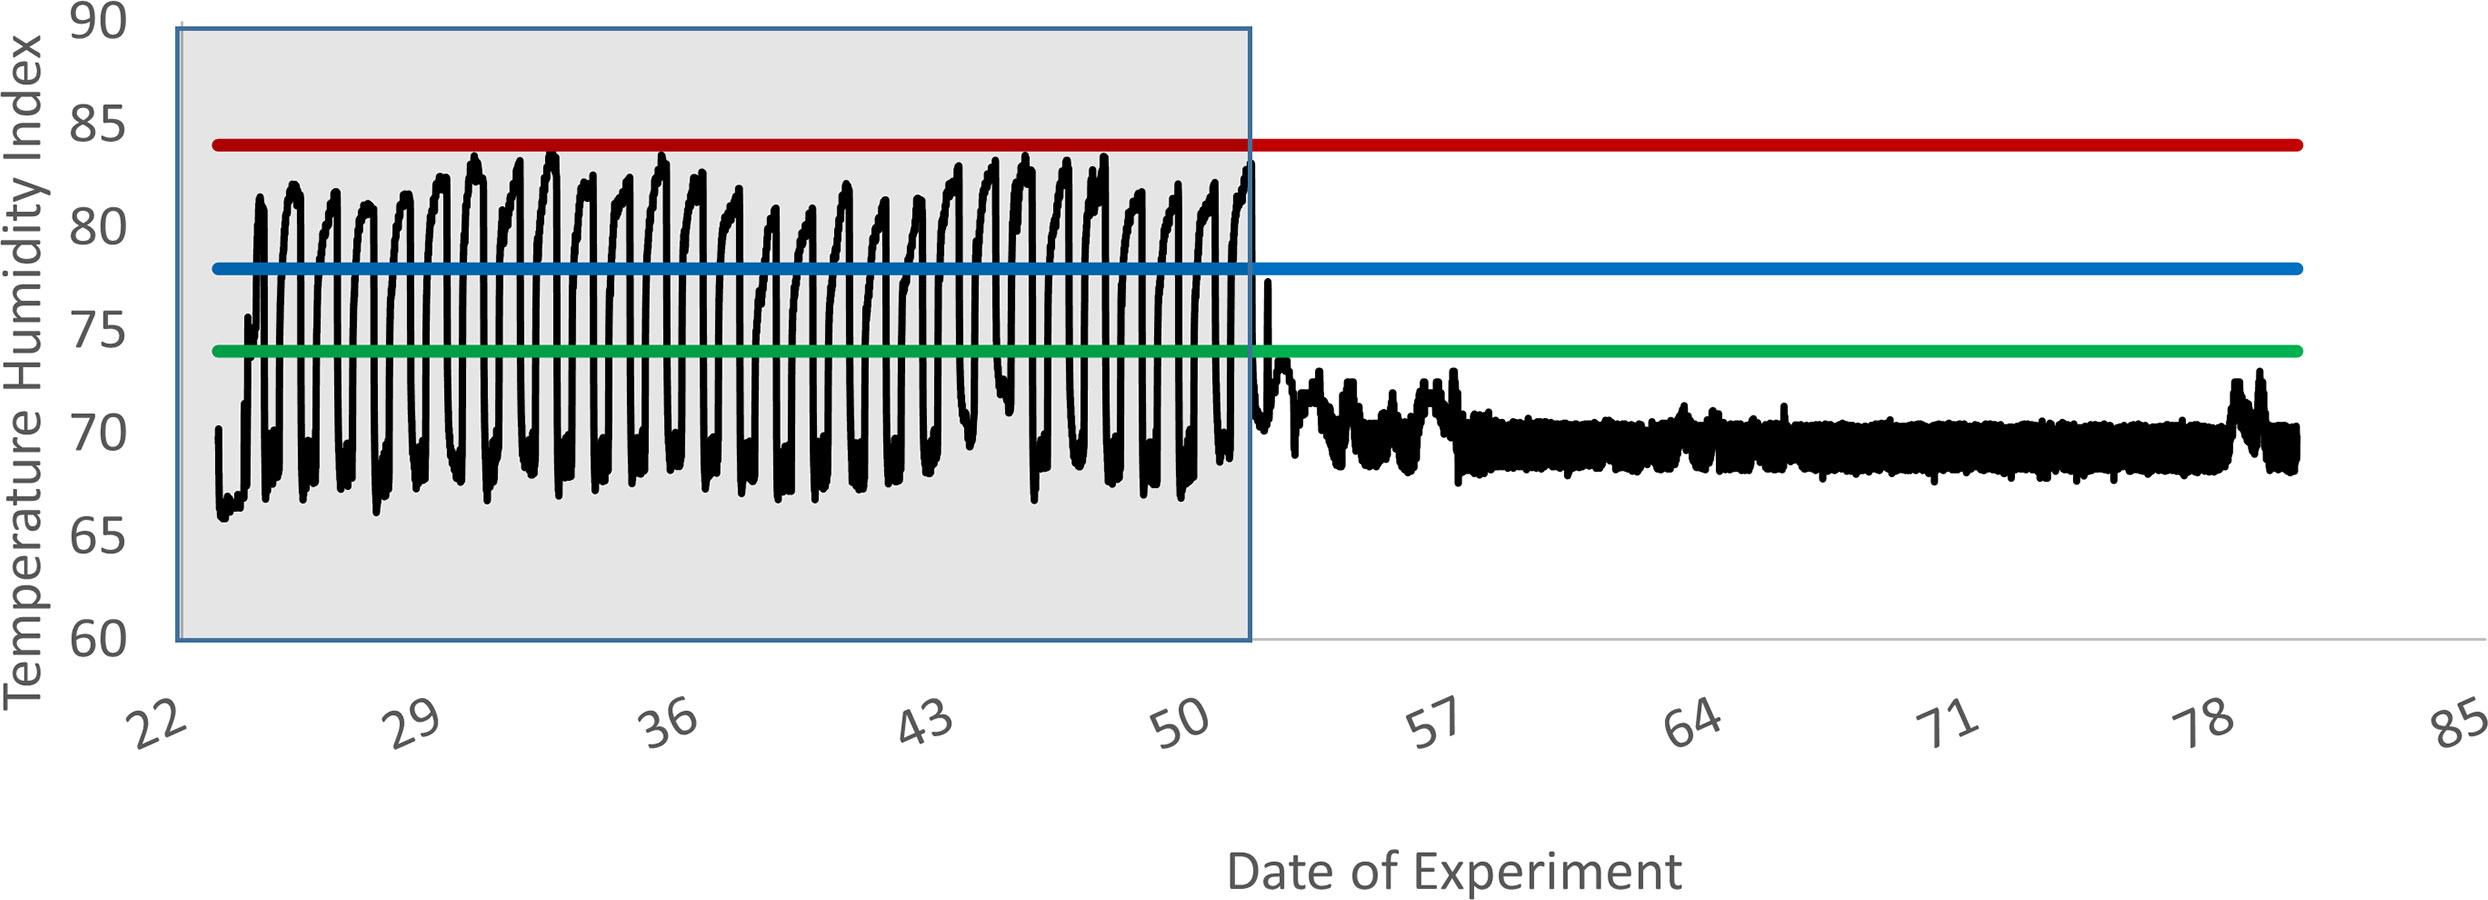
Figure 1 Experiment 1 temperature humidity index within the animal room. This graph depicts the fluctuations in the temperature humidity index (solid line) across time, beginning on d 22, when the heat stress period began, and continuing until the last day of the experiment (d78). Data logger was installed at the beginning of the heat stress period as a secondary system to ensure the air handling system was following the designated heat cycle. Prior to this installation, room temperature was set to a constant 22°C, as is depicted above for days 51 to 78. Also depicted are the three levels of heat stress, as described by Hahn (1999): Alert = green line, Danger = blue line, Emergency = red line. Shaded area represents the heat stress period.
Increased THI conditions continued through P3, when heifers were provided their respective endophyte seed treatments. At the start of the recovery period, ambient temperatures returned to continuous thermoneutral conditions, and all heifers returned to the E- diet until the conclusion of the study on d78.
Blood sampling
Heifers were placed in a headgate once a week, pre-prandial, for collection of peripheral blood samples (d1, d8, 15, 22, 29, 36, 43, 50, 57, 64, 71, and 78). At each sampling, 45 mL of blood was collected from each heifer via jugular venipuncture into 3-15 mL Na-heparin tubes (i.e., “red top tubes” with 1 drop of 1,000 usp·mL-1 heparin added) to isolate PBMC for in vitro analysis of IFN-γ production.
PBMC isolation
Peripheral blood mononuclear cells were isolated from heparinized blood samples following a modified protocol of Breathnach et al. (2006). Briefly, samples were centrifuged at 800 x g for 30 minutes with a slow brake. The buffy coat was removed, added to 10 mL phosphate buffer solution (PBS), layered over 10 mL Ficoll-Paque Plus™ solution (Amersham Biosciences, Piscataway, NJ), and spun at 500 x g for 30 minutes with a slow brake. Cells were harvested, added to 20 mL PBS, and centrifuged at 500 x g for 10 minutes with a fast brake. All subsequent centrifugation was performed at 300 x g for 10 minutes with a fast brake. Supernatant was removed and cell pellets resuspended in 5 mL PBS. To this suspension, 10 mL D2O and 10 mL RPMI were added, with suspension diluted to a final volume of 45 mL with PBS, after which the suspension was centrifuged. Cells were then washed in PBS again, recentrifuged, and resuspended in 10 mL of PBS. From this 10 mL suspension, 100 μL were mixed with 900 μL of PBS to be counted using a Vicell Counter-XR (Beckman Coulter, Miami, FL). Resulting data were used to calculate volume needed from 10 mL suspension to plate at 4 x 10⁶ cells/mL. Desired volume was transferred to a 15 mL tube and centrifuged. Supernatant was removed and cells resuspended in 4 mL cRPMI (consisting of 10% fetal bovine serum, 1% penicillin-streptomycin-glutamine, 0.1% 2-mercaptoethanol, and 88.9% RPMI) and plated in 4 wells of a 24 well plate at 1 x 10⁶ cells/mL.
Stimulation of samples
The isolated PBMC samples were arranged in duplicate in a 24-well plate with each sample split between a control well and stimulated well. Two μL of brefeldin A (BFA) were added to each well to prevent protein secretion (i.e. IFN-γ; Fujiwara et al., 1988) and allow for measurement of IFN-γ production in control and stimulated cells. The stimulated sample wells additionally received 10 μL of phorbol 12-myristate 13-acetate (PMA)/ionomycin (Breathnach et al., 2006) to preferentially activate IFN-γ production by TH1 lymphocytes (Baran et al., 2001; Ai et al., 2013). Following inoculation, well-plates were incubated in 5% CO2 for 4 hours at 37°C (Breathnach et al., 2006). At the completion of the 4-hour incubation period, 200 μL were transferred from each sample well to a 96-well plate and centrifuged at 500 x g for 5 minutes. Supernatant was removed from the wells, cells were fixed in 100 μL of 2% paraformaldehyde, and the plates were placed in a 4°C refrigerator overnight (Breathnach et al., 2006).
Intracellular staining and flow cytometry
Following overnight incubation in the refrigerator, cells were centrifuged at 500 x g and resuspended in 150 μL saponin buffer (1% fetal bovine serum, 0.1% saponin, and 0.1% sodium azide). Prior to flow cytometry analysis, cells were stained with mouse IgG1 anti-bovine IFN-γ FITC conjugated antibody (Thermo-Fisher, Waltham, MA) at a concentration of 10 μg antibody/mL saponin buffer. Suspended cells were incubated on ice for 30 minutes, then centrifuged at 500 x g for 5 minutes twice, with intermediary resuspension in saponin buffer. After the second centrifugation, cells were resuspended in FACS buffer in preparation for analysis. Using a FACSCalibur flow cytometer (Becton Dickinson, San Jose, CA), PBMC samples were gated around lymphocyte populations using forward and side scatter parameters. Thirty thousand gated events per sample were acquired for this analysis. Control samples were gated at 1%, with stimulated samples compared to the control sample to determine treatment responses. Samples were analyzed for percent of gated samples expressing IFN-γ and the mean expression of IFN-γ per cell within the gated population (MFI). Post-analysis, these two parameters were multiplied together to obtain an approximate measure of total IFN-γ production by the gated lymphocyte population (Darrah et al., 2007).
Experiment 2
For EXP 2, changes in selection criteria were completed to potentially decrease the variance of responses within exit velocity treatment (described below). Specifically, we believed the similarity of average exit velocity between groups may have prevented detection of treatment effects during EXP 1. Similarly, no adjustment period (i.e., P1 of EXP 1) was included for EXP 2 (described below). The experiment was designed to investigate how IFN-γ production may be affected by concurrent changes to alkaloid concentration in the diet, ambient conditions, and physical environment. Expressly, we sought to provide a greater challenge to the immune system through simultaneous application of multiple stressors, which may better represent what could be expected in calves transitioning from a cow-calf to backgrounding environment.
Cattle and processing
Twelve Angus heifers out of 8 sires (247 ± 28.2 kg BW; 219 ± 15.2 days of age), born on the University of Kentucky C. Oran Little Research farm, were split into high (n = 6; weaning exit velocity = 3.55 ± 0.279 m/s) and low (n = 6; weaning exit velocity = 1.29 ± 0.241 m/s) exit velocity treatments and placed on either an E+ or E- diet, in a 2 x 2 factorial treatment structure. Calves were weaned, weighed, and evaluated for weaning EV 50 days prior to the start of the experiment. Heifer calves with the highest (n = 6) and lowest (n = 6) EV measured for heifers in that calf crop (n = 47) were selected to maximize the opportunity for detecting differences due to exit velocity. Subsequent to the weaning period, heifers were halter broken. During this time, heifers were vaccinated against bacterial and viral pathogens (Bovi-Shield Gold 5, Zoetis; Once PMH, Merck Animal Health; Somubac, Zoetis; Ultrachoice 7, Zoetis).
The basal diet was formulated and prepared as described for EXP 1 (Tables 1, 2). Feed was again offered at 1.8 x NEm, based on initial BW, and remained constant throughout the experimental period, with MGA provided at 0.5 mg·hd-1·d-1 to prevent estrous cycling during the study. Endophyte treatments were applied during P1 (d1 to 28) of the experiment, with the appropriate seed (E+/E-) provided for each heifer. Calves on the E+ treatment received endophyte-free seed in place of endophyte-infected seed during P2 (d29 to 57; recovery period) to observe residual effects of endophyte exposure upon immune responses. Heifers consumed all offered feed each day, ensuring all calves consumed targeted amounts of ergovaline. Water intake for each heifer was determined using DLJ Multi-Jet water meters (Daniel L. Jerman Co., Hackensack, NJ, USA) and recorded each morning. Pens were sprayed clean daily to remove any fecal material and urine present in the pen to maintain a clean area for the calves.
Body weights
Calf body weights were recorded at the start (d1) and conclusion of the experiment (d57). To reduce the risk of exposing heifers to outside pathogens, blood samples were collected in the animal pen rather than the head chute as in EXP. 1. Therefore, interim body weight data were not collected during EXP 2. Thus, average daily gain (ADG) and gain to feed (G:F) were determined using only experiment start and ending weights.
Room and rumen temperature
At the start of the experiment, pen room temperatures were programmed to follow a cyclical temperature pattern to establish an increased THI environment during P1, as described for P2 and P3 of EXP 1. Room THI was also calculated as described in EXP 1. Environmental conditions were monitored using a Hobo environmental temperature logger set to record ambient temperature and relative humidity every 5 minutes. Temperatures were lowered to continuous thermoneutral (22°C) following the E+ consumption period (d29) and remained there for the duration of the study.
On d15 of the study, a temperature-monitoring rumen bolus (SSL001-CT, SmartStock, Pawnee, OK) was placed in each heifer. Boluses were set to record temperature every 15 minutes, and wirelessly transmitted this data to a data logger. Rumen temperature measurements were collected through d48.
Blood sampling
Methods for collection of blood samples for in vitro lymphocyte analysis were as described for EXP 1, with the exception that samples were collected in the pen rather than in a head gate. This change in methodology was an attempt to minimize stress associated with collections and the chance of exposure to any pathogens existing outside the pen room. Peripheral blood samples were collected on d8, 15, 29, 36, 43, and 57. Samples were collected on d1 using the same flow cytometer as experiment 1, but due to a malfunction of the flow cytometer during analysis of d8 samples, those results were excluded from data analyses. Following this incident, sample analyses were performed using an Attune NxT flow cytometer (Thermo Fisher Scientific, Waltham, MA). An additional 10 mL of blood was collected via jugular venipuncture into 10 mL additive-free Vacutainer (Becton Dickinson, Franklin Lakes, NJ) tubes for serum analysis of humoral immunity on d57.
Humoral immunity
Treatment effects on humoral immunity were assessed by serum antibody titer responses following a vaccination protocol timed to produce a peak response on the last day of the experiment. To accomplish this, animals received a primary vaccination against Leptospirosis pomona (L5 SQ, Merck) on d29, and a booster vaccination on d43. Serum blood samples were collected on d57 and subjected to a microscopic agglutination test for detection of L. pomona antibodies as described by Bruno et al. (2018).
Statistics
Experiment 1
Measured average lymphocyte production of IFN-γ, proportion of lymphocytes producing this cytokine, and the product of these (total lymphocyte IFN-γ production) from d1, 8, 15, and d22 (i.e., P1; pre-heat and pre-endophyte treatment) were each averaged to obtain representative baseline values for each animal. These baseline values were regressed against weaning exit velocity to identify potential relationships between baseline cell-mediated immunity and exit velocity. In addition, the responses from d1 of EXP 2 (obtained using the same flow cytometer as EXP 1) were included in this regression analysis. One heifer in EXP 2 was excluded in this regression due to low cell count numbers. Proc Reg of SAS (9.4; Cary, N.C.) was utilized to perform this analysis, with weaning exit velocity (as a continuous variable) and experiment (EXP 1/EXP 2) included in the model statement.
Average lymphocyte IFN-γ production, the proportion of lymphocytes producing this cytokine, and the product of these two measures (to approximate the total lymphocyte population production of IFN-γ; Darrah et al., 2007) were analyzed using the mixed procedure of SAS (9.4; Cary, N.C.), with endophyte treatment (E+ and E-) and weaning exit velocity designation (high and low) as fixed effects, and the Kenward-Roger denominator degrees of freedom method. Data were analyzed separately within each of the 4 periods described above. Data from P1, 3, and 4 were analyzed using the repeated measures option with a first-order autoregressive covariance structure, with sampling date included as the repeated effect in the model. This was not the case for P2, which included a single sample date. An average of the three sampling points from P1 was included as a covariate in the model statement for each of the three IFN-γ measurement parameters in the analyses for P2 through P4. Independent-slope analyses indicated that covariate did not interact with treatments, so a common-slope covariate model was used in each case. Studentized residuals were assessed for normality and outlier detection by examining Q-Q plots (from SAS Proc Mixed output) and skewness and kurtosis values (from SAS Proc Univariate). One outlier value was removed for total IFN-γ during P3. Although no significant treatment or time effects were detected either with or without this observation, its presence had a substantial impact on the LSMEAN for the endophyte-free/low exit velocity treatment (inflated by 39%) and the associated SEM (inflated by 54%).
Water consumption was averaged by week and divided by the animal’s body weight to standardize values as a percentage of body weight, and natural log transformed to meet the assumptions of ANOVA. Water consumption data from before day 15 was excluded to allow for heifer familiarization to waterer usage. Data collected from 2 heifers were determined to be outliers and excluded from analyses. Main effects included in the model were endophyte, exit velocity, and their interaction, with denominator degrees of freedom calculated using the Kenward-Roger method. Data were analyzed within period.
Average daily gain was analyzed using the GLM procedure of SAS (9.4) and calculated for the whole experimental period and within 3 periods: d 1 to 29 (P1 and P2; pre-endophyte treatment period), 29 to 57 (P3; endophyte treatment period), and 57 to 78 (P4; post-endophyte treatment period), as well as for the whole experiment. Main effects were endophyte, exit velocity treatment, and their interaction.
When significant interactions were detected between main effects, all pairwise means were compared using the Tukey-Kramer adjustment with the SAS pdiff option.
Experiment 2
Leptospirosis pomona titer responses, ADG, and G:F were analyzed using the GLM procedure of SAS (9.4). Prior to analysis, titer responses were natural log transformed to provide a normalized data set, thereby meeting the assumptions of ANOVA. The models for these three variables included endophyte treatment, exit velocity, and their interaction. The interaction terms endophyte x week and exit velocity x week were pooled with the error term for ADG and G:F models after initial analysis indicated that these interactions were nonsignificant (P ≥ 0.58).
Water intake was analyzed separately within each period (P1 and P2), whereas ADG and G:F were analyzed for the entire experimental period (d1 to 57).
Water intake (averaged across each week), humoral, and PBMC data were divided into two periods, which corresponded with the experimental timeline. Data were analyzed with the mixed procedure of SAS (9.4) using the repeated option with a first-order autoregressive covariance structure and heifer specified as the subject. The Kenward-Roger method was used to calculate denominator degrees of freedom, and the model included endophyte, exit velocity, their interaction, week, endophyte x week, and exit velocity x week. After initial analysis, endophyte x week and exit velocity x week were pooled with the error term for the PBMC model in both periods, as no interactions with week were detected (P ≥ 0.37).
Within each period, daily amplitude, acrophase, and mesor parameters (Refinetti et al., 2007) were determined for ruminal temperature for each heifer using code written in MATLAB Release 2013b (The MathWorks, Inc., Natick, MA). These three response variables were then analyzed using the mixed procedure of SAS (9.4) with repeated options using the first-order autoregressive covariance structure and heifer specified as the subject. Denominator degrees of freedom were calculated using the Kenward Roger method, and the model included endophyte, exit velocity, and their interaction. Assessment of normality, outlier detection, and mean separation were performed as described for EXP 1. One data point was removed from the baseline data of EXP 2 due to an insufficient number of cells harvested from the sample. Additionally, the per-cell IFN-γ production for one animal (on the endophyte-free/high exit velocity treatment) during sampling week 8 (in P2) was identified as an outlier, resulting in the removal of all IFN-γ data for that observation.
For all analyses in both experiments, significance was set at P ≤ 0.10, and trends considered at 0.10 < P ≤ 0.15.
Results
Experiment 1
Environmental conditions
Room THI (Figure 1) fluctuated on d 22 through d 50 as designed, creating an environment during the day previously associated with decreased steer growth (Hahn, 1999) and allowing for cooling in the evening to simulate mid-summer ambient conditions in central Kentucky. Temperatures remained constant during the designated thermoneutral periods, allowing for a THI conducive to optimal steer growth (Hahn, 1999).
Cell-mediated immunity
Trends across time for total in vitro lymphocyte production of IFN-γ are shown for both experiments in Figure 2. The largest week-to-week increase was observed in EXP 1 after one week of exposure to elevated THI (before exposure to endophyte treatments; increase equal to 53% of the mean EXP 1 response), and the largest week-to-week decrease (70% of EXP 1 mean) occurred at the end of the subsequent week, when THI remained elevated, and ½ of the animals began receiving endophyte-infected seed. Because the time effects did not interact with endophyte (P = 0.92, Table 3) during this period, it would appear that this large decrease was not related to endophyte exposure, per se. Across both experiments, there was substantial week-to-week variation in lymphocyte IFN-γ production during time periods in which experimental conditions remained unaltered, with weekly decreases as large as 76% of the experimental mean (EXP 2, week 5 to 6) and increases as large as 40% of the experimental mean (EXP 2, week 6 to 8).
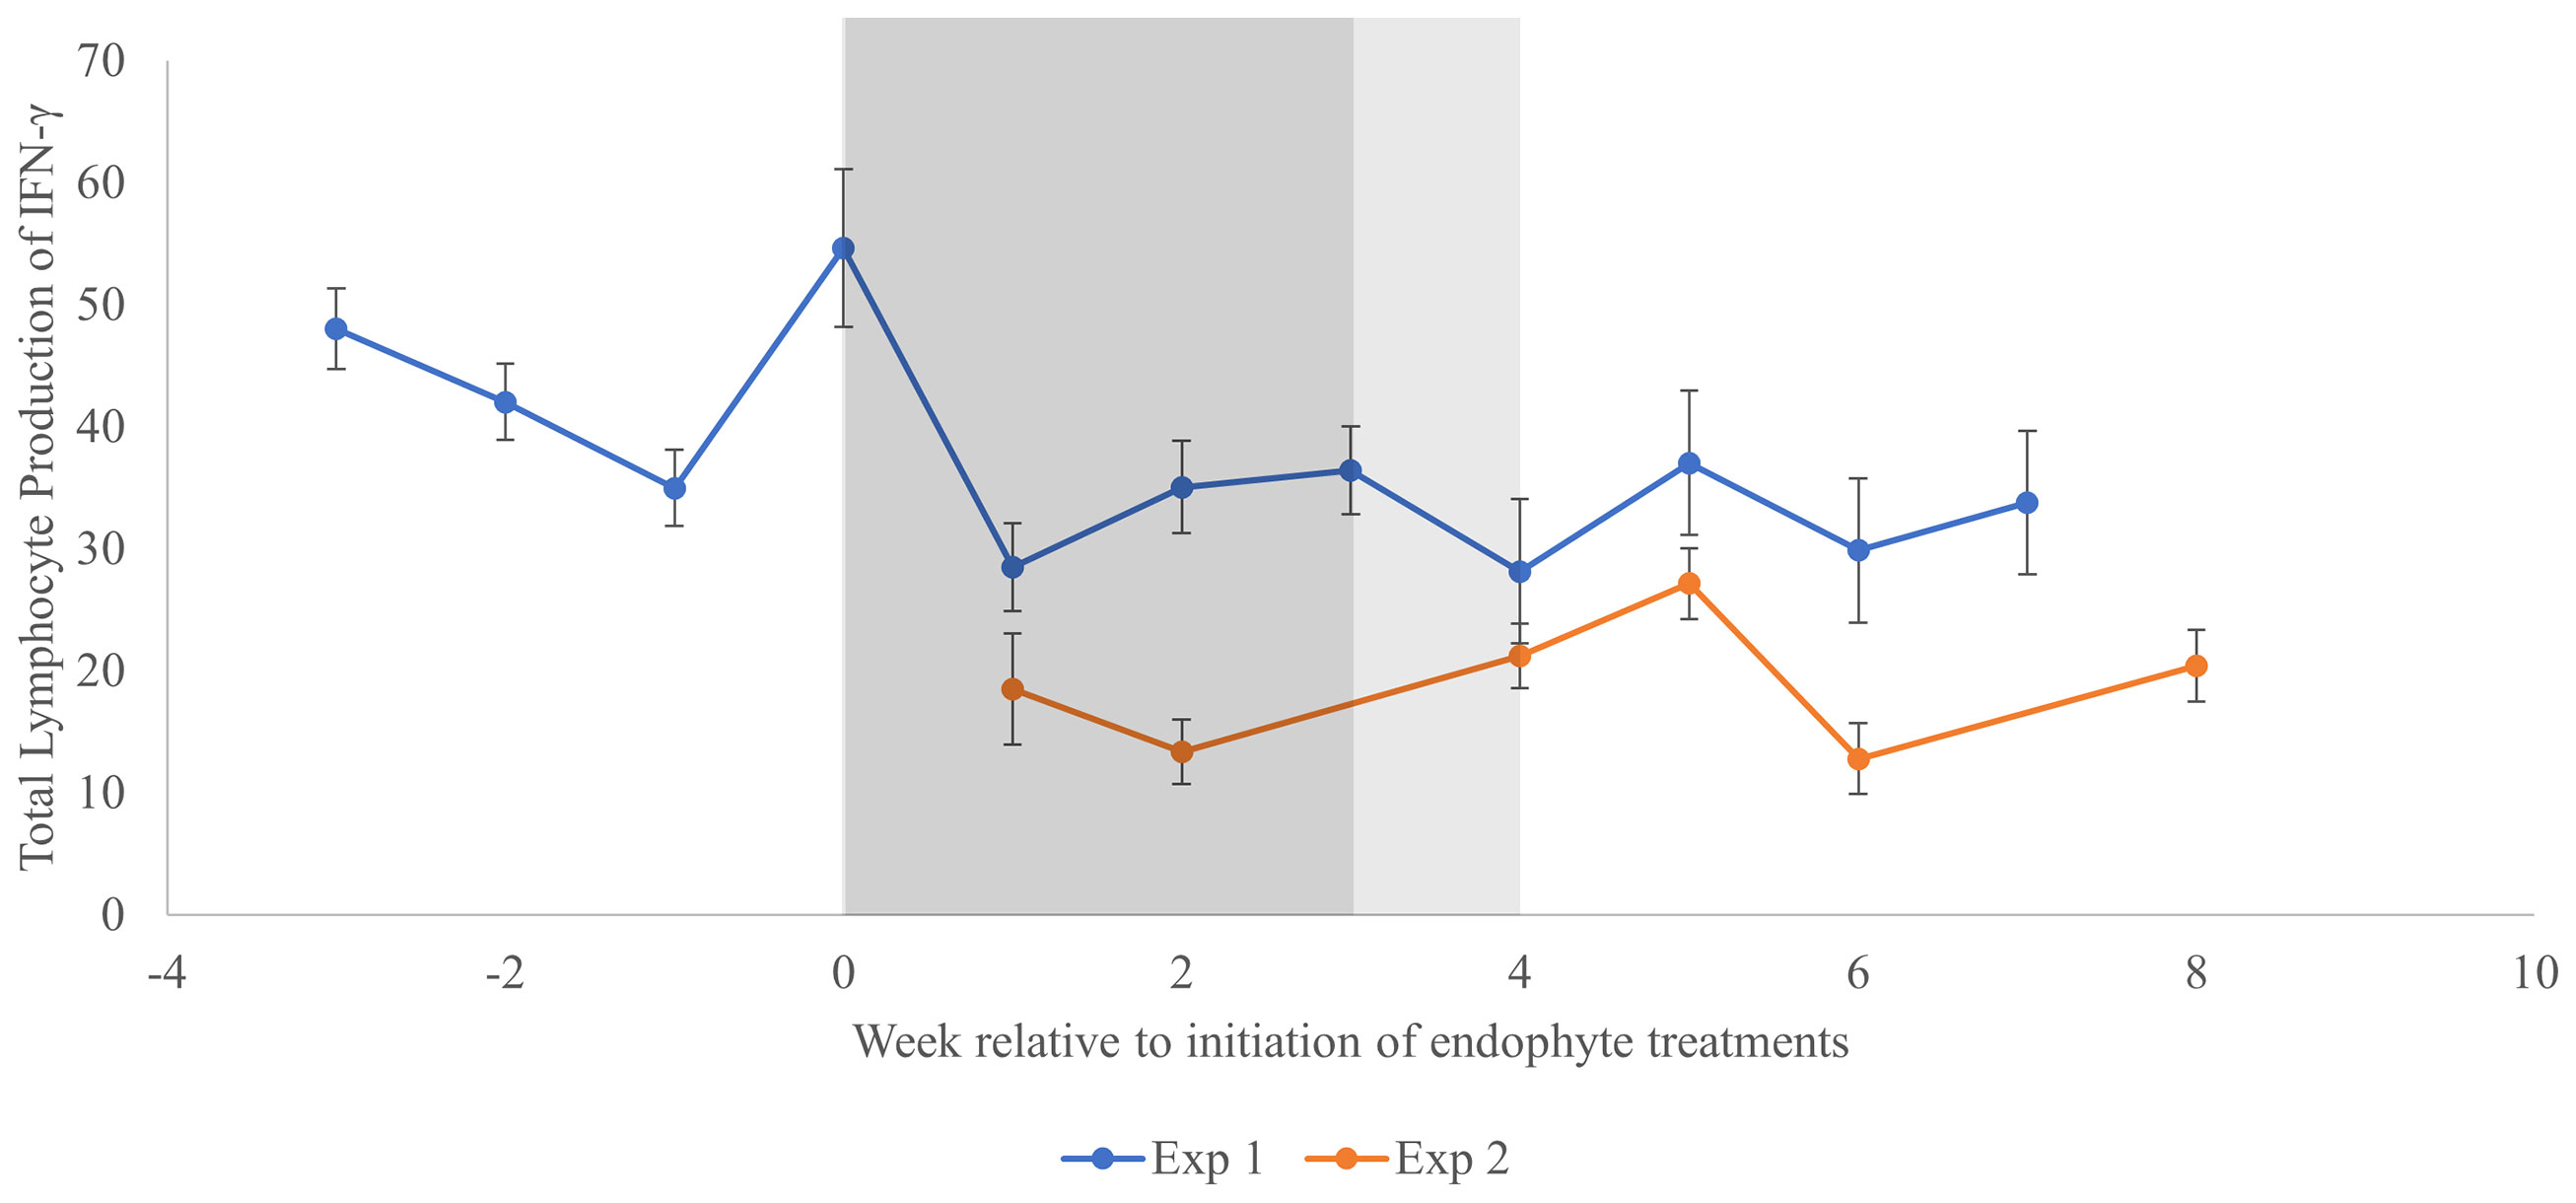
Figure 2 Change in total in vitro lymphocyte production of interferon-γ across time for two experiments utilizing heifer calves. Week 0 represents the initiation of the treatment period in which heifers received endophyte treatments in the presence of elevated THI. In Experiment 1, the duration of this treatment period was 3 weeks (dark shaded area), whereas treatments were imposed for 4 weeks (dark + light shaded area) in Experiment 2. Subsequent measurements in each experiment were conducted without infected endophyte exposure and under thermoneutral conditions. In Experiment 1, baseline data (thermoneutral conditions without exposure to endophyte-infected seed treatments) is represented for weeks -3 to -1, whereas the data point at week 0 was obtained after 1 week of exposure to elevated THI only.
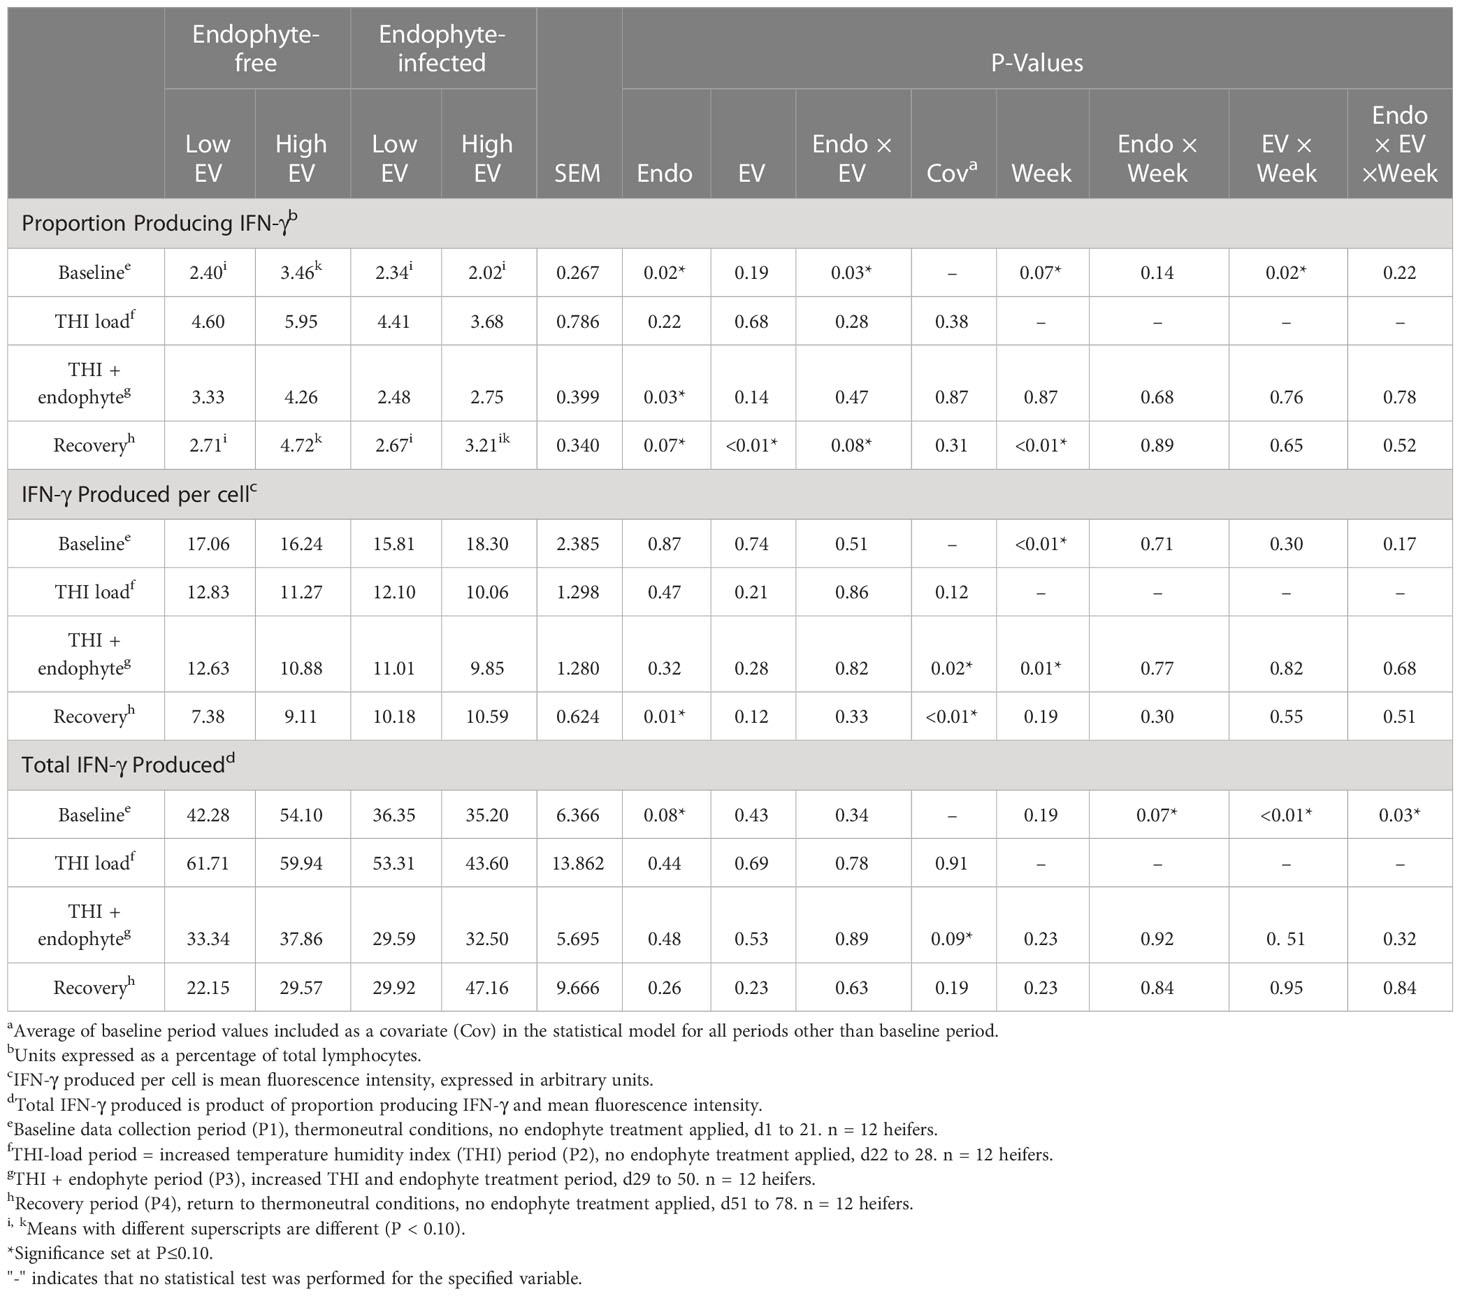
Table 3 Experiment 1 lymphocyte intracellular production of IFN-γ in response to endophyte (Endo) and exit velocity (EV) treatments.
A weak positive correlation was observed between weaning exit velocity and baseline (P1 of EXP 1 and d1 of EXP 2) total lymphocyte IFN-γ production (R2 = 0.09; P = 0.05; Figure 3) which was driven mathematically by a positive correlation between weaning exit velocity and proportion of lymphocytes producing IFN-γ (R2 = 0.22; P = 0.03; Figure 4) because the per-cell lymphocyte IFN-γ production during the baseline periods was not related to weaning exit velocity (P = 0.62; Figure 5).
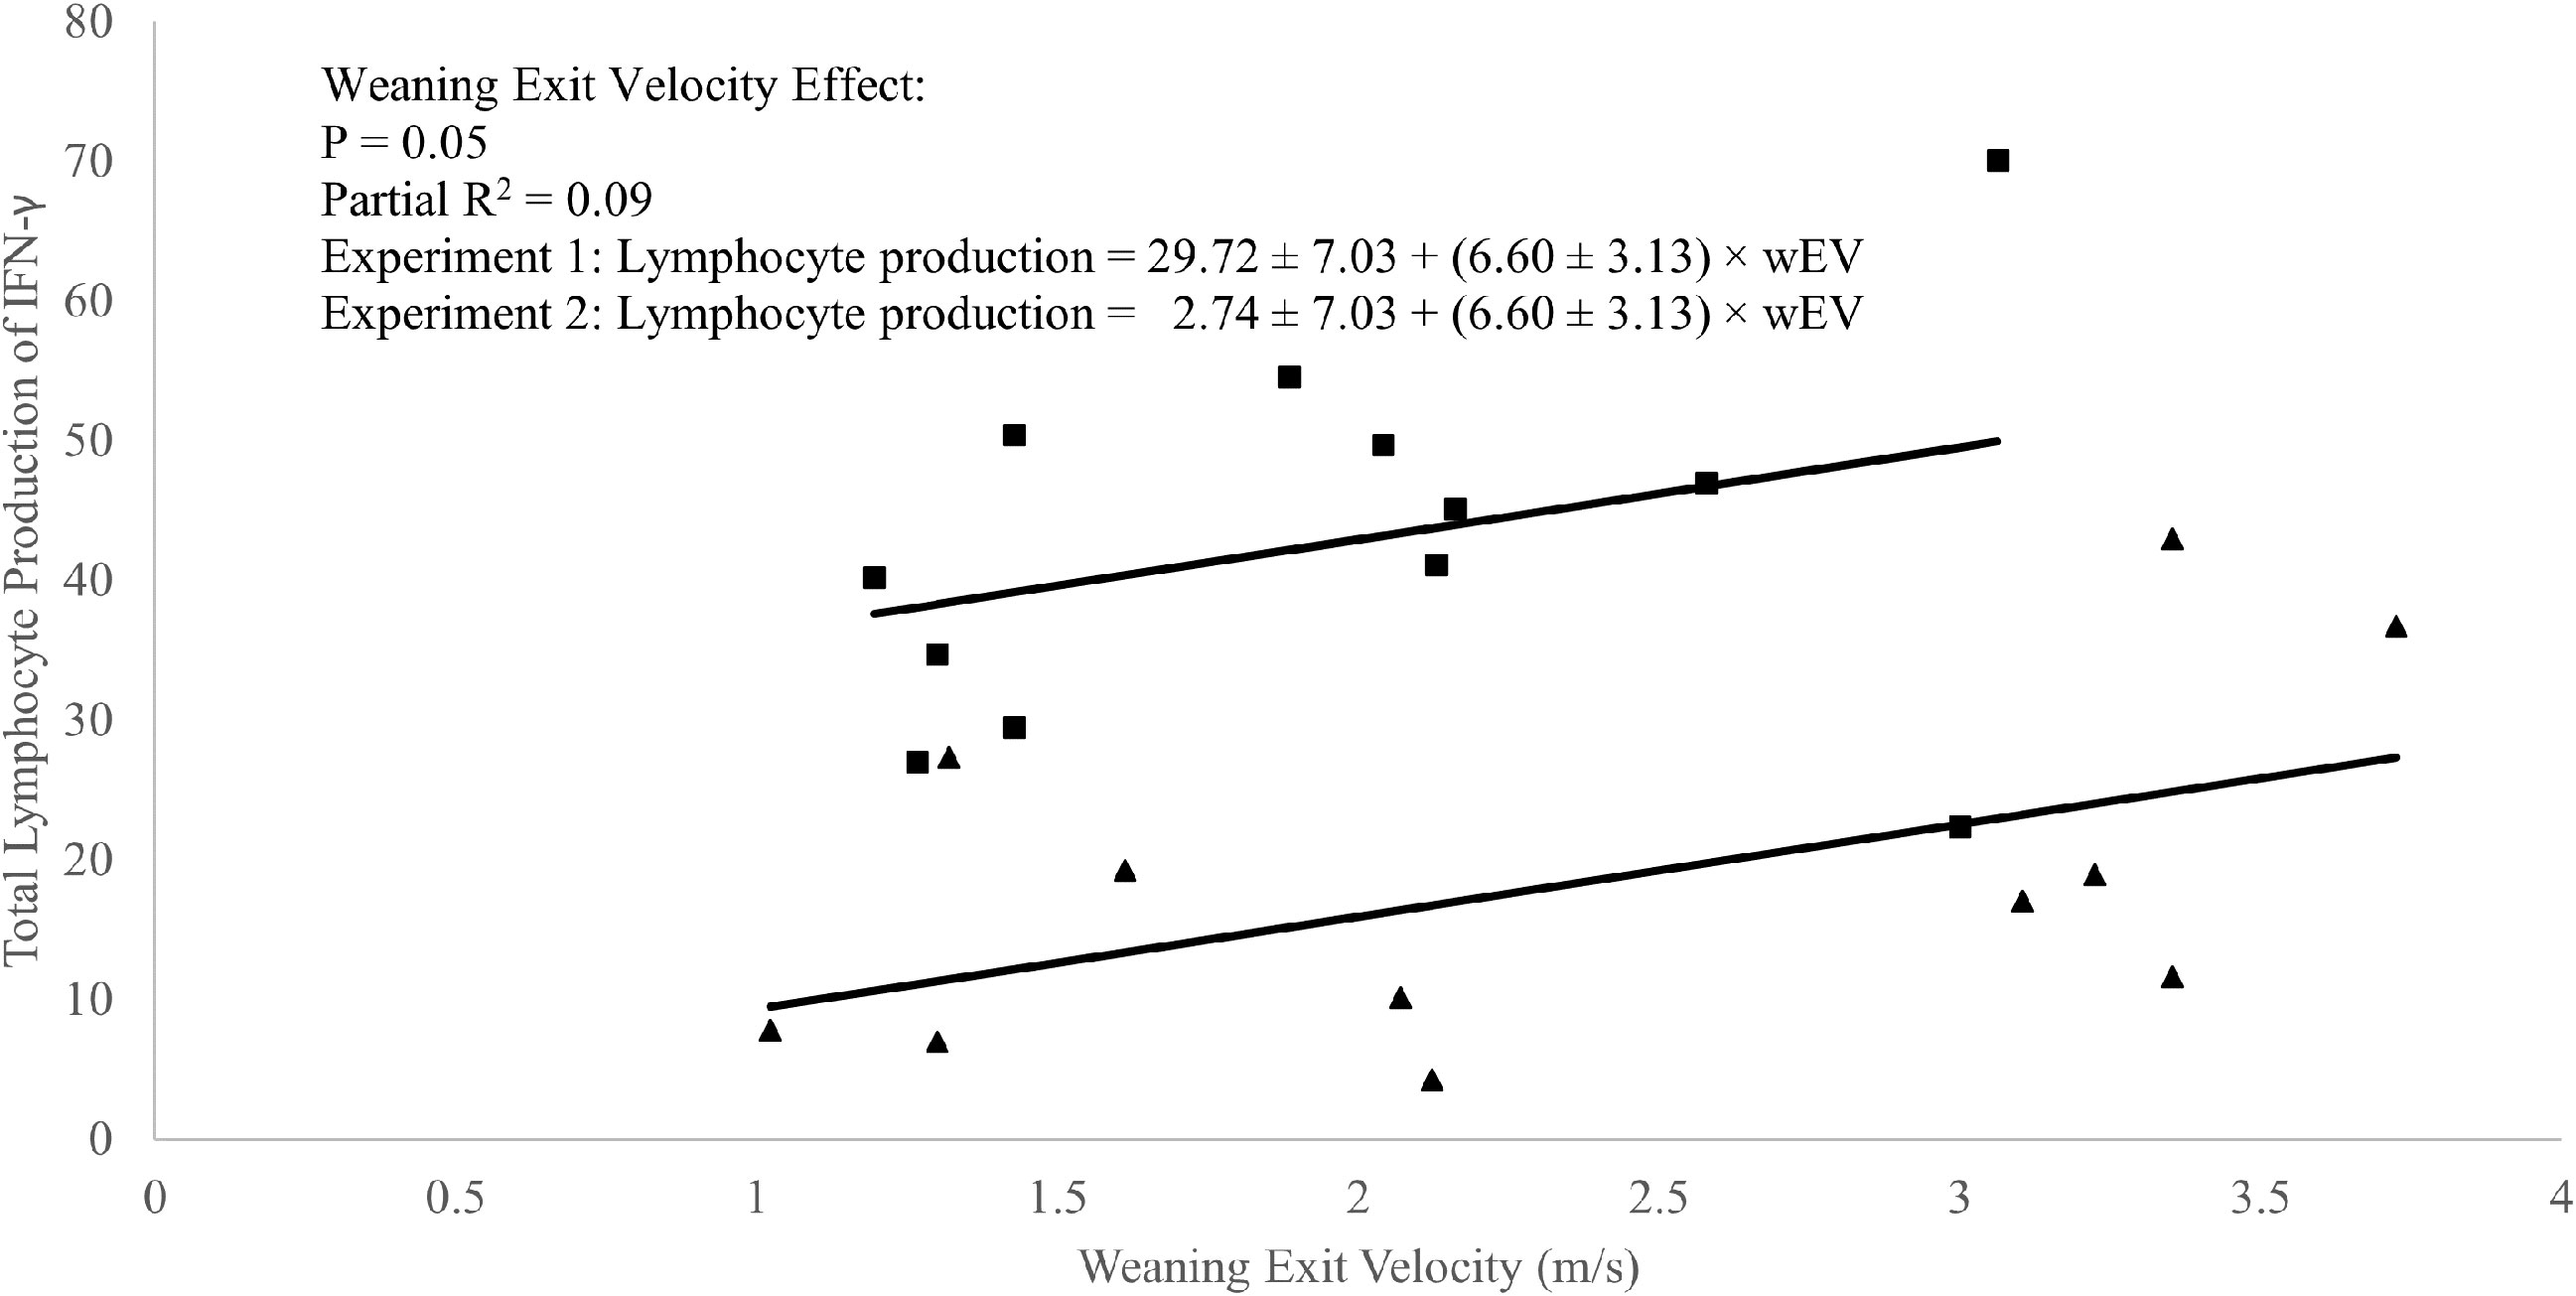
Figure 3 Regression of total in vitro lymphocyte production of interferon-γ against weaning exit velocity (wEV) during two experiments utilizing heifer calves. Experiment 1 (n = 12 heifers) data is a three-week baseline average of total lymphocyte production of IFN-γ beginning one week after calves were placed in barn. Experiment 2 (n = 11 heifers) data were from a single collection on the day calves were placed in the barn. One data point was removed from experiment 2 data due to an insufficient number of cells harvested from the sample. PBMCs were isolated from whole blood collected weekly via jugular venipuncture, treated with transport inhibitor brefeldin A, and stimulated with phorbol 12-myristate 13-acetate + ionomycin. Experiment 1 (■). Experiment 2 (▲). Experiment was a significant source of variation (P < 0.01) but there was no interaction between experiment and wEV (P = 0.98).
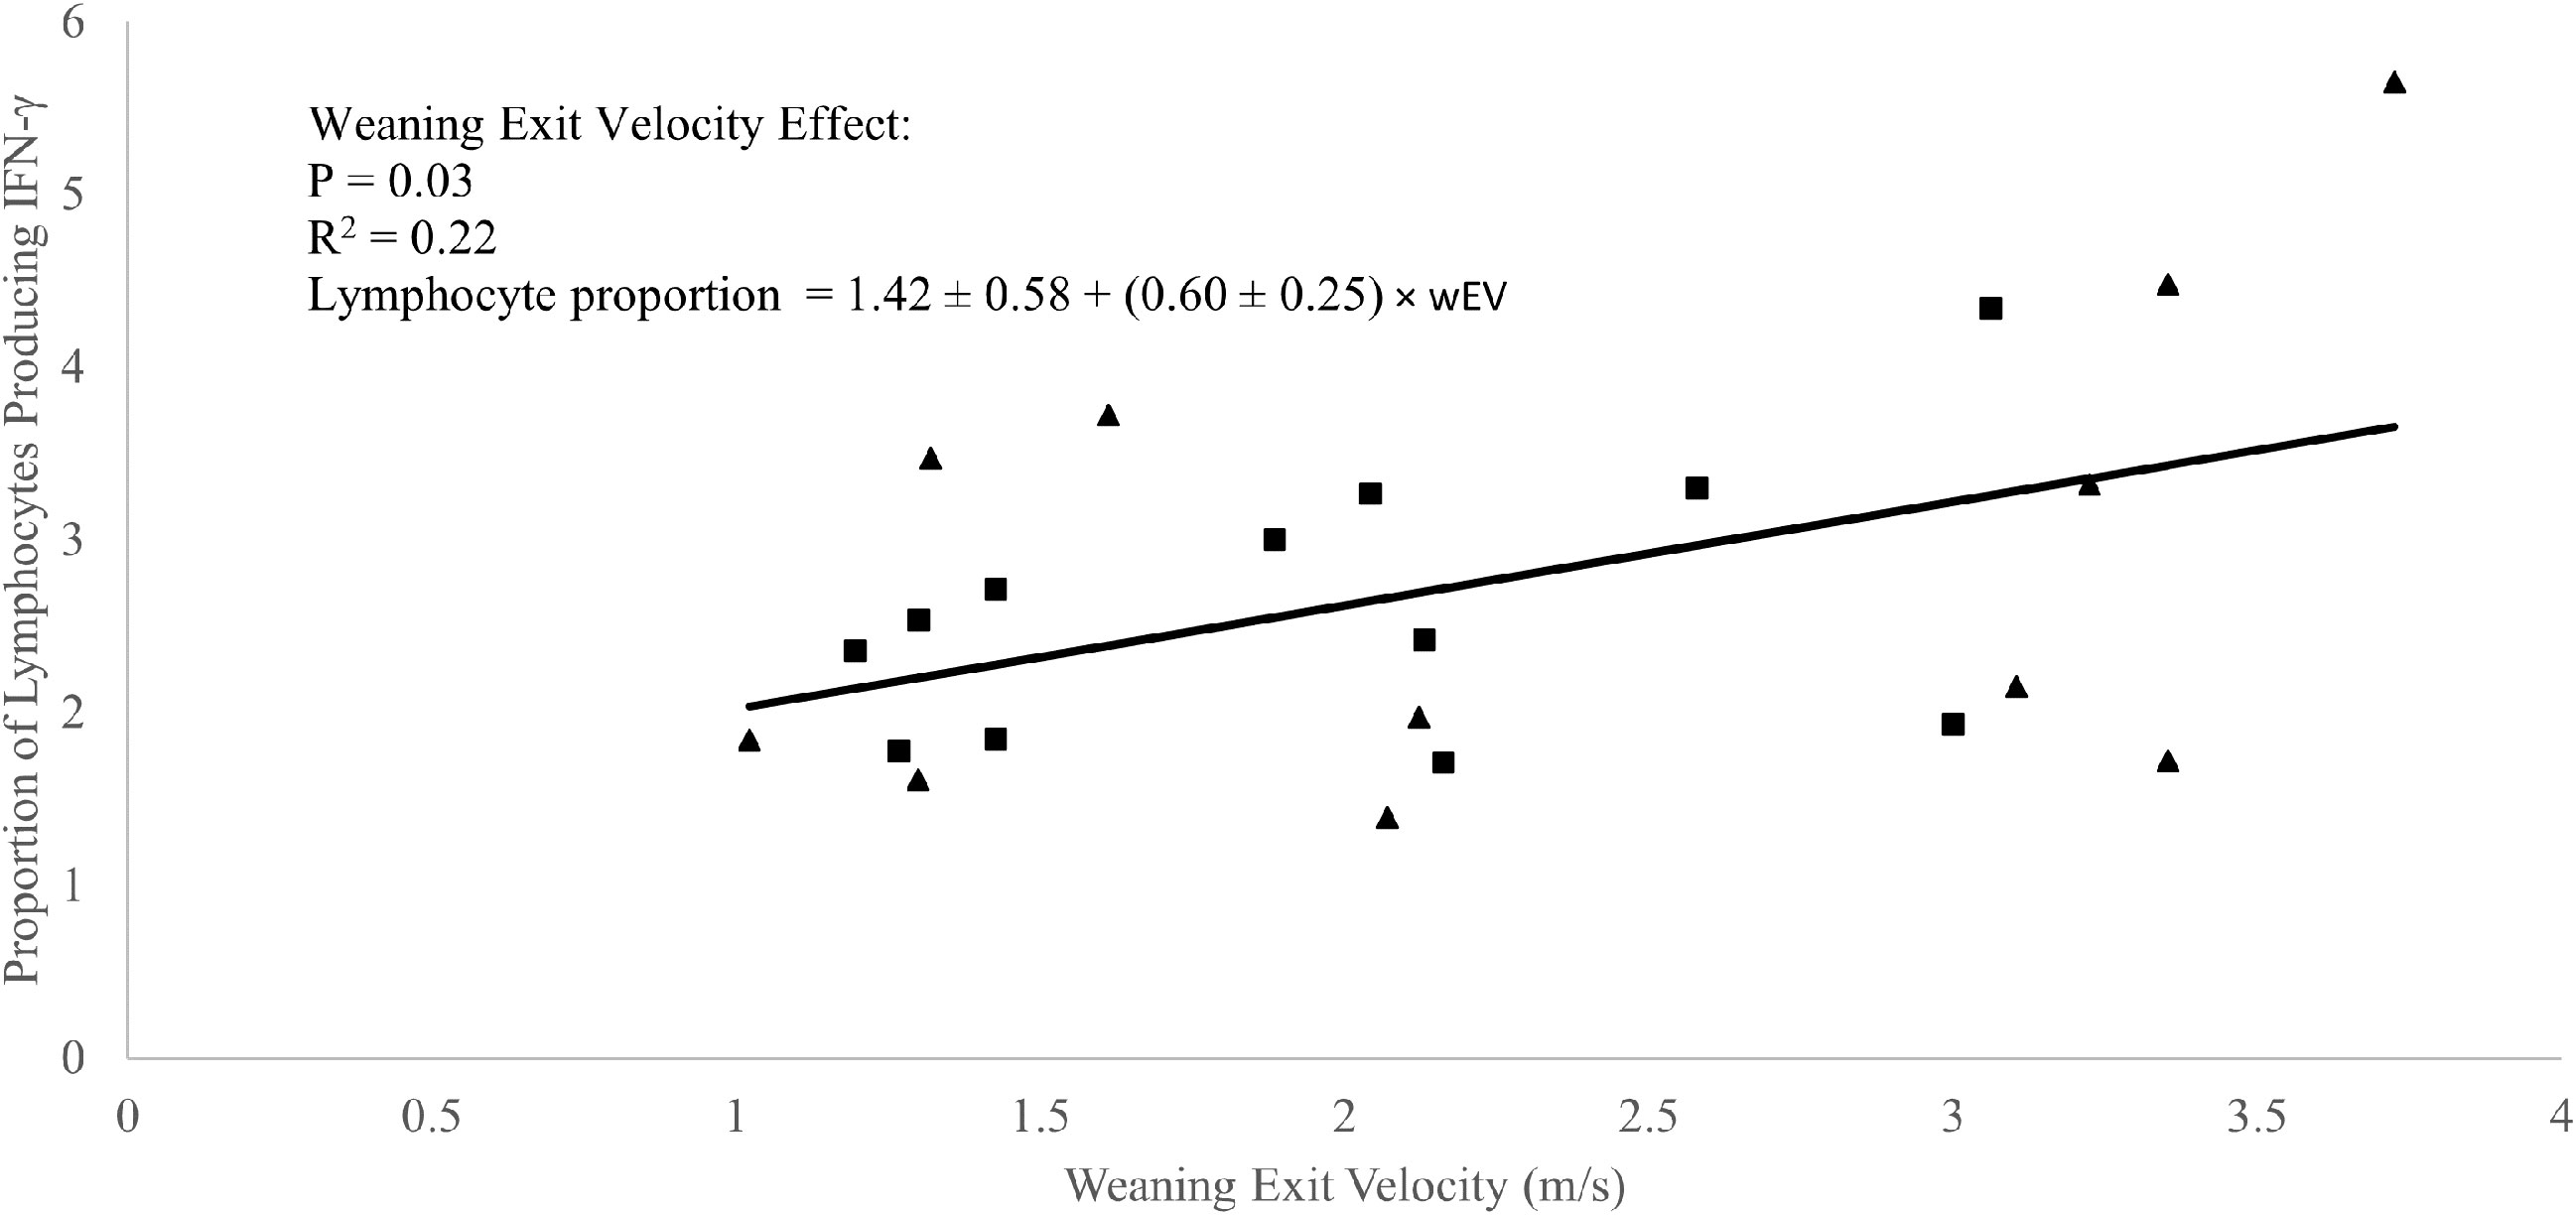
Figure 4 Regression of the proportion of lymphocytes producing interferon-γ against weaning exit velocity (wEV) during two experiments utilizing heifer calves. Experiment 1 (n = 12 heifers) data is a three-week baseline average of the proportion of lymphocytes producing interferon-γ beginning one week after calves were placed in barn. Experiment 2 (n = 11 heifers) data were from a single collection on the day calves were placed in the barn. One data point was removed from experiment 2 data due to an insufficient number of cells harvested from the sample. PBMCs were isolated from whole blood collected weekly via jugular venipuncture, treated with transport inhibitor brefeldin A, and stimulated with phorbol 12-myristate 13-acetate + ionomycin. Experiment 1 (■). Experiment 2 (▲). Experiment was not a significant source of variation (P = 0.98), and there was no interaction between experiment and wEV (P = 0.87).
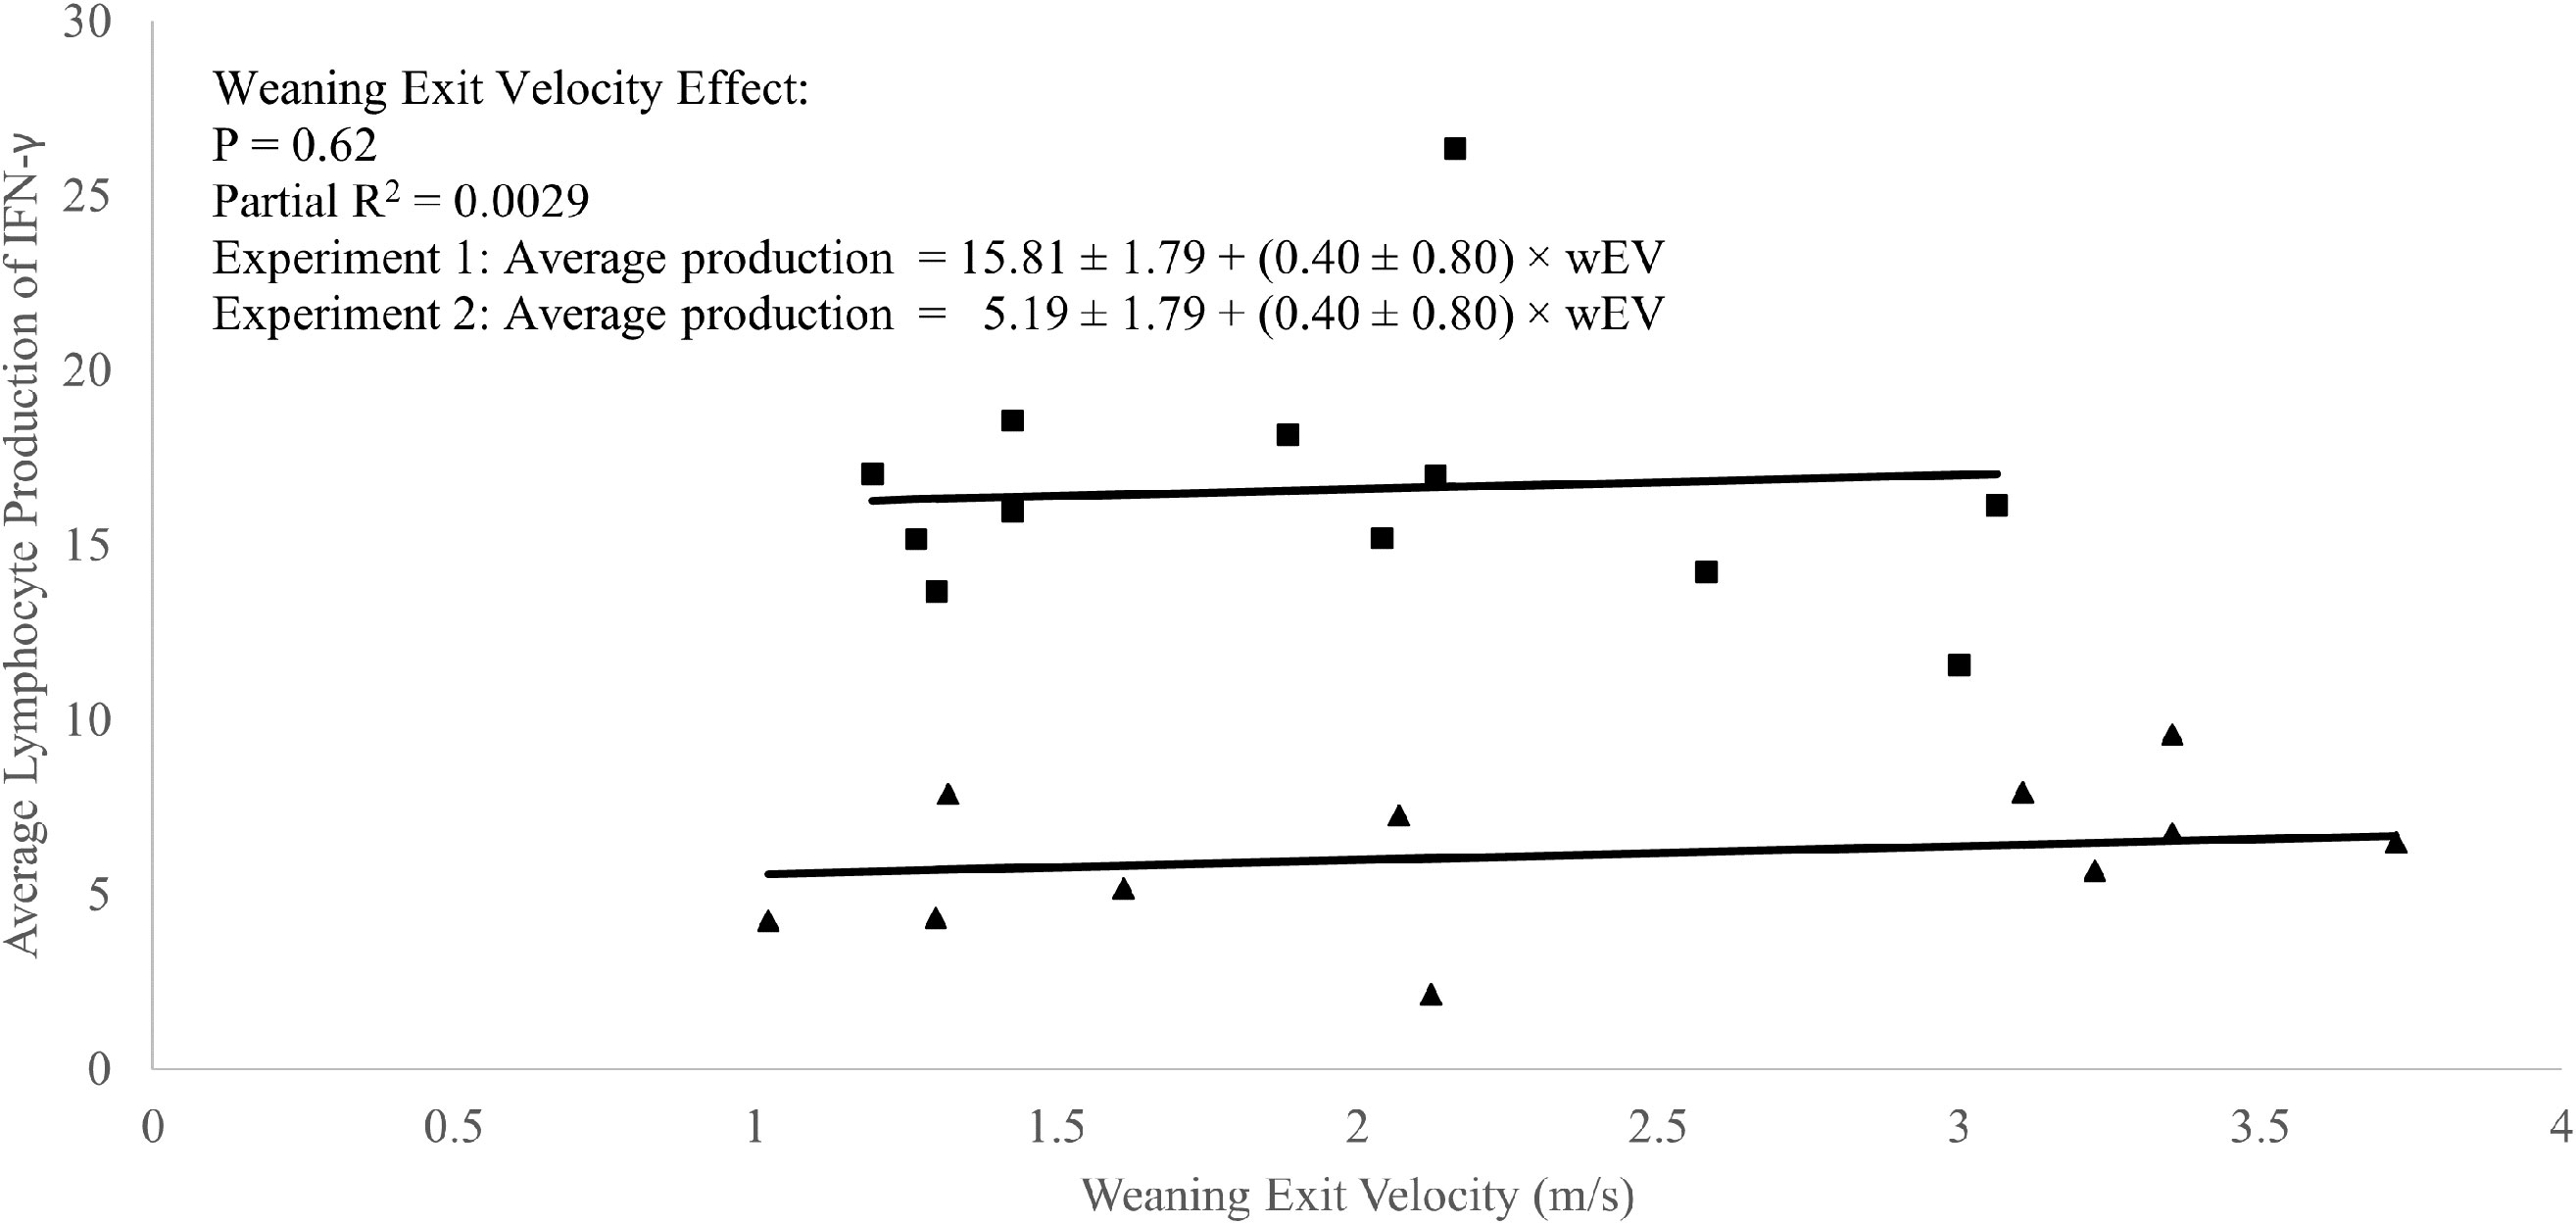
Figure 5 Regression of average lymphocyte production of interferon-γ against weaning exit velocity (wEV) during two experiments utilizing heifer calves. Experiment 1 data (n = 12 heifers) is a three-week baseline average of the average lymphocyte IFN-γ production beginning one week after calves were placed in barn. Experiment 2 (n = 11 heifers) data were from a single collection on the day calves were placed in the barn. One data point was removed from experiment 2 data due to an insufficient number of cells harvested from the sample. PBMCs were isolated from whole blood collected weekly via jugular venipuncture, treated with transport inhibitor brefeldin A, and stimulated with phorbol 12-myristate 13-acetate + ionomycin. Experiment 1 (■). Experiment 2 (▲). Experiment was a significant source of variation (P < 0.01) but there was no interaction between experiment and wEV (P = 0.33).
Prior to exposure to endophytic alkaloids (P1 and P2), there were no effects of exit velocity on lymphocyte proportions, average production, or total production of IFN-γ (P ≥ 0.19; Table 3). We analyzed for potential ‘endophyte’ effects during these periods to identify any differences that may have randomly existed between the endophyte treatment groups prior to endophyte exposure. The detection of differences between endophyte groups during the baseline period justified using baseline values as covariates for analysis during P2 through P4. The only significant treatment effect during exposure to elevated THI and endophyte (P3) was a 31% decrease (P = 0.03) in proportion of lymphocytes producing IFN-γ with exposure to E+. During this period, there was also a trend (P = 0.14) for this response to increase with high exit velocity, but no treatment effects (P > 0.28) were apparent for per-cell or total IFN-γ. During the recovery phase (P4), exit velocity had the greatest impact on the proportion of IFN-γ producing cells, where this proportion was approximately 47% greater in high vs low exit velocity heifers (P < 0.01) though there was an interaction (P = 0.08), such that this effect was somewhat muted with prior endophyte exposure. Per-cell IFN-γ was increased (P = 0.01) by prior E+ exposure and tended (P = 0.12) to increase with increased exit velocity. Although the numerical trends during P4 for total IFN-γ (the product of proportion of cells and per-cell production) were consistent with these responses (increases with both increasing exit velocity and prior endophyte exposure), a high degree of variation in total production precluded statistical significance (P > 0.23) of treatment effects. Interactions between endophyte and exit velocity treatments were not detected during any period for total or average lymphocyte production of IFN-γ (P ≥ 0.33).
Water intake and body weight changes
Average daily water consumption (Table 4) was not affected by exit velocity or endophyte treatments, or their interaction (P > 0.22). Across all treatments, average water intake increased numerically during the high THI conditions of P2 and P3 and returned to baseline levels during P4 (Figure 6).
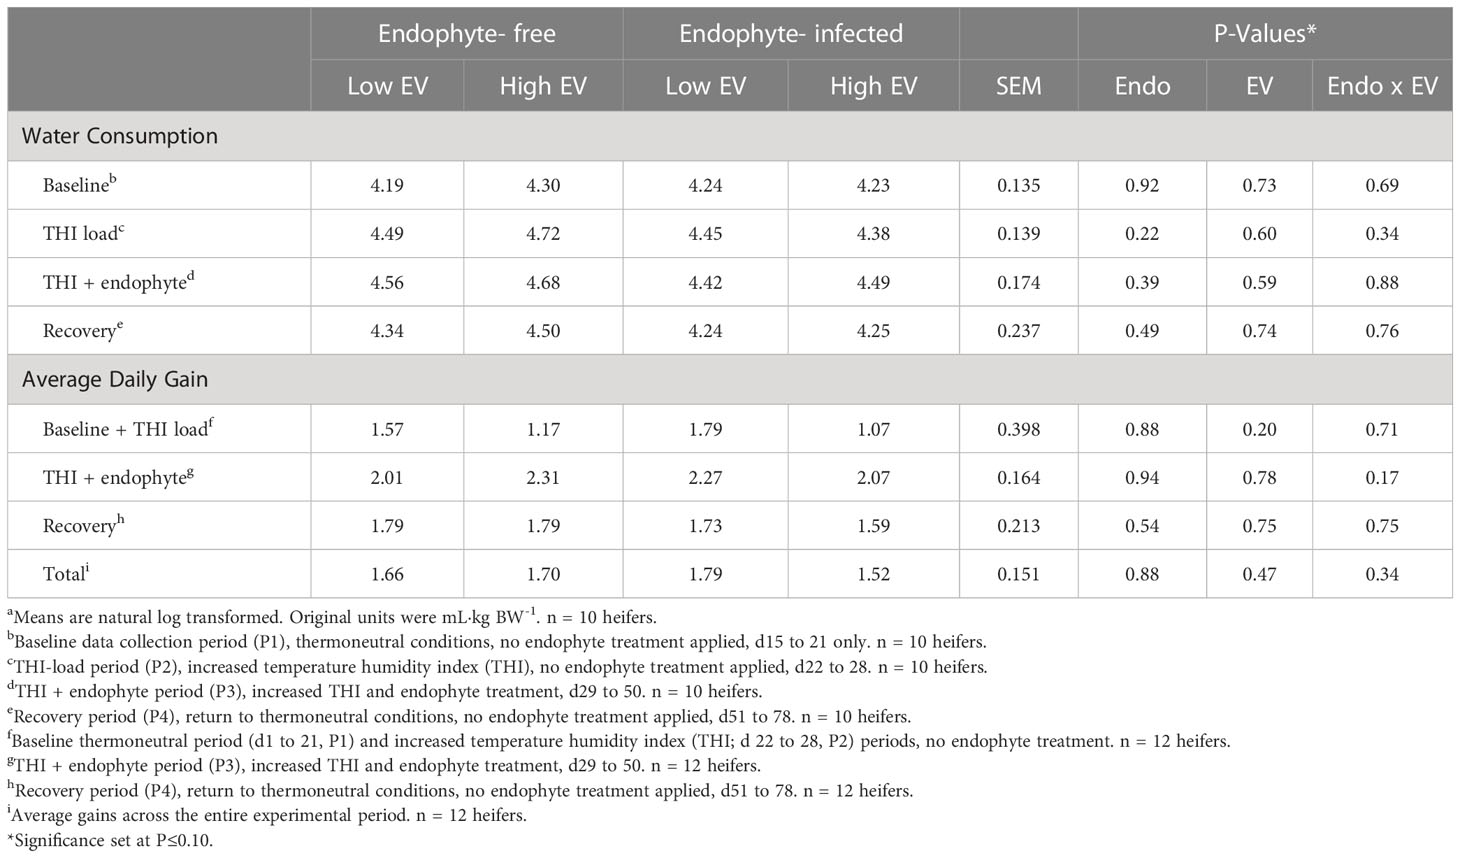
Table 4 Experiment 1 water consumption as a proportion of body weight and heifer average daily gain in response to endophyte (Endo) and exit velocity (EV) treatmentsa.
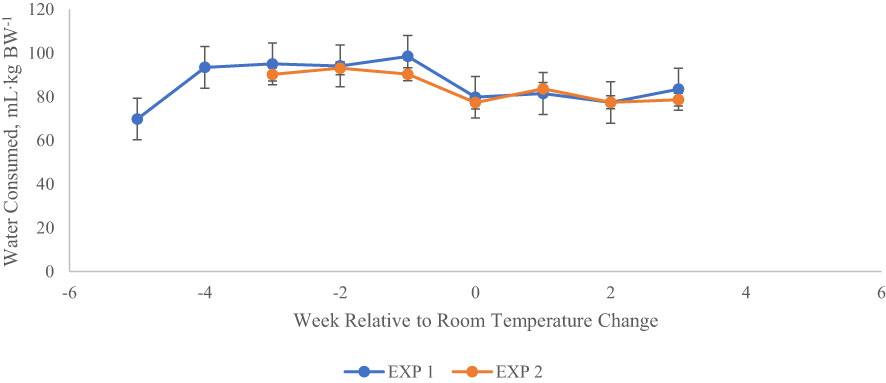
Figure 6 Water intake (mL·kg BW-1) relative to changes in ambient conditions for heifers in each of two experiments. Weekly water intake has been centered around the date that THI was returned to thermoneutral conditions in each experiment (week 0). The shaded portion of the chart indicates the time period of elevated THI. Consumption was calculated as mL·kg BW-1, and natural log transformed to meet the assumptions of ANOVA. Untransformed means are shown here. Week -5 of Exp 1 was part of the baseline period, in which all heifers (n = 12) were fed E- seed in daily rations, and room temperature remained at thermoneutral conditions (22.2°C). Also in Exp 1, week -4 included the application of heat stress (33.3°C during day, 22.2°C at night) without consumption of endophytic alkaloids. Treatment effects on water intake are shown in Tables 4 (Exp 1) and 9 (Exp 2).
There were no differences detected (P > 0.17) for average daily gain between treatments during any period (Table 4).
Experiment 2
Environmental conditions
Data on environmental conditions within the pen room are present in Figure 7. Due to data logger failure, temperature and humidity was recorded by a primary monitoring system on only 39 days of the 56-d experimental period. When the logger was nonfunctional, data were collected with a secondary back-up system with less resolution, but sufficient to ensure that temperatures were within control limits. During the study, on d1 through d20, mechanical failure occurred with the air handling system, allowing ambient conditions to deviate from the designed protocol. However, as is evident in Figure 7, the THI during the heat and endophyte period (P1) was above that ascribed by Hahn (1999) to cause perturbations to homeostasis in cattle. Similarly, most of the days during the thermoneutral period (P2) were below this THI level. The last two days on the graph, as well as d 52 (data not shown due to data logger failure), are above this threshold due to mechanical failure and a county-wide power failure, respectively, resulting in the air handler to be temporarily offline. Except for these 3 days, temperatures during P2 were constant and remained below the THI threshold as intended.
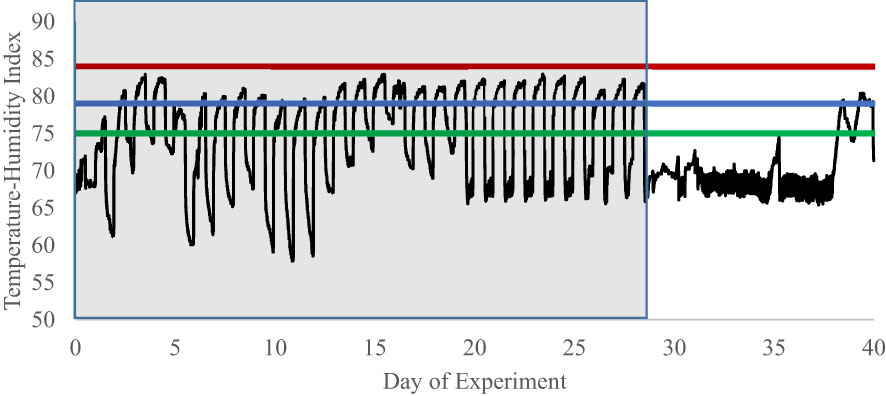
Figure 7 Experiment 2 temperature-humidity index of pen rooms during an experiment examining cell-mediated immune responses to endophyte and exit velocity treatments. Heifers were subjected in the first 28 d of the experiment to heat stress and endophyte treatment. The heat stress component (P1, d0 to d29; represented by shaded portion) was removed on d29 and rooms remained at thermoneutral for the duration of the study. Due to logger failure, only 39 of 56 days within the experimental period are available for graphical representation. Additionally, mechanical failure throughout the experiment caused a deviation from the designed THI protocol. However, during the heat stress period (d0 to d29), temperatures cycled above the danger and below the alert heat stress thresholds described by Hahn (1999). Alert = green line, Danger = blue line, Emergency = red line.
Ruminal temperature
Ruminal temperature data are presented in Table 5. There was an endophyte x exit velocity interaction (P < 0.03) for amplitude of the daily temperature curve during both periods in which amplitude was 55 to 60% greater for high exit velocity heifers but only when receiving the endophyte-infected seed diet. A trend (P = 0.11) for greater mesor (mean) temperature was also detected during the recovery period for high, as compared with low, exit velocity heifers. Numerically, this trend also appeared to be predominant for heifers on the endophyte-infected seed diet, though the interaction test did not approach significance (P = 0.26), Conversely, no differences in acrophase were observed for either period, although a trend was detected for exit velocity effects in P1 (P = 0.14), with high exit velocity heifers on the E+ diet experiencing peak circadian body temperature approximately 2.8h later than low exit velocity heifers on that diet, whereas on the endophyte-free diet, high exit velocity heifers experienced peak temperature about 1.6 h earlier than their low exit velocity counterparts.
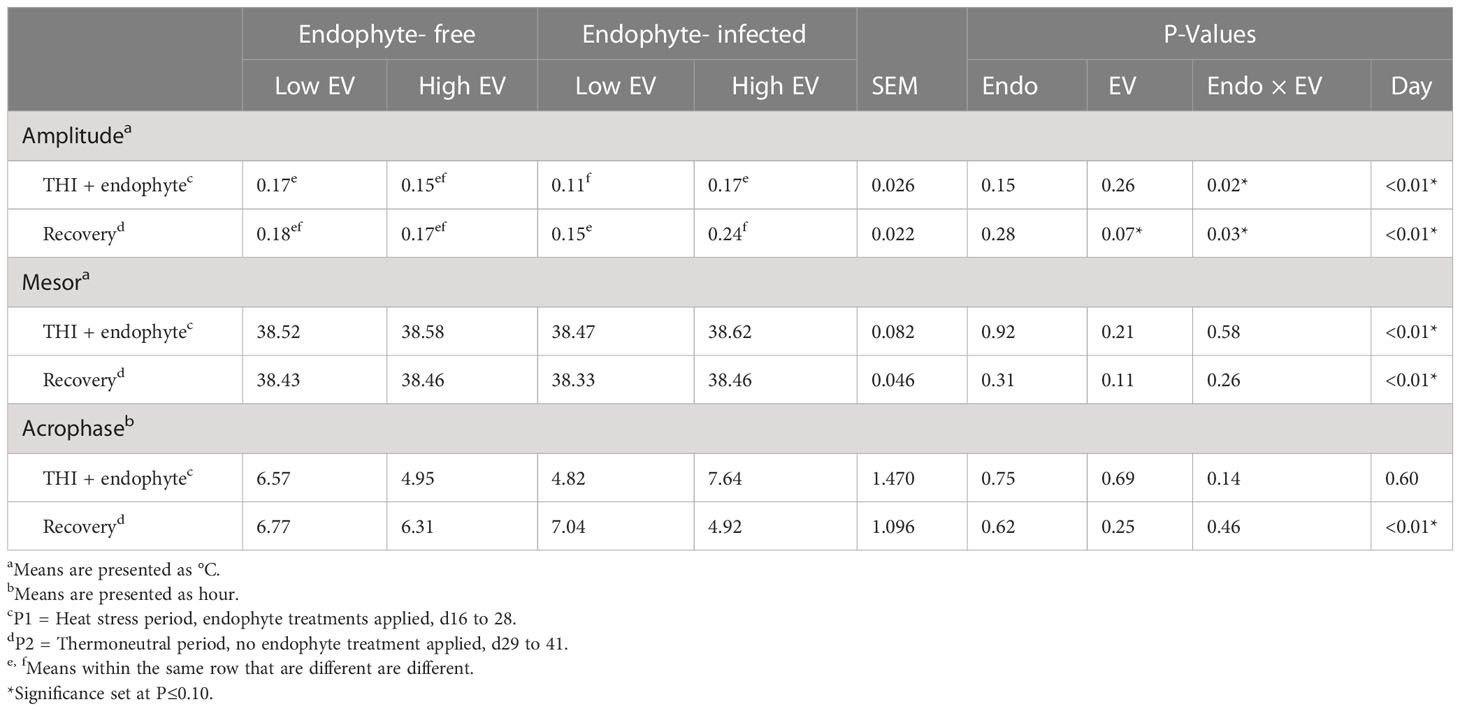
Table 5 Experiment 2 ruminal temperature responses to endophyte (Endo) and exit velocity (EV) treatments.
Cell-mediated and humoral immunity
All three measures of cell-mediated immunity (proportion of lymphocytes producing IFN-γ, average and total lymphocyte production of IFN-γ), as measured by flow cytometry, differed by week in P1 and P2 (P < 0.02), with the exception (P = 0.29) of average lymphocyte production of IFN-γ in P1 (Table 6). Baseline and P1 measures of IFN-γ did not differ due to endophyte or exit velocity treatments or their interaction (P ≥ 0.20). Similarly, no treatment effects were observed in the proportion of lymphocytes producing IFN-γ in P2 (P ≥ 0.20). Conversely, during P2, average lymphocyte production of IFN-γ was 46% greater in E+ (P < 0.01) heifers and tended (P = 0.13) to be greater (by 13%) in high vs low exit-velocity heifers. Likewise, endophyte consumption was associated with almost a doubling in total production of IFN-γ (P = 0.03) by isolated PBMC during the recovery phase. Although endophyte x week interactions were detected for per-cell and total IFN-γ production during the recovery phase (P < 0.06), the nature of the interactions in each case was such that differences were greater during weeks 5 and 8, and minimal during week 6 (data not shown), so these interactions appear to be artifacts related to substantial variation of these measures from week to week.
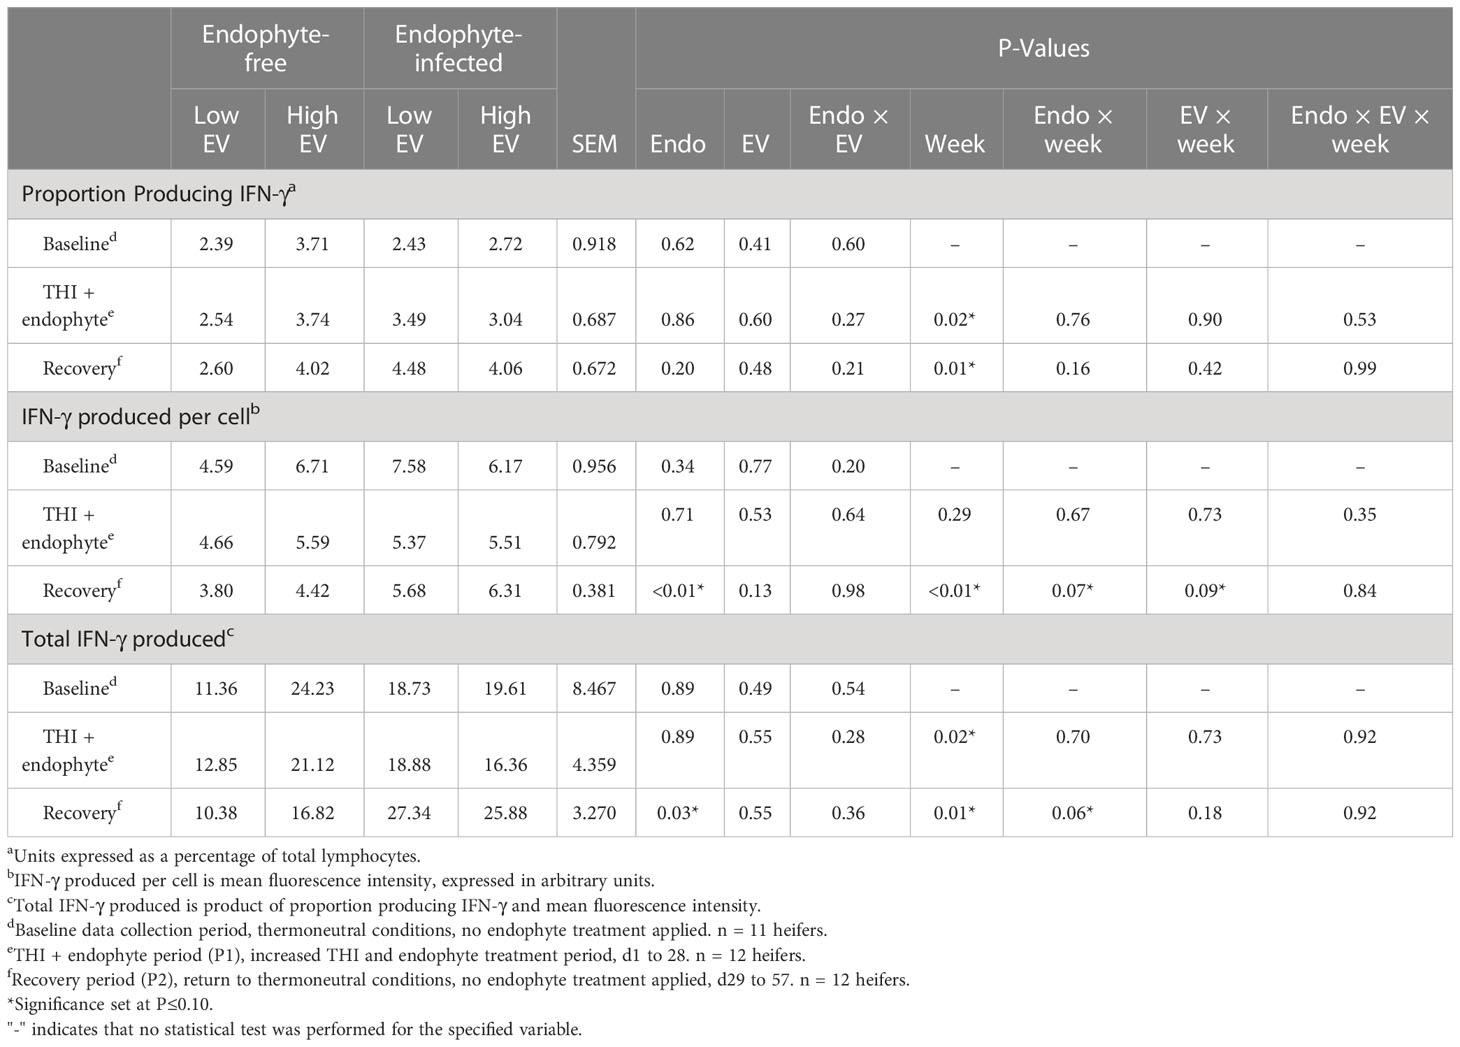
Table 6 Experiment 2 lymphocyte intracellular production of IFN-γ in response to endophyte (Endo) and exit velocity (EV) treatments.
Titer responses (Table 7) were not affected by either treatment or their interaction (P ≥ 0.52). As this was a one-time measurement, no time effects were analyzed. Measures of animal growth and efficiency were not influenced by endophyte or exit velocity treatments (P ≥ 0.11).
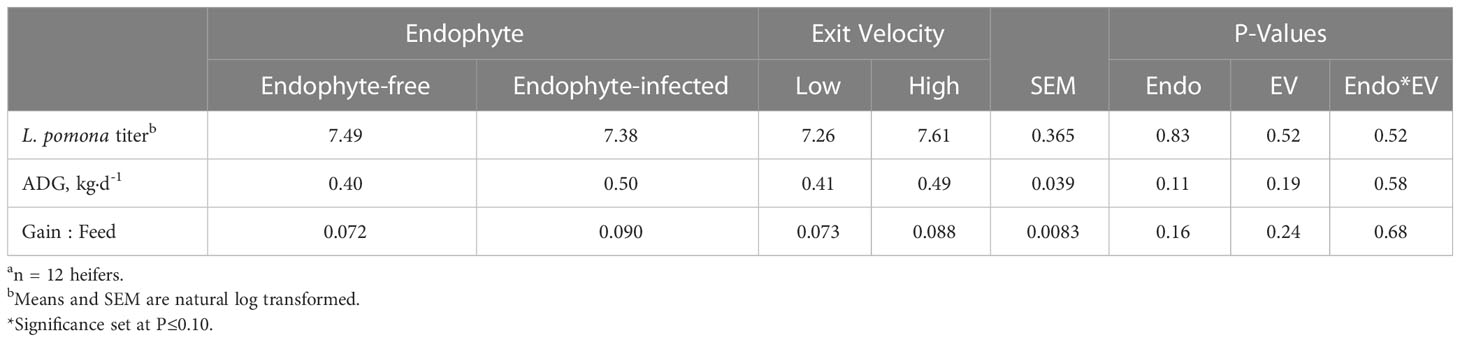
Table 7 Experiment 2 Leptospirosis pomona titer, average daily gain (ADG), and gain:feed ratio responses to endophyte (Endo) and exit velocity (EV) treatmentsa.
In P2, water intake was affected by week (P = 0.03; Table 8). Similarly, main effects of endophyte (P ≥ 0.02) and exit velocity (P ≥ 0.01) treatments affected consumption throughout the entire study (P < 0.01). In both periods, heifers on the E- treatment diet and heifers designated as high exit velocity consumed less water than the other respective treatments. However, an interaction of the two treatments was not observed in either period.
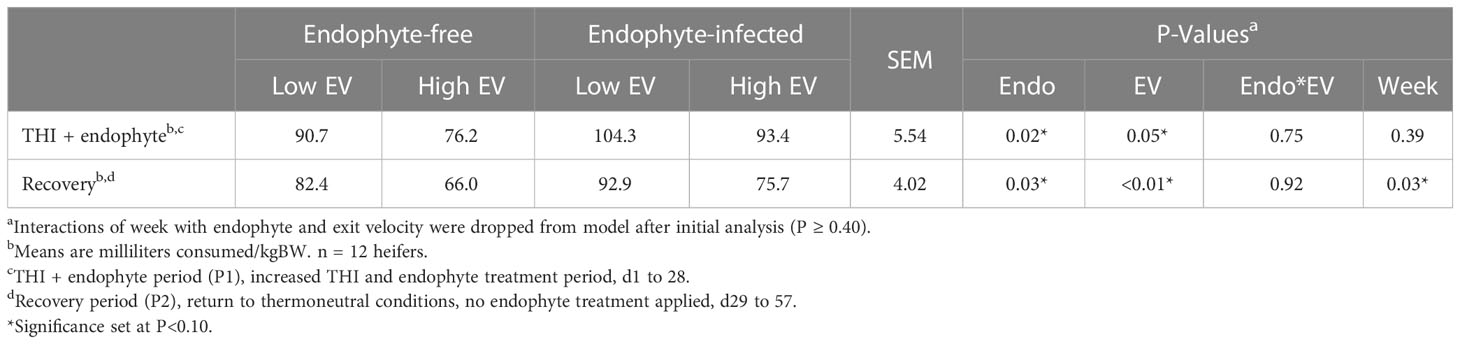
Table 8 Experiment 2 average weekly water consumption in response to endophyte (Endo) and exit velocity (EV) treatments.
Discussion
An animal’s ranking within the exit velocity spectrum remains relatively constant over time (Curley et al., 2006; Bruno et al., 2016). In a study by Curley et al. (2006), calves were placed in one of three groups based on initial exit velocity measurements. Compared with initial measurements, the high and mid-groups had significantly slower exit velocities whereas no change was observed for the slow group. However, measured exit velocity among the three groups were statistically different from one another at both initial and final measurements. Thus, the first measurement of exit velocity should provide a reliable indication of how temperamental a calf is relative to its herdmates. Therefore, collection of exit velocities at weaning and allocating calves as either high or low exit velocity provided a base from which to test the effects of this measure of temperament on the various responses evaluated during these experiments.
Cell-mediated immunity
We are unaware of other reports of IFN-γ from isolated PBMCs in growing cattle. As such, our goals here were two-fold: to provide a general description of IFN-γ production by PBMCs in growing beef cattle as well as to delineate potential effects of our treatment factors, ergot alkaloid exposure and weaning exit velocity, on PBMC production of IFN-γ under the varying conditions of each experimental period. Our results indicate a substantial degree of temporal variation in lymphocyte production of IFN-γ under consistent environmental and dietary management. It is possible that the sudden transition to elevated THI in EXP 1 resulted in an increase in total in vitro IFN-γ production, though the comparatively rapid return to baseline during continuing elevated THI makes it unclear whether this was a response to the environmental change or simply random temporal variation. This transient shift in IFN-γ production during periods of heat stress is not a novel finding and could be related to an increase in toll-like receptor 2 (TLR2) expression. Toll-like receptor 2, which is expressed extracellularly on the cell surface (Vijay, 2018), can stimulate short-term production of IFN-γ (Salerno et al., 2016). This effect is relatively brief, as it is dependent on newly synthesized mRNA and does not stimulate translation rates by stabilizing IFN-γ transcripts (Salerno et al., 2016). A study using Bama Miniature pigs reported increased in vivo whole blood TLR2 expression in swine exposed to heat stress (Ju et al., 2014). In the same study, PBMCs were isolated from the control pigs during the in vivo study and exposed to elevated temperatures (42˚C) during incubation. The resulting supernatant of the heat stressed cell cultures had increased TLR2 and IFN-γ concentrations relative to the control cultures maintained at 39˚C (Ju et al., 2014). However, as TLR2 was not evaluated in the current study and studies in livestock relating TLR2 expression with IFN-γ during periods of acute and chronic heat stress are sparse, this temporal variation requires further investigation and needs to be considered when designing experiments to evaluate this response in cattle, as well as in other species. Future studies should evaluate changes at shorter time scales to attempt to establish the rate at which such temporal shifts may occur.
In the absence of applied treatments, a weak correlation between total lymphocyte production of IFN-γ and weaning exit velocity was present and driven primarily by a positive relationship between the proportion of IFN-γ producing lymphocytes and weaning exit velocity. A relationship between exit velocity and average lymphocyte production of IFN-γ was not apparent. Overall, this relationship suggests a linkage between high exit velocity and differentiation of naïve CD4+ T cells to the TH1 subtype. This further suggests that higher exit velocity animals are potentially somewhat better ‘poised’ for defense against viral and/or intracellular pathogens.
The presence of presumable endophyte effects during P1 of EXP 1 either alone (for total IFN-γ) or in interaction with EV (proportion of IFN-γ producing cells) was an artifact of random treatment assignment, as endophyte treatments were not introduced until P3. This was statistically accommodated by using P1 baseline values as covariates for the analysis of data from all subsequent periods (Table 3). Unlike endophyte effects in P1, EV effects detected during this period are potentially meaningful. The use of baseline covariates ‘centers’ responses due to EV around differences detected in P1, and as such, provides a somewhat conservative view of the potential impact of EV on PBMC IFN-γ production.
In EXP 1, increased exit velocity was associated with some evidence of increased proportions of IFN-γ producing cells during the elevated THI/endophyte exposure period (P3), and with stronger evidence of this association during the recovery period (P4). However, in EXP 2, no relationship was detected between exit velocity class and proportion of IFN-γ producing cells. With regard to per-cell production of IFN-γ, trends were detected in both experiments for larger responses with increased exit velocity during the recovery period. No other effects of exit velocity on IFN-γ production were detected in either experiment. Combined, data from these experiments indicate that exit velocity effects on IFN-γ production by PBMC were inconsistent. However, when they were detected, the associations were always positive (increasing exit velocity was associated with greater numbers of cells or per-cell expression).
In EXP 1, but not EXP 2, endophyte exposure decreased the proportion of cells producing IFN-γ during the period in which animals were exposed to elevated THI and infected endophyte. Surprisingly, there were no other treatment effects during the treatment period in either experiment. The most consistent response across both experiments occurred during the recovery phase, when prior exposure to endophyte-infected fescue seed increased per-cell IFN-γ production. In EXP 2, this increase was sufficient to result in increased total IFN-γ production during the recovery period.
Because ergovaline, the major ergot alkaloid produced by the endophytic fungus in tall fescue (Lyons et al., 1986), is a dopamine agonist (Ben-Jonathan, 1985; Lamberts and Macleod, 1990) and D2-like dopamine receptors have been reported on peripheral lymphocytes and natural killer cells (Mckenna et al., 2002), one could hypothesize a direct effect of alkaloids on lymphocyte IFN-γ response. However, increased concentrations of dopamine have been shown to increase IL-10 production (Besser et al., 2005; Sarkar et al., 2010), and to down-regulate expression of non-receptor tyrosine kinases lck and fyn, resulting in decreased secretion of IFN-γ (Ghosh et al., 2003; Sarkar et al., 2010).
In the present studies, differences were detected subsequent to, rather than consequent with, increased ambient conditions and E+ exposure, suggesting a mechanism that is more complicated than a direct agonist effect on lymphocytes. This repeated observation of the timing of these responses across experiments may indicate a physiological change that results from prolonged toxic alkaloid exposure and has implications on a vast array of other biological responses in cattle. Specifically, others (Capuco et al., 2018; Mclean et al., 2020), using alkaloid exposure models, have demonstrated IFN-γ may serve as an upstream regulator of several cellular functions in mammary gland and mesenteric adipose tissues. Capuco et al. (2018) reported pathways involving lymphocyte function in mammary gland during the dry period were decreased in cows dosed with endophyte-infected tall fescue seed, with a relatively weaker response also observed among cows dosed with bromocriptine, when compared with cows on the control treatment. In a subsequent study using dopamine agonist bromocriptine in place of endophyte-infected seed to avoid potentially confounding intake effects, Holstein steers repeatedly dosed intramuscularly with 0.1 mg/kg BW bromocriptine were observed to have depressed T lymphocyte quantities in mesenteric adipose tissue (Mclean et al., 2020). Furthermore, the authors of that study reported IFN-γ as a top-5 upstream regulator of several mesenteric adipose-related pathways, many of which were identified as representative of cell movement and survival, immune cell trafficking, tissue/organismal development, morphology, and survival. However, it is important to note that these responses were from localized tissue samples whereas the current study used cells collected from peripheral blood (i.e., systemic response). Due to the similarity of IFN-γ responses to alkaloid dosing between these cited and current studies, future work examining the potential role of peripheral IFN-γ as an upstream regulator of other biological processes is warranted.
Although possible mechanisms directly relating alkaloid consumption to PBMC IFN-γ responses remain elusive, there may be practical implications of the timing of these responses in the present study. These data suggest that during the early receiving phase, cattle from endophyte-infected fescue pasture may have enhanced PBMC IFN-γ capacity. This could have implications for health management strategies, such as effects on responsiveness to vaccines and resistance to respiratory disease. A recent review by Abebe (2019) suggested that vaccine response may be a result of synergy, rather than polarization, of TH1 and TH2 responses. In defense of this statement, the author referenced a potential positive correlation between IFN-γ and IgA expression following inoculation of patients with HBHA, a new vaccine candidate against tuberculosis. Such a mechanism may hold significance for commonly encountered bovine respiratory disease (BRD) in cattle. This disease complex is triggered by infection of the host with a viral pathogen (i.e., bovine herpesvirus-1, bovine parainfluenza virus 3, bovine respiratory syncytial virus, bovine viral diarrhea virus, and possibly bovine coronavirus; Mosier, 2015). Some of these viruses are believed to damage key immune protectants, such as mucosal system components, necessary to maintain homeostatic balance between upper respiratory tract commensal microflora and commonly present bacterial pathogens that contribute to development of BRD (Bell et al., 2021). As IgA is the predominant immunoglobulin present in the mucosal layer (Aleyd et al., 2015), a similar relationship between IFN-γ and IgA expression in cattle may indicate grazing calves on endophyte-infected tall fescues pastures is a potential prophylactic against development of respiratory disease during feedlot induction. However, further research investigating this potential benefit is warranted.
Humoral immunity
Unlike cell-mediated immunity, the humoral immune response, as measured by vaccination titers to Lepto. pomona, did not differ between endophyte treatments during P2 of EXP 2. This finding is inconsistent with previous observations of influences on the humoral response of E+ on grazing steers by others (Dawe et al., 1997; Rice et al., 1997; Altman et al., 2020), but is consistent with a prior study using a seed-fed model with steers to examine this response (Dew, 1989). To our knowledge, the present study was the first to investigate the influence of E+ consumption on vaccination titer responses in heifers. Thus, one possibility for the difference in observed effects of E+ consumption on subsequent titer antibody concentrations between the current study and others may be due to a gender effect, as male and female sex hormones have been previously demonstrated to differentially affect B cell differentiation during mitogen stimulation (Sthoeger et al., 1988). However, this potential gender effect may not be the only or even the most important contributing factor to the differences between experiments observed.
In each of the aforementioned grazing studies (i.e., Dawe et al., 1997; Rice et al., 1997; Altman et al., 2020), steers were grazed on either E+ or E- pastures, which did not allow for measurements of total intake. In the present study and the work of Dew (1989), fescue seed, rather than grazed fescue, was used for alkaloid ‘dosing’. This allowed for equalization of dry matter intake among treatments. As mentioned previously, decreased intakes are commonly associated with cattle consuming E+ feedstuffs (Schmidt et al., 1982; Paterson et al., 1995; Spiers et al., 2012). Increased titer responses to vaccination against horse red blood cell and keyhole limpet haemocyanin have been reported in calves fed on a lower plane of nutrition (Pollock et al., 1994). As intake was controlled in the present study with no observed effects of endophyte treatment on humoral immunity, and the other studies did not control for intake, it is possible the observed endophyte effects on humoral immunity in those three studies were a result of differences in plane of nutrition between treatments rather than an alkaloid effect per se.
Water intake and ruminal temperature
Hyperthermia in cattle has been reported following exposure to endophyte-infected feeds (Spiers et al., 1995). As the ergopeptine alkaloids target vascular endothelium (Thompson et al., 1950; Strickland et al., 1996; Oliver, 1997; Al-Tamimi, 2002), it has been suggested the hyperthermia experienced by cattle consuming E+ diets is a result of vasoconstriction, leading to shifts in heat dissipation mechanisms (Dyer, 1993; Oliver et al., 1993; Browning and Leite-Browning, 1997; Al-Tamimi, 2002). In EXP 2, water intake was greatest in the E+ low exit velocity group during both periods. Ruminal temperature amplitudes were numerically lower in this group in both periods. Thus, it appears that differences in H2O consumption may explain the small numerical differences in ruminal temperatures among treatments. One potential mechanism that may explain the increased water consumption in E+ calves is an increased liquid passage rate. In sheep, liquid passage rate has been demonstrated to increase with increasing levels of ergovaline supplementation, and was accompanied by increased water intake (Hannah et al., 1990). Increased osmolality, which is a contributing factor to increased passage rates, has been observed in mice consuming an E+, compared with an E-, diet (Barger and Tannenbaum, 1998). In cattle, increased dry matter content in the rumen has been reported for steers consuming an E+ diet, indicating a potential increase in liquid passage rates (Foote et al., 2013). However, passage rates were not examined in either of these experiments and are mentioned here only as a potential explanation for the increased water intake among E+ heifers. Thus, to ascertain if these differences are present in cattle consuming toxic endophyte diets, future research is warranted.
Treatment differences in water intake that were evident in EXP 2 were not detected in EXP 1. Reasons for differing effects of endophyte treatment on water consumption between the two experiments are unclear. Environmental conditions were controlled within similar levels in both experiments and diets were of similar composition. The detection of differences due to exit velocity in the second experiment could be related to the use of animals with greater mean difference in exit velocity in EXP 2.
Conclusion
These experiments demonstrated that a positive relationship may exist between the proportion of lymphocytes producing IFN-γ and weaning exit velocity in the absence of treatment effects, indicating that differentiation of CD4+ cells to a TH1 subtype may be greater in high exit velocity heifers as compared with low exit velocity animals. Our earlier work (Altman, 2015) suggesting decreased IFN-γ with increasing exit velocity (and the basis for our hypothesis) was determined subsequent to LPS challenge, suggesting that IFN-γ during an acute phase response may not represent the relationship between exit velocity and IFN-γ production in the absence of sepsis. This is not surprising, given that immunological responses differ between the challenged and unchallenged state, and between bacterial (LPS model) and viral (PBMC model) insults. Consistent with our original hypothesis of additive effects, there was little evidence of interactions between animal temperament and alkaloid consumption coupled with heat exposure on immunological responses. However, the timing and direction of the responses were counter to our hypotheses. Our hypothesis regarding decreased IFN-γ with alkaloid exposure was based on responses in cell numbers during alkaloid exposure periods. Although results from Exp. 1 were generally consistent with this, previous research has not looked at immunological responses subsequent to exposure so it was of interest that lymphocyte responses were most prominent following removal of alkaloid/heat-exposure treatments. Additionally, the prior work which informed our alkaloid-effect hypothesis was confounded with potential differences in dry matter intake. Thus, it is also possible that by controlling intake, we observed more direct effects of alkaloids on IFN-γ. These results have potential implications for health responses during the early feedlot phase for cattle previously grazing endophyte-infected pastures.
Data availability statement
The raw data supporting the conclusions of this article will be made available by the authors, without undue reservation.
Ethics statement
The animal study was reviewed and approved by University of Kentucky Institutional Animal Care and Use Committee.
Author contributions
AWA and EV contributed equally to this work. All authors contributed to the article and approved the submitted version.
Funding
The information reported in this paper is part of a project of the Kentucky Agricultural Experiment Station and is published with the approval of the Director. This project was supported by USDA Agricultural Research Service National Program 101, Food Animal Production. Mention of trade name, proprietary product, or specified equipment does not constitute a guarantee or warranty by the University of Kentucky and does not imply approval to the exclusion of other products that may be available.
Conflict of interest
The authors declare that the research was conducted in the absence of any commercial or financial relationships that could be construed as a potential conflict of interest.
Publisher’s note
All claims expressed in this article are solely those of the authors and do not necessarily represent those of their affiliated organizations, or those of the publisher, the editors and the reviewers. Any product that may be evaluated in this article, or claim that may be made by its manufacturer, is not guaranteed or endorsed by the publisher.
References
Abebe F. (2019). Synergy between Th1 and Th2 responses during mycobacterium tuberculosis infection: A review of current understanding. Int. Rev. Immunol. 38, 172–179. doi: 10.1080/08830185.2019.1632842
Ai W., Li H., Song N., Li L., Chen H. (2013). Optimal method to stimulate cytokine production and its use in immunotoxicity assessment. Int. J. Environ. Res. Public Health 10, 3834–3842. doi: 10.3390/ijerph10093834
Aleyd E., Heineke M. H., Van Egmond M. (2015). The era of the immunoglobulin a fc receptor fcα RI; its function and potential as target in disease. Immunol. Rev. 268, 123–138. doi: 10.1111/imr.12337
Al-Tamimi H. J. (2002). Effect of nitric oxide donors on thermoregulation and performance of rats and cattle experiencing fescue toxicosis during heat stress (Columbia, MO: University of Missouri-Columbia). Doctoral Dissertation.
Altman A. W. (2015). Impact of endophyte-infected tall fescue seed on the acute phase and metabolic responses of cattle during an immunological challenge (Lexington, KY: University of Kentucky). Master’s Thesis.
Altman A. W., Burdick-Sanchez N. C., Carroll J. A., Schmidt T. B., Mcleod K. R., Aiken G. E., et al. (2016). Heat production, respiratory quotient, and methane loss subsequent to LPS challenge in beef heifers. J. Anim. Sci. 94, 20. doi: 10.2527/ssasas2015-040
Altman A. W., Kudupoje M. B., Adams A. A., Mcleod K. R., Vanzant E. S. (2020). Influence of chute exit velocity and fescue toxicosis on steer grazing and finishing growth, immune responses, and carcass characteristics. J. Anim. Sci. Res. 4, 1–12. doi: 10.16966/2576-6457.146
Baran J., Kowalczyk D., Oz M., Zembala M. (2001). Three-color flow cytometry detection of intracellular cytokines in peripheral blood mononuclear cells: Comparative analysis of phorbol myristate acetate-ionomycin and phytohemagglutinin stimulation. Clin. Diagn. Lab. Immunol. 8, 303–313. doi: 10.1128/CDLI.8.2.303-313.2001
Barger J. L., Tannenbaum M. G. (1998). Consumption of endophyte-infected fescue seeds and osmoregulation in white-footed mice. J. Mammal. 79, 464–474. doi: 10.2307/1382977
Behrends S., Miller R., Rouquette F. Jr., Randel R., Warrington B., Forbes T., et al. (2009). Relationship of temperament, growth, carcass characteristics and tenderness in beef steers. Meat Sci. 81, 433–438. doi: 10.1016/j.meatsci.2008.09.003
Bell R. L., Turkington H. L., Cosby S. L. (2021). The bacterial and viral agents of BRDC: Immune evasion and vaccine developments. Vaccines 9, 337. doi: 10.3390/vaccines9040337
Ben-Jonathan N. (1985). Dopamine: A prolactin-inhibiting hormone. Endocr. Rev. 6, 564–589. doi: 10.1210/edrv-6-4-564
Besser M. J., Ganor Y., Levite M. (2005). Dopamine by itself activates either D2, D3 or D1/D5 dopaminergic receptors in normal human T-cells and triggers the selective secretion of either IL-10, TNFα or both. J. Neuroimmunol. 169, 161–171. doi: 10.1016/j.jneuroim.2005.07.013
Blecha F., Baker P. E. (1986). Effect of cortisol in vitro and in vivo on production of bovine interleukin 2. Am. J. Vet. Res. 47, 841–845.
Blecha F., Boyles S. L., Riley J. G. (1984). Shipping suppresses lymphocyte blastogenic responses in Angus and Brahman × Angus feeder calves. J. Anim. Sci. 59, 576–583. doi: 10.2527/jas1984.593576x
Boehm U., Klamp T., Groot M., Howard J. C. (1997). Cellular responses to interferon-γ. Annu. Rev. Immunol. 15, 749–795. doi: 10.1146/annurev.immunol.15.1.749
Breathnach C., Sturgill-Wright T., Stiltner J., Adams A., Lunn D., Horohov D. (2006). Foals are interferon gamma-deficient at birth. Veterinary Immunol. immunopathol 112, 199–209. doi: 10.1016/j.vetimm.2006.02.010
Browning, Leite-Browning M. L. (1997). Effect of ergotamine and ergonovine on thermal regulation and cardiovascular function in cattle. J. Anim. Sci. 75, 176–181. doi: 10.2527/1997.751176x
Bruno K., Vanzant E., Altman A., Kudupoje M., Vanzant K., Mcleod K. (2017). A novel objective chute score interacts with monensin to affect growth of receiving cattle. J. Anim. Sci. 95, 3310–3321. doi: 10.2527/jas2017.1435
Bruno K. A., Vanzant E. S., Vanzant K. A., Altman A. W., Kudupoje M., Mcleod K. R. (2018). Relationship between quantitative measures of temperament and other observed behaviors in growing cattle. Appl. Anim. Behav. Sci. 199, 59–66. doi: 10.1016/j.applanim.2017.10.009
Bruno K., Vanzant E., Vanzant K., Mcleod K. (2016). Relationships of a novel objective chute score and exit velocity with growth performance of receiving cattle. J. Anim. Sci. 94, 4819–4831. doi: 10.2527/jas.2016-0438
Burdick N. C., Randel R. D., Carroll J. A., Welsh T. H. (2011). Interactions between temperament, stress, and immune function in cattle. Int. J. Zool. 2011, 1–9. doi: 10.1155/2011/373197
Burrow H. M., Dillon R. D. (1997). Relationships between temperament and growth in a feedlot and commercial carcass traits of bos indicus crossbreds. Aust. J. Exp. Agric. 37, 407–411. doi: 10.1071/EA96148
Cafe L. M., Robinson D. L., Ferguson D. M., Mcintyre B. L., Geesink G. H., Greenwood P. L. (2011). Cattle temperament: Persistence of assessments and associations with productivity, efficiency, carcass and meat quality traits. J. Anim. Sci. 89, 1452–1465. doi: 10.2527/jas.2010-3304
Capuco A. V., Bickhart D., Li C., Evock-Clover C. M., Choudhary R. K., Grossi P., et al. (2018). Effect of consuming endophyte-infected fescue seed on transcript abundance in the mammary gland of lactating and dry cows, as assessed by RNA sequencing. J. dairy Sci. 101, 10478–10494. doi: 10.3168/jds.2018-14735
Corrigan M. E., Drouillard J. S., Spire M. F., Mosier D. A., Minton J. E., Higgins J. J., et al. (2007). Effects of melengestrol acetate on the inflammatory response in heifers challenged with mannheimia haemolytica. J. Anim. Sci. 85, 1770–1779. doi: 10.2527/jas.2006-396
Curley K. Jr., Paschal J., Welsh T. Jr., Randel R. (2006). Exit velocity as a measure of cattle temperament is repeatable and associated with serum concentration of cortisol in Brahman bulls. J. Anim. Sci. 84, 3100–3103. doi: 10.2527/jas.2006-055
Darrah P. A., Patel D. T., De Luca P. M., Lindsay R. W. B., Davey D. F., Flynn B. J., et al. (2007). Multifunctional TH1 cells define a correlate of vaccine-mediated protection against leishmania major. Nat. Med. 13, 843. doi: 10.1038/nm1592
Dawe D., Stuedemann J., Hill N., Thompson F. (1997). “Immunosuppression in cattle with fescue toxicosis,” in Neotyphodium/Grass interactions. Eds. Bacon C. W., Hill N. S. (New York: Springer).
De Jong E. C., Vieira P. L., Kalinski P., Kapsenberg M. L. (1999). Corticosteroids inhibit the production of inflammatory mediators in immature monocyte-derived DC and induce the development of tolerogenic DC3. J. Leukoc. Biol. 66, 201–204. doi: 10.1002/jlb.66.2.201
Dew R. K. (1989). Effects of endophyte infected tall fescue on cellular and humoral aspects of immune function in the rat mouse and bovine (Lexington, KY: University of Kentucky). Doctoral Doctoral Dissertation.
Duff G. C., Galyean M. L. (2007). Board-invited review: recent advances in management of highly stressed, newly received feedlot cattle. J. Anim. Sci. 85, 823–840. doi: 10.2527/jas.2006-501
Dyer D. C. (1993). Evidence that ergovaline acts on serotonin receptors. Life Sci. 53, PL223–PL228. doi: 10.1016/0024-3205(93)90555-H
Falkenberg S. M., Miller R. K., Holloway J. W., Rouquette F. M. Jr., Randel R. D., Carstens G. E. (2005). “Exit velocity effects on growth, carcass characteristics, and tenderness in half-blood bonsmara steers,” in Proc. 51st Int. Congress of Meat Sci. Technol, Baltimore, MD. 7–12.
Fell L. R., Colditz I. G., Walker K. H., Watson D. L. (1999). Associations between temperament, performance and immune function in cattle entering a commercial feedlot. Aust. J. Exp. Agric. 39, 795–802. doi: 10.1071/EA99027
Filipov N., Thompson F., Stuedemann J., Elsasser T., Kahl S., Sharma R., et al. (1999). Increased responsiveness to intravenous lipopolysaccharide challenge in steers grazing endophyte-infected tall fescue compared with steers grazing endophyte-free tall fescue. J. Endocrinol. 163, 213–220. doi: 10.1677/joe.0.1630213
Foote A. P., Kristensen N. B., Klotz J. L., Kim D. H., Koontz A. F., Mcleod K. R., et al. (2013). Ergot alkaloids from endophyte-infected tall fescue decrease reticuloruminal epithelial blood flow and volatile fatty acid absorption from the washed reticulorumen. J. Anim. Sci. 91, 5366–5378. doi: 10.2527/jas.2013-6517
Fujiwara T., Oda K., Yokota S., Takatsuki A., Ikehara Y. (1988). Brefeldin a causes disassembly of the golgi complex and accumulation of secretory proteins in the endoplasmic reticulum. J. Biol. Chem. 263, 18545–18552. doi: 10.1016/S0021-9258(19)81393-5
Ghosh M. C., Mondal A. C., Basu S., Banerjee S., Majumder J., Bhattacharya D., et al. (2003). Dopamine inhibits cytokine release and expression of tyrosine kinases, lck and fyn in activated T cells. Int. Immunopharmacol. 3, 1019–1026. doi: 10.1016/S1567-5769(03)00100-0
Hahn G. (1999). Dynamic responses of cattle to thermal heat loads. J. Anim. Sci. 77, 10–20. doi: 10.2527/1997.77suppl_210x
Hannah S. M., Paterson J. A., Williams J. E., Kerley M. S., Miner J. L. (1990). Effects of increasing dietary levels of endophyte-infected tall fescue seed on diet digestibility and ruminal kinetics in sheep. J. Anim. Sci. 68, 1693–1701. doi: 10.2527/1990.6861693x
Hemken R. W., Boling J. A., Bull L. S., Hatton R. H., Buckner R. C., Bush L. P. (1981). Interaction of environmental temperature and anti-quality factors on the severity of summer fescue toxicosis. J. Anim. Sci. 52, 710–714. doi: 10.2527/jas1981.524710x
Hill N. S., Belesky D. P., Stringer W. C. (1991). Competitiveness of tall fescue as influenced by acremonium coenophialum. Crop Sci. 31, 185–190. doi: 10.2135/cropsci1991.0011183X003100010042x
Hoveland C. S. (1993). Importance and economic significance of the acremonium endophytes to performance of animals and grass plant. Agr Ecosys Environ. 44, 3–12. doi: 10.1016/0167-8809(93)90036-O
Jenkins J. K., Suwannaroj S., Elbourne K. B., Ndebele K., Mcmurray R. W. (2001). 17-β-estradiol alters jurkat lymphocyte cell cycling and induces apoptosis through suppression of bcl-2 and cyclin a. Int. Immunopharmacol. 1, 1897–1911. doi: 10.1016/S1567-5769(01)00114-X
Ju X.-H., Xu H.-J., Yong Y.-H., An L.-L., Jiao P.-R., Liao M. (2014). Heat stress upregulation of toll-like receptors 2/4 and acute inflammatory cytokines in peripheral blood mononuclear cell (PBMC) of bama miniature pigs: an in vivo and in vitro study. Animal 8, 1462–1468. doi: 10.1017/S1751731114001268
Lamberts S. W. L., Macleod R. M. (1990). Regulation of prolactin secretion at the level of the lactotroph. Physiol. Rev. 70, 279–318. doi: 10.1152/physrev.1990.70.2.279
Lyimo Z. C., Nielen M., Ouweltjes W., Kruip T. A., Van Eerdenburg F. J. C. M. (2000). Relationship among estradiol, cortisol and intensity of estrous behavior in dairy cattle. Theriogenology 53, 1783–1795. doi: 10.1016/S0093-691X(00)00314-9
Lyons P. C., Plattner R. D., Bacon C. W. (1986). Occurrence of peptide and clavine ergot alkaloids in tall fescue grass. Science 232, 487–489. doi: 10.1126/science.3008328
Mckenna F., Mclaughlin P. J., Lewis B. J., Sibbring G. C., Cummerson J. A., Bowen-Jones D., et al. (2002). Dopamine receptor expression on human T-and b-lymphocytes, monocytes, neutrophils, eosinophils and NK cells: a flow cytometric study. J. Neuroimmunol. 132, 34–40. doi: 10.1016/S0165-5728(02)00280-1
Mclean K. J., Baldwin R. L., Li C.-J., Klotz J. L., Edwards J. L., Mcleod K. R. (2020). Synthetic alkaloid treatment influences the intestinal epithelium and mesenteric adipose transcriptome in Holstein steers. Front. Vet. Sci. 7, 615. doi: 10.3389/fvets.2020.00615
Mosier D. (2015). Review of BRD pathogenesis: The old and the new. Anim. Health Res. Rev. 15, 166–168. doi: 10.1017/S1466252314000176
Oliphint R. A. (2006). Evaluation of the inter-relationships of temperament, stress responsiveness and immune function in beef calves (College Station, TX: Texas A&M University). Master's Thesis.
Oliver J. W. (1997). “Physiological manifestations of endophyte toxicosis in ruminant and laboratory species,” in Neotyphodium/grass interactions. Eds. Bacon C. W., Hill N. S. (New York: Springer).
Oliver J. W., Abney L. K., Strickland J. R., Linnabary R. D. (1993). Vasoconstriction in bovine vasculature induced by the tall fescue alkaloid lysergamide. J. Anim. Sci. 71, 2708–2713. doi: 10.2527/1993.71102708x
Paavonen T., Andersson L. C., Adlercreutz H. (1981). Sex hormone regulation of in vitro immune response. estradiol enhances human b cell maturation via inhibition of suppressor T cells in pokeweed mitogen-stimulated cultures. J. Exp. Med. 154, 1935–1945. doi: 10.1084/jem.154.6.1935
Paterson J., Forcherio C., Larson B., Samford M., Kerley M. (1995). The effects of fescue toxicosis on beef cattle productivity. J. Anim. Sci. 73, 889–898. doi: 10.2527/1995.733889x
Petherick J. C., Holroyd R. G., Doogan V. J., Venus B. K. (2002). Productivity, carcass and meat quality of lot-fed bos indicus cross steers grouped according to temperament. Aust. J. Exp. Agric. 42, 389–398. doi: 10.1071/EA01084
Pollock J. M., Rowan T. G., Dixon J. B., Carter S. D. (1994). Level of nutrition and age at weaning: effects on humoral immunity in young calves. Brit. J. Nutr. 71, 239–248. doi: 10.1079/BJN19940130
Refinetti R., Cornélissen G., Halberg F. (2007). Procedures for numerical analysis of circadian rhythms. Biol. Rhythm. Res. 38, 275–325. doi: 10.1080/09291010600903692
Rice R. L., Blodgett D. J., Schurig G. G., Swecker W. S., Fontenot J. P., Allen V. G., et al. (1997). Evaluation of humoral immune responses in cattle grazing endophyte-infected or endophyte-free fescue. Vet. Immunol. Immunopathol. 59, 285–291. doi: 10.1016/S0165-2427(97)00079-2
Saker K. E., Allen V. G., Fontenot J. P., Bagley C. P., Ivy R. L., Evans R. R., et al. (2001). Tasco-forage: II. monocyte immune cell response and performance of beef steers grazing tall fescue treated with a seaweed extract. J. Anim. Sci. 79, 1022–1031. doi: 10.2527/2001.7941022x
Saker K. E., Allen V. G., Kalnitsky J., Thatcher C. D., Swecker W. S., Fontenot J. P. (1998). Monocyte immune cell response and copper status in beef steers that grazed endophyte-infected tall fescue. J. Anim. Sci. 76, 2694–2700. doi: 10.2527/1998.76102694x
Salerno F., Guislain A., Cansever D., Wolkers M. C. (2016). TLR-mediated innate production of IFN-γ by CD8+ T cells is independent of glycolysis. J. Immunol. 196, 3695–3705. doi: 10.4049/jimmunol.1501997
Sarkar C., Basu B., Chakroborty D., Dasgupta P. S., Basu S. (2010). The immunoregulatory role of dopamine: an update. Brain Behav. Immun. 24, 525–528. doi: 10.1016/j.bbi.2009.10.015
Schmidt S. P., Hoveland C. S., Clark E. M., Davis N. D., Smith L. A., Grimes H. W., et al. (1982). Association of an endophytic fungus with fescue toxicity in steers fed Kentucky 31 tall fescue seed or hay. J. Anim. Sci. 55, 1259–1263. doi: 10.2527/jas1982.5561259x
Schoenborn J. R., Wilson C. B. (2007). Regulation of interferon-γ during innate and adaptive immune responses. Adv. Immunol. 96, 41–101. doi: 10.1016/S0065-2776(07)96002-2
Spiers D. E., Wax L. E., Eichen P. A., Rottinghaus G. E., Evans T. J., Keisler D. H., et al. (2012). Use of different levels of ground endophyte-infected tall fescue seed during heat stress to separate characteristics of fescue toxicosis. J. Anim. Sci. 90, 3457–3467. doi: 10.2527/jas.2012-5099
Spiers D. E., Zhang Q., Eichen P. A., Rottinghaus G. E., Garner G. B., Ellersieck M. R. (1995). Temperature-dependent responses of rats to ergovaline derived from endophyte-infected tall fescue. J. Anim. Sci. 73, 1954–1961. doi: 10.2527/1995.7371954x
Sthoeger Z. M., Chiorazzi N., Lahita R. G. (1988). Regulation of the immune response by sex hormones. i. In vitro effects of estradiol and testosterone on pokeweed mitogen-induced human b cell differentiation. J. Immunol. 141, 91–98. doi: 10.4049/jimmunol.141.1.91
Strickland J. R., Bailey E. M., Abney L. K., Oliver J. W. (1996). Assessment of the mitogenic potential of the alkaloids produced by endophyte (Acremonium coenophialum)-infected tall fescue (Festuca arundinacea) on bovine vascular smooth muscle in vitro. J. Anim. Sci. 74, 1664–1671. doi: 10.2527/1996.7471664x
Stuedemann J. A., Hoveland C. S. (1988). Fescue endophyte: History and impact on animal agriculture. J. Prod. Agric. 1, 39–44. doi: 10.2134/jpa1988.0039
Thompson W. S., Mcclure W. W., Landowne M. (1950). Prolonged vasoconstriction due to ergotamine tartrate: Report of a case with recovery, with objective evaluation of vascular findings. Arch. Intern. Med. 85, 691–698. doi: 10.1001/archinte.1950.00230100148004
Keywords: endophyte, lymphocyte, cattle, interferon-gamma, heat
Citation: Altman AW, Adams AA, McLeod KR and Vanzant ES (2023) Interactions between animal temperament and exposure to endophytic tall fescue: Effects on cell-mediated and humoral immunity in beef heifers. Front. Anim. Sci. 4:1086755. doi: 10.3389/fanim.2023.1086755
Received: 14 December 2022; Accepted: 13 March 2023;
Published: 29 March 2023.
Edited by:
Todd Riley Callaway, University of Georgia, United StatesReviewed by:
Michelle L. Rhoads, Virginia Tech, United StatesMuhammad Zahoor Khan, University of Agriculture, Dera Ismail Khan, Pakistan
Copyright © 2023 Altman, Adams, McLeod and Vanzant. This is an open-access article distributed under the terms of the Creative Commons Attribution License (CC BY). The use, distribution or reproduction in other forums is permitted, provided the original author(s) and the copyright owner(s) are credited and that the original publication in this journal is cited, in accordance with accepted academic practice. No use, distribution or reproduction is permitted which does not comply with these terms.
*Correspondence: E. S. Vanzant, ZXZhbnphbnRAdWt5LmVkdQ==
†These authors have contributed equally to this work