 Paola Erminia Milia1†
 Laura Falchi2†
 Alberto Cesarani1,3*†
 Nicolo Pietro Paolo Macciotta1†
 Corrado Dimauro1†
- 1Dipartimento di Agraria, University of Sassari, Sassari, Italy
- 2Department of Agricultural, Forest and Food Sciences, University of Turin, Grugliasco, Italy
- 3Department of Animal and Dairy Science, University of Georgia, Athens, GA, United States
Three local cattle breeds are farmed in the island of Sardinia (Italy): Sarda (SAR), Sardo-Bruna (SB), and Sardo-Modicana (SM). Historically, SAR was the Sardinian autochthonous breed, known for its resilience despite low productivity. To improve its performance, SAR cows were crossbred with Brown Swiss (BR) and Modicana (MOD) bulls, originating SB and SM. The aim of this research was to investigate how much SAR genomic background remains in SB and SM. A sample of 239 animals (64 SAR, 57 SM, 20 SB, 50 BR and 48 MOD) were genotyped using the 50K SNP Illumina BeadChip. Initially, univariate approaches were used to investigate the genomic relationship of SB and SM with SAR, MOD, and BR. Admixture analysis (K = 2) revealed a greater genetic similarity of SB with SAR than with BR, whereas SM showed a greater genetic proximity with MOD than with SAR. This was also reflected in the Weighted FST values: SAR and SB showed the lowest FST (0.015), confirming their closer relationship, whereas SB and BR showed the highest (0.058), consistent with their greater divergence. For SM, the FST with MOD (0.027) was lower than with SAR (0.030), supporting its closer affinity with MOD. SNP in ROH (SNPROH) analyses identified 21 genomic regions shared among Sardinian cattle breeds, where 3 genes (COMMD1, B3GNT2, and FAM161A) linked to environmental adaptation were found. Further analyses combining univariate and multivariate methods identified SNP with low discriminant power between SAR and the derived populations (SM and SB). Some of these regions overlapped with shared runs of homozygosity (ROHREP), and contained genes potentially associated with adaptation (CTNNA2, ITPR2, NTN1, and USP43). This study demonstrates that part of the SAR genome is still present in SB and SM, particularly in regions related to adaptive traits.
1 Introduction
The highest number of endangered autochthonous cattle breeds is found in Europe and in the Caucasus, due to the widespread replacement of local populations with a limited number of highly specialized cosmopolitan breeds (Curone, 2019). Despite the dominance of these high-yielding and economically efficient breeds, some indigenous populations have survived, primarily due to the strong connection between their productive and reproductive traits and the environment in which they have evolved. Compared to highly selected cosmopolitan breeds, local populations are characterized by a greater frugality, fertility, disease resistance, longevity and resilience (Gandini et al., 2017), that make them particularly suitable for extensive management, natural grazing, and vegetation control (Felius et al., 2014). For this reason, they often represent the best option for economically exploiting marginal areas such as mountain pastures, woodlands, and foothills (De Haan et al., 1997; Ajmone-Marsan et al., 2001). These breeds have not undergone intensive genetic selection to enhance a single specific trait; as a result, many of them retain a dual-purpose (milk and meat) or even triple-purpose aptitude (milk, meat and work).
Sardinia is the second main island of Italy. Three local cattle breeds are farmed in this region: the Sarda (SAR), the Sardo-Bruna (SB), and the Sardo-Modicana (SM). Until the first half of the last century, the predominant breed was the Sarda (Figure 1A). This breed is present in Sardinia since the Neolithic, after the introduction of animals of Bos Macroceros species from Iberia, North Africa and Syria (Della Maria, 1936; Brandano et al., 1983). The breed is currently characterized by a marked phenotypic heterogeneity, especially in coat color and size (Bigi and Zanon, 2008). The Sarda is farmed in marginal and impervious areas, permitting the exploitation of agronomically infertile soils, mostly for meat production. The herd book was established in 1987.
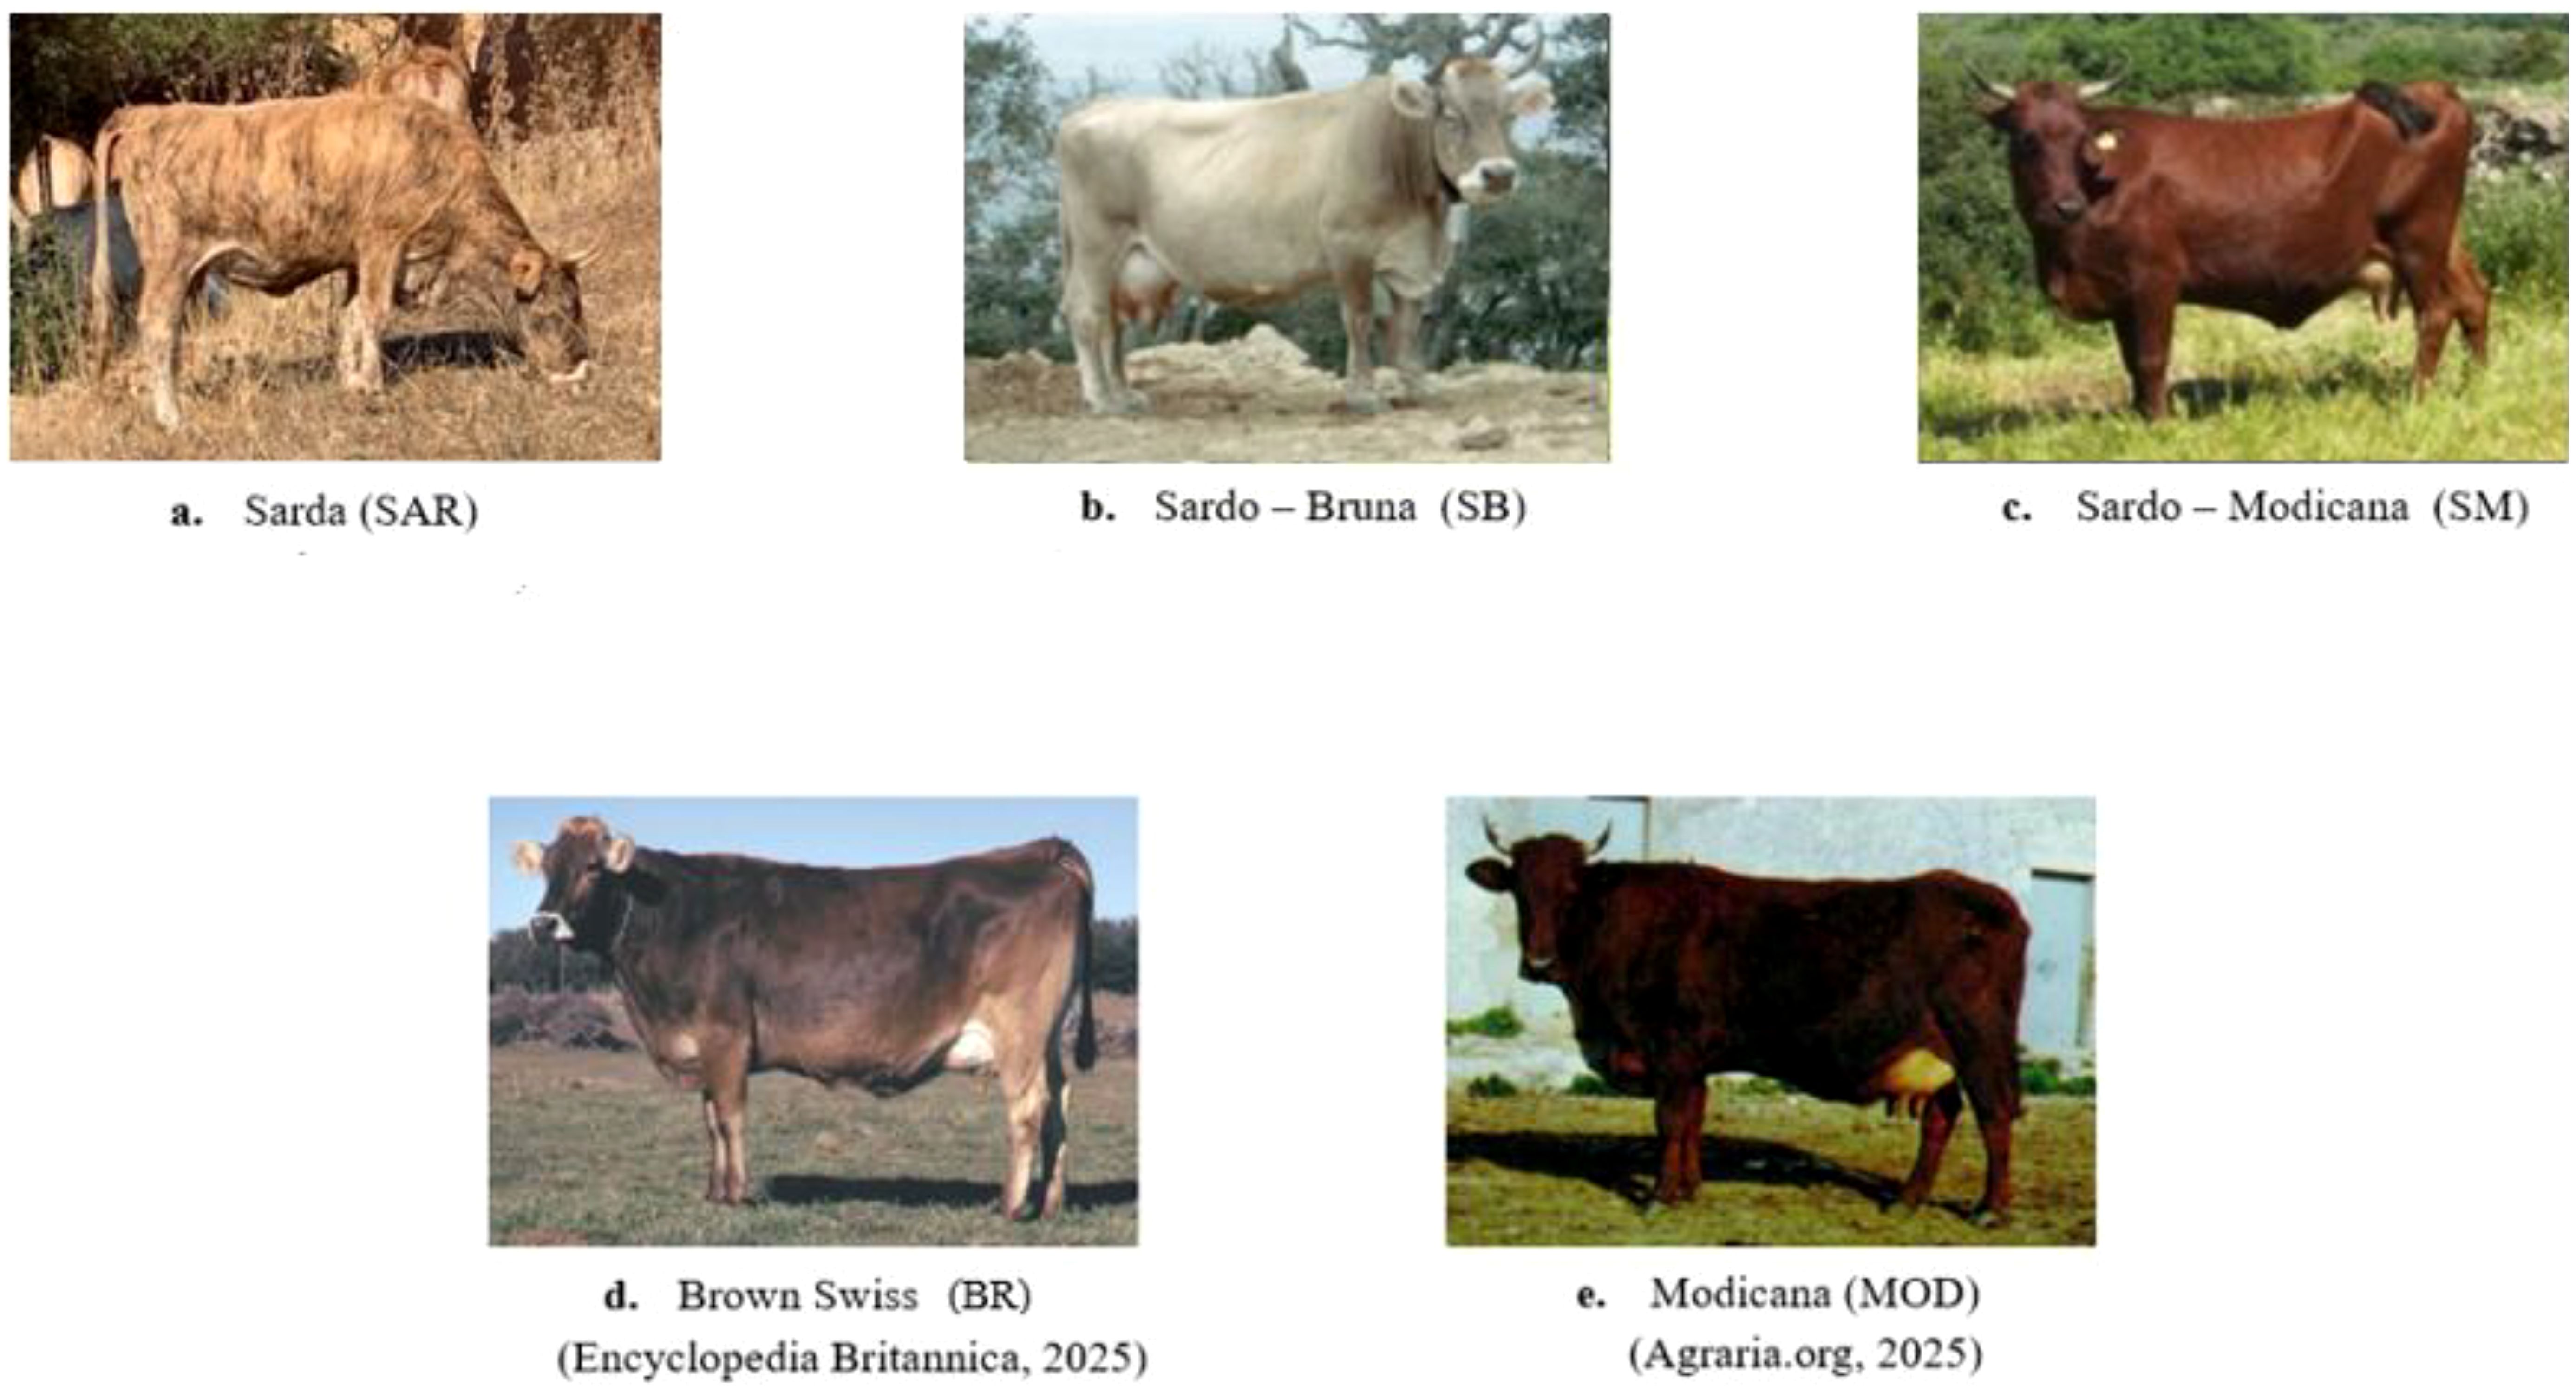
Figure 1. Pictures of the cattle breeds involved in the study. (A) Sarda cattle; (B) Sardo–Bruna cattle; (C) Sardo–Modicana cattle; (D) Brown Swiss cattle (source: Brown Swiss, Encyclopædia Britannica, https://www.britannica.com/animal/Brown-Swiss, accessed 31 Jan 2025); (E) Modicana cattle (source: Agraria.org, Modicana, https://www.agraria.org/razzebovineminori/modicana.htm, accessed 31 Jan 2025).
In order to improve its milk and meat production, since the second half of the XIX century Sarda cows started to be crossed with Brown Swiss (BR; Figure 1D) bulls imported from Switzerland, originating the dual aptitude Sardo-Bruna breed (Figure 1B) (Brandano et al., 1983). This breed, valued for its productivity and rusticity, was also exported to other Italian regions as well as Corsica and North Africa. It is medium size cattle characterized by a grey coat of various shades. Sardo Bruna cattle are mostly farmed in hilly and mountainous areas, often together with sheep in mixed systems (Bigi and Zanon, 2008). The family herd book was established in 1933, while the technical population standards were approved in 1996 (Regione Sardegna, 2007).
The last breed, the Sardo-Modicana (Figure 1C), originated with the aim of improving the working aptitude of the Sarda. This breed originated from the crossbreeding between Modicana (MOD; Figure 1E) bulls imported from Sicily and native Sarda cows. Before the development of agricultural mechanization, this breed was very appreciated for its working aptitude. The herd book, established in 1927, became effective in 1935. Instead, the breed registry was instituted in 1987 to safeguard the genetic variability of the breed, and it was later renewed in 1995 (Regione Sardegna, 2007).
Due to their easy calving and maternal aptitude, Sardinian local breeds are now mostly used for meat production by crossbreeding with specialized beef breeds, destined for fattening centers. Thus, the production of purebred animals is limited. According to FAO’s Domestic Animal Diversity Information System (DAD-IS, last update on 7 October 2024), the numbers of breeding males and females for Sarda are 1192 and 16597, raised across 898 herds with an average herd size of 24 animals. The Sardo-Bruna, a total of 1002 and 20741 individuals are registered as breeding males and females, respectively. The breed is farmed in 1,352 herds, with an average value of 21 animals per herd. The Sardo-Modicana, which is classified as “at risk”, has only 48 breeding males and breeding 1,493 females, across 118 herds averaging 19 animals. These figures highlight the vulnerability of purebred populations and the potential risk of genetic erosion. The three Sardinian cattle breeds are not under breeding programs, whereas in situ conservation programs are currently active (FAO, 2024).
Recent advances in genomic technologies, such as high-density SNP arrays and next-generation sequencing, provided exceptional insights into the evolutionary dynamics and genetic architecture of cattle populations, enabling detailed investigations of genetic diversity and historical evolution (Acciaro, 2013; Taye, 2018). The main approaches currently applied include the detection of selection signatures through allele frequency analysis (e.g., FST), linkage disequilibrium and haplotype length (XP-EHH), composite methods (XP-CLR), and allele spectrum analysis (Tajima’s D) (Taye, 2018). These tools allow the identification of genes associated with production and adaptation. Analyses of population structure and admixture carried out by the use of PCA or STRUCTURE and ADMIXTURE software, enable the identification of homogeneous genetic groups and ancestral contributions (e.g., Bos taurus vs. Bos indicus) (Edea et al., 2014; Taye et al., 2017; Cesarani et al., 2018). Runs of homozygosity (ROH)—continuous homozygous segments—are useful for estimating inbreeding (FROH), reconstructing demographic history, and detecting regions under selection (Fabbri et al., 2022). Linkage disequilibrium (LD), i.e., the non-random association of alleles at nearby loci, provides insights into the evolutionary history of populations: extended LD may signal recent selection events or demographic bottlenecks, whereas low LD indicates high genetic variability and absence of recent inbreeding (Gibson et al., 2006; Taye, 2018; Fabbri et al., 2022).
Application of these methodologies to Sardinian local breeds has revealed a detailed picture of their genetic variability. With respect to genetic structure and diversity, Sardinian breeds exhibit high intra-breed heterogeneity (Cesarani et al., 2018). Multidimensional scaling and admixture analyses confirm the genetic proximity of SM to MOD and SB to SAR (Cesarani et al., 2018; Mastrangelo et al., 2018). Inbreeding estimates based on ROH analyses (Fabbri et al., 2022) revealed lower values for Sardinian breeds when compared with other Italian local breeds (e.g., Calvana, Pisana and Pontremolese). Furthermore, the distribution of ROH suggests that inbreeding events in these breeds were less recent and less intense (Fabbri et al., 2022). Both ROH based approach and FST highlight genes likely subjected to strong selective pressure: the EIF6 gene on chromosome 13 (involved in glycolysis and lipid synthesis) and the DHRS7 gene on chromosome 10 (linked to steroid metabolism and intramuscular fat deposition) (Cesarani et al., 2018). Contemporary effective population size (cNe), which represents the idealized size of a population where genetic variability is maintained constantly across generations, varied among breeds: SB showed the largest cNe, indicating greater genetic variability and, consequently, higher evolutionary potential than SAR and SM (Mastrangelo et al., 2018). Studies on mitochondrial origins and African introgression revealed that most Sardinian mitochondrial DNA haplotypes belong to haplogroup T3 (typical of Europe), although T1 haplotypes, characteristic of African cattle, were also detected, including one unique haplotype specific to Sardinian breeds (Petretto et al., 2022). This evidence points to historical African introgression, either directly via Mediterranean routes or indirectly through the Iberian Peninsula.
Although previous studies have provided insights into the population structure, genetic diversity, and adaptation signatures of Sardinian cattle breeds, no investigation has yet addressed to what extent the SAR is still retained in the derived SB and SM populations. The scientific question of the paper was to estimate how much of SAR genomic background remains in the genetic heritage of SB and SM. For this reason, genotypes of SB and SM were compared not only with SAR, but also with those of the purebred populations from which they originated (BR and MOD).
2 Materials and methods
2.1 Animals and genomic data
Five different breeds (SAR, BR, MOD, SB, and SB) were considered in this study. The Supplementary Table 1 summarizes the distinguishing features of the analyzed subpopulations (Bigi et al., 2008; Biodiversità Sardegna, 2025; Braunvieh Switzerland, 2025; DAD-IS, 2025). All animals were genotyped with the 50K SNP Illumina BeadChip (Illumina, San Diego, CA, USA). The initial dataset contained 242 animals (50 BR, 50 MOD, 64 SAR, 20 SB, and 58 SM) and 35,364 common SNP. Quality control on genotypes was carried out breed by breed using PLINK 1.9 (Purcell et al., 2007) according to the following criteria: minor allele frequency greater than 2%, animal and SNP call rate greater than 95%. Moreover, SNP not in Hardy-Weinberg Equilibrium (P<1e-6), mapped on sexual chromosomes or unmapped according to the ARS1.2URC release, were also discarded. After quality control, 239 animals (50 BR, 48 MOD, 64 SAR, 20 SB, and 57 SM) and 35,057 SNP were retained for the subsequent analyses. Two different statistical approaches, univariate and multivariate, were employed to identify markers and corresponding genomic regions containing genes specifically associated with SAR.
2.2 Population genomic structure and admixture
Admixture analysis was conducted using Admixture software (v1.3), following the method described by Alexander et al. (2015) in the related software manual. To facilitate the interpretation of genetic structure among the analyzed populations, genetic admixture was estimated assuming K = 2 ancestral populations and calculated by the maximum likelihood method. For this reason, three Admixture analyses were conducted considering: i) SAR, SB, and SM; ii) MOD, SAR, and SM, iii) BR, SAR, and SB. By setting K = 2 the animals of three breeds were assigned to just two ancestral groups and, thus, we could better evaluate whether the two “composite” breeds (SB and SM) are closer to SAR or to the other two purebreds. In parallel, the genomic relationship matrix (GRM) was built with GCTA v1.92.1 (Yang et al., 2011) and used to estimate pairwise genomic relationships among individuals. Average relationships between breeds were calculated to assess genetic similarity. A principal component analysis (PCA) was then performed on the GRM in R v4.2.2 (R Core Team, 2022), and the first components were visualized using the package “ggplot2” (Wickham, 2016) to further explore the population structure.
2.3 Linkage disequilibrium and effective population size
Linkage disequilibrium (LD) and effective population size (Ne) were estimated for the five cattle breeds considered in this study (SAR, SB, SM, MOD, and BR). LD values were calculated with HAPLOVIEW (Barrett et al., 2005), considering markers within a physical distance of 1000 kb, following the procedure described by McKay et al. (2007). Estimates of Ne were derived from LD values according to the equation of Sved (1971), modified to account for finite population size. In addition, for the three Sardinian local breeds (SAR, SB, and SM), Ne was also computed using demographic data retrieved by the FAO database (DAD-IS, 2024). In this case, effective population size was estimated according to the equation proposed by Falconer and Mackay (1996):
where and are the number of adult males and females, respectively.
2.4 Wright fixation index
Using PLINK 1.9, the pairwise Wright fixation index (FST) was computed for the following pairwise comparisons: SAR vs SB, SAR vs SM, BR vs SB and MOD vs SM using the equation proposed by Weir and Cockerham (1984). To identify genomic regions potentially conserved or shared among Sardinian cattle breeds, FST values from the SAR vs SB and SAR vs SM pairwise comparisons were retained for further analyses. Given the strong asymmetry of the FST distribution, with values highly concentrated near zero, we applied a modified threshold to select SNP with lower FST values (FSTLOW) than expected under neutrality. Specifically, we defined a lower-bound threshold as:
where average (FST) is the average weighted FST value among the considered comparison and IQR is its interquartile range. This choice departs from the conventional criterion (1.5 × IQR) which would typically be used to identify outliers. However, the standard threshold proved too stringent for our dataset, resulting in the near-complete exclusion of SNP. The adjusted threshold preserved the statistical rationale of selecting variants based on deviation from the central tendency, while being tailored to the specific distribution observed in our data. This approach allowed us to retain SNP with unusually low genetic differentiation between SAR and the other breeds, which may reflect regions under balancing selection or shared ancestral polymorphisms.
2.5 Runs of homozygosity
Consecutive ROH were computed using the “detectruns” R package (Biscarini et al., 2018). The following parameters were adopted to define a ROH: at least 15 homozygote SNP in a row covering a minimum of 1 million base pairs; no heterozygote or missing SNP allowed. Number of ROH per animal (nROH), average ROH length (meanMb), number of ROH per class of length (1–2 Mb, 2–4 Mb, 4–8 Mb, 8–16 Mb, >16 Mb, respectively) and the genomic coefficients of inbreeding based on ROH (FROH) were computed. A ROH was defined as unique when it originated and ended at the same chromosomal positions. These unique ROH could occur in multiple individuals: when the same region was detected in more than one sample, it was classified as a repeated ROH (ROHREP) (Cesarani et al., 2018; Macciotta et al., 2021; Falchi et al., 2023). ROHREP were investigated to identify genomic regions shared among individuals from Sardinian breeds. A genomic region was considered as shared (shared ROHREP) only if it was present in at least one individual per breed (SAR, SB, and SM). To ensure the specificity of these shared segments to Sardinian cattle, only shared ROHREP that were not detected in any BR and MOD individual were retained. While ROHREP required identical start and end positions across individuals, we also adopted a SNP-level method based on the frequency of ROH occurrence. This strategy corresponds to the concept of ROH islands (Peripolli et al., 2018), allowing us to capture broader genomic regions consistently shared among Sardinian breeds, beyond strictly defined ROH boundaries. For each SNP, the proportion of individuals in which the SNP was located within a ROH was calculated and defined as SNPROH. To identify SNPROH shared among the Sardinian breeds, markers with a SNPROH value larger than the 97th percentile in all three breeds (i.e., SAR, SB, and SM) were selected. This stringent cutoff was chosen to capture only the strongest signals of shared genomic regions across Sardinian breeds, thereby avoiding the inclusion of weakly represented markers. Higher thresholds (98th and 99th percentiles) were also tested but did not yield common markers, suggesting the 97th percentile as the maximum threshold at which shared SNPROH could be identified.
2.6 The multivariate approach
The multivariate analysis, according to the algorithm proposed by Manca et al. (2020), was used to explore genetic similarities in the pairwise comparisons involving the three Sardinian cattle breeds (i.e., SAR vs. SB and SAR vs. SM). The genomic data were structured in a multivariate format, where the rows represented the animals and the columns contained the SNP, along with an additional column indicating the breed. Two multivariate statistical techniques were applied to the data: the Stepwise Discriminant Analysis (SDA) and the Canonical Discriminant Analysis (CDA). The SDA is a statistical technique specifically conceived to identify the subset of variables that best differentiate groups. However, in this paper, SDA was used with an opposite purpose: SNP selected in different runs of SDA were subtracted from the dataset until the remaining markers had no discriminating power. With this aim, the STEPDISC procedure of SAS software (version 9.4, SAS Inst. Inc., Cary, NC, USA) was used with the ‘forward’ method and variables were selected basing on the partial R² criterion.
CDA is a multivariate statistical approach aimed at highlighting differences between groups of individuals and improving the understanding of relationships among variables. If p represents the number of groups, the CDA generates p−1 equations, known as canonical functions (CAN), which are linear combinations of the original variables (Xn). A CAN is structured as follows:
where Ci are the canonical coefficients (CC), indicating the contribution of each variable Xi in composing the CAN. To better interpret the role of Xi in group separation, Rencher and Scott (1990) standardized the CC values to account for correlations among the original variables. The absolute values of the standardized CCs can be used to rank variables based on their contribution to the CAN. Group differences within the CAN space were assessed using the Hotelling’s T-square test (De Maesschalck et al., 2000). The CANs were also employed to predict the group membership of each animal. In practice, the CANs were applied to individual animals, generating a discriminant score. An animal was assigned to a specific group if its score was below the cutoff value, which was determined by calculating the weighted mean distance between the centroids of the two groups (Mardia et al., 2000).
The overall multivariate approach followed these five steps: i) the SDA was applied to SNP located in genomic regions previously individuated by FSTLOW. ii) Different runs of the SDA were subsequently applied to that data. At each run, the partial R² threshold was set to a very low value (0.0000001) to select the maximum number of discriminant markers that, in any case, cannot be greater than the number of involved animals. iii) After each SDA run, the CDA was applied to the remaining SNP to test if those markers were able to significantly discriminate groups. iv) The procedure stopped when the residual SNP were not able to significantly separate groups. Genomic regions surrounding these SNP could harbor genes that can be ascribed to SAR. Finally, the markers identified through this analysis were compared with those derived from the univariate approach (shared ROHREP and SNPROH) with the aim of identifying genomic regions commonly detected by both methods.
2.7 Gene and QTL discovery
Gene and QTL discovery was carried out on SNPROH identified in the comparison involving SAR, SB, and SM, as well as in genomic regions shared across both univariate and multivariate approaches. Genes located within 250 kb upstream and downstream of these variants were considered to account for local linkage disequilibrium (Manca et al., 2020). Annotated genes and QTL were retrieved from the UCSC Genome Browser Gateway (http://genome.ucsc.edu/) and the National Center for Biotechnology Information (NCBI, https://www.ncbi.nlm.nih.gov) databases, using the Bos taurus genome assembly ARS-UCD1.2 as reference.
3 Results
3.1 Population genomic structure and admixture
Figure 2A reports the Admixture analysis involving the three Sardinian autochthonous breeds (SAR, SB, and SM). SAR and SB shared a more similar ancestral composition (green bars in the Figure), with proportions of 0.80 and 0.89 for K = 1, and 0.20 and 0.11 for K = 2, respectively. In contrast, SM exhibited a clearly distinct ancestral component (blue bars in the Figure), with proportions of 0.09 for K = 1 and 0.91 for K = 2, suggesting a divergent genetic background. Figure 2B shows the comparison among MOD, SAR, and SM. SM displayed greater ancestral similarity with MOD (0.94 and 0.65 for K = 1, green color) than with SAR, which showed proportions of 0.10 for K = 1 and 0.90 for K = 2 (blue color). Finally, Figure 2C presents the analysis including BR, SAR, and SB. SB showed a closer and nearly equal genetic affinity (blue bars) with SAR (0.10 and 0.12 for K = 1, 0.90 and 0.88 for K = 2, respectively), while BR showed a more distinct profile (0.93 for K = 1 green color).
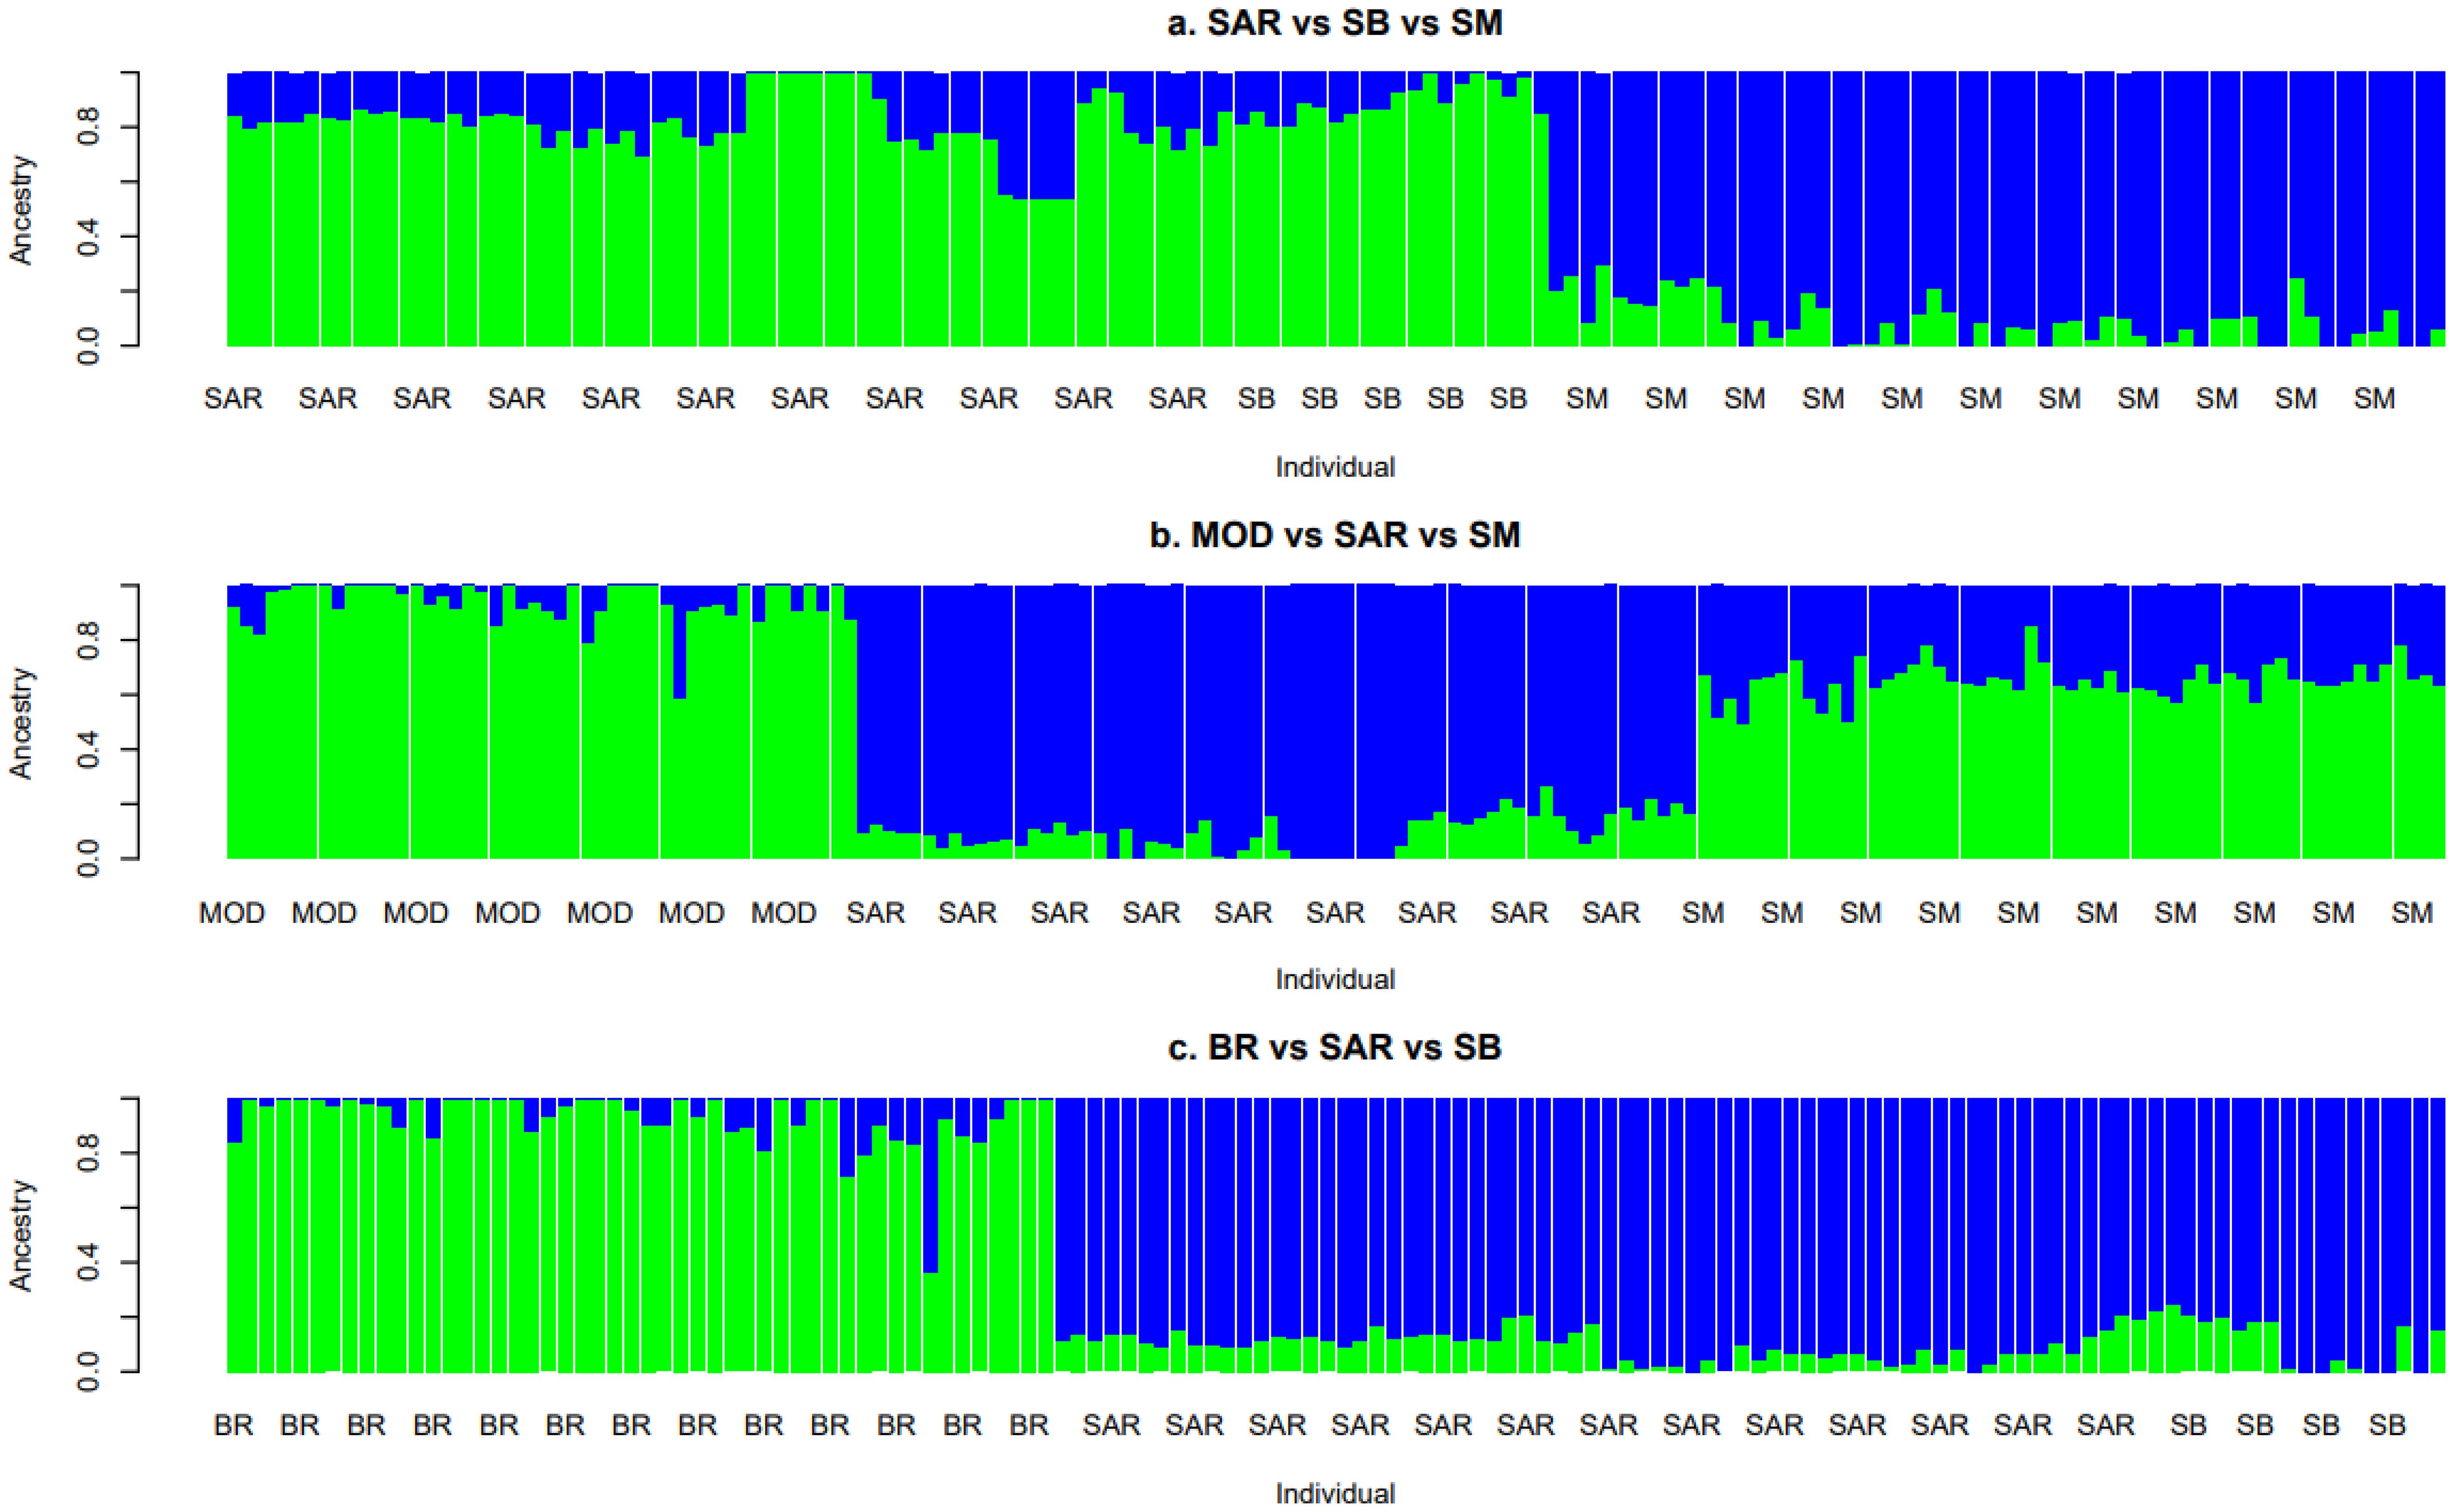
Figure 2. Admixture plots of the admixture analyses results at K = 2 in the five analyzed cattle breeds: Bruna (BR), Modicana (MOD), Sarda (SAR), Sardo-Bruna (SB) and Sardo-Modicana (SM).
A clear separation among the breeds was observed along the first principal component (PC1), which explained about 4.2% of the total variance (Figure 3). Along this axis, individuals from BR cluster (red points) were plotted at the left extreme, whereas MOD and SM were positioned on the right (yellow and fuchsia points, respectively). SAR and SB breeds (blue and green points, respectively) occupied intermediate positions. The second component (PC2), explaining 2.6% of the total variance, further corroborated the differentiation among the investigated breeds, with SB close to SAR and SM close to MOD, confirming their closer genetic similarity. Estimates of average genomic relationships among breeds revealed generally low values, confirming clear genetic differentiation across groups. The highest mean relationship was observed between SAR and SB (0.026), whereas the lowest was detected between SM and SB (mean = -0.027). A positive value was also found for the SM vs MOD comparison (mean = 0.013), indicating a slightly higher degree of genomic similarity compared with other breed pairs. The remaining comparison showed values close to zero, suggesting limited genomic relatedness among the analyzed populations (Table 1).
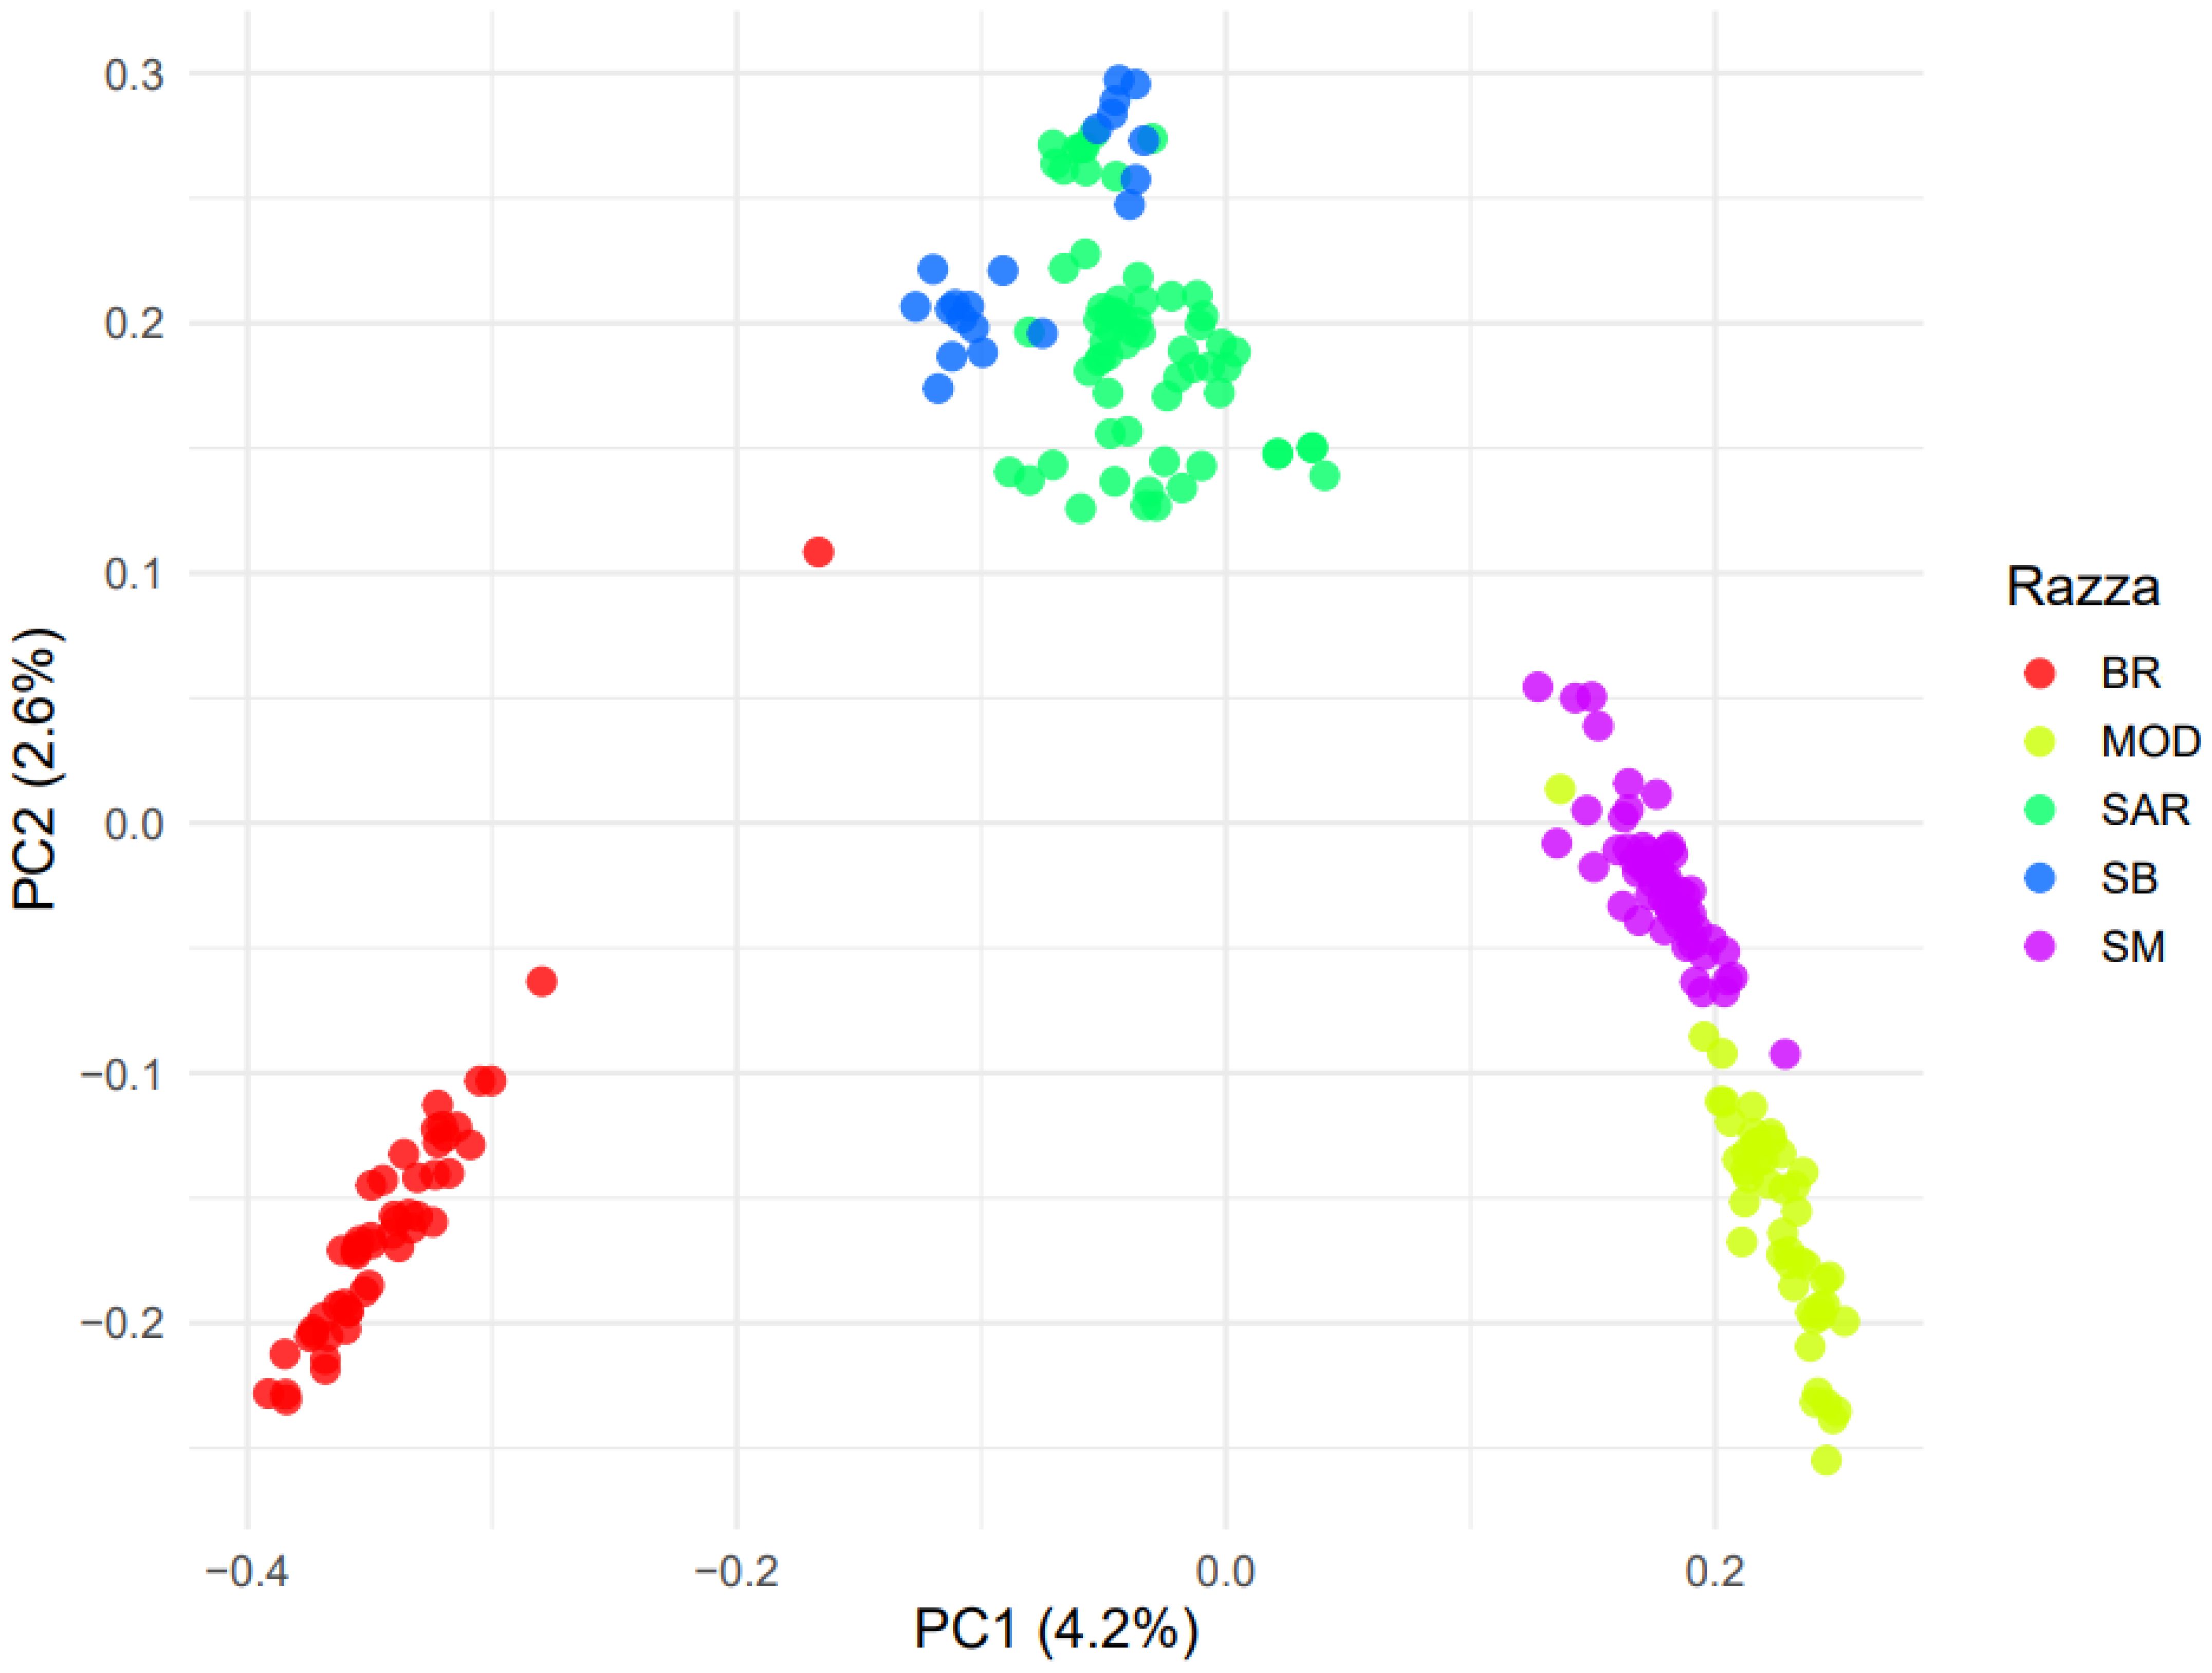
Figure 3. Plot of the Principal component analysis (PCA) based on the genomic relationship matrix of the five investigated breeds: Bruna (BR), Modicana (MOD), Sarda (SAR), Sardo-Bruna (SB) and Sardo-Modicana (SM).
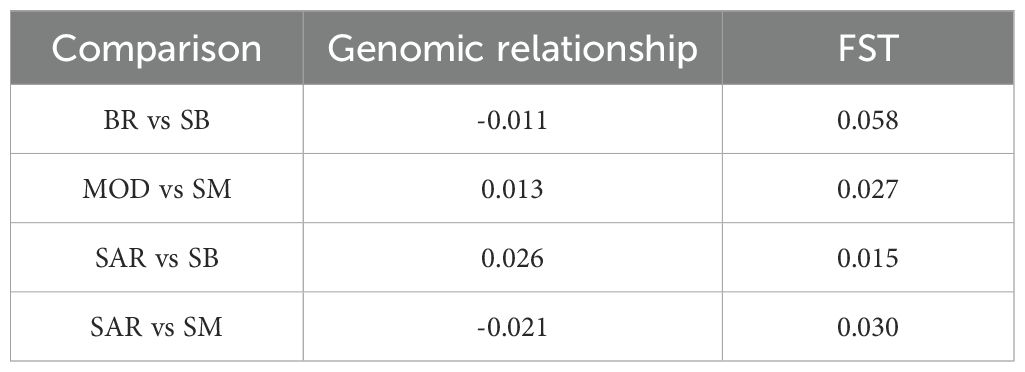
Table 1. Genomic relationship results obtained from the genomic kinship matrix and the weighted Wright’s fixation index (FST) analysis for the pairwise comparisons considered in the five analyzed cattle breeds: Bruna (BR), Modicana (MOD), Sarda (SAR), Sardo-Bruna (SB) and Sardo-Modicana (SM).
3.2 Linkage disequilibrium and effective population size
The decay of linkage disequilibrium (LD) showed clear differences among the five breeds analyzed (Figure 4). As expected, BR displayed the highest levels of LD across all distance classes. MOD showed intermediate levels of LD, whereas the three Sardinian local breeds (SAR, SB, and SM) exhibited lower overall LD values, with SAR showing the fastest decay of LD, followed by SB and SM.
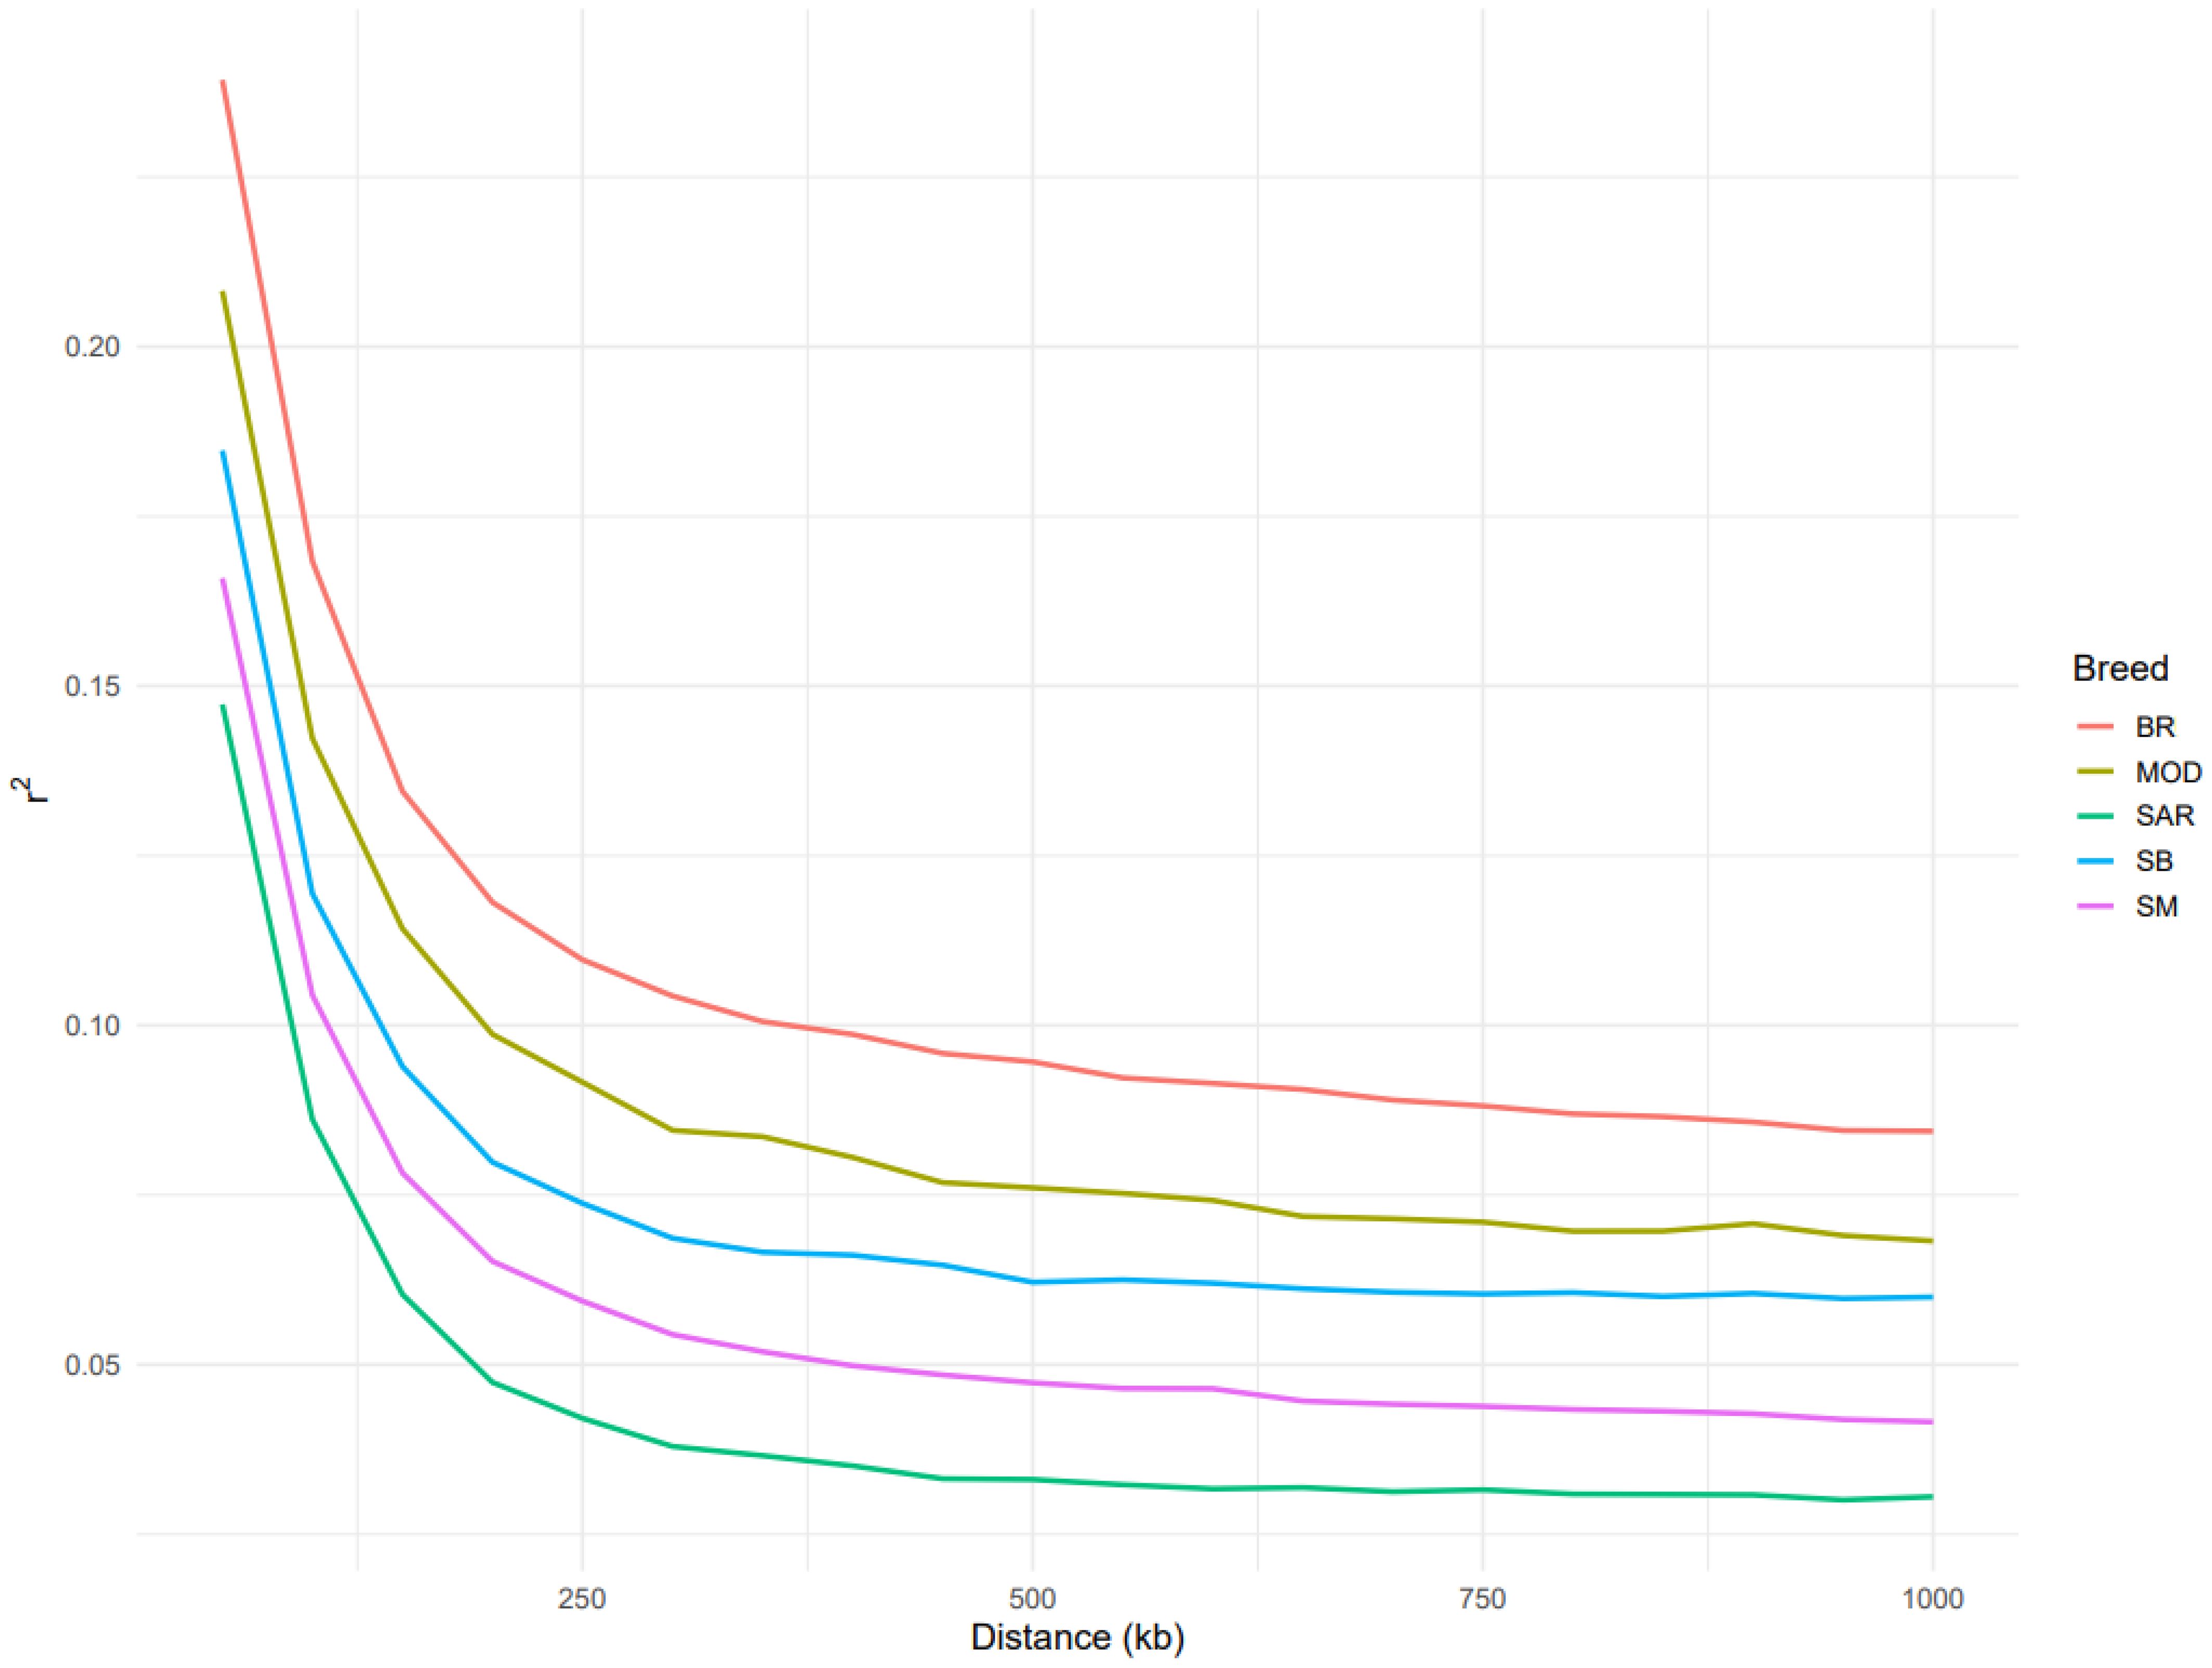
Figure 4. Average linkage disequilibrium (LD; r2) between markers within an interval of 1000 kb in the five analyzed cattle breeds Bruna (BR), Modicana (MOD), Sarda (SAR), Sardo-Bruna (SB) and Sardo-Modicana (SM).
Estimates of effective population size (Ne) revealed consistent patterns with the LD decay profiles (Figure 5). The SAR breed exhibited the highest Ne across generations, followed by SB and SM, while MOD and BR showed the lowest values. For the three Sardinian local breeds, Ne estimated using the equation of Falconer and Mackay (1996), showed that SAR had the largest effective population size (Ne = 4449), closely followed by the SB (Ne = 3823), whereas the SM had a substantially lower Ne (Ne = 186).
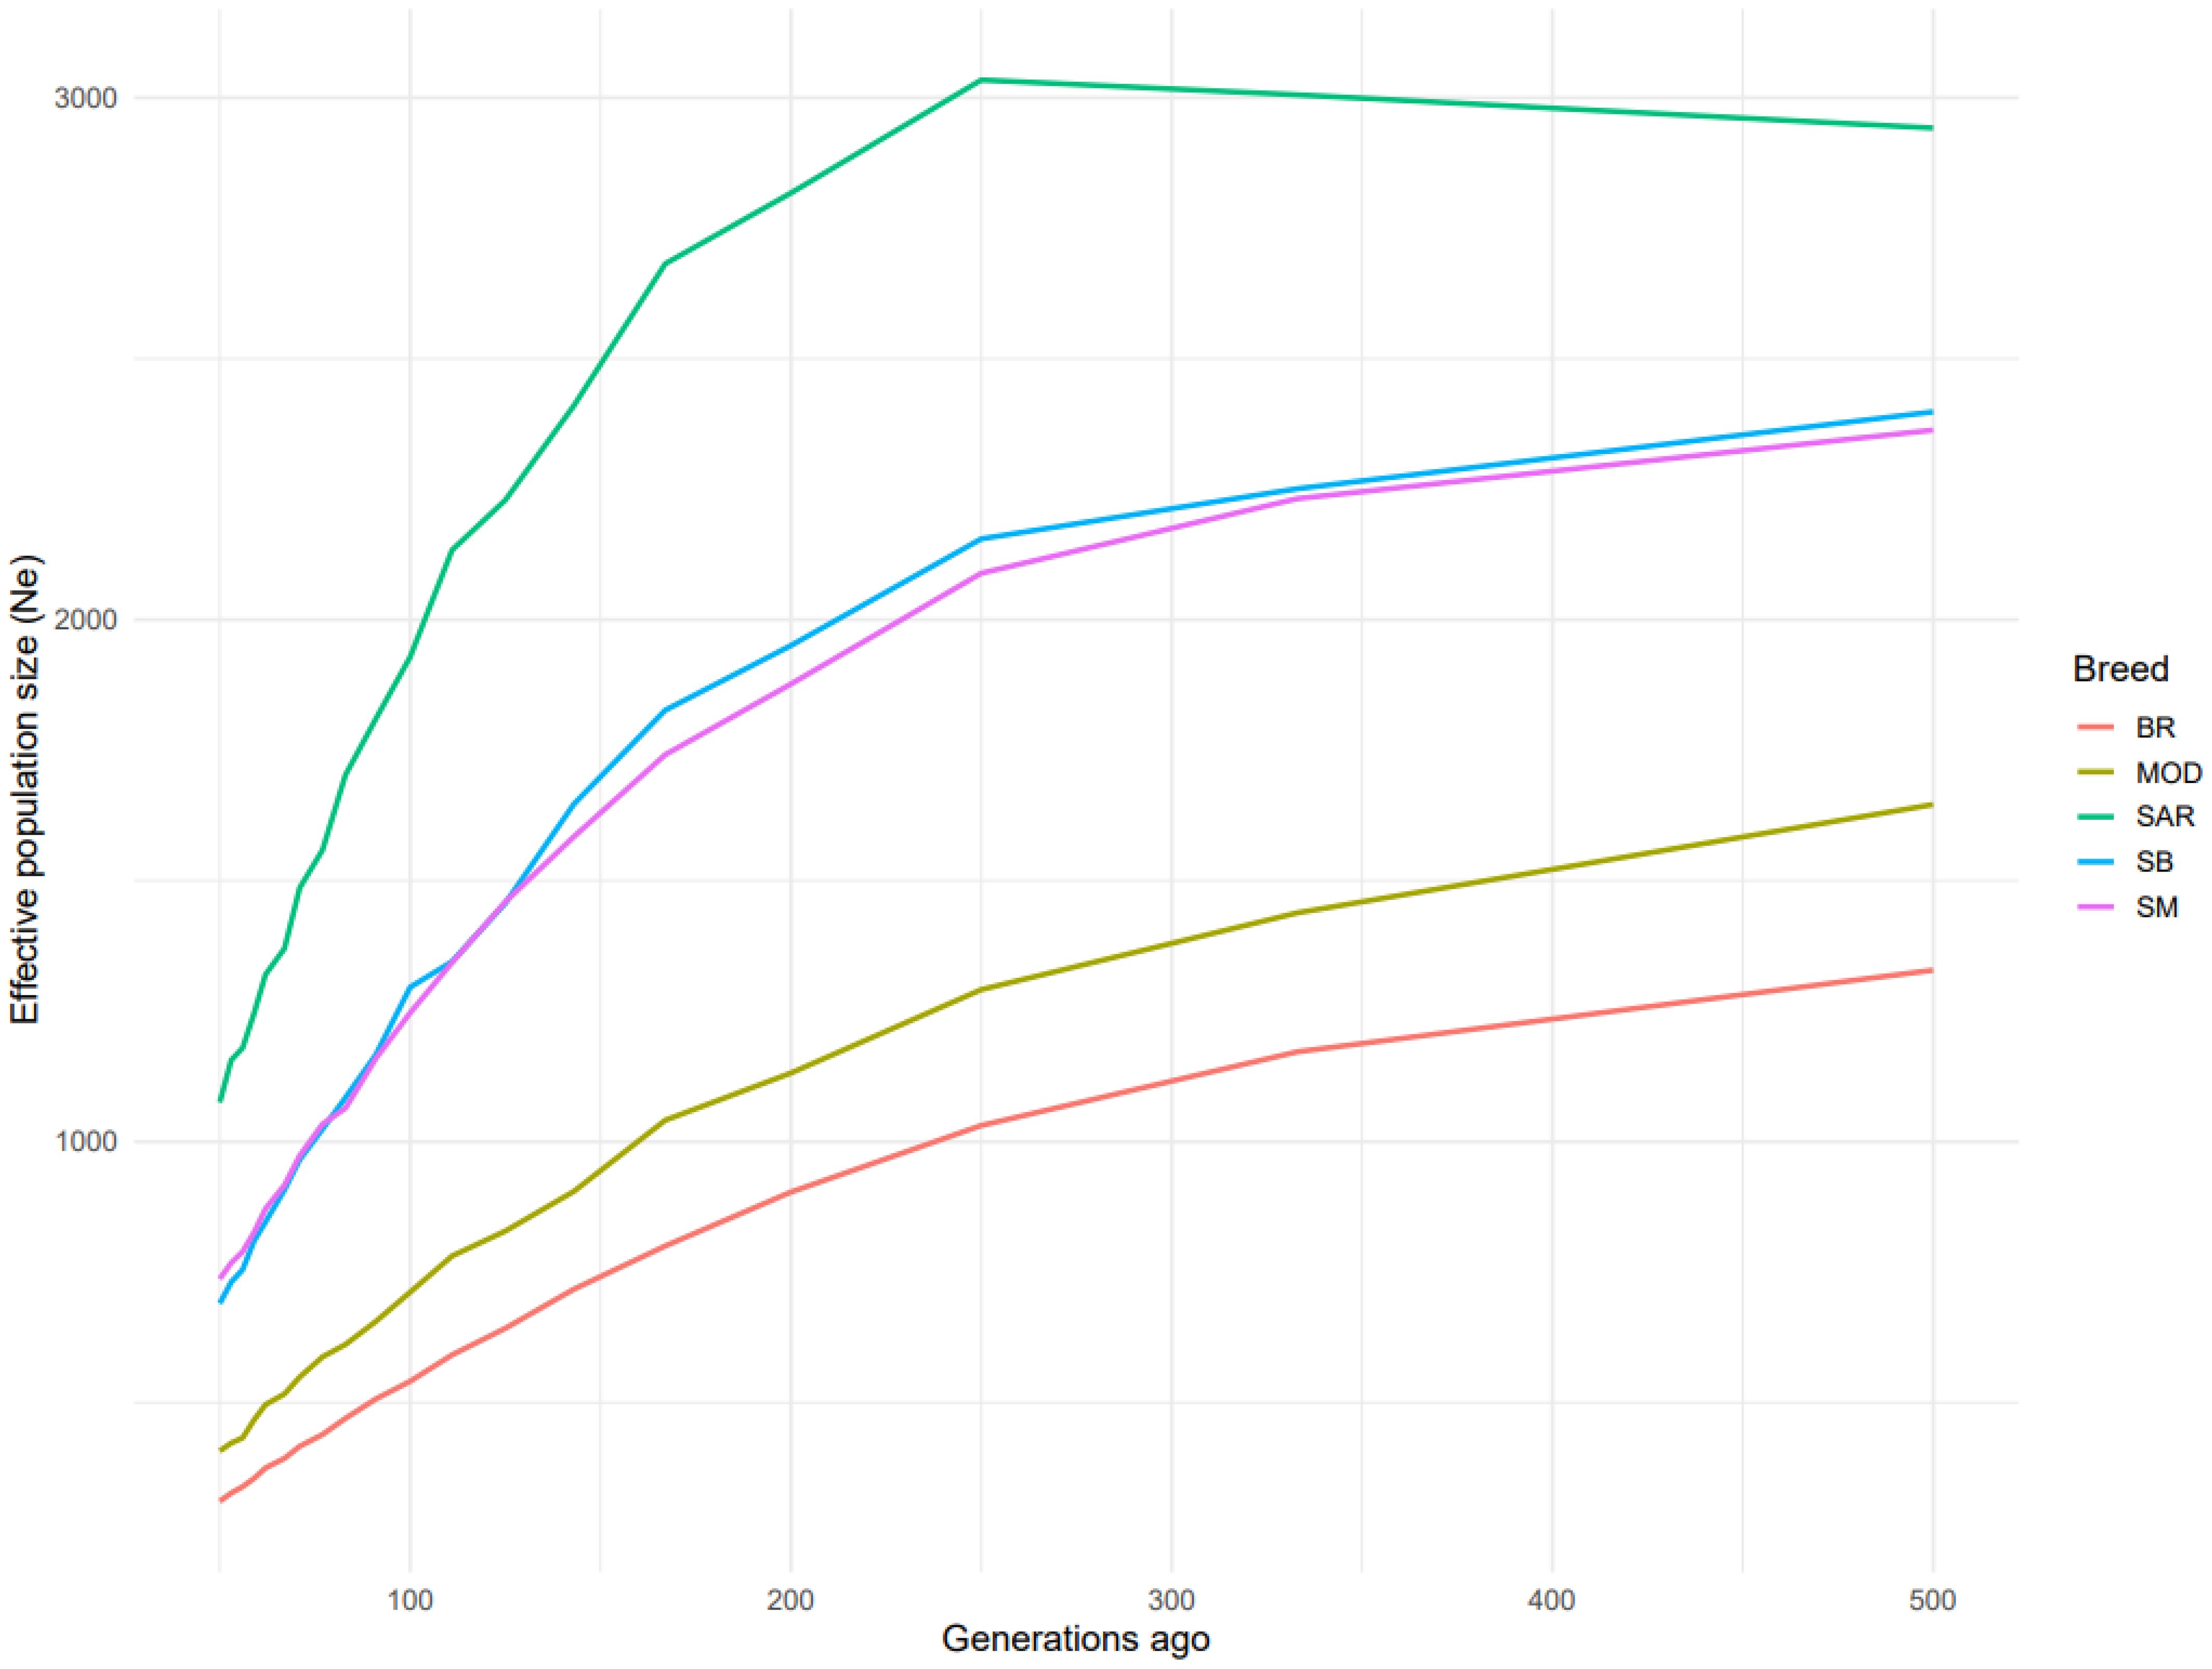
Figure 5. Effective population size based on LD according to the generation ago considered in the five analyzed cattle breeds Bruna (BR), Modicana (MOD), Sarda (SAR), Sardo-Bruna (SB) and Sardo-Modicana (SM).
3.3 Wright fixation Index
The FST values for all the pairwise comparisons are reported in Table 1. The highest weighted FST value (0.058) was observed between BR vs SB and between SAR vs SM (0.030). The lowest value was instead found between SAR vs SB (0.015). Applying the FSTLOW threshold to the initial dataset of 35,057 SNP yielded 16,048 SNP in the SAR vs SB comparison and 15,598 in the SAR vs SM comparison. These SNP represent genomic variants with significantly reduced genetic differentiation and were thus considered as candidate markers of conserved genomic regions between these Sardinian breeds.
3.4 Runs of homozygosity
Basic statistics of ROH analyses are reported in Table 2. A total of 15,277 ROH were identified across 239 (64 SAR, 20 SB, 57 SM, 50, BR and 50 MOD) animals, all of which had at least five ROH. In terms of distribution among the breeds, BR, MOD, and SM exhibited larger number of ROH accounting for 72% of the total identified ROH. In contrast, SB displayed the lowest number, with only 1,107 ROH, representing just 7% of the total. Regarding the length of the ROH, SM showed the lowest average ROH length (33.29 ± 4.68 Mb). SAR and SB exhibited a significantly similar average number of ROH per animal (55.26 ± 29.22 and 56.44 ± 26, respectively), whereas BR showed the highest number of ROH (81.23 ± 12.41A) followed by MOD (72.47 ± 17.49AB) and SM (61.43 ± 19.12C). Regarding the ROH length classes, all breeds exhibited a higher proportion of ROH segments shorter than 2 Mb and a very similar distribution in the other classes (Table 2). The highest ROH-based inbreeding coefficient (FROH) was computed for BR (0.135 ± 0.001), whereas the lowest and similar values were observed for the three Sardinian breeds (0.080 ± 0.085 for SAR, 0.075 ± 0.064 for SB and 0.078 ± 0.053 for SM).
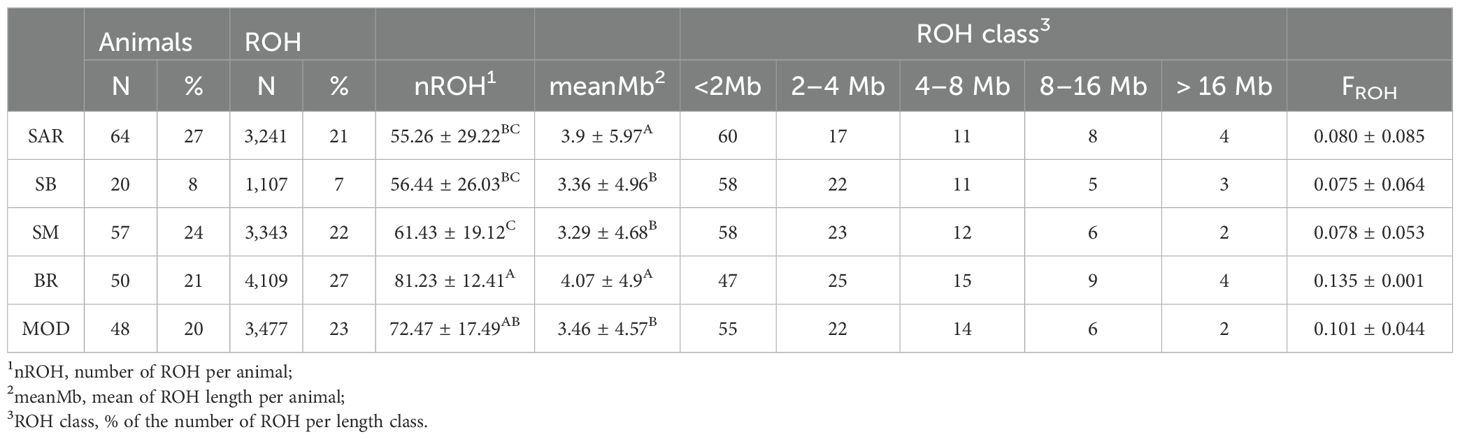
Table 2. Basic statistics and results of ROH statistical analyses in the five analyzed cattle breeds: Bruna (BR), Modicana (MOD), Sarda (SAR), Sardo-Bruna (SB) and Sardo-Modicana (SM).
The results of the shared ROHREP analysis are presented in Supplementary Table 2. Four genomic regions—located on BTA4, BTA14, BTA28, and BTA29—were identified as shared by at least one animal of the three Sardinian breeds, encompassing a total of 95 SNP. In the pairwise comparisons involving SAR vs SB or SAR vs SM, 32 and 40 genomic regions were detected in at least one animal per breed, respectively. The analysis based on SNPROH values allowed the identification of SNP frequently included within ROH in individuals of SAR, SB, and SM. A Total of eleven markers, 6 on BTA1 and 5 on BTA11, had a SNPROH larger than 97th of its distribution in the three breeds.
3.5 The multivariate approach
The SDA and CDA were applied to assess pairwise similarities between SAR vs SB and SAR vs SM. Of the 16,048 and 15,598 SNP previously identified in the univariate approach, the SDA retained 74 and 79 SNP, in the two comparisons, respectively (Supplementary Table 3). These SNP were considered as those that most strongly unified the breeds involved in the two comparisons. This is because the CDA was not able to significantly separate breeds (Hotelling’s T-square test > 0.05) when these SNP were used, with an error rate in assigning animals to the correct breed of around 20%. This result ultimately confirms that only common SNP remained among all three breeds. Notably, among the 74 SNP identified between SAR vs SB, one SNP on BTA4, two on BTA9, and one on BTA11 overlapped with the shared ROHREP detected in the same comparison (Table 3). Similarly, of the 79 SNP found between SAR and SM, one SNP on BTA5 and one on BTA19 were located within the corresponding shared ROHREP comparison (Table 3).
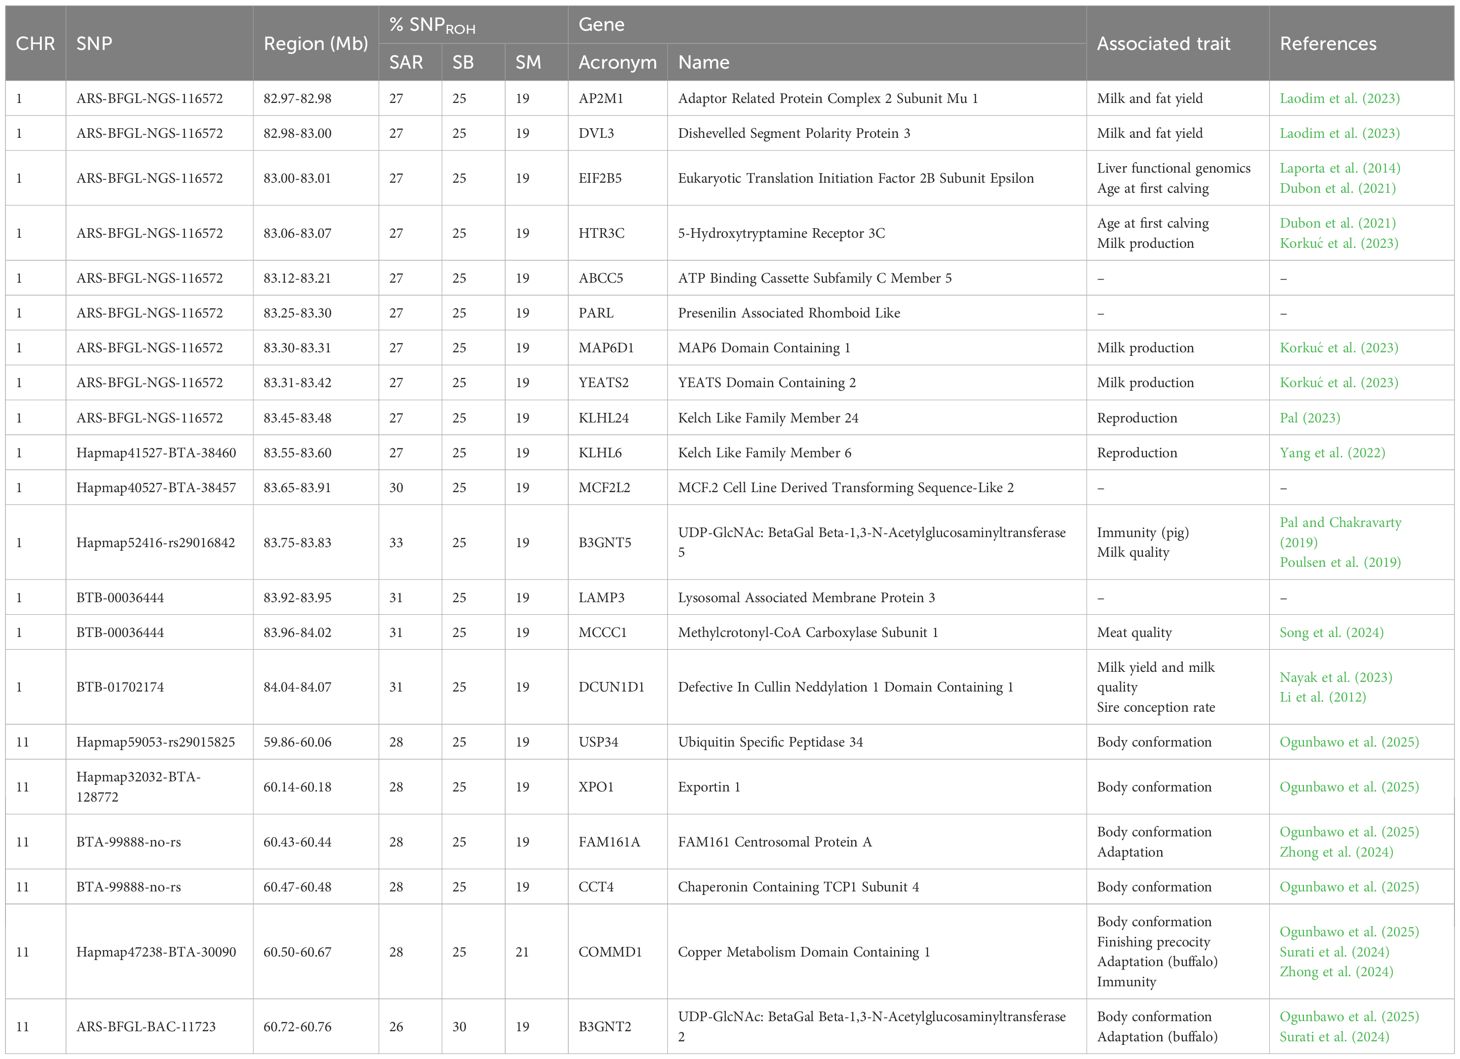
Table 3. Genomic regions, percentage of SNPROH in each breed (% SNPROH) and potentially associated genes found in SNPROH among the three Sardinian cattle breeds (SAR, Sarda; SB, Sardo-Bruna; SM, Sardo-Modicana).
3.6 Gene discovery
Among the SNPROH found in the comparison involving SAR, SB and SM, a total of 21 genes (of which 15 located on BTA1 and 6 located on BTA11, Table 4) and 38 QTL (14 on BTA1 and 24 on BTA11, Supplementary Table 5) were identified. In the genomic regions highlighted both by univariate and multivariate approach, 6 genes (5 on BTA 9 and 1 on BTA11, Table 3) and 37 QTL (Supplementary Table 4) were found between SAR vs SB whereas 6 genes (1 on BTA5 and 5 on BTA19, Table 3) and 40 QTL (Supplementary Table 4) were found between SAR vs SM.
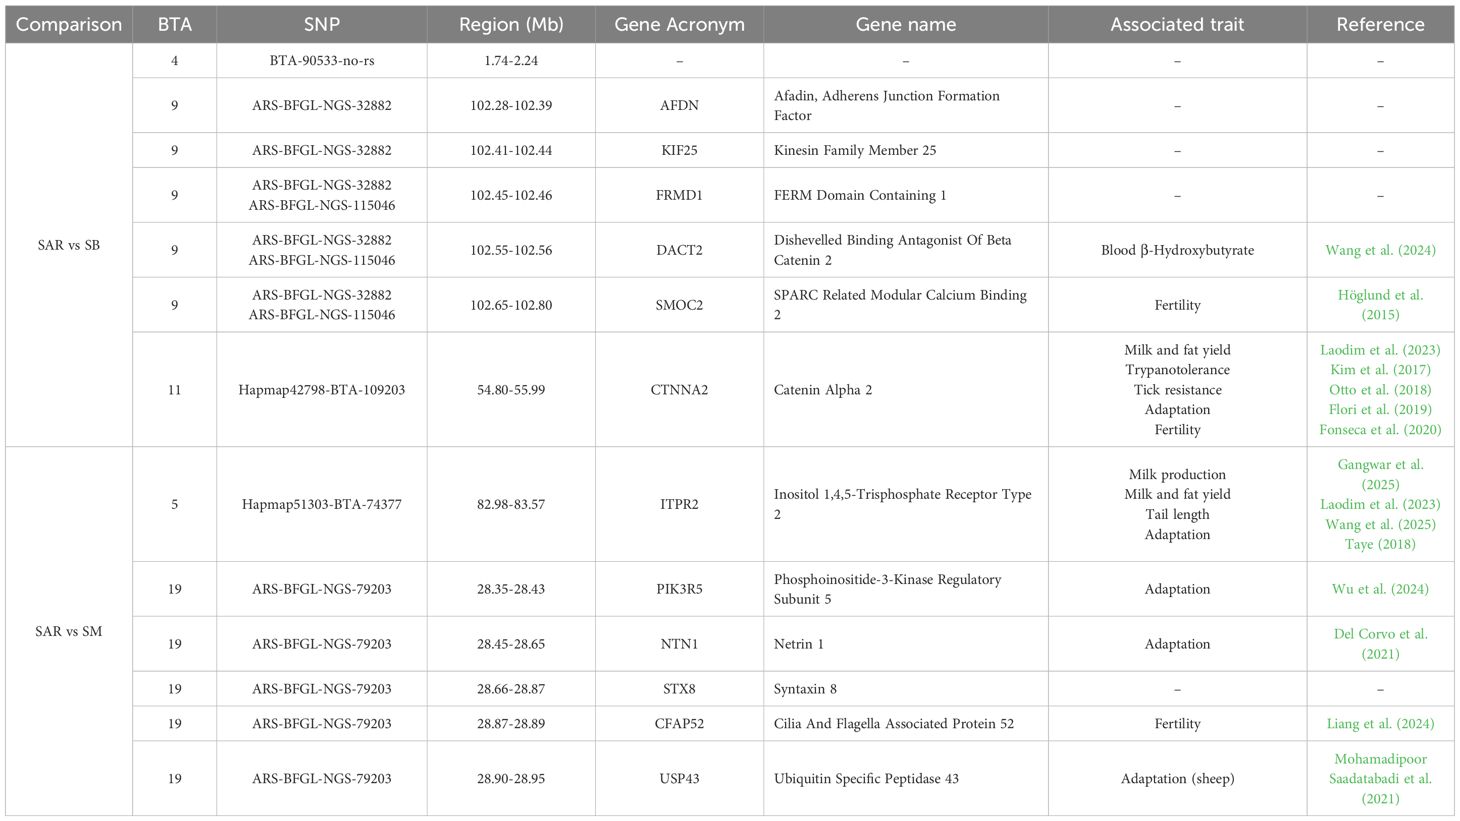
Table 4. Genomic regions and potentially associated genes found in common between CDA and shared ROH approaches in SAR vs SB and SAR vs SM comparisons (SAR, Sarda; SB, Sardo-Bruna; SM, Sardo-Modicana).
4 Discussion
Local breeds represent an important component of the zootechnical and cultural heritage of the regions where they originated. Despite their remarkable resilience and deep-rooted adaptation to local environments, shaped by specific ecological conditions and traditional practices (Felius et al., 2014), many native breeds face the threat of extinction. This is largely due to the widespread introduction of high-yield cosmopolitan breeds, which have progressively displaced local populations (Curone, 2019). One of the major dangers is the genetic erosion, driven by the crossbreeding with more productive non-native cattle (Bigi and Zanon, 2008). Preserving and promoting autochthonous breeds goes beyond safeguarding biodiversity and it also means protecting a distinctive cultural legacy (Nonić and Šijačić-Nikolić, 2021). While cosmopolitan breeds offer higher economic returns, they are often ill-suited to the particular demands of marginal areas. In this context, Sardinian autochthonous breeds represent an exemplary case of livestock populations genetically adapted to marginal environments, whose survival is, however, increasingly threatened by the widespread diffusion of cosmopolitan breeds. It is therefore of paramount importance to support the conservation and valorization of these autochthonous cattle, ensuring both their genetic continuity and their role within the cultural and economic identity of Sardinia.
Admixture analysis is a population genetics method used to estimate the proportion of ancestry of individuals or populations from a presumed number of ancestral populations (Kumar et al., 2003). In this study, admixture analysis was employed to assess genetic similarities between Sarda cattle, two composite (SB and SM), and the other two purebreds (BR and MOD) used in the crossbreeding schemes. In the analysis, the number of ancestral population (i.e., the K parameter) was set to 2, consistently with the idea that genetically similar populations tend to show comparable proportions of ancestry components inferred at K = 2 (Kumar et al., 2003). Admixture analyses results showed that SB is more strongly related with SAR than with BR, whereas SM resulted to be genetically closer to MOD rather than SAR (Figures 2A–C). Similar results were reported by Mastrangelo et al. (2018), where admixture analyses provided valuable insights into the genetic composition of Sardinian cattle breeds: at lower K values, these breeds tended to share a common ancestral component with autochthonous Sicilian cattle breeds, indicating a degree of shared ancestry or historical gene flow. On the other hand, the Sardinian breed, at K = 24, exhibited a less distinct cluster compared to other breeds, suggesting a more complex genetic background potentially shaped by past admixture events. As a result, SAR shares genetic components with both SB and SM, but in different proportions. However, other studies showed how SAR tends to be closer to SB rather than SM when analyzed with BR and MOD (e.g., Cesarani et al., 2018). Determining the population structure of Sardinian cattle breeds provided useful insights into their genetic relationships. The PCA based on the genomic relationship matrix separated BR from the other populations along PC1, reflecting its well-known divergence from local breeds (Cesarani et al., 2018; Mastrangelo et al., 2018). In agreement with previous reports, MOD and SM clustered together, supporting the historical preservation of MOD genetic component in SM (Cesarani et al., 2018; Mastrangelo et al., 2018). Interestingly, SAR and SB tend to overlap in the PCA space, contrary to earlier studies that reported a clearer separation between SB and SAR (Cesarani et al., 2018; Mastrangelo et al., 2018). This result, probably influenced by different sampling procedures than earlier studies, suggests that SB retains a substantial genetic background shared with SAR, possibly due to local breeding practices or more recent genetic exchanges. Overall, our findings support a complex genetic landscape in which both distinct differentiation (BR vs. other breeds) and shared ancestry (SAR and SB, SM and MOD) coexist, consistent with the historical management of these local cattle populations.
The results of LD and effective population size analyses highlighted differences between local and cosmopolitan populations. Sardinian breeds showed lower LD consistent with a larger effective population size, mainly due to the use of natural matings (i.e., no artificial insemination) and the limited exchange of bulls among farms. In this context, Sardinian breeds, even when compared to other local and non-local Italian breeds, tend to show a higher Ne (Mastrangelo et al., 2018).
The Wright fixation index is a key tool in population and evolutionary genetics research, as it provides valuable insights into the evolutionary processes that have shaped genetic variation both within and between populations. Additionally, FST is closely linked to the variance in allele frequencies across populations, offering important information regarding the degree of genetic similarity among individuals (Holsinger and Weir, 2009). FST weighted values estimates among the considered populations confirmed what was already observed with Admixture: SB seems to be more genetically closer to SAR rather than to BR. The FST value between SAR and SB (0.015) closely aligns with the findings of Mastrangelo et al. (2018), who reported a value of 0.016. However, in the comparisons between SAR vs SM and SM vs MOD, the FST values obtained in this study (0.030 for SAR vs SM and 0.027 for SM vs MOD, respectively) were slightly lower than those obtained by Mastrangelo et al. (2018) (0.040 for SAR vs SM and 0.025 for SM vs MOD, respectively). These discrepancies could be due to differences in sample size or allele calling methodologies, that may influence FST estimates and account for the slight discrepancies observed between the two studies (Holsinger and Weir, 2009).
ROH are uninterrupted stretches of homozygous genotypes that originate from common ancestors, indicating regions identical by descent (Gibson et al., 2006). The length of these segments can offer insight into the timing of inbreeding events (Gibson et al., 2006.), whereas their pattern can also reflect selective pressures, both natural and artificial, as selection can lead to the fixation of beneficial alleles, thereby increasing homozygosity at specific loci (Szmatoła et al., 2019; Falchi et al., 2023). In the present study, all breeds exhibited a higher concentration of ROH in the short and medium length classes, indicating that most inbreeding events likely occurred in the more distant past (Gibson et al., 2006); comparable results were observed in the same breeds by Cesarani et al. (2018). The inbreeding coefficients (FROH) were relatively similar among the three Sardinian breeds – SAR (0.080 ± 0.085), SB (0.075 ± 0.064), and SM (0.078 ± 0.053) – suggesting comparable levels of autozygosity and inbreeding history (Mastrangelo et al., 2018). In contrast, BR and MOD showed higher FROH value (0.135 ± 0.001 for BR and 0.101 ± 0.044 for MOD), reflecting a lower genetic diversity. Similar ROH-based inbreeding coefficients were reported by Mastrangelo et al. (2018) for MOD cattle (0.105 ± 0.067), whereas slightly lower values were reported by Signer-Hasler et al. (2017) in Brown Swiss cattle (0.115 ± 0.037). The current results are broadly consistent with previous studies, in which the Sarda breed was reported to have a low mean FROH (0.060 ± 0.063), reflecting a larger within-breed genetic variability (Mastrangelo et al., 2018). Likewise, moderate inbreeding levels were already reported in literature for SB and SM (Mastrangelo et al., 2018).
The analysis of ROH across breeds or individuals provides valuable insights into population genetics and animal breeding, helping to identify genomic regions under selection or linked to important traits (Peripolli et al., 2017; Szmatoła et al., 2019; Falchi et al., 2022). The results obtained in this study highlighted shared genomic regions (ROHREP) and genetic markers (SNPROH) shared among Sardinian breeds, representing candidate loci potentially underlying common adaptive traits or breed-specific selection. Notably, both shared ROHREP and SNPROH analyses revealed homozygous signals exclusive to the Sardinian populations, i.e., absent in BR and MOD, supporting the concept of a “Sardinity” genetic signature. This approach diverges from the majority of previous studies conducted on these local breeds, which typically focus on identifying genetic differences rather than similarities (e.g., Cesarani et al., 2018; Mastrangelo et al., 2018; Fabbri et al., 2021). Instead, here we emphasize the common genomic features that unify the Sardinian cattle, providing novel insights into the shared evolutionary histories and potential adaptive convergence. Complementing this univariate approach, the multivariate analysis using SDA and CDA in the SNP previously identified with FSTlow in the pairwise comparisons involving SAR vs SB and SAR vs SM, led to the identification of SNP subsets representing shared genomic components. CDA, when SNP selected at the end of the SDA runs were used, was not able to significantly separate breeds (Hotelling’s T-square test > 0.05) with 20% of misclassification rate. This result suggests that these markers largely capture common genetic features across the breeds, possibly reflecting shared ancestry, gene flow, or convergent selection. Remarkably, both methodologies independently highlighted genomic regions (Table 3) where markers were consistently retained and mapped within shared ROH segments between SAR vs SB and SAR vs SM. Their consistent detection across distinct analytical frameworks reinforces its biological relevance and points to the need for further investigation. Overall, this convergence of univariate and multivariate evidence highlights the power of integrating complementary methods to identify robust genomic signatures with implications for breed conservation and genetic improvement strategies.
In this study, population stratification and genetic diversity and similarity in this study were investigated using different approaches based on SNP analysis. A more comprehensive approach, based on haplotypes, might deliver clearer insights on past crossbreeding events and proportion of SAR genome still conserved in SB and SM. However, most of the haplotypes-based analyses require information on ancestral populations and reference haplotypes (e.g., phased genotypes) that were not available for the current study.
4.1 Gene and QTL discovery
Among the approaches employed to detect genomic regions shared across Sardinian breeds, the SNP-based method (SNPROH) deserves particular attention as it allows the identification of broader and more biologically meaningful regions of homozygosity (Peripolli et al., 2018). As already pointed out, the three breeds under investigation in this study (SAR, SB, and SM) are characterized by a high level of resilience and adaptation to harsh environments. Using this approach, in two genomic region highlighted among SAR, SB, and SM breeds, two genes, COMMD1 (BTA11: 60.50–60.67 Mb) and B3GNT2 (BTA11: 60.72–60.76 Mb) (Table 3), were previously identified in Chilika buffalo as part of the genetic signature associated with adaptation to saline environments (Surati et al., 2024). Chilika is an indigenous Indian buffalo breed adapted to brackish water conditions around the Chilika Lake, characterized by high salinity levels and saline vegetation. The COMMD1 and B3GNT2 genes were functionally linked to biological pathways such as MAPK signaling, renin secretion, and endocytosis, all potentially contributing to physiological resilience in high-salinity habitats (Surati et al., 2024). Notably, COMMD1 has also been identified as a candidate gene involved in oxidative stress response and anti-inflammatory regulation in cattle (Zhong et al., 2024). Specifically, COMMD1 plays a key role in modulating the NF-κB signaling pathway, which is central to immune response and inflammation control. Reduced levels of COMMD1 protein have been associated with prolonged activation of NF-κB, leading to increased expression of pro-inflammatory cytokines (Muller et al., 2007). By fine-tuning NF-κB activity, COMMD1 may thus help maintain immune homeostasis under environmental stressors (Taye et al., 2017). FAM161A gene (BTA11: 60.43-60.44) has been reported as a candidate gene for environmental adaptation in cattle (Zhong et al., 2024). This gene plays a critical role in retinal structure and function, with its normal expression being essential for maintaining the integrity and performance of retinal cells (Häfliger et al., 2021). In tropically adapted breeds, such as the Hainan yellow cattle, the functional integrity of FAM161A is thought to contribute to environmental fitness by supporting effective vision — a key trait for navigating complex, wild habitats. Some QTL found in the regions highlighted by SNPROH among the three Sardinian cattle breeds were associated with traits of reproductive and adaptive relevance (Supplementary Table 5). In particular, QTL linked to fertility and reproduction were detected on BTA1 (non-return rate and birth index) and BTA11 (inseminations per conception). For health and resistance, QTL associated with tick resistance and bovine tuberculosis susceptibility were identified on BTA11.
For completeness, we also investigated the genomic regions identified by both univariate and multivariate approaches. These regions, as well as those identified by the SNPROH approach, revealed genes potentially associated with adaptation, fertility, and immunity (Table 4). In the SAR vs SB comparison, the gene CTNNA2 (BTA11: 54.80–55.99 Mb) was found. In Mediterranean cattle breeds, this gene was previously reported within genomic regions under positive selection related to climate variables, including the Temperature-Humidity Index (Flori et al., 2019). These findings suggest a potential role for CTNNA2 in thermoregulation and heat stress response, two key traits for adaptation to arid and semi-arid environments. Beyond its involvement in climate resilience, CTNNA2 has also been associated with trypanotolerance (Kim et al., 2017), tick resistance (Otto et al., 2018), fertility (Fonseca et al., 2020), and milk and fat yield in tropical dairy cattle (Laodim et al., 2023). The convergence of multiple lines of evidence supports the hypothesis that CTNNA2 plays a pleiotropic role in conferring resilience to environmental stressors while contributing to productive and reproductive performance in poor environments. In the SAR vs SM comparison, three genes—NTN1 (BTA1: 28.45-28.65 bp), PIK3R5 (BTA19: 28.35-28.43 BP), and USP43 (BTA19: 28.90-28.95 bp)— all of which previously associated with adaptation to environmental stressors, were identified. The NTN1 (Netrin 1) gene was reported by Del Corvo et al. (2021) as differentially methylated in response to heat stress in Nellore and Angus cattle. Specifically, it was hypomethylated in Nellore individuals during periods of thermal challenge, suggesting a potential role in enhancing gene expression under stress conditions. The PIK3R5 gene was identified in Hainan cattle by Hui et al. (2024) within a region under positive selection. A missense mutation in this gene was associated with altered mRNA and protein structures, potentially modulating the PI3K/Akt/mTOR pathway. This signaling cascade plays a central role in cellular metabolism and stress response, and thus, its regulation may contribute to improved heat tolerance in cattle from tropical regions. Lastly, the USP43 gene was found under selection in Iranian sheep breeds adapted to high temperatures (Mohamadipoor Saadatabadi et al., 2021). One fertility related gene, CFAP52 (BTA19: 28.90-28.95) was also found (Liang et al., 2024). ITPR2 gene (BTA5: 82.98–83.97 Mb was reported to play a role in calcium ion signaling pathways, which are involved in several adaptive and physiological processes (Taye, 2018; Wang et al., 2025). Notably, ITPR2 has been identified as a gene under positive selection in African cattle, potentially contributing to thermal tolerance through the regulation of eccrine sweat gland function (Taye, 2018). The protein encoded by ITPR2 modulates intracellular calcium release, a process critical for sweat secretion. Loss-of-function mutations in this gene have been associated with anhidrosis, indicating its essential role in thermoregulation (Klar et al., 2014; Cui and Schlessinger, 2015). In Brown Swiss cattle, ITPR2 has been implicated in skeletal traits such as tail length, with enriched functional annotations in calcium ion binding (GO:0005509), suggesting involvement in bone development and remodeling (Wang et al., 2025). Furthermore, it was found within the cAMP-mediated signaling pathway (GO:0071320), which is associated with anti-inflammatory responses (Tavares et al., 2020). In addition to gene-based signals, several QTL identified within the overlapping ROHREP-CDA regions were associated with traits of economic and adaptive importance (Supplementary Table 4). On BTA1, QTL linked to growth and feed efficiency were found between 83.49–83.96 Mb (average daily gain, residual feed intake, methane production), while QTL for calving ease and somatic cell score clustered at 84.06 Mb. On BTA11, some QTL between 59.73–60.86 Mb were related to fertility (inseminations per conception) and health (tick resistance, susceptibility to bovine tuberculosis).
The identification of genes and QTL associated with adaptation, fertility and immunity, reinforces the long-standing hypothesis that Sardinian cattle have undergone natural and human-driven selection for resilience in marginal environments. In particular, the Sarda breed’s ability to thrive on poor pastures and under low-input systems may have favored the retention of genetic variants linked to adaptive features, disease resistance and reproductive efficiency. These results are consistent with previous observations on the adaptability of local breeds across the Mediterranean, where extensive farming systems and pasture-based diets have shaped genetic profiles associated with improved meat and milk quality (e.g., fatty acid composition, kappa-casein content), metabolic efficiency, and reduced susceptibility to stress (Acciaro, 2013; Gatellier et al., 2005; Curone et al., 2019; Mastrangelo et al., 2018; Stanton et al., 2021; Alothman et al., 2019; Magan et al., 2021). Moreover, the co-occurrence of production-related QTL (growth, feed efficiency, milk yield) and adaptive signals in the same genomic regions suggests that local breeds such as the Sarda may combine modest productivity with functional robustness—a valuable trait combination in the context of sustainable and low-input agriculture.
5 Conclusion
This study confirms the retention of a substantial genomic background from the Sarda (SAR) breed in the derived Sardo-Bruna (SB) and Sardo-Modicana (SM) breeds. Admixture patterns and shared ROH regions suggest a clear genetic continuity, further supported by the identification of selective signatures associated with traits of environmental adaptation, immunity, and productive performance. The combined use of univariate and multivariate methods proved to be essential in capturing both locus-specific differentiation and broader genomic patterns, enhancing the resolution and reliability of the results. These findings highlight the adaptive potential embedded within local cattle breeds and their relevance for sustainable livestock systems, particularly in marginal environments. Indigenous breeds like SAR, SB, and SM are not only a reservoir of unique genetic diversity, but also represent a cultural and ecological asset, deeply connected to the Sardinian territory. The ongoing genetic erosion and risk of extinction of these breeds pose serious threats, not only to biodiversity but also to the resilience of local agropastoral systems and to the environmental balance. Therefore, conservation and valorization strategies for local breeds should be prioritized within broader frameworks of sustainable agriculture and rural development.
Data availability statement
The data presented in the study are deposited in the Mendeley Data repository, accession number doi: 10.17632/sxkjbbftrg.1.
Ethics statement
Animal Care and Use Committee approval was not needed as data were obtained from preexisting databases.
Author contributions
PM: Formal analysis, Writing – original draft, Writing – review & editing. LF: Formal analysis, Writing – review & editing. AC: Formal analysis, Writing – original draft, Writing – review & editing, Data curation, Supervision. NM: Writing – review & editing, Conceptualization, Funding acquisition, Supervision, Project administration. CD: Writing – original draft, Writing – review & editing, Conceptualization, Supervision, Project administration.
Funding
The author(s) declare financial support was received for the research and/or publication of this article. This study was supported by the project “Conoscenza e gestione sostenibile dei sistemi agricoli e forestali con il miglioramento sostenibile delle produzioni primarie: il caso dell’allevamento bovino in Sardegna” (University of Sassari, progetti di ricerca interdisciplinare -DM 737/2021, risorse 2021-2022; Finanziato dall’Unione Europea, Next-GenerationEU) and by the project “Analisi genomica con piattaforme SNP ad alta densità e sequenziamento del DNA genomico e mitocondriale del bovino di razza Sarda ai fini dello studio della variabilità genetica e storia evolutiva” of the Fondazione Banco di Sardegna (2016). This work was supported by the Research Center and received funding from the European Union Next-GenerationEU (PIANO NAZIONALE DI RIPRESA E RESILIENZA (PNRR) – MISSIONE 7 COMPONENTE 2, INVESTIMENTO 1.4 – D.D. 1032 17/06/2022, CN00000022). This manuscript reflects only the authors’ views and opinions; neither the European Union nor the European Commission can be considered responsible for them.
Conflict of interest
The authors declare that the research was conducted in the absence of any commercial or financial relationships that could be construed as a potential conflict of interest.
Generative AI statement
The author(s) declare that no Generative AI was used in the creation of this manuscript.
Any alternative text (alt text) provided alongside figures in this article has been generated by Frontiers with the support of artificial intelligence and reasonable efforts have been made to ensure accuracy, including review by the authors wherever possible. If you identify any issues, please contact us.
Publisher’s note
All claims expressed in this article are solely those of the authors and do not necessarily represent those of their affiliated organizations, or those of the publisher, the editors and the reviewers. Any product that may be evaluated in this article, or claim that may be made by its manufacturer, is not guaranteed or endorsed by the publisher.
Author disclaimer
This manuscript reflects only the authors’ views and opinions, neither the European Union nor the European Commission can be considered responsible for them.
Supplementary material
The Supplementary Material for this article can be found online at: https://www.frontiersin.org/articles/10.3389/fanim.2025.1685894/full#supplementary-material
References
Acciaro M. (2013). Role of pasture in the growth, intake and meat quality of Sardinian cattle breeds. University of Sassari, Sassari, Italy. PhD thesis.
Ajmone-Marsan P., Negrini R., Crepaldi P., Milanesi E., Gorni C., Valentini A., et al. (2001). Assessing genetic diversity in Italian goat populations using AFLP® markers. Animal Genetics. 32, 281–586. doi: 10.1046/j.1365-2052.2001.00789.x
Alexander D. H., Shringarpure S. S., Novembre J., and Lange K. (2015). “Admixture 1.3 software manual,” in Software manual (UCLA Human Genetics Software Distribution, Los Angeles, CA, United States).
Alothman M., Hogan S. A., Hennessy D., Dillon P., Kilcawley K. N., O’Donovan M., et al. (2019). The “grass-fed” milk story: Understanding the impact of pasture feeding on the composition and quality of bovine milk. Foods 8, 350. doi: 10.3390/foods8080350
Barrett J. C., Fry B., Maller J., and Daly M. J. (2005). Haploview: analysis and visualization of LD and haplotype maps. Bioinformatics 21, 263–265. doi: 10.1093/bioinformatics/bth457
Bigi D. and Zanon A. (2008). Atlante delle razze autoctone: Bovini, Equini, Ovicaprini, Suini allevati in Italia (Bologna, Italy: Edagricole).
Biodiversità Sardegna (2025). Vacca Sardo-Bruna. Available online at: https://www.biodiversitasardegna.it/laore/it/agrobiodiversita/repertorio-regionale/risorsa/Vacca-sardo-bruna/ (Accessed January 31, 2025).
Biscarini F., Cozzi P., Gaspa G., and Marras G. (2018). detectRUNS: Detect runs of homozygosity and runs of heterozygosity in diploid genomes (R package version 0.9.6). Available online at: https://CRAN.R-project.org/package=detectRUNS (Accessed July 31, 2025).
Brandano P., Asara P., Pulina G., Bolla P., and Crimella C. (1983). The Sardinian cattle. 1. Morphological and biological characters. Ann. Fac. Agric. Univ. Sassari 30, 161–177.
Braunvieh Switzerland (2025). Braunvieh Switzerland homepage. Available online at: https://homepage.braunvieh.ch/en/ (Accessed January 31, 2025).
Cesarani A., Sorbolini S., Criscione A., Bordonaro S., Pulina G., Battacone G., et al. (2018). Genome-wide variability and selection signatures in Italian island cattle breeds. Anim. Genet. 49, 371–383. doi: 10.1111/age.12697
Cui C. Y. and Schlessinger D. (2015). Eccrine sweat gland development and sweat secretion. Exp. Dermatol. 24, 644–650. doi: 10.1111/exd.12761
Curone G. (2019). Physiological approach to the study of autochthonous cattle breeds of Northern Italy. Department of Veterinary Medicine (DIMEVET), University of Milan, Milan, Italy. PhD thesis.
De Haan C., Steinfeld H., and Blackburn H. (1997). Livestock & the Environment: Finding a Balance. European Commission Directorate-General for Development, Development Policy Sustainable Development and Natural Resources (Rome, Italy: Food and Agriculture Organization of the United Nations, United States Agency for International Development, and The World Bank), 115.
Del Corvo M., Lazzari B., Capra E., Zavarez L., Milanesi M., Utsunomiya Y. T., et al. (2021). Methylome patterns of cattle adaptation to heat stress. Front. Genet. 12. doi: 10.3389/fgene.2021.633132
Della Maria G. (1936). Ancient stories of Sardinian bovine breed. Riv. Zootec. 13, 47–57. doi: 10.1016/j.theriogenology.2021.08.011
Dubon M. A. C., Pedrosa V. B., Feitosa F. L. B., Costa R. B., de Camargo G. M. F., Silva M. R., et al. (2021). Identification of novel candidate genes for age at first calving in Nellore cows using a SNP chip specifically developed for Bos taurus indicus cattle. Theriogenology 173, 156–162. doi: 10.1016/j.theriogenology.2021.08.011
De Maesschalck R., Jouan-Rimbaud D., and Massart D. L. (2000). The Mahalanobis distance. Chemometrics and Intelligent Laboratory Systems. 50, 1–18. doi: 10.1016/S0169-7439(99)00047-7
Edea Z., Dadi H., Kim S. W., Park J. H., Shin G. H., Dessie T., et al. (2014). Linkage disequilibrium and genomic scan to detect selective loci in cattle populations adapted to different ecological conditions in Ethiopia. Journal of Animal Breeding and Genetics 131, 358–366. doi: 10.1111/jbg.12083
Fabbri M. C., Dadousis C., Tiezzi F., Maltecca C., Lozada-Soto E., Biffani S., et al. (2021). Genetic diversity and population history of eight Italian beef cattle breeds using measures of autozygosity. PLOS ONE 17(10), e0248087. doi: 10.1371/journal.pone.0248087
Fabbri M. C., Dadousis C., Tiezzi F., Maltecca C., and Lozada-Soto E. (2022). Genetic diversity and population history of eight Italian beef cattle breeds using measures of autozygosity. PLOS ONE 17(10), e0248087. doi: 10.1371/journal.pone.0248087
Falchi L., Cesarani A., Mastrangelo S., Senczuk G., Portolano B., Pilla F., et al. (2023). Analysis of runs of homozygosity of cattle living in different climate zones. J. Anim. Sci. 101, skad061. doi: 10.1093/jas/skad061
Falconer D. S. and Mackay T. F. C. (1996). Introduction to quantitative genetics. 4th ed (Essex: Prentice Hall).
FAO. (2024). DAD-IS: Domestic Animal Diversity Information System. Data on Italian goat breeds. Available online at: https://fao.org/dad-is (Accessed October 2024).
Felius M., Beerling M. L., Buchanan D. S., Theunissen B., Koolmees P. A., and Lenstra J. A. (2014). On the history of cattle genetic resources. Diversity 6, 705–750. doi: 10.3390/d6040705
Flori L., Moazami-Goudarzi K., Alary V., Araba A., Boujenane I., Boushaba N., et al. (2019). A genomic map of climate adaptation in Mediterranean cattle breeds. Mol. Ecol. 28, 1009–1029. doi: 10.1111/mec.15004
Fonseca P. A., Suárez-Vega A., and Cánovas A. (2020). Weighted gene correlation network meta-analysis reveals functional candidate genes associated with high- and sub-fertile reproductive performance in beef cattle. Genes 11, 543. doi: 10.3390/genes11050543
Gandini G., Turri F., Rizzi R., Crotta M., Minozzi G., and Pizzi F. (2017). Economic evaluation of genetic improvement in local breeds: The case of the Verzaschese goat. Ital. J. Anim. Sci. 16, 199–207. doi: 10.1080/1828051X.2017.1279034
Gangwar M., Kumar S., Ahmad S. F., Singh A., Agarwal S P. L. A., C S. C., et al. (2025). Exploring genetic variants affecting milk production traits through genome-wide association study in Vrindavani crossbred cattle of India. Trop. Anim. Health Prod. 57, 104. doi: 10.1007/s11250-025-04348-0
Gatellier P., Mercier Y., Juin H., and Renerre M. (2005). Effect of finishing mode (pasture-or mixed-diet) on lipid composition, color stability and lipid oxidation in meat from Charolais cattle. Meat Sci. 69, 175–186. doi: 10.1016/j.meatsci.2004.06.022
Gibson J., Morton N. E., and Collins A. (2006). Extended tracts of homozygosity in outbred human populations. Hum. Mol. Genet. 15, 789–795. doi: 10.1093/hmg/ddi493
Häfliger I. M., Marchionatti E., Stengård M., Wolf-Hofstetter S., Paris J. M., Jacinto J. G., et al. (2021). CNGB3 missense variant causes recessive achromatopsia in Original Braunvieh cattle. Int. J. Mol. Sci. 22, 12440. doi: 10.3390/ijms222212440
Höglund J. K., Guldbrandtsen B., Lund M. S., and Sahana G. (2015). Identification of genomic regions associated with female fertility in Danish Jersey using whole genome sequence data. BMC Genetics 16, 60. doi: 10.1186/s12863-015-0210-3
Holsinger K. E. and Weir B. S. (2009). Genetics in geographically structured populations: defining, estimating and interpreting FST. Nat. Rev. Genet. 10, 639–650. doi: 10.1038/nrg2611
Hui W., Li S., Jiang J., Wang H., Wu G., Li L., et al. (2024). Genetic diversity of Hainan cattle population based on whole genome resequencing and screening of candidate genes related to heat adaptation. Journal of Southern Agriculture 55, 3707–3717.
Kim S. J., Ka S., Ha J. W., Kim J., Yoo D., Kim K., et al. (2017). Cattle genome-wide analysis reveals genetic signatures in trypanotolerant N’Dama. BMC Genomics 18, 371. doi: 10.1186/s12864-017-3742-2
Klar J., Hisatsune C., Baig S. M., Tariq M., Johansson A., Rasool M., et al. (2014). Abolished InsP3R2 function inhibits sweat secretion in both humans and mice. J. Clin. Invest. 124, 4773–4780. doi: 10.1172/JCI70720
Korkuć P., Neumann G. B., Hesse D., Arends D., Reißmann M., Rahmatalla S., et al. (2023). Whole-genome sequencing data reveal new loci affecting milk production in German black pied cattle (DSN). Genes 14, 581. doi: 10.3390/genes14030581
Kumar P., Freeman A. R., Loftus R. T., Gaillard C., Fuller D. Q., and Bradley D. G. (2003). Admixture analysis of South Asian cattle. Heredity 91, 43–50. doi: 10.1038/sj.hdy.6800277
Laodim T., Koonawootrittriron S., Elzo M. A., Suwanasopee T., Jattawa D., Sarakul M., et al. (2023). Genetic factors influencing milk and fat yields in tropically adapted dairy cattle: insights from quantitative trait loci analysis and gene associations. Animal Bioscience 37, 576. doi: 10.5713/ab.23.0246
Laporta J., Rosa G. J., Naya H., and Carriquiry M. (2014). Liver functional genomics in beef cows on grazing systems: novel genes and pathways revealed. Physiological Genomics 46, 138–147. doi: 10.1152/physiolgenomics.00155.2013
Li G., Peñagaricano F., Weigel K. A., Zhang Y., Rosa G., and Khatib H. (2012). Comparative genomics between fly, mouse, and cattle identifies genes associated with sire conception rate. J. Dairy Sci. 95, 6122–6129. doi: 10.3168/jds.2012-5591
Liang H., Chen W., Liu X., Han Y., Khan A., Wang C., et al. (2024). Genetic polymorphisms in genes associated with mammalian semen quality traits: A review. Agriculture 14, 2137. doi: 10.3390/agriculture14122137
Macciotta N. P., Colli L., Cesarani A., Ajmone-Marsan P., Low W. Y., Tearle R., et al. (2021). The distribution of runs of homozygosity in the genome of river and swamp buffaloes reveals a history of adaptation, migration and crossbred events. Genet. Sel. Evol. 53, 1–21. doi: 10.1186/s12711-021-00616-3
Magan J. B., O’Callaghan T. F., Kelly A. L., and McCarthy N. A. (2021). Compositional and functional properties of milk and dairy products derived from cows fed pasture or concentrate-based diets. Compr. Rev. Food Sci. Food Saf. 20, 2769–2800. doi: 10.1111/1541-4337.12751
Manca E., Cesarani A., Gaspa G., Sorbolini S., Macciotta N. P., and Dimauro C. (2020). Use of the multivariate discriminant analysis for genome-wide association studies in cattle. Animals 10, 1300. doi: 10.3390/ani10081300
Mastrangelo S., Ciani E., Ajmone Marsan P., Bagnato A., Battaglini L., Bozzi R., et al. (2018). Conservation status and historical relatedness of Italian cattle breeds. Genet. Sel. Evol. 50, 1–16. doi: 10.1186/s12711-018-0406-x
Mardia K. V., Kent J. T., and Bibby J. M. (2000). Multivariate analysis. London, United Kingdom: Academic Press.
McKay S. D., Schnabel R. D., Murdoch B. M., Matukumalli L. K., Aerts J., Coppieters W., et al. (2007). Whole genome linkage disequilibrium maps in cattle. BMC Genet. 8, 74. doi: 10.1186/1471-2156-8-74
Mohamadipoor Saadatabadi L., Mohammadabadi M., Amiri Ghanatsaman Z., Babenko O., Stavetska R., Kalashnik O., et al. (2021). Signature selection analysis reveals candidate genes associated with production traits in Iranian sheep breeds. BMC Vet. Res. 17, 1–9. doi: 10.1186/s12917-021-03077-4
Muller P., van Bakel H., van de Sluis B., Holstege F., Wijmenga C., and Klomp L. W. (2007). Gene expression profiling of liver cells after copper overload in vivo and in vitro reveals new copper-regulated genes. J. Biol. Inorg. Chem. 12, 495–507. doi: 10.1007/s00775-006-0201-y
Nayak S. S., Panigrahi M., Rajawat D., Ghildiyal K., Sharma A., Parida S., et al. (2023). Comprehensive selection signature analyses in dairy cattle exploiting purebred and crossbred genomic data. Mamm. Genome 34, 615–631. doi: 10.1007/s00335-023-10021-4
Nonić M. and Šijačić-Nikolić M. (2021). Genetic diversity: sources, threats, and conservation. In. Life Land, 421–435. doi: 10.1007/978-3-319-95981-8_53
Ogunbawo A. R., Hidalgo J., Mulim H. A., Carrara E. R., Ventura H. T., Souza N. O., et al. (2025). Applying the algorithm for Proven and young in GWAS reveals high polygenicity for key traits in Nellore cattle. Front. Genet. 16. doi: 10.3389/fgene.2025.1549284
Otto P. I., Guimarães S. E. F., and Varardo L. L. (2018). Genome-wide association studies for tick resistance in Bos taurus × Bos indicus crossbred cattle: A deeper look into this intricate mechanism. J. Dairy Sci. 101, 11020–11032. doi: 10.3168/jds.2017-14223
Pal P. (2023). Genome wide detection of selection signatures and association of SNP with stature and milk production traits in Karan Fries cattle [Doctoral dissertation] (National Dairy Research Institute).
Pal A. and Chakravarty A. K. (2019). “Disease resistance for different livestock species,” in Genetics and Breeding for Disease Resistance of Livestock, vol. p. , 271. doi: 10.1016/B978-0-12-816406-8.00019-X
Peripolli E., Munari D. P., Silva M. V. G. B., Lima A. L. F., Irgang R., and Baldi F. (2017). Runs of homozygosity: current knowledge and applications in livestock. Anim. Genet. 48, 255–271. doi: 10.1111/age.12526
Peripolli E., Stafuzza N. B., Munari D. P., Lima A. L. F., Irgang R., Machado M. A., et al. (2018). Assessment of runs of homozygosity islands and estimates of genomic inbreeding in Gyr (Bos indicus) dairy cattle. BMC Genomics 19, 34. doi: 10.1186/s12864-017-4365-3
Petretto E., Dettori M. L., Pazzola M., Manca F., Amills M., and Vacca G. M. (2022). Mitochondrial DNA diversity of the Sardinian local cattle stock. Sci. Rep. 12, 2486. doi: 10.1038/s41598-022-06420-3
Poulsen N. A., Robinson R. C., Barile D., Larsen L. B., and Buitenhuis B. (2019). A genome-wide association study reveals specific transferases as candidate loci for bovine milk oligosaccharides synthesis. BMC Genomics 20, 404. doi: 10.1186/s12864-019-5786-y
Purcell S., Neale B., Todd-Brown K., Thomas L., Ferreira M. A., Bender D., et al. (2007). PLINK: a tool set for whole-genome association and population-based linkage analyses. The American Journal of Human Genetics 81, 559–575. doi: 10.1086/519795
R Core Team. (2022). R: A language and environment for statistical computing. R Foundation for Statistical Computing, Vienna, Austria. Available online at: https://www.R-project.org/ (Accessed July 31, 749 2025).
Regione Sardegna (2007). Programma di sviluppo rurale 2007–2013 REG. (CE) N. 1698/2005. Available online at: https://www.regione.sardegna.it/documenti/1_26_20090930155030.pdf (Accessed May 15, 2024).
Rencher A. C. and Scott D. T. (1990). Assessing the contribution of individual variables following 754 rejection of a multivariate hypothesis. Communications in Statistics – Simulation and Computation. 19, 535–553. doi: 10.1080/03610919008812874
Signer-Hasler H., Burren A., Neuditschko M., Frischknecht M., Garrick D., Stricker C., et al. (2017). Population structure and genomic inbreeding in nine Swiss dairy cattle populations. Genetics Selection Evolution 49, 83. doi: 10.1186/s12711-017-0358-6
Song X., Yao Z., Zhang Z., Lyu S., Chen N., Qi X., et al. (2024). Whole-genome sequencing reveals genomic diversity and selection signatures in Xia’nan cattle. BMC Genomics 25, 559. doi: 10.1186/s12864-024-10463-3
Stanton C. A. T. H. E. R. I. N. E., Mills S., Ryan A., Di Gioia D., and Ross R. P. (2021). Influence of pasture feeding on milk and meat products in terms of human health and product quality. Ir. J. Agric. Food Res. 59, 292–302. doi: 10.15212/ijafr-2020-0104
Surati U., Niranjan S. K., Pundir R. K., Koul Y., Vohra V., Gandham R. K., et al. (2024). Genome-wide comparative analyses highlight selection signatures underlying saline adaptation in Chilika buffalo. Physiol. Genomics 56, 609–620. doi: 10.1152/physiolgenomics.00028.2024
Sved J. A. (1971). Linkage disequilibrium and homozygosity of chromosome segments in finite populations. Theor. Popul Biol. 2, 125–141. doi: 10.1016/0040-5809(71)90011-6
Szmatoła T., Gurgul A., Jasielczuk I., Ząbek T., Ropka-Molik K., Litwińczuk Z., et al. (2019). A comprehensive analysis of runs of homozygosity of eleven cattle breeds representing different production types. Animals 9, 1024. doi: 10.3390/ani9121024
Tavares L. P., Negreiros-Lima G. L., Lima K. M., Silva P. M. R. E., Pinho V., Teixeira M. M., et al. (2020). Blame the signaling: role of cAMP for the resolution of inflammation. Pharmacol. Res. 159, 105030. doi: 10.1016/j.phrs.2020.105030
Taye M. (2018). Identification of adaptive signatures in the cattle genome [Doctoral dissertation]. South Korea.
Wang Y., Wang Z., Liu W., Xie S., Ren X., Yan L., et al. (2024). Genetic background of blood β-hydroxybutyrate acid concentrations in early-lactating Holstein dairy cows based on genome-wide association analyses. Genes 15, 412. doi: 10.3390/genes15040412
Taye M., Lee W., Jeon S., Yoon J., Dessie T., Hanotte O., et al. (2017). Exploring evidence of positive selection signatures in cattle breeds selected for different traits. Mamm. Genome 28, 528–541. doi: 10.1007/s00335-017-9715-6
Wang J., Shen N., Zhao K., Liao J., Jiang G., Xiao J., et al. (2025). Revealing study and breeding implications for production traits and tail characteristics in Simmental cattle by GWAS. Front. Genet. 16. doi: 10.3389/fgene.2025.1491816
Wickham H. (2016). Programming with ggplot2. In: ggplot2: Elegant graphics for data analysis. Cham, Switzerland: Springer International Publishing, 241–253.
Weir B. S. and Cockerham C. C. (1984). Estimating F-statistics for the analysis of population structure. Evolution 38(6), 1358–1370. doi: 10.2307/2408641
Wu H., Li S. Y., Jiang J. M., Wang H., Wu G. S., Li L. B., et al. (2024). Genetic diversity of Hainan cattle population based on whole genome resequencing and screening of candidate genes related to heat adaptation. J. South. Agric. 55, 3707–3717. doi: 10.3969/j.issn.2095-1191.2024.12.020
Yang Y., Chang C., Baiyin B., Liu Z., Guo L., Zhou L., et al. (2022). Blood transcriptome analysis of beef cow with different parity revealed candidate genes and gene networks regulating the postpartum diseases. Genes 13, 1671. doi: 10.3390/genes13091671
Yang J., Lee S. H., Goddard M. E., and Visscher P. M. (2011). GCTA: a tool for genome-wide complex trait analysis. Am. J. Hum. Genet. 88, 76–82. doi: 10.1016/j.ajhg.2010.11.011
Keywords: autochthonous cattle breeds, adaptive genomic signatures, runs of homozygosity(ROH), Wright’s fixation index (FST), stepwise discriminant analyses (SDA), canonical discriminant analyses (CDA)
Citation: Milia PE, Falchi L, Cesarani A, Macciotta NPP and Dimauro C (2025) Tracing shared genomic regions among local cattle breeds from Sardinia. Front. Anim. Sci. 6:1685894. doi: 10.3389/fanim.2025.1685894
Received: 14 August 2025; Accepted: 23 October 2025;
Published: 21 November 2025.
Edited by:
Luca Fontanesi, University of Bologna, ItalyReviewed by:
Ottmar Distl, University of Veterinary Medicine Hannover, GermanyJulia Metzger, University of Veterinary Medicine Hannover, Germany
Copyright © 2025 Milia, Falchi, Cesarani, Macciotta and Dimauro. This is an open-access article distributed under the terms of the Creative Commons Attribution License (CC BY). The use, distribution or reproduction in other forums is permitted, provided the original author(s) and the copyright owner(s) are credited and that the original publication in this journal is cited, in accordance with accepted academic practice. No use, distribution or reproduction is permitted which does not comply with these terms.
*Correspondence: Alberto Cesarani, YWNlc2FyYW5pQHVuaXNzLml0
†ORCID: Paola Erminia Milia, orcid.org/0009-0005-5248-3328
Laura Falchi, orcid.org/0000-0001-5950-8456
Alberto Cesarani, orcid.org/0000-0003-4637-8669
Nicolo Pietro Paolo Macciotta, orcid.org/0000-0001-5504-9459
Corrado Dimauro, orcid.org/0000-0002-6588-923X